Explainer
This page explains three core tools I use in my weekly analysis and how I interpret them.
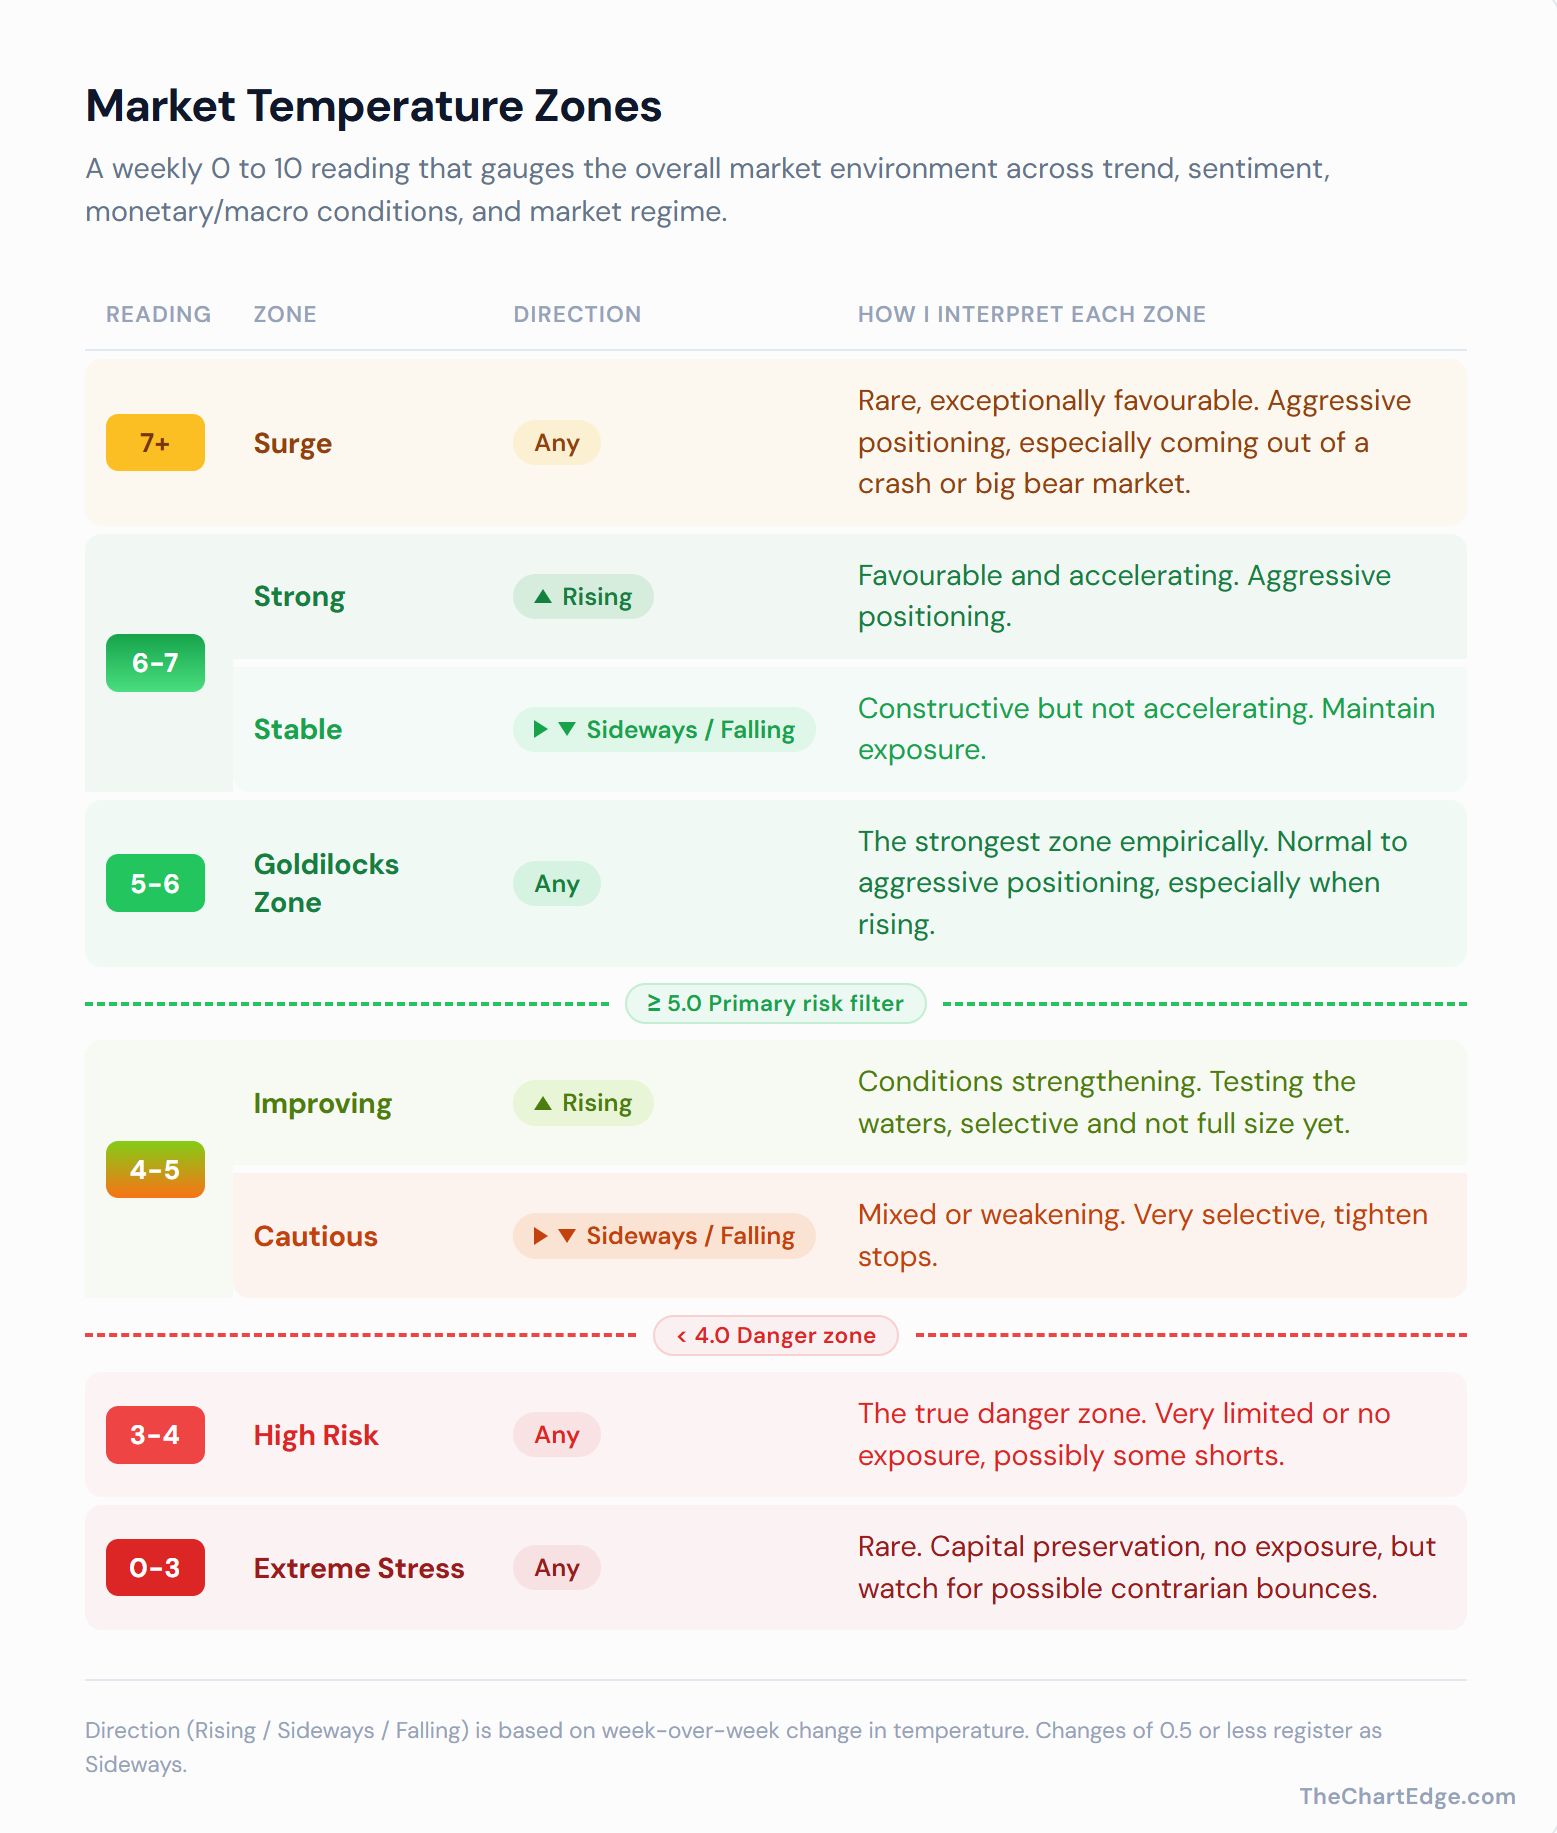
Market Temperature Zones
The Market Temperature Model is a weekly gauge of the overall market environment, scored from 0 to 10 across four pillars: trend, sentiment, monetary/macro conditions, and market regime. It tells me whether conditions favour being aggressive, selective, or defensive.
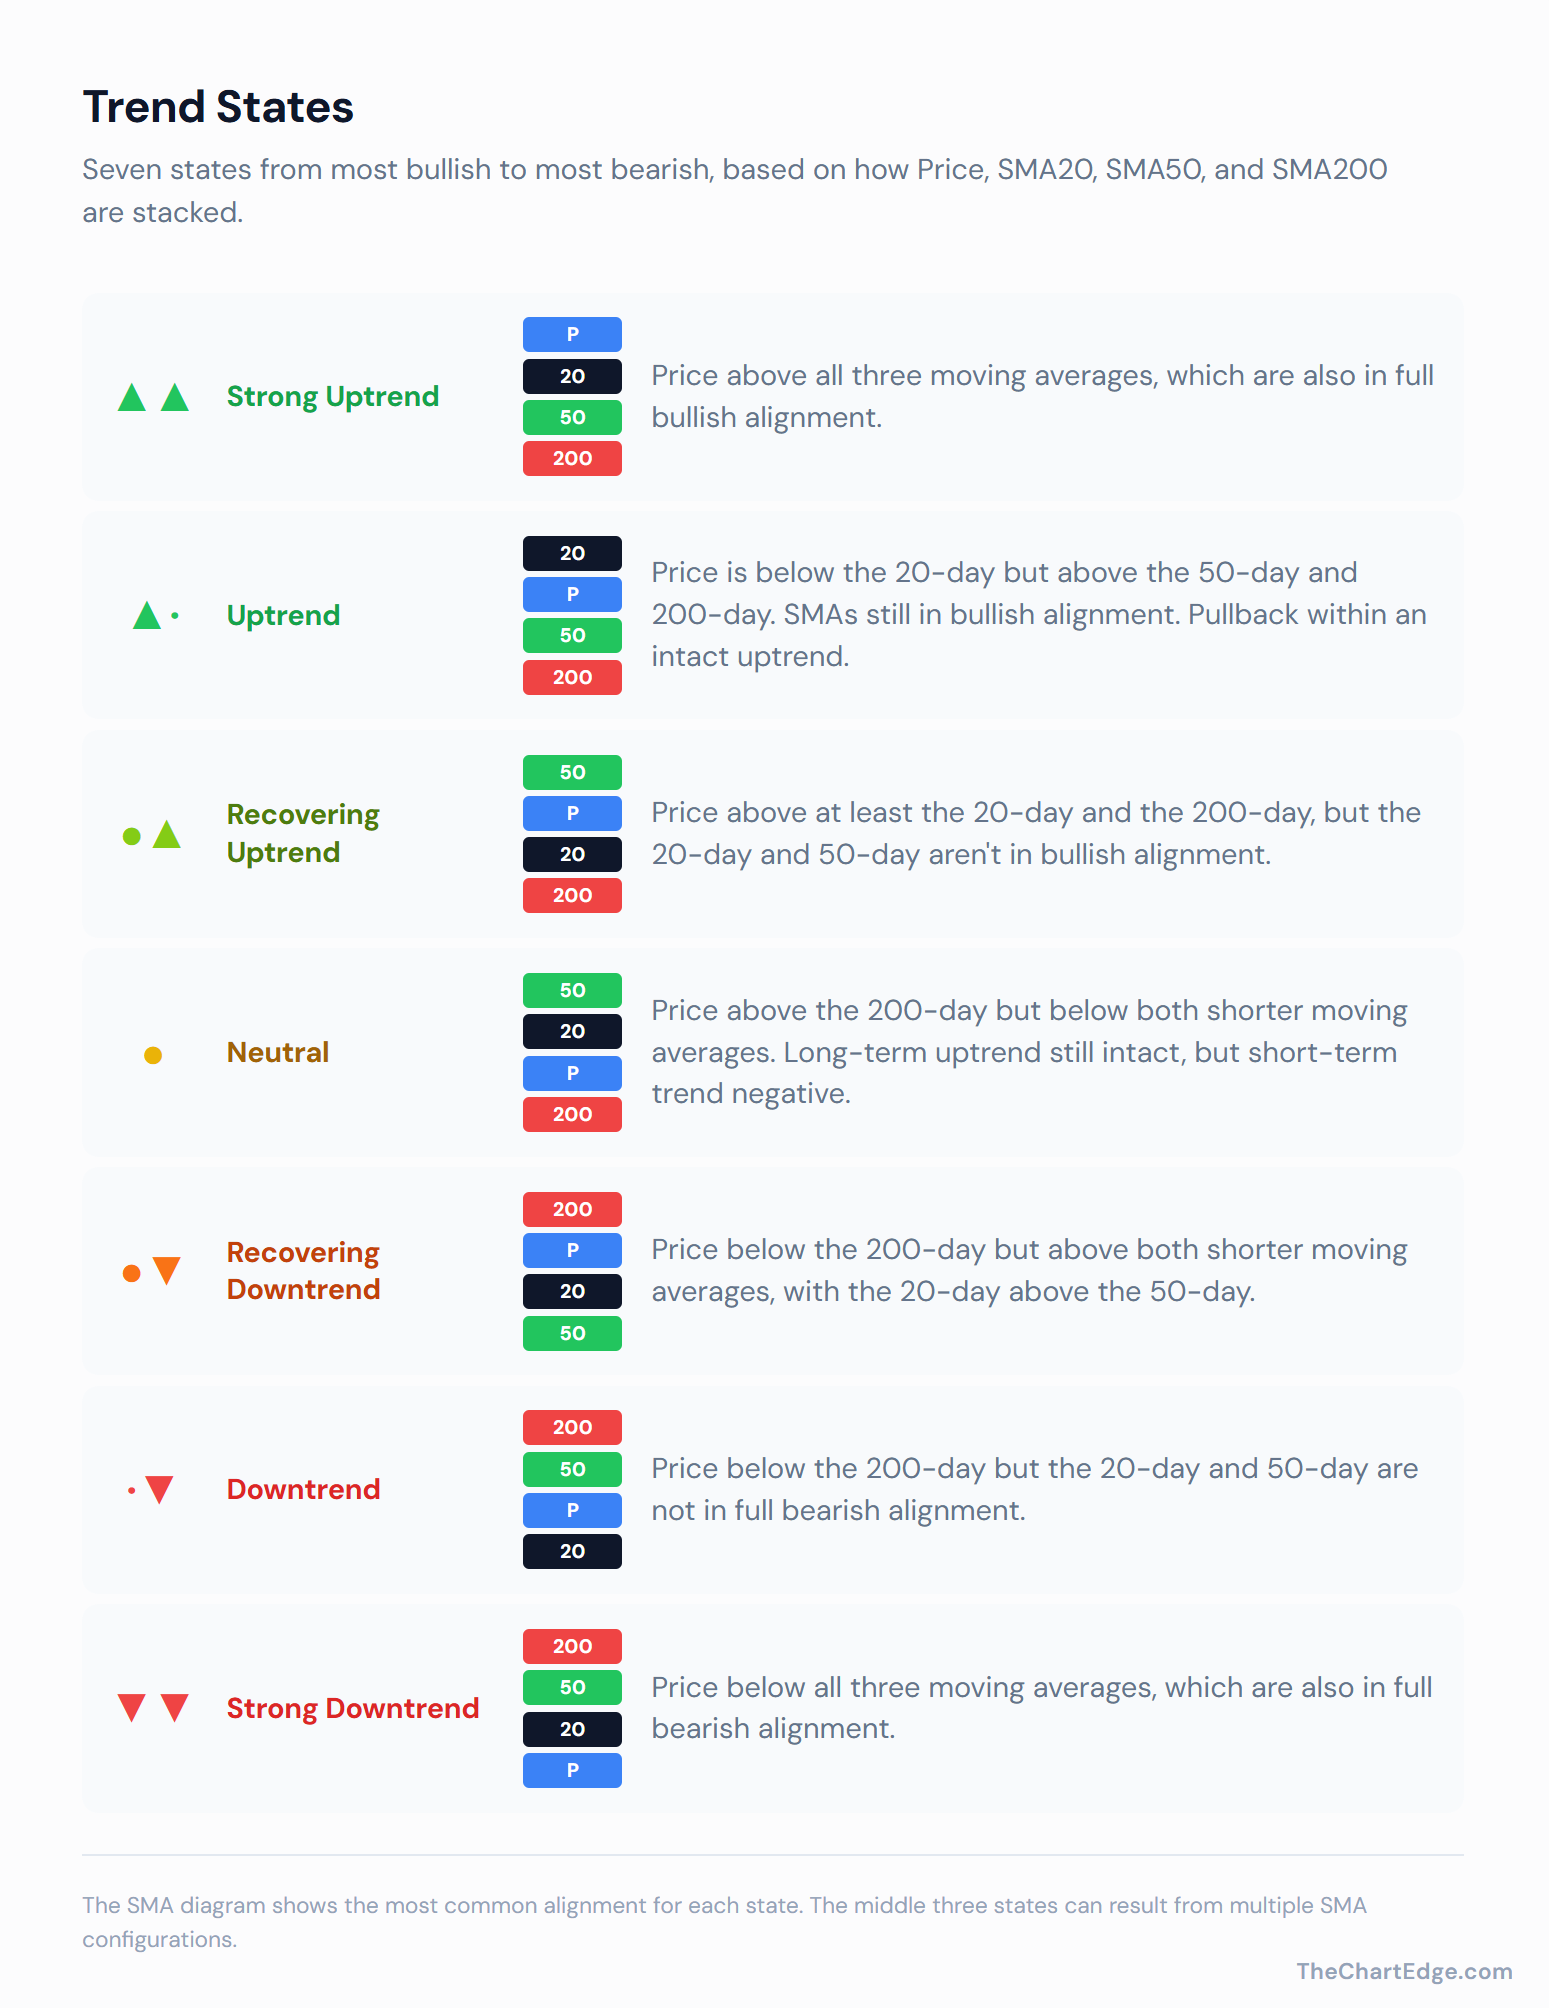
Trend States
One of the inputs to the temperature model is the trend state of SPY and QQQ. I also use the trend states to rank and analyse ETFs and individual stocks. Here’s how the 7-state system works.
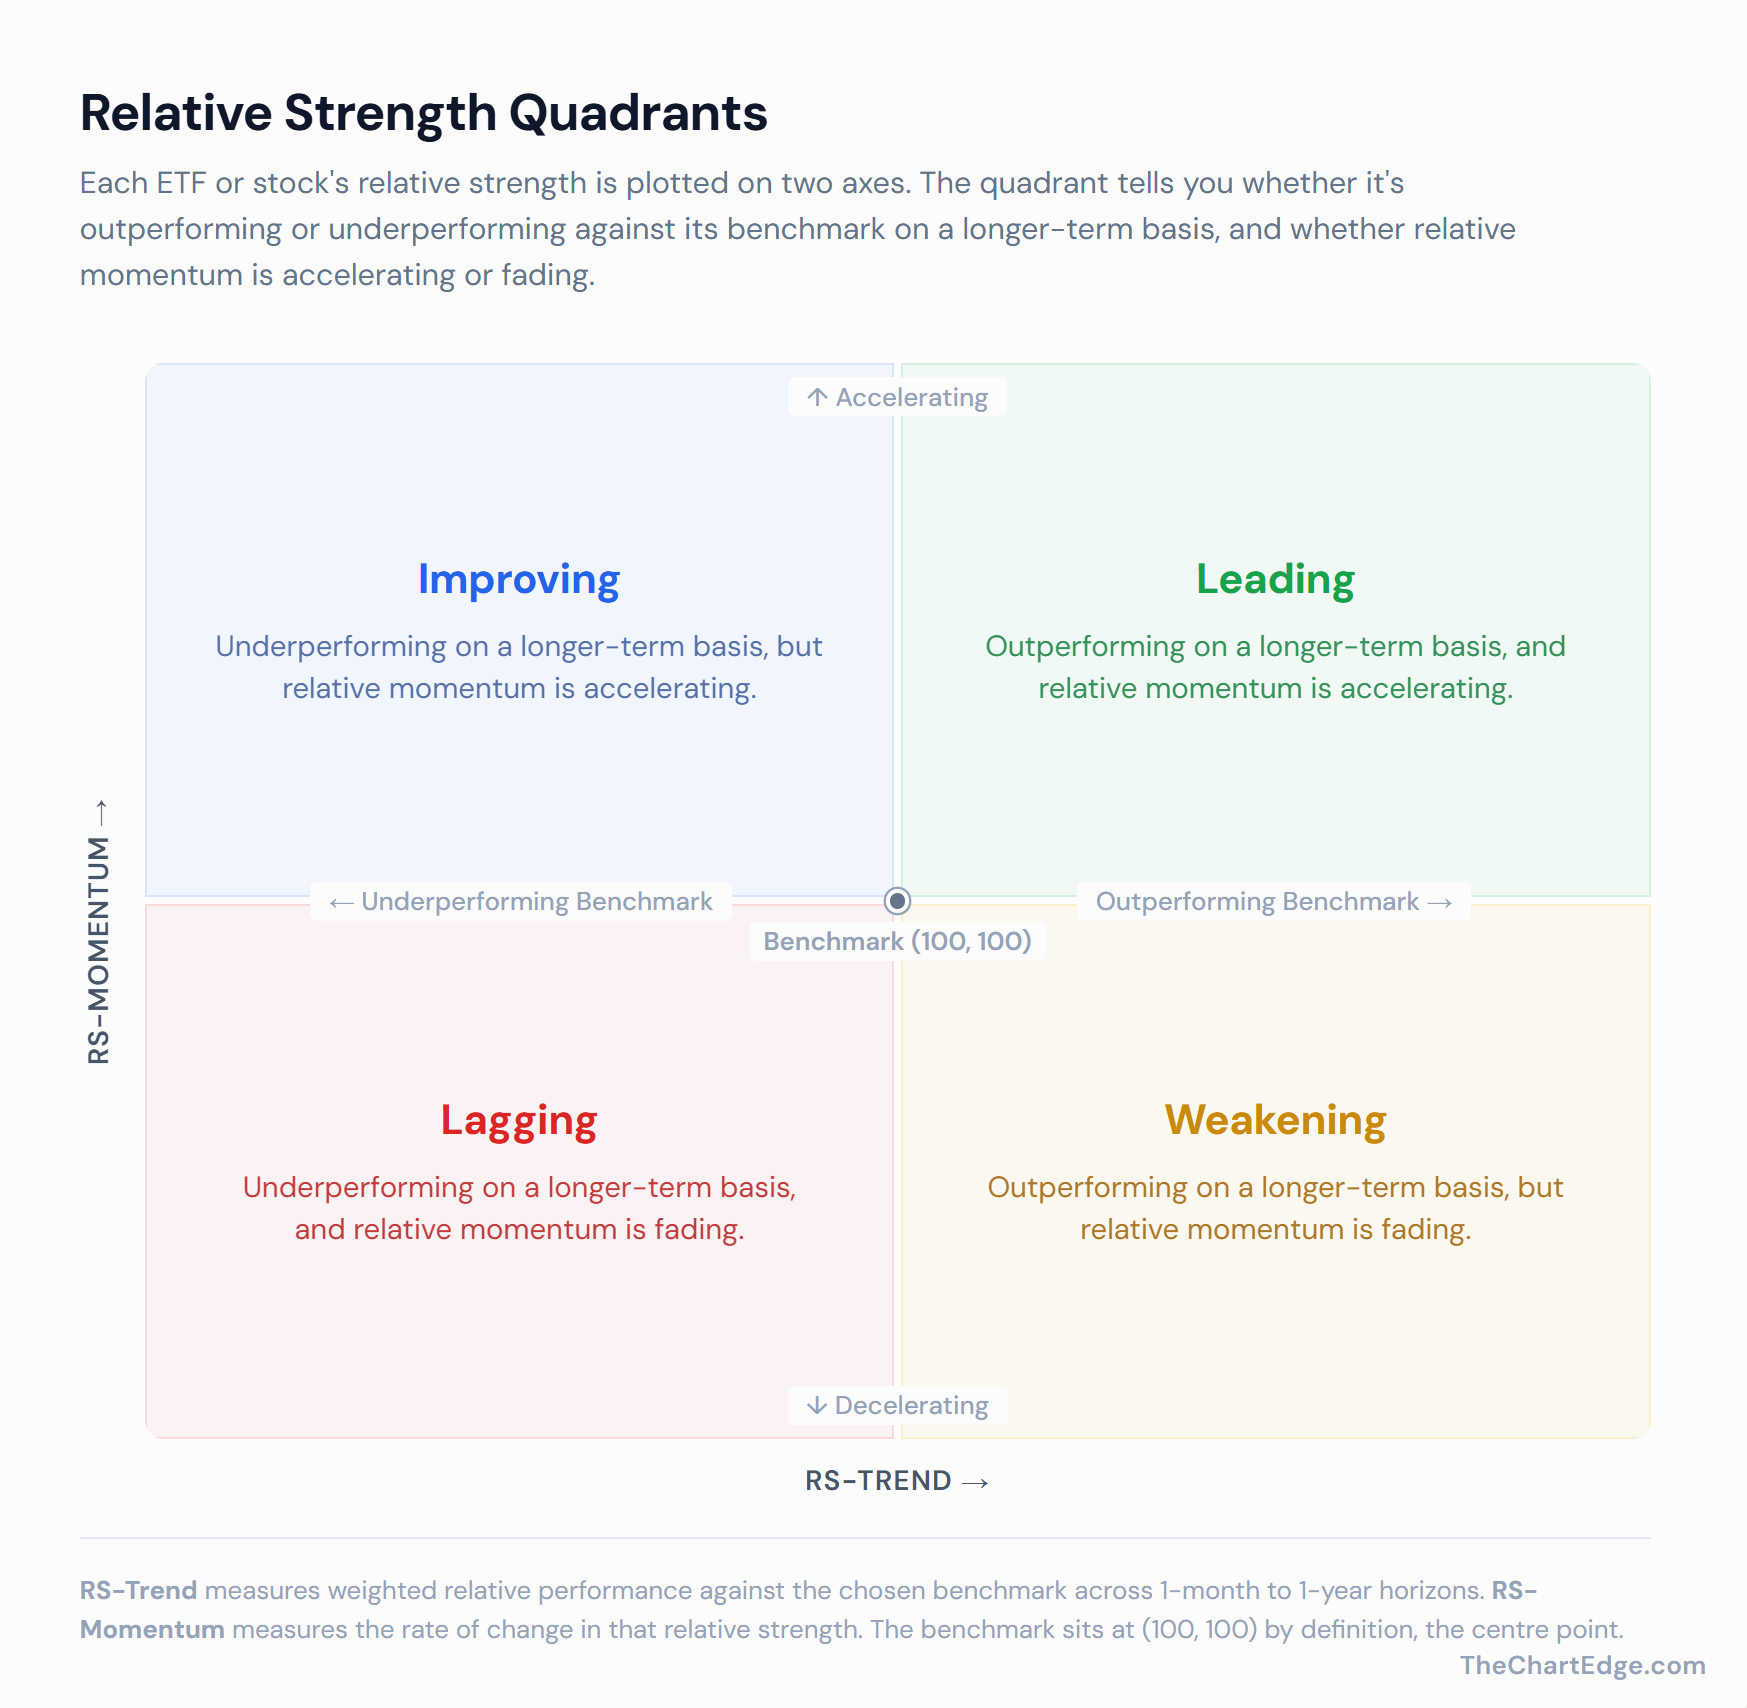
Relative Strength (RS) Quadrants
The RS map plots every ETF in the universe against SPY, and in the stock drill-downs, the individual stocks against the ETF. The quadrant tells you where each sector, theme or stock sits relative to its benchmark.