

Under The Hood
Some setups hiding in plain sight

Yesterday’s post covered the Market Temperature and the relative strength at the ETF-level, showing relative performance of sectors and themes relative to the S&P 500 (SPY). Today I will drill down one level deeper into the individual stocks inside some of those ETFs.
There’s a visual explainer here covering the relative strength quadrants and trend states so you can understand the terminology I use in this analysis.
I also screened across the drill-down data in this note for names in the top two trend states (Strong Uptrend or Uptrend), near their 52-week highs, and not too extended from their 20-day SMA relative to their own volatility (as of Friday April 24th closing prices). I use each stock’s ATR to normalise. I then ran through all the charts to eyeball the better potential setups. You can grab the watchlist here if you want. Be mindful some names are still to report earnings. I highlight some potentially actionable names below.
The AI Stack - one week later
Last week’s AI Stack piece benchmarked 81 names against SMH and found interconnect, specialty foundries, the miner pivot, and systems integration leading. A week later, many of those names have dropped from Leading to Weakening.
However, context matters here. SMH gained over 9% last week (week ending April 24). When the benchmark moves that much, not all names keep pace. Ciena, Coherent, Fabrinet, Vertiv, Celestica, Jabil - all dropped to Weakening. But all of them still have RS trend readings well above 100 and Strong Uptrend trend states. They didn’t weaken. They just didn’t match a 9% benchmark week.
“Weakening” in this context means the outperformance stopped accelerating, not that something is wrong.
The names that outperformed through the 9% SMH week did so with extreme moves. ARM gained over 40% and now has the highest momentum reading in the entire universe. AMD up nearly 25%. Intel up over 20%. Texas Instruments crossed into Leading, as did Astera Labs (ALAB).
NVIDIA went the other way - moving from Improving to Lagging, despite gaining 3.27% on the week. Broadcom also slipped to Lagging, with its momentum reading at 99.99. Both had decent weeks in absolute terms but couldn’t keep pace with SMH’s move.
The miner-to-AI pivot names all lost ground. WULF, HUT, IREN, and APLD dropped from Leading to Weakening - same story as the interconnect names, still outperforming on trend but couldn’t match the benchmark move. CORZ was already the weakest of the group last week in the Improving quadrant and has now slipped to Lagging.
GE Vernova Inc. (GEV) Chart
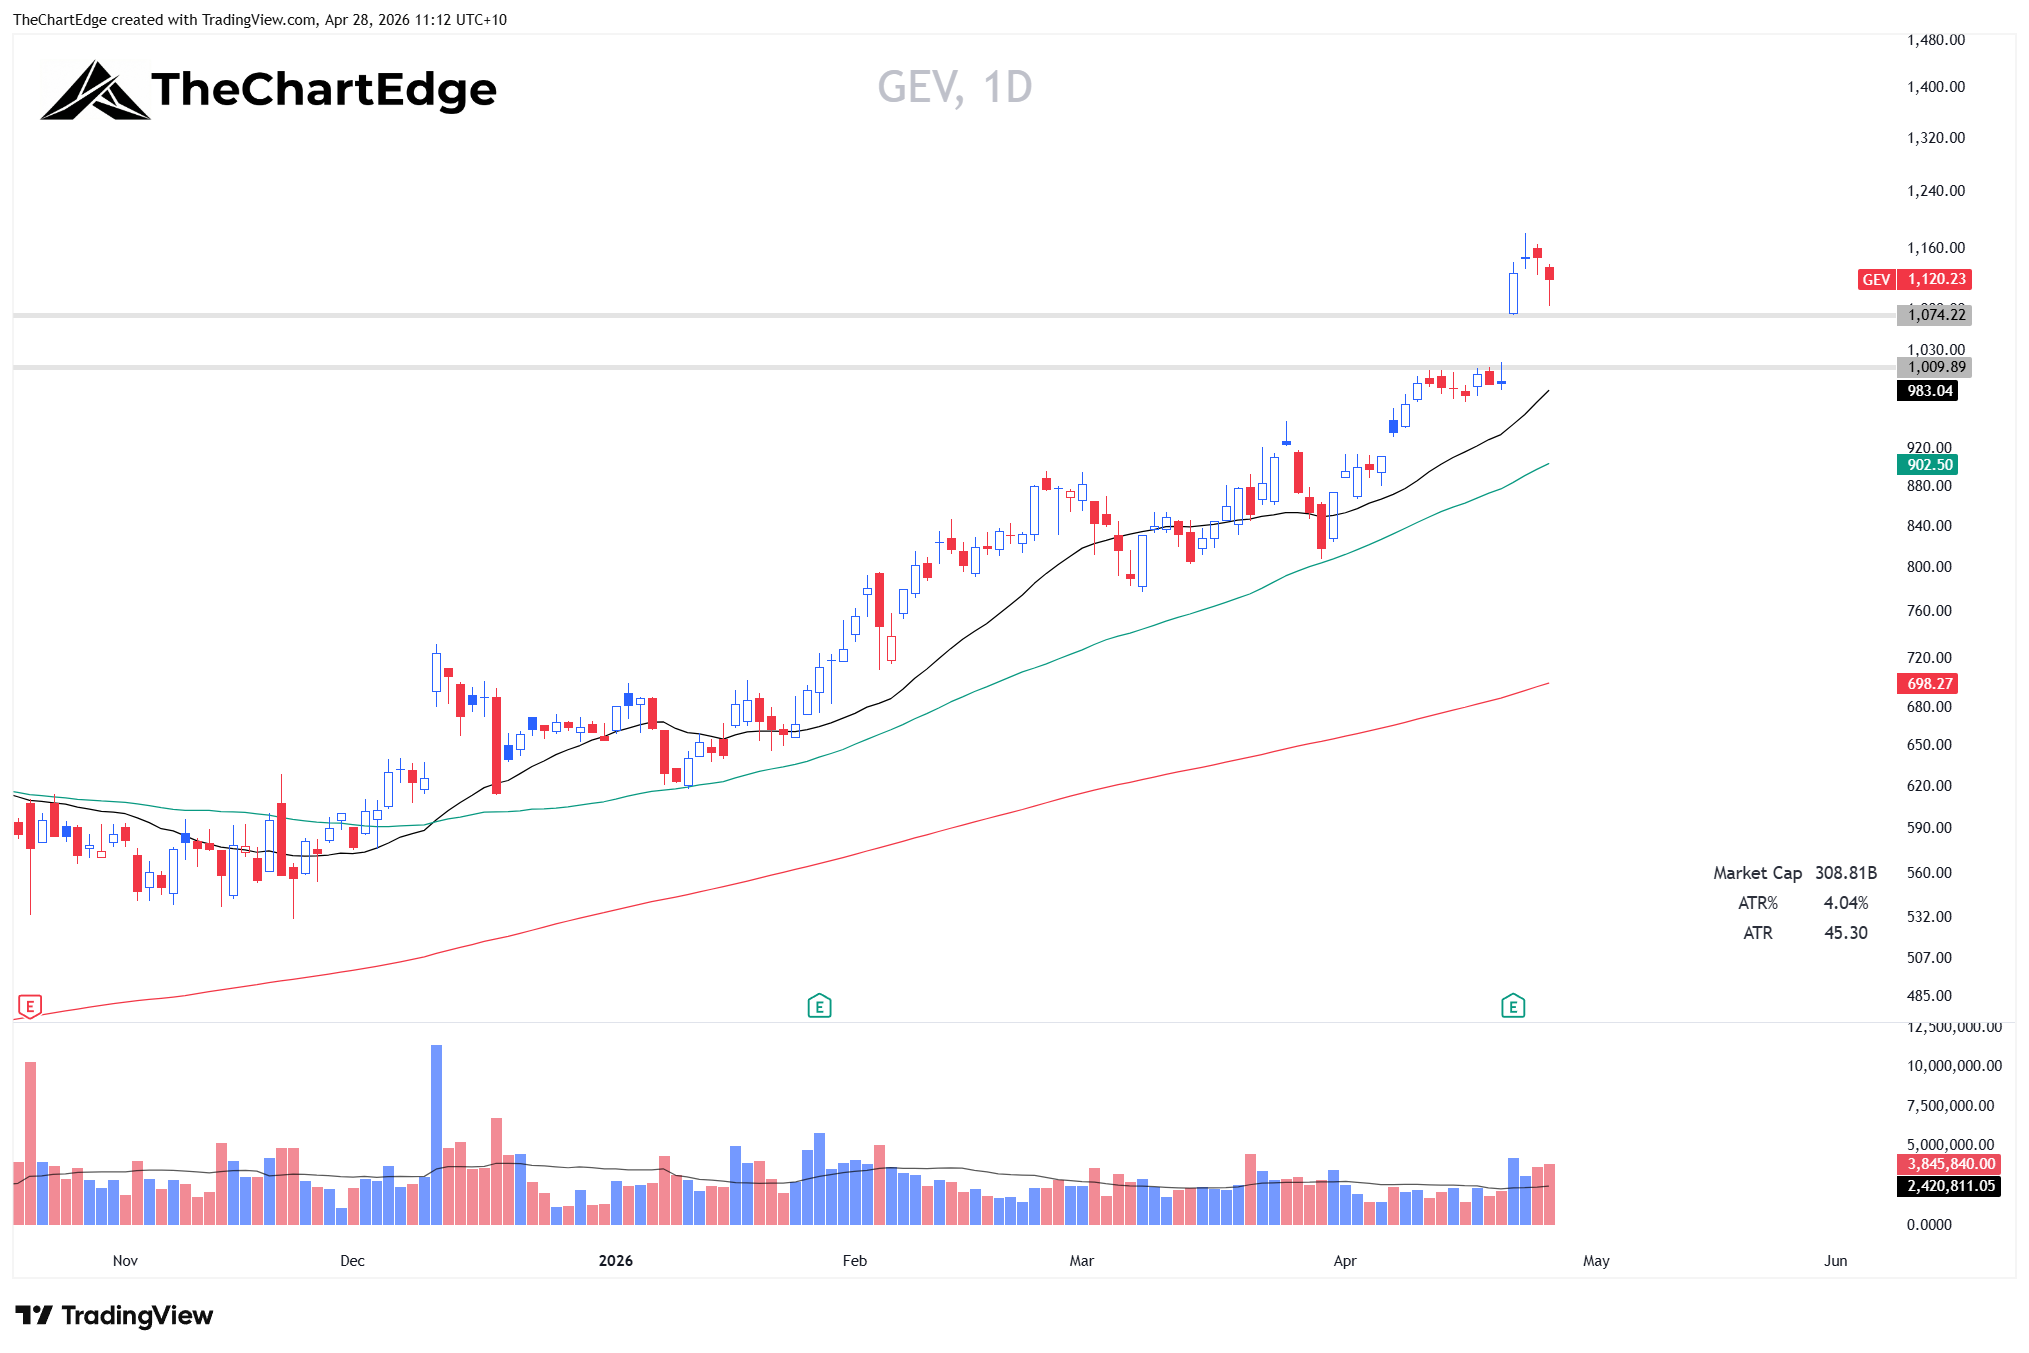
Leading, Strong Uptrend, gapped up on earnings Wednesday then traded tight Thu/Fri. I am watching to see if it can hold Wednesday’s low. If it does, that’s a sign of real strength. Even if it fills part or all the gap, but holds the 20 SMA, it could provide a new entry opportunity.
Lam Research Corporation (LRCX) Chart
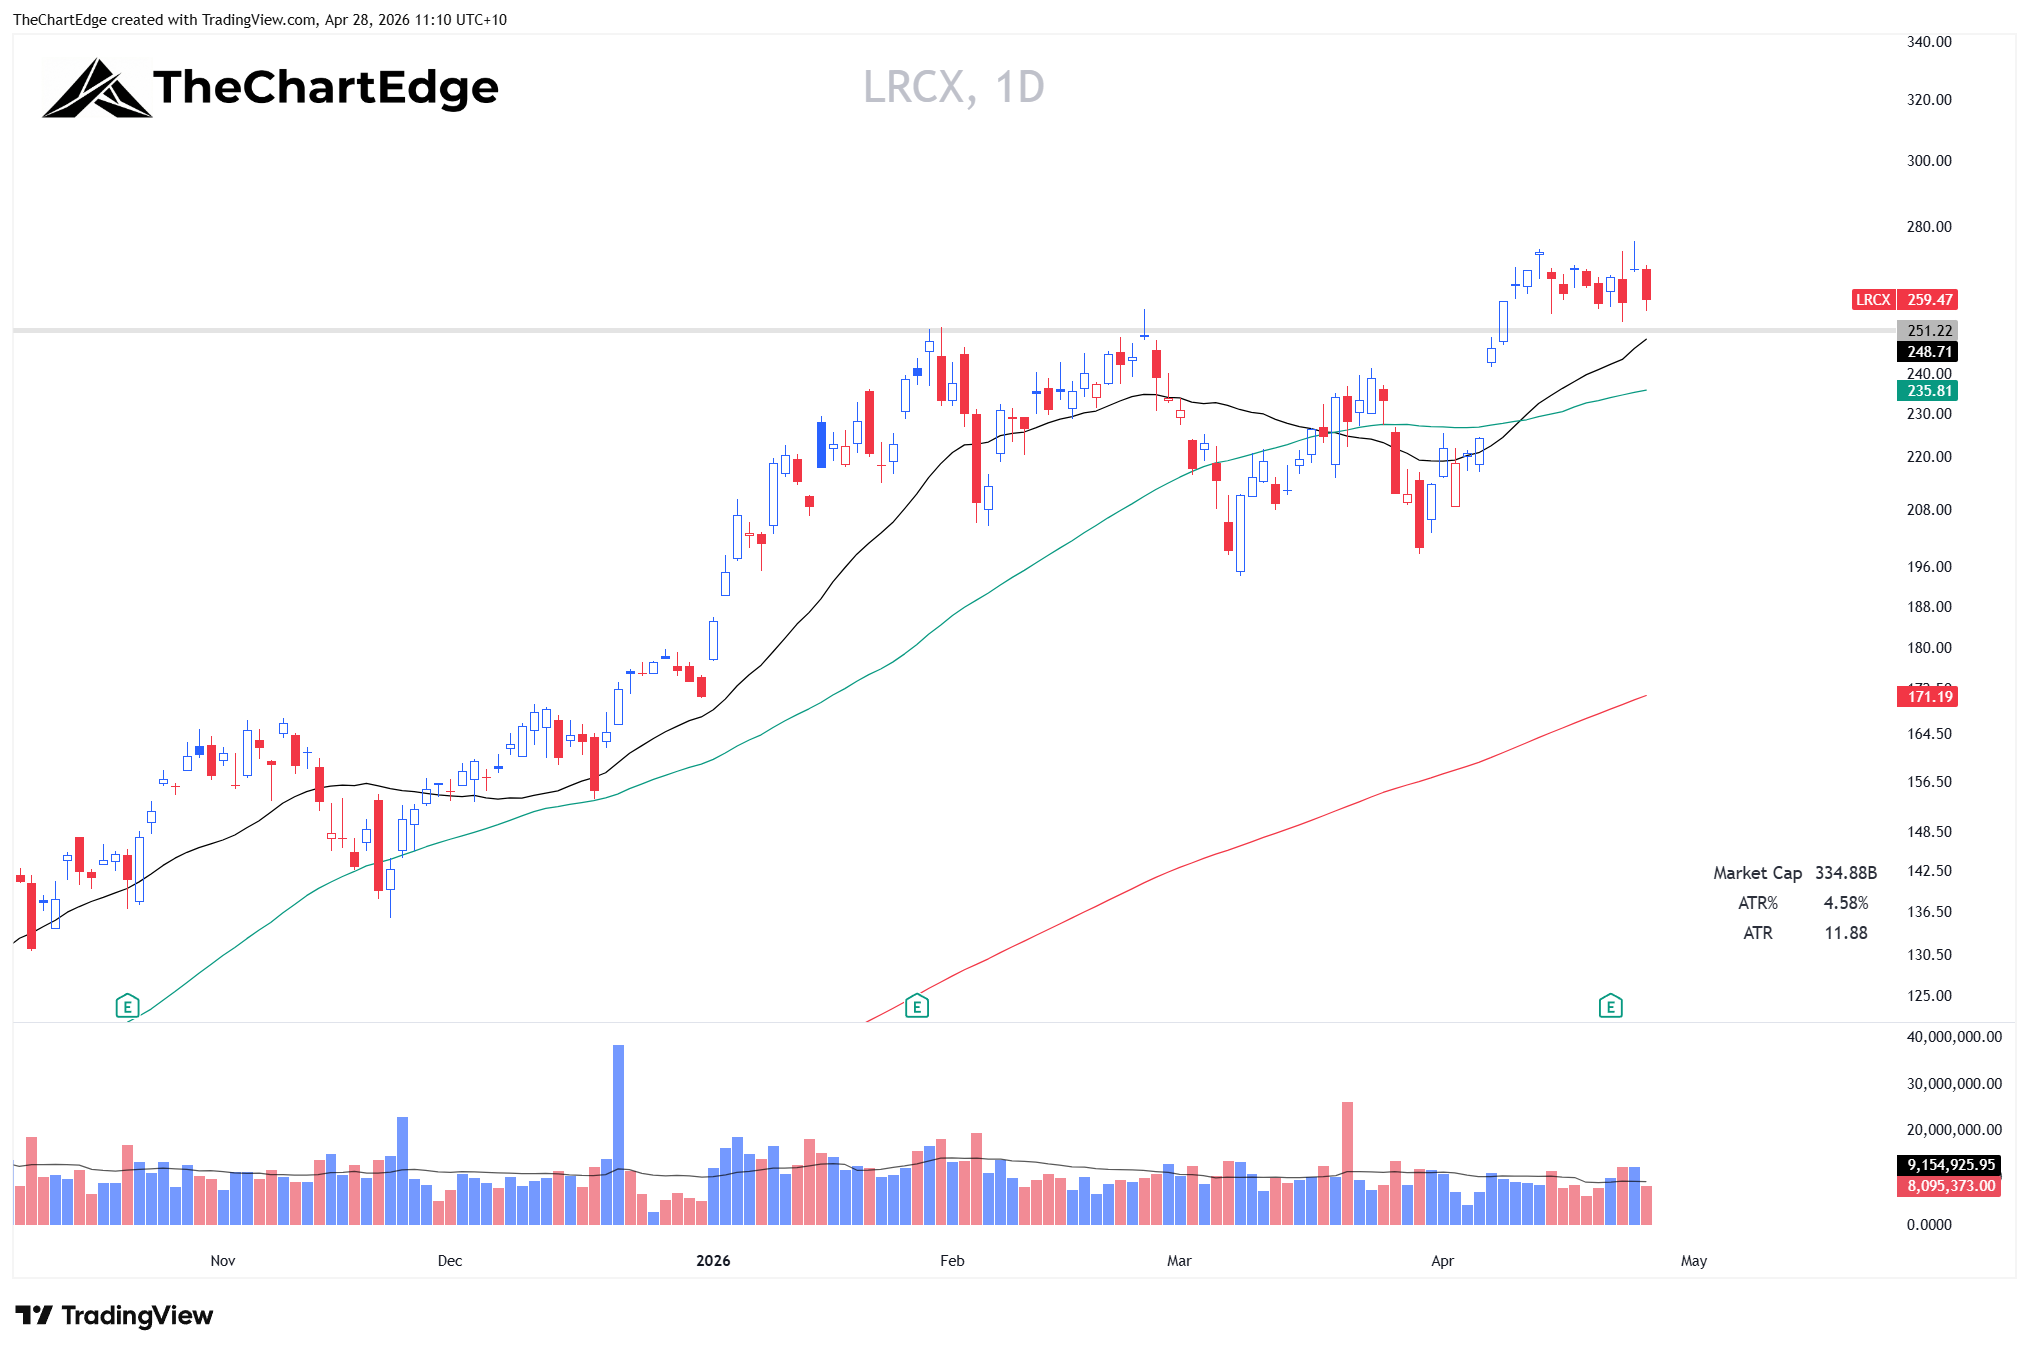
Weakening, Strong Uptrend, Gained 0.07% last week - basically flat while the rest of semis surged. Tight consolidation near all-time highs.
Software remains almost entirely absent. Every enterprise SaaS name is Lagging versus SMH. ServiceNow down 41% YTD. Workday down over 44%. HubSpot down 44%. Intuit down 40%. Salesforce down nearly 33%.
Software - the benchmark illusion
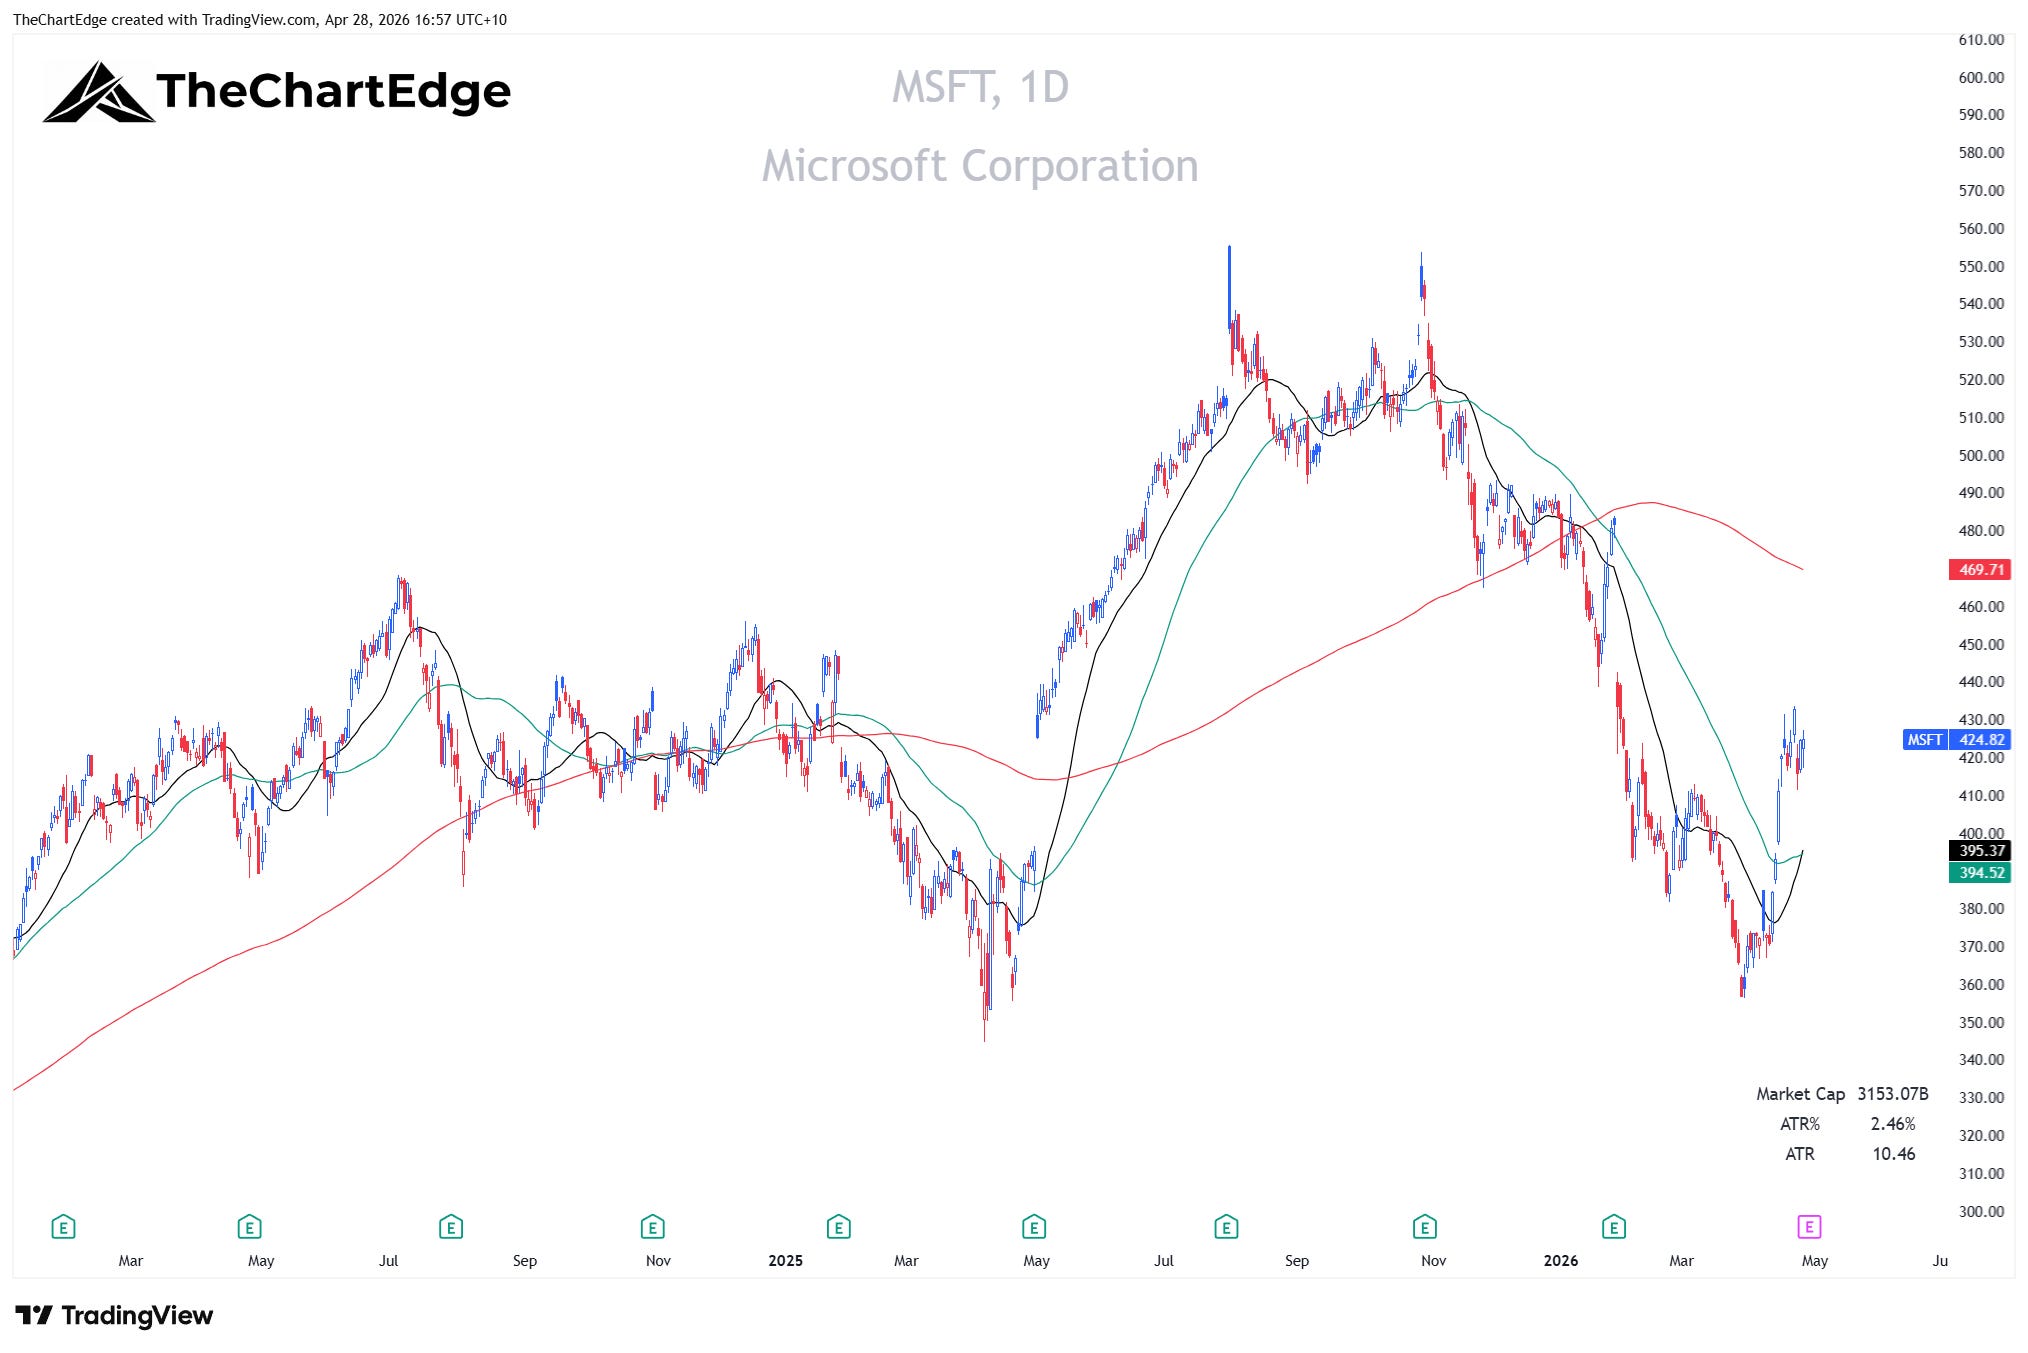
Staying with software for a moment - Microsoft is Leading within IGV. Sounds good until you check the other benchmarks - MSFT is Lagging versus XLK and SMH.
Even among the actual ‘software leaders’, Synopsys (SNPS) and Cadence (CDNS) are EDA companies - they sell the design tools chipmakers use. They’re classified as software in IGV, but their business is entirely tied to the semiconductor cycle.
Crypto miner names like CORZ are also showing up as Leading within IGV. Classified as software, behaving like something else entirely.
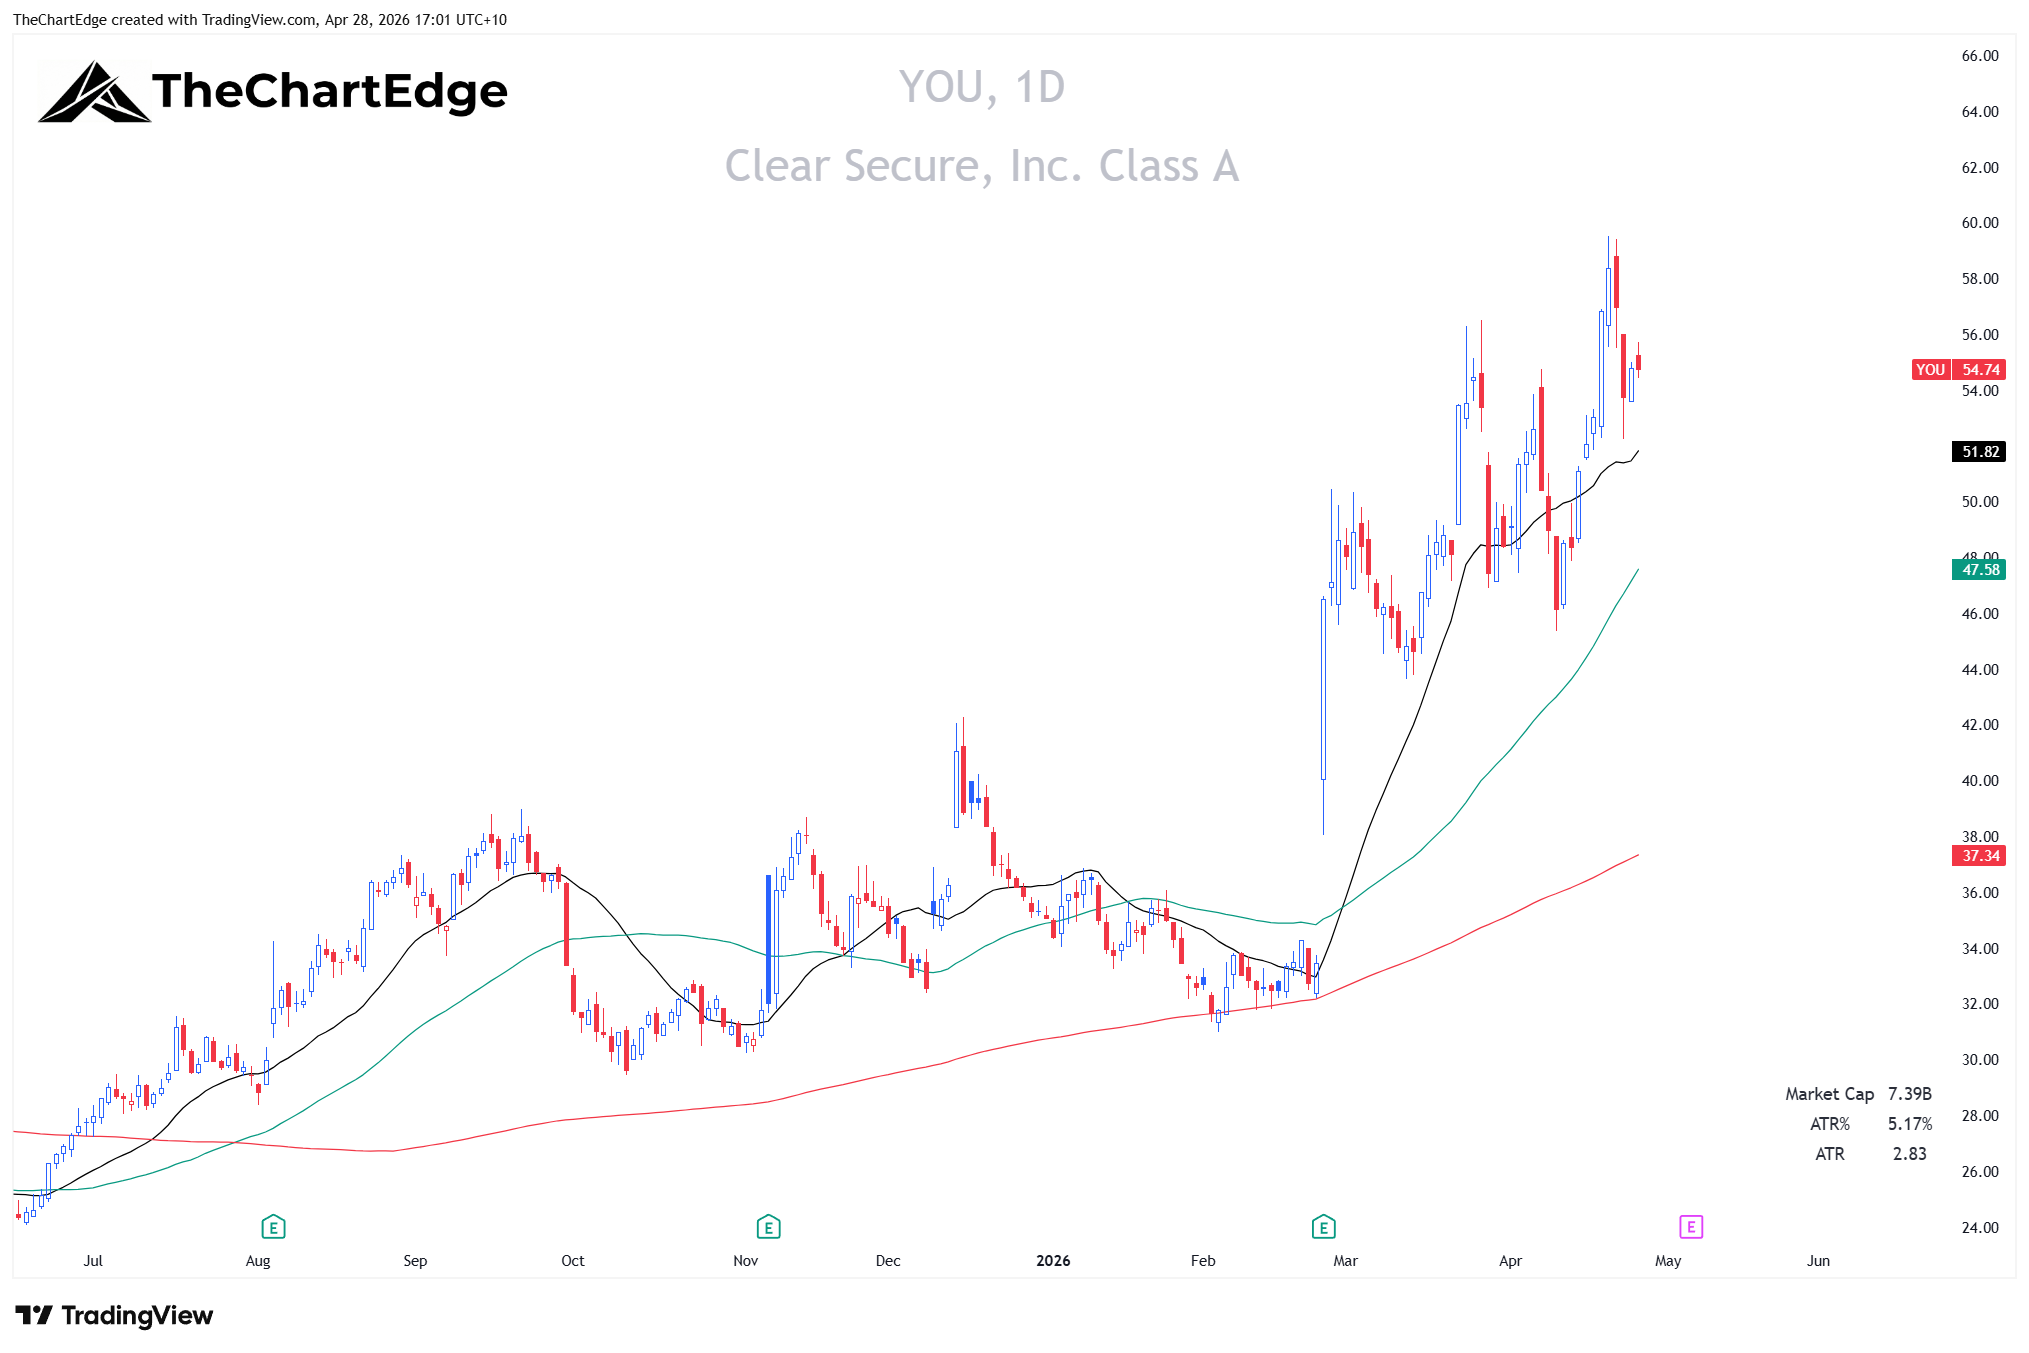
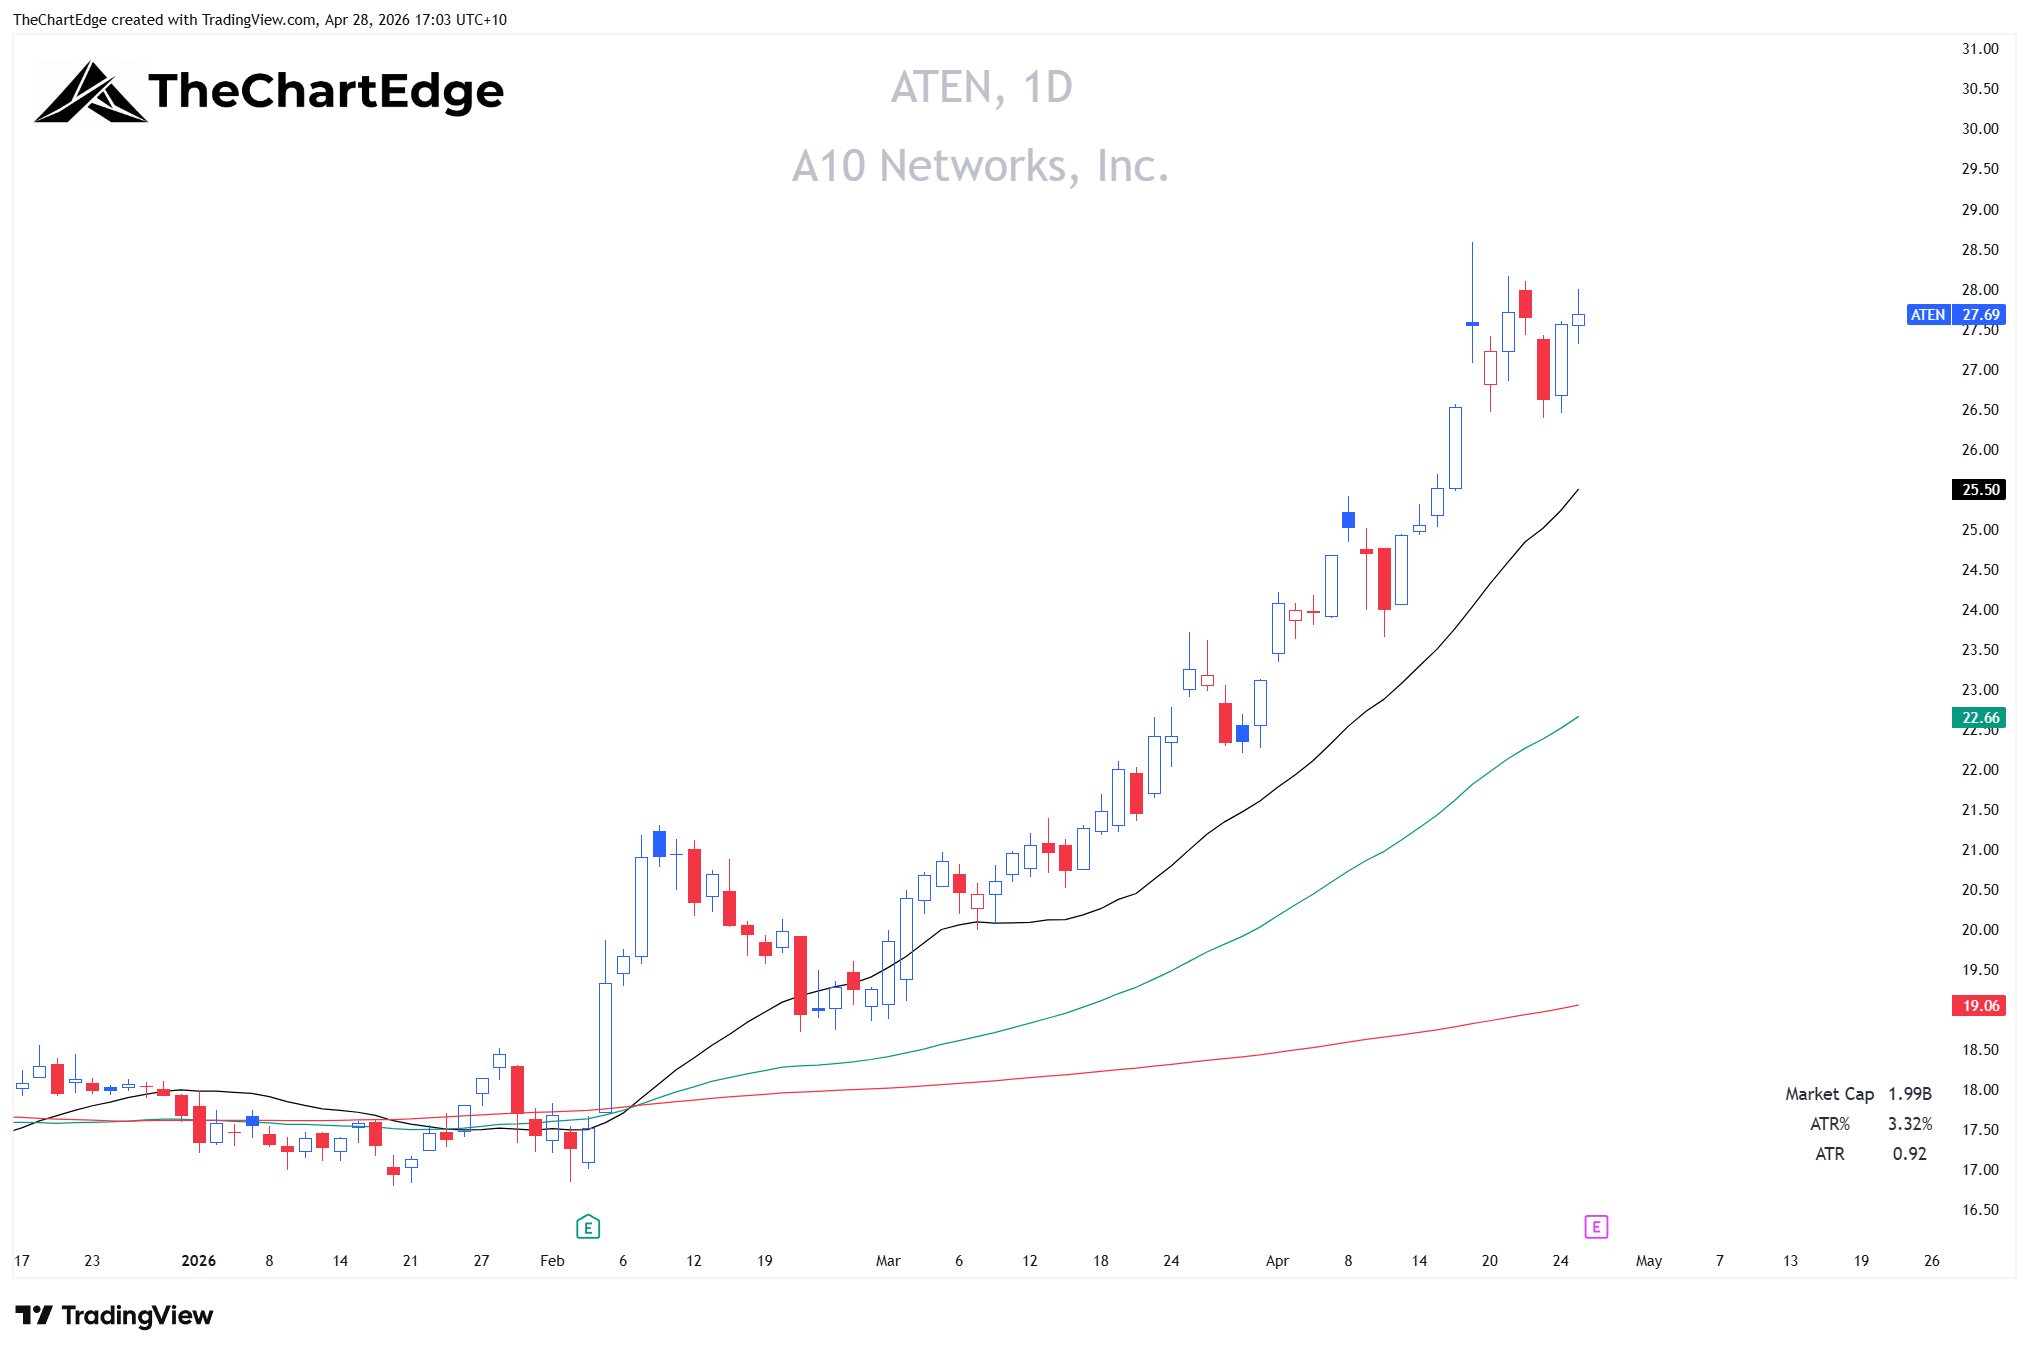
Two names from the IGV universe that came up in my screen were Clear Secure (YOU) and A10 Networks (ATEN) - both Leading within IGV with Strong Uptrend trend states. YOU runs the CLEAR biometric identity platform at US airports and has been expanding into B2B identity services. ATEN is a cybersecurity and application delivery company expanding into AI workload security. Both have earnings coming up though.
Clear Secure (YOU) Chart
A10 Networks (ATEN) Chart
XLF - the most misleading ETF
XLF is Lagging with a Recovering Downtrend trend state. Down almost 2% last week, down over 6% YTD. At the ETF level, financials look like an avoid.
But the drill-down reveals something interesting.
The banks are dominating. State Street (STT), Citi (C), BNY Mellon (BK), Northern Trust (NTRS), Morgan Stanley (MS), and Goldman Sachs (GS) - all Leading with Strong Uptrend trend states. JPMorgan is also Leading in a Recovering Uptrend.
Morgan Stanley (MS) Chart
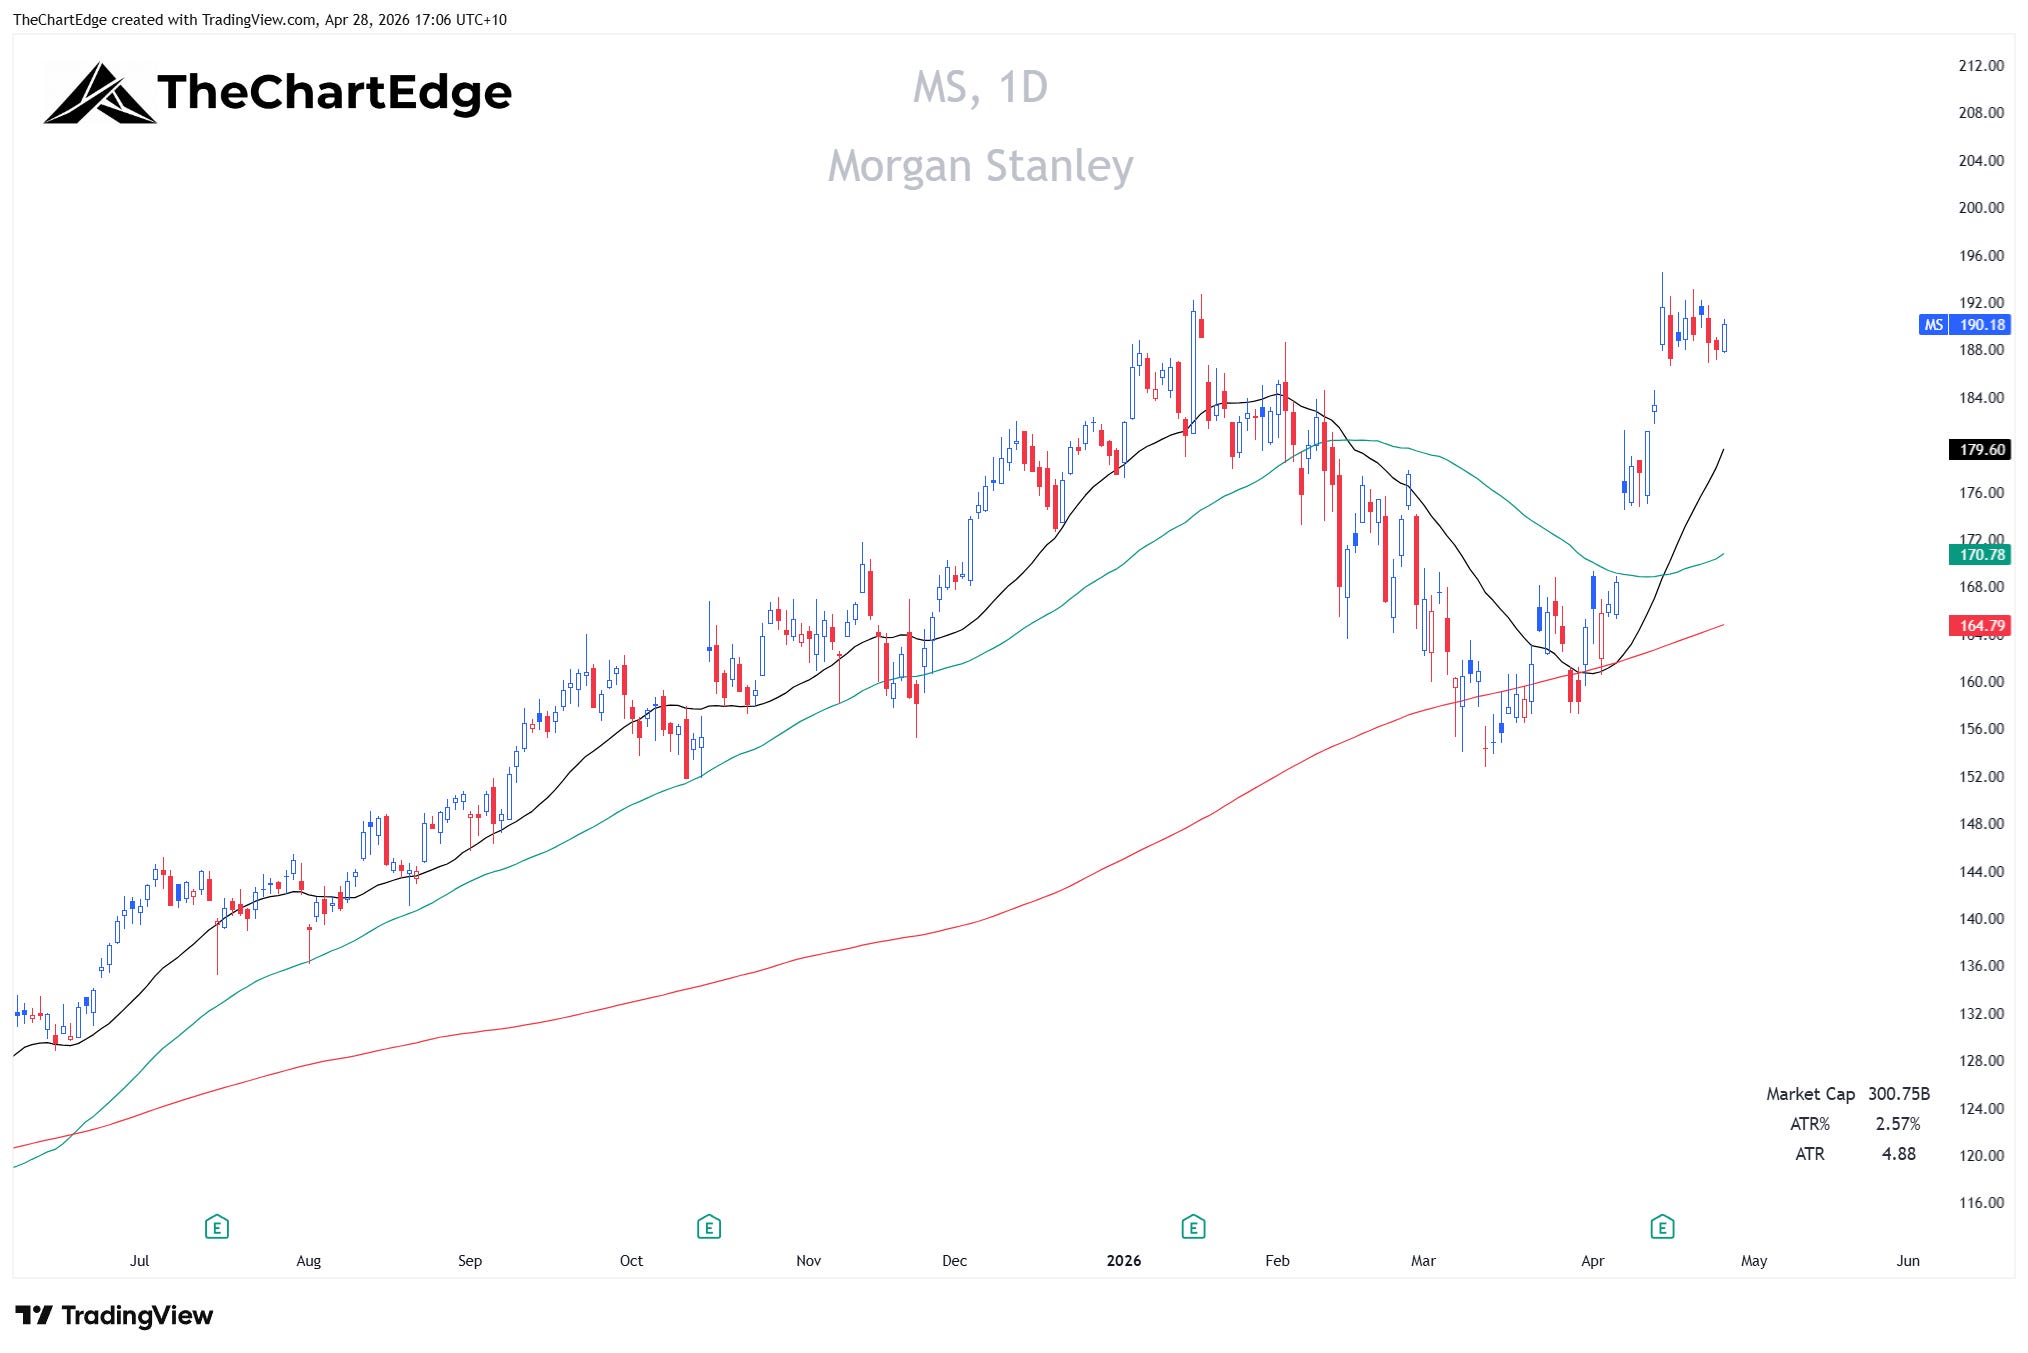
Tight consolidation under all-time highs.
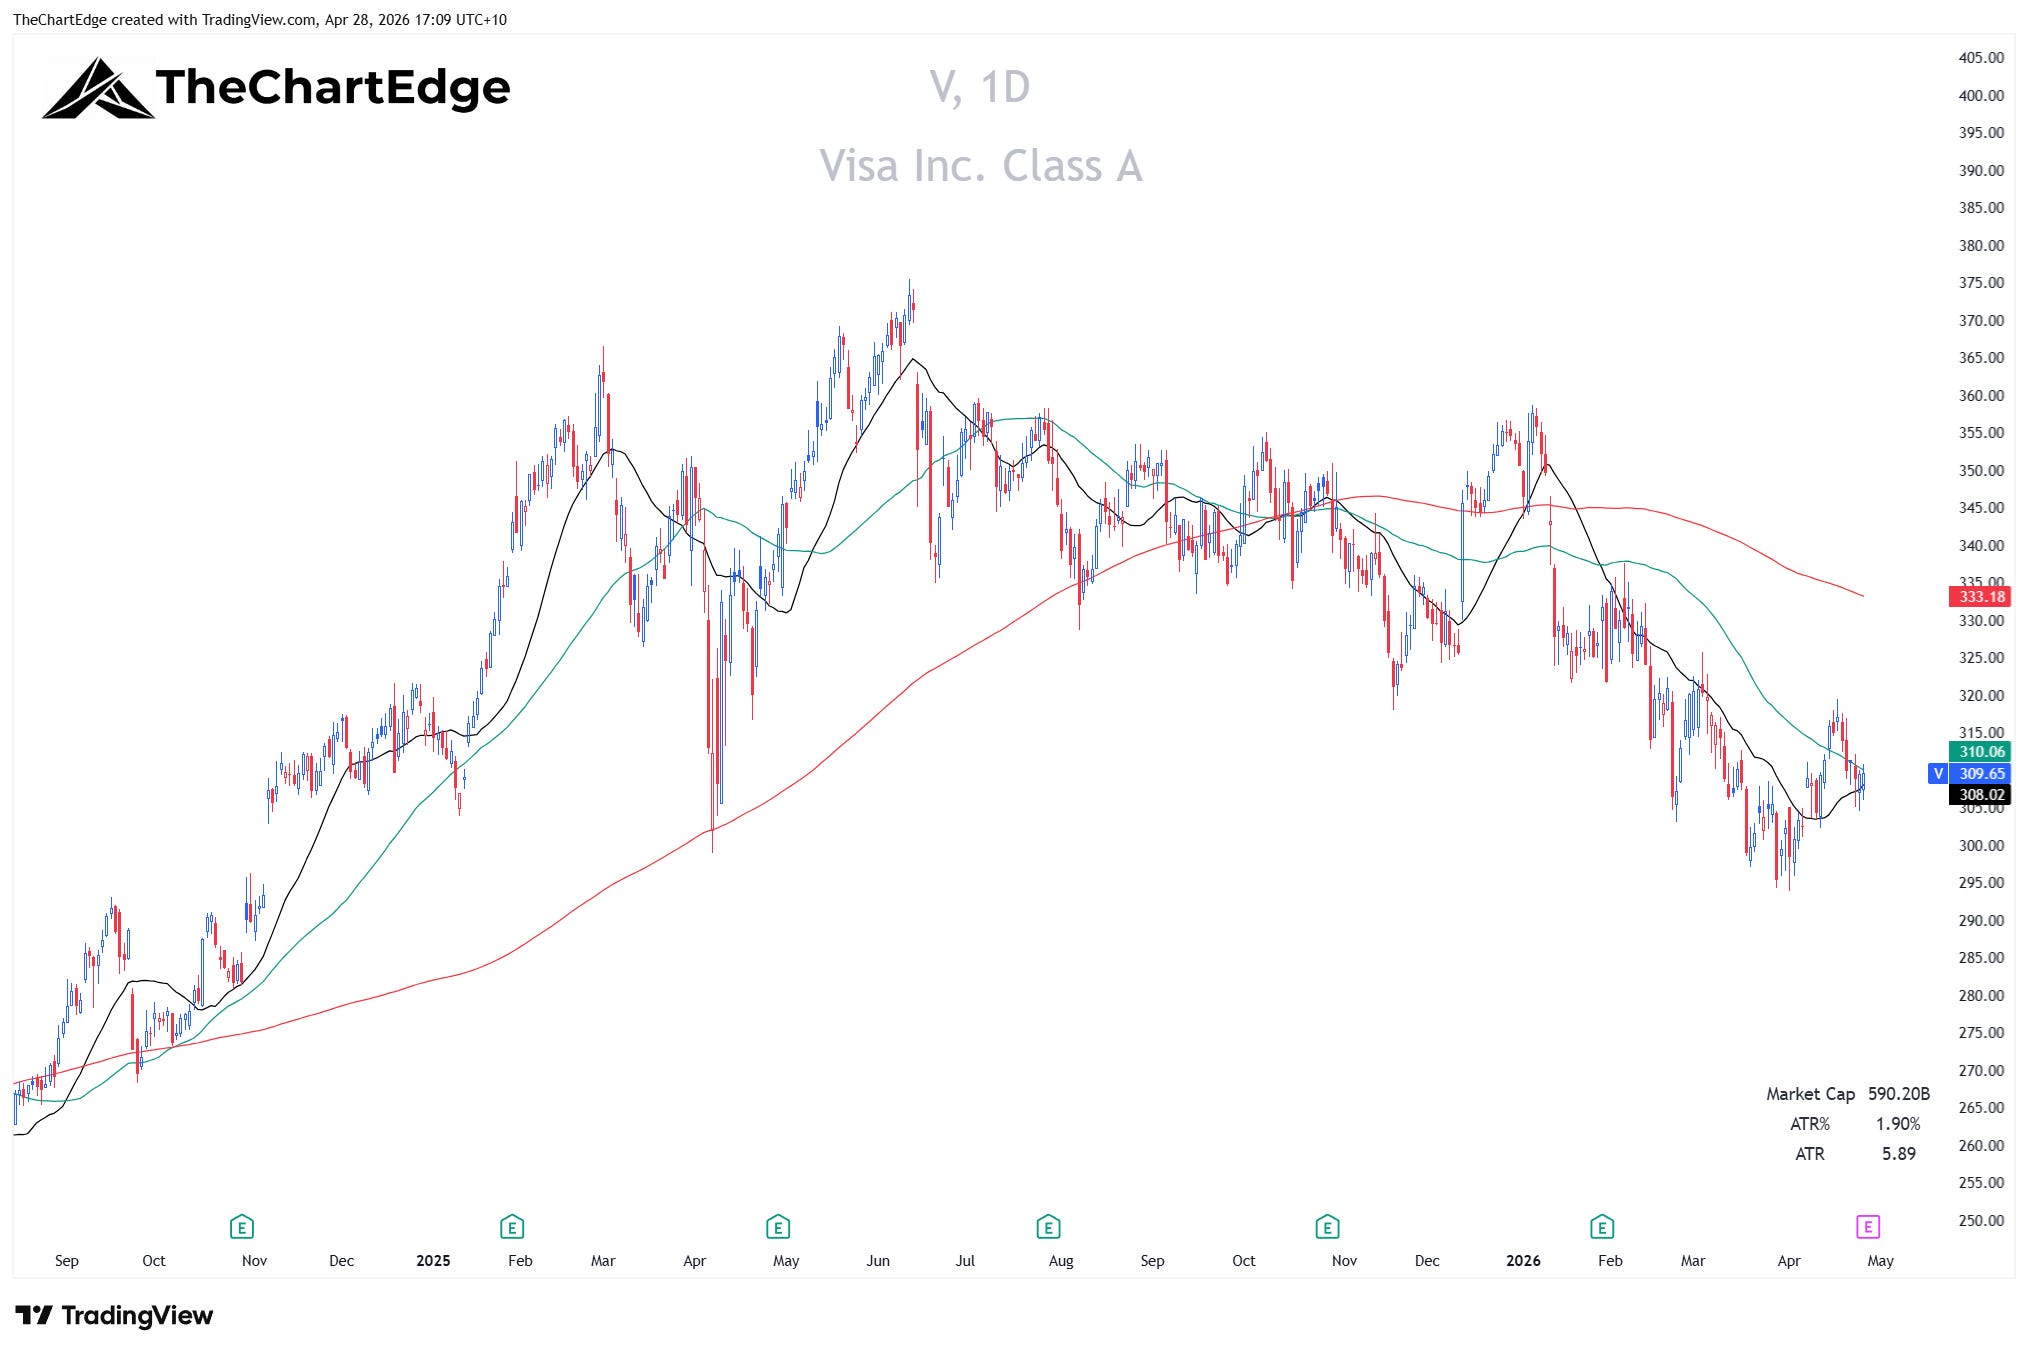
Dragging XLF down: insurance brokers AJG and BRO, Visa and Mastercard, Blackstone and Ares, Berkshire Hathaway, and Schwab - all Lagging, most in Downtrend or Strong Downtrend trend states.
Visa (V) Chart
OIH - the rebound has structure
OIH bounced over 9% last week. The drill-down shows it wasn’t uniform.
Land-focused names are Leading. Drillers ProPetro (PUMP) and Patterson-UTI (PTEN) are in Strong Uptrend. Tenaris (TS), a tubular goods manufacturer, is also Leading with a Strong Uptrend.
Tidewater (TDW) is Leading too - TDW is an offshore marine services company, so it’s bucking the broader offshore trend.
Offshore drillers - Transocean (RIG), Valaris (VAL), Noble (NE) - are Weakening.
The big integrated names SLB, HAL, and Baker Hughes (BKR) are Lagging or Improving but all have Strong Uptrend trend states.
Not a single name in the 25-stock OIH universe has a Downtrend trend state.
Weatherford (WFRD) Chart
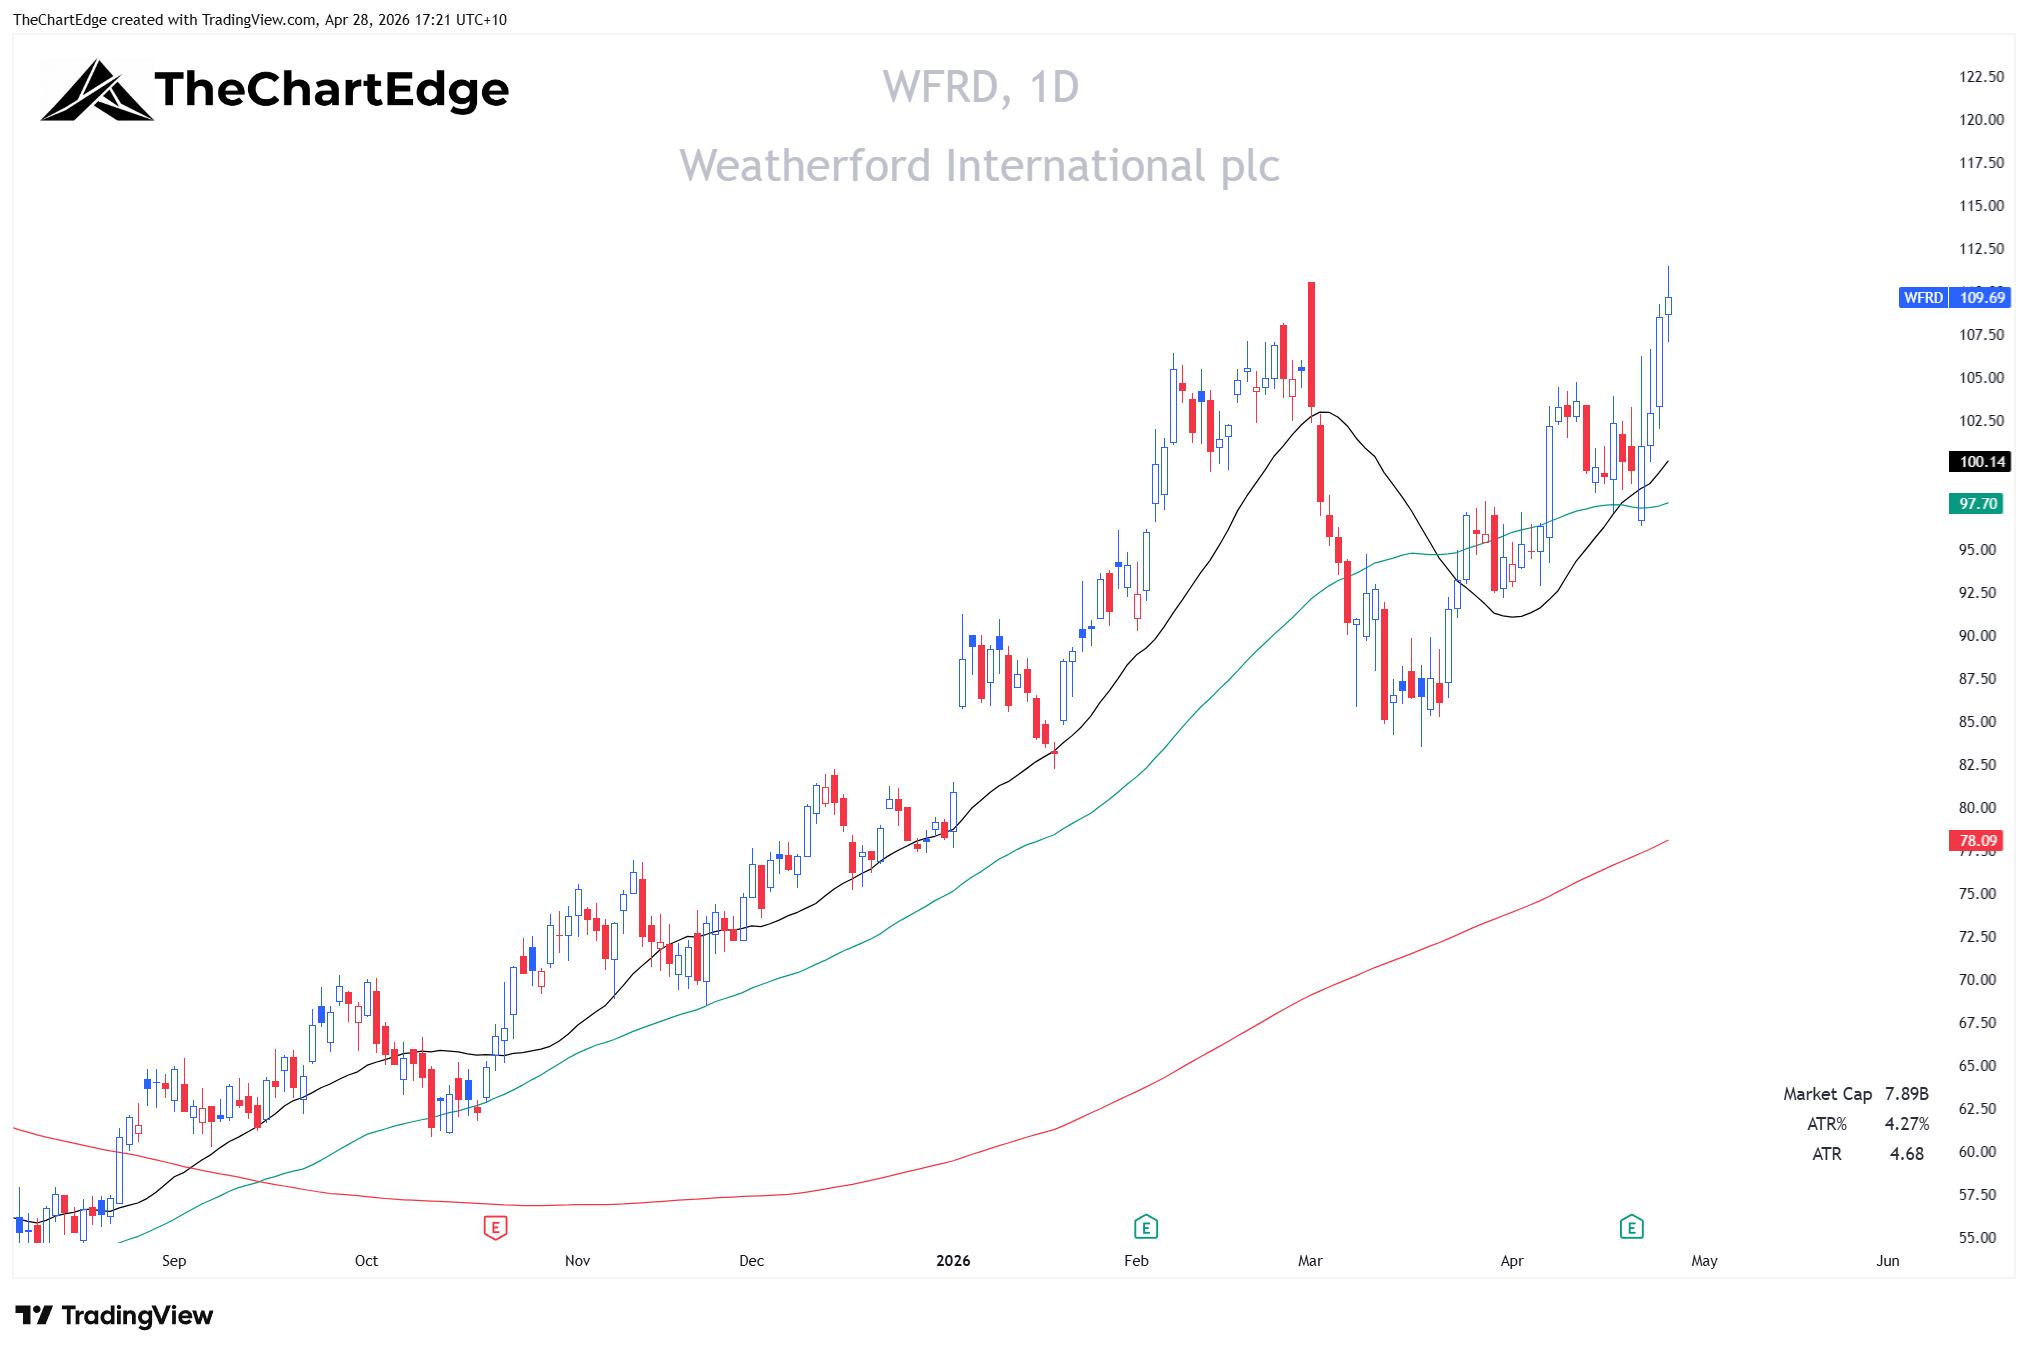
Weatherford (WFRD), a diversified oilfield services company, is also Leading with a Strong Uptrend.
TechnipFMC (FTI)
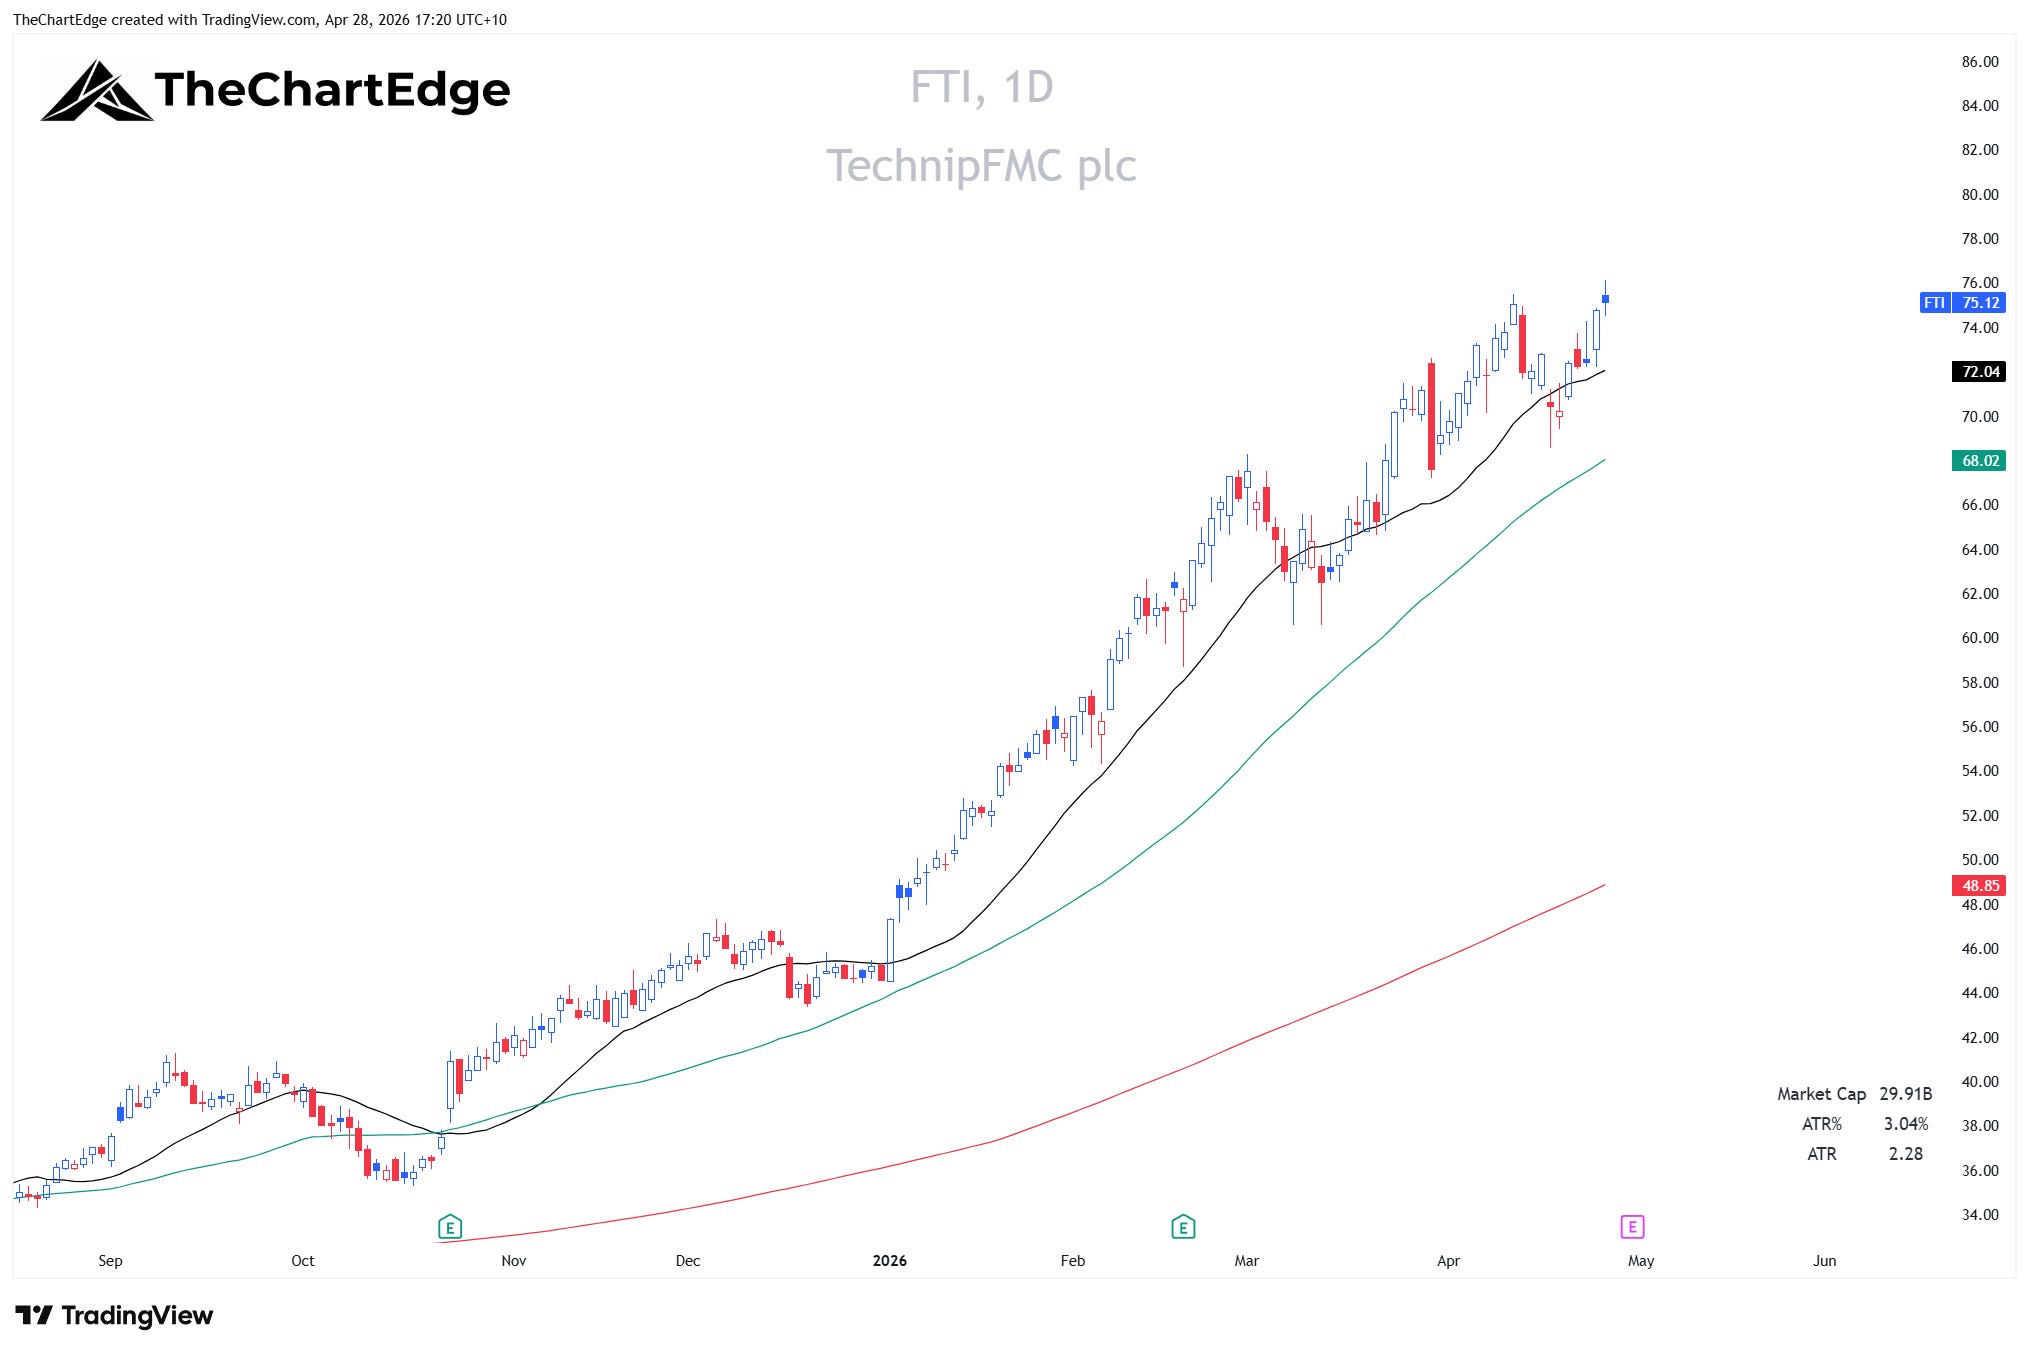
TechnipFMC (FTI), a subsea systems and technology company, is Weakening with a Strong Uptrend. Earnings April 30th though.
The ETF-level data shows the broad direction but often masks what’s happening underneath. The AI stack’s large shift from Leading to Weakening is more about a 9% benchmark week than any real deterioration. Software ‘strength’ within IGV doesn’t translate to strength against stronger benchmarks. XLF Lagging hides strength in big banks. And OIH’s bounce has structure underneath.
As always, stay open minded to all possibilities and manage risk tightly.
Cheers,
Marcus Grant, CFTe
Disclaimer: The content provided in this newsletter is for informational and educational purposes only and should not be considered as financial, investment, or legal advice. The information shared is based on our research and analysis, but we are not a licensed financial advisor, nor can we guarantee its accuracy, completeness, or timeliness. Market conditions and financial instruments can change rapidly, and any opinions expressed may not be suitable for all investors. Any opinions expressed and or securities mentioned do not constitute a recommendation to buy, sell, or hold that or any other security. You should conduct your own due diligence and consult with a licensed financial advisor or other professional before making any investment decisions. Past performance is not indicative of future results, and all investments carry the risk of loss. The authors and publishers of this newsletter are not responsible for any financial decisions made based on the content provided herein. By reading and or subscribing to this newsletter, you acknowledge and agree that you are using the information at your own risk.