

S&P 500 Up About 15% Off the Lows
But Are We Really in the Clear?

Since the S&P 500 bottomed on April 7th, it has rallied about 15%. The question remains is this a V bottom, a bear market rally or something in between? The truth is no one knows for sure. There are some positive signs but the S&P 500 and most other sectors & indices, still have overhead supply to work through if they are to continue higher.
Let’s get into some charts.
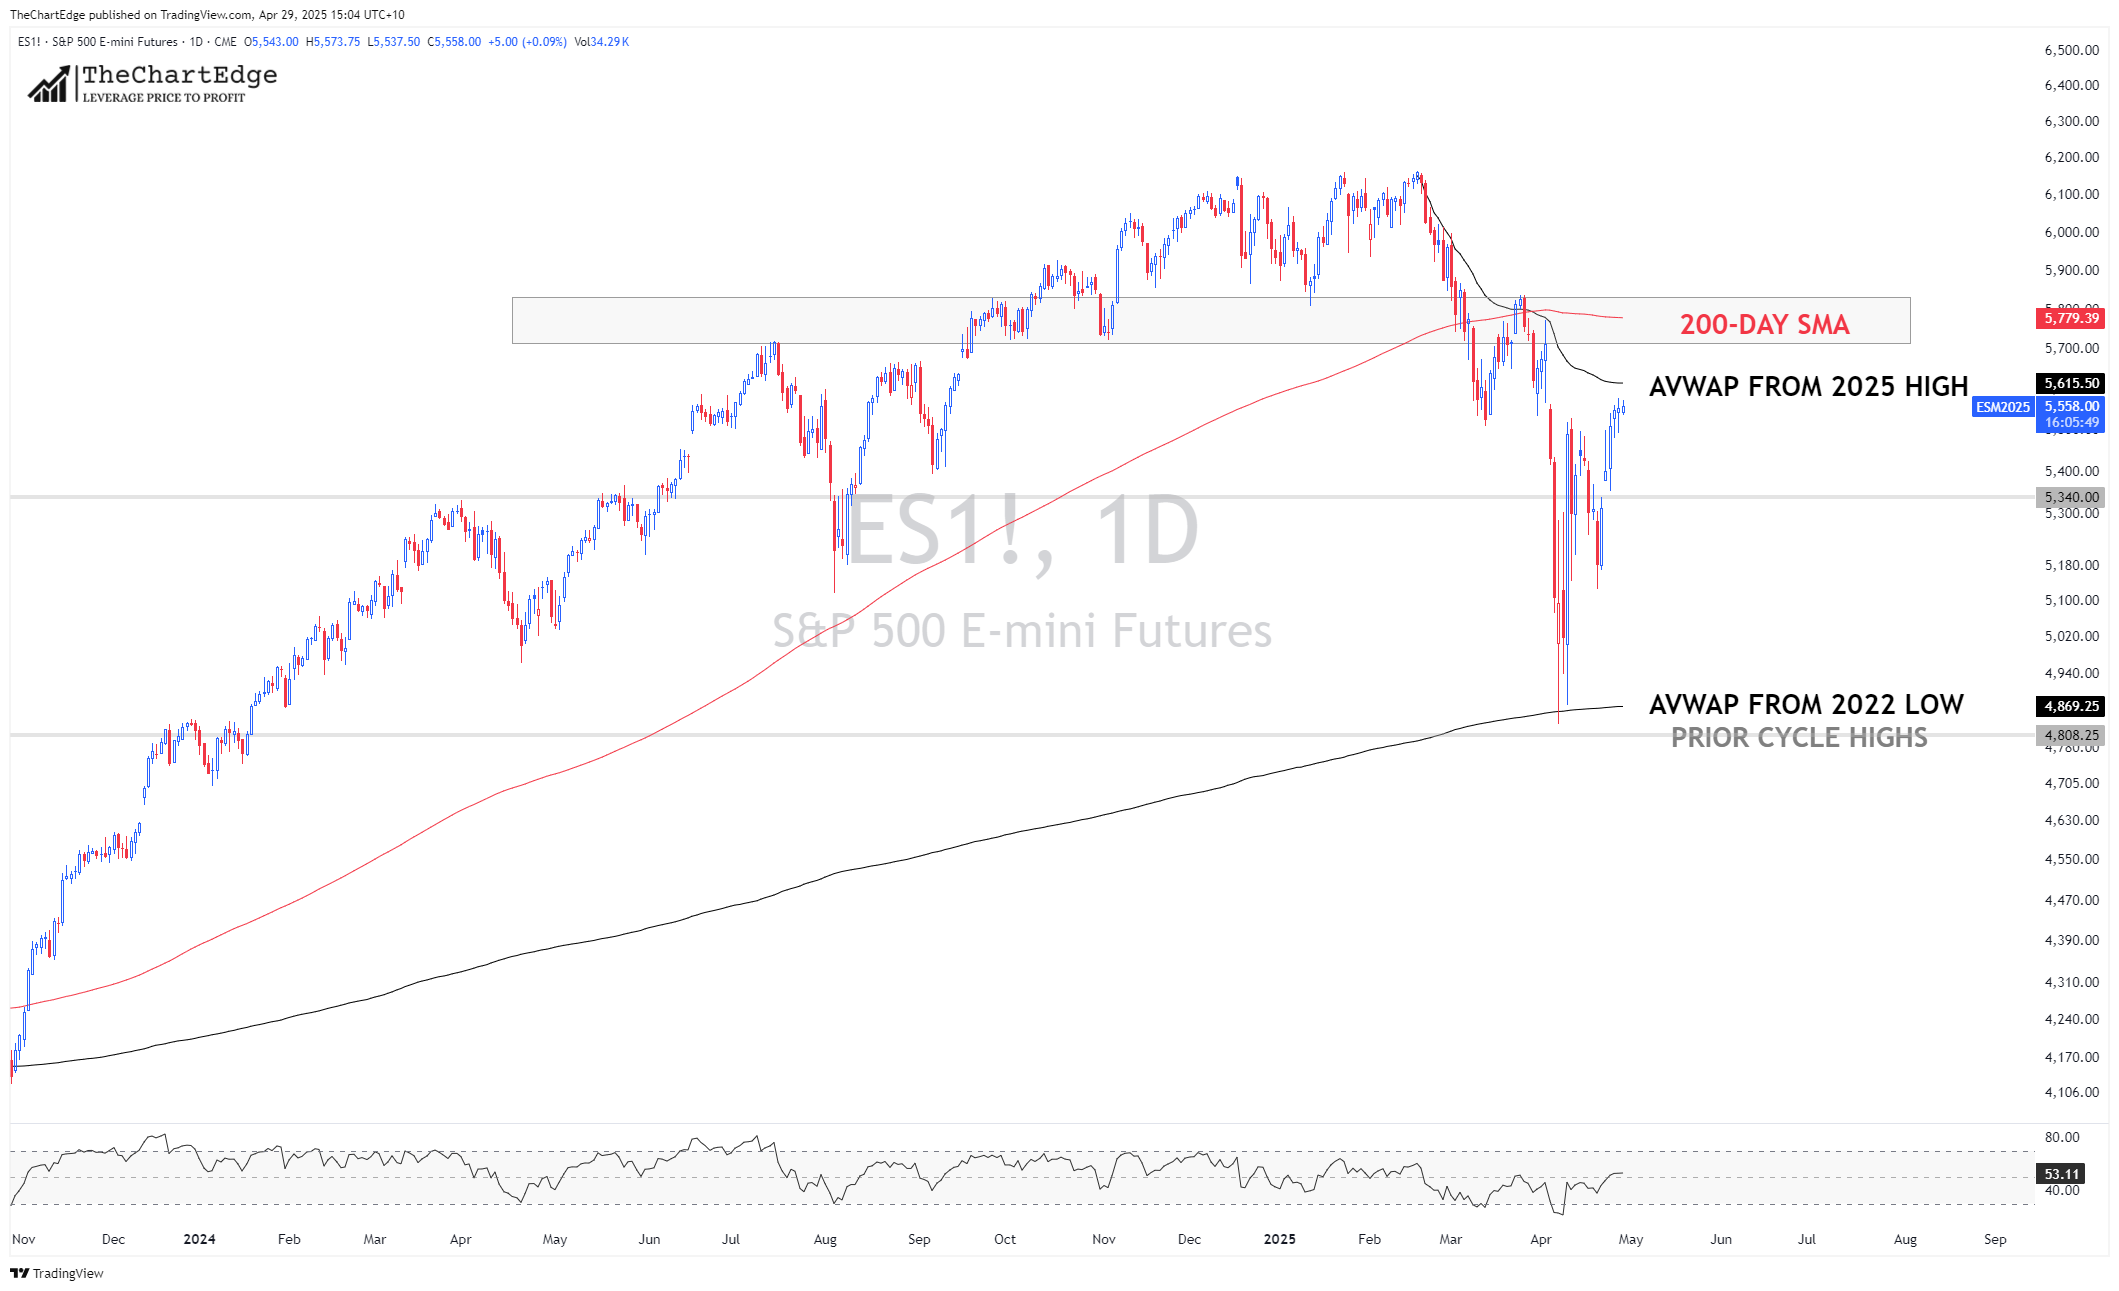
The S&P 500 E-mini futures bounced right at the prior cycle highs from late 2021/early 2022 and the AVWAP from the 2022 low. However, there is potential resistance overhead at the AWVAP from the 2025 high and above that a declining 200-day SMA.
I’ll start with some good-looking charts.
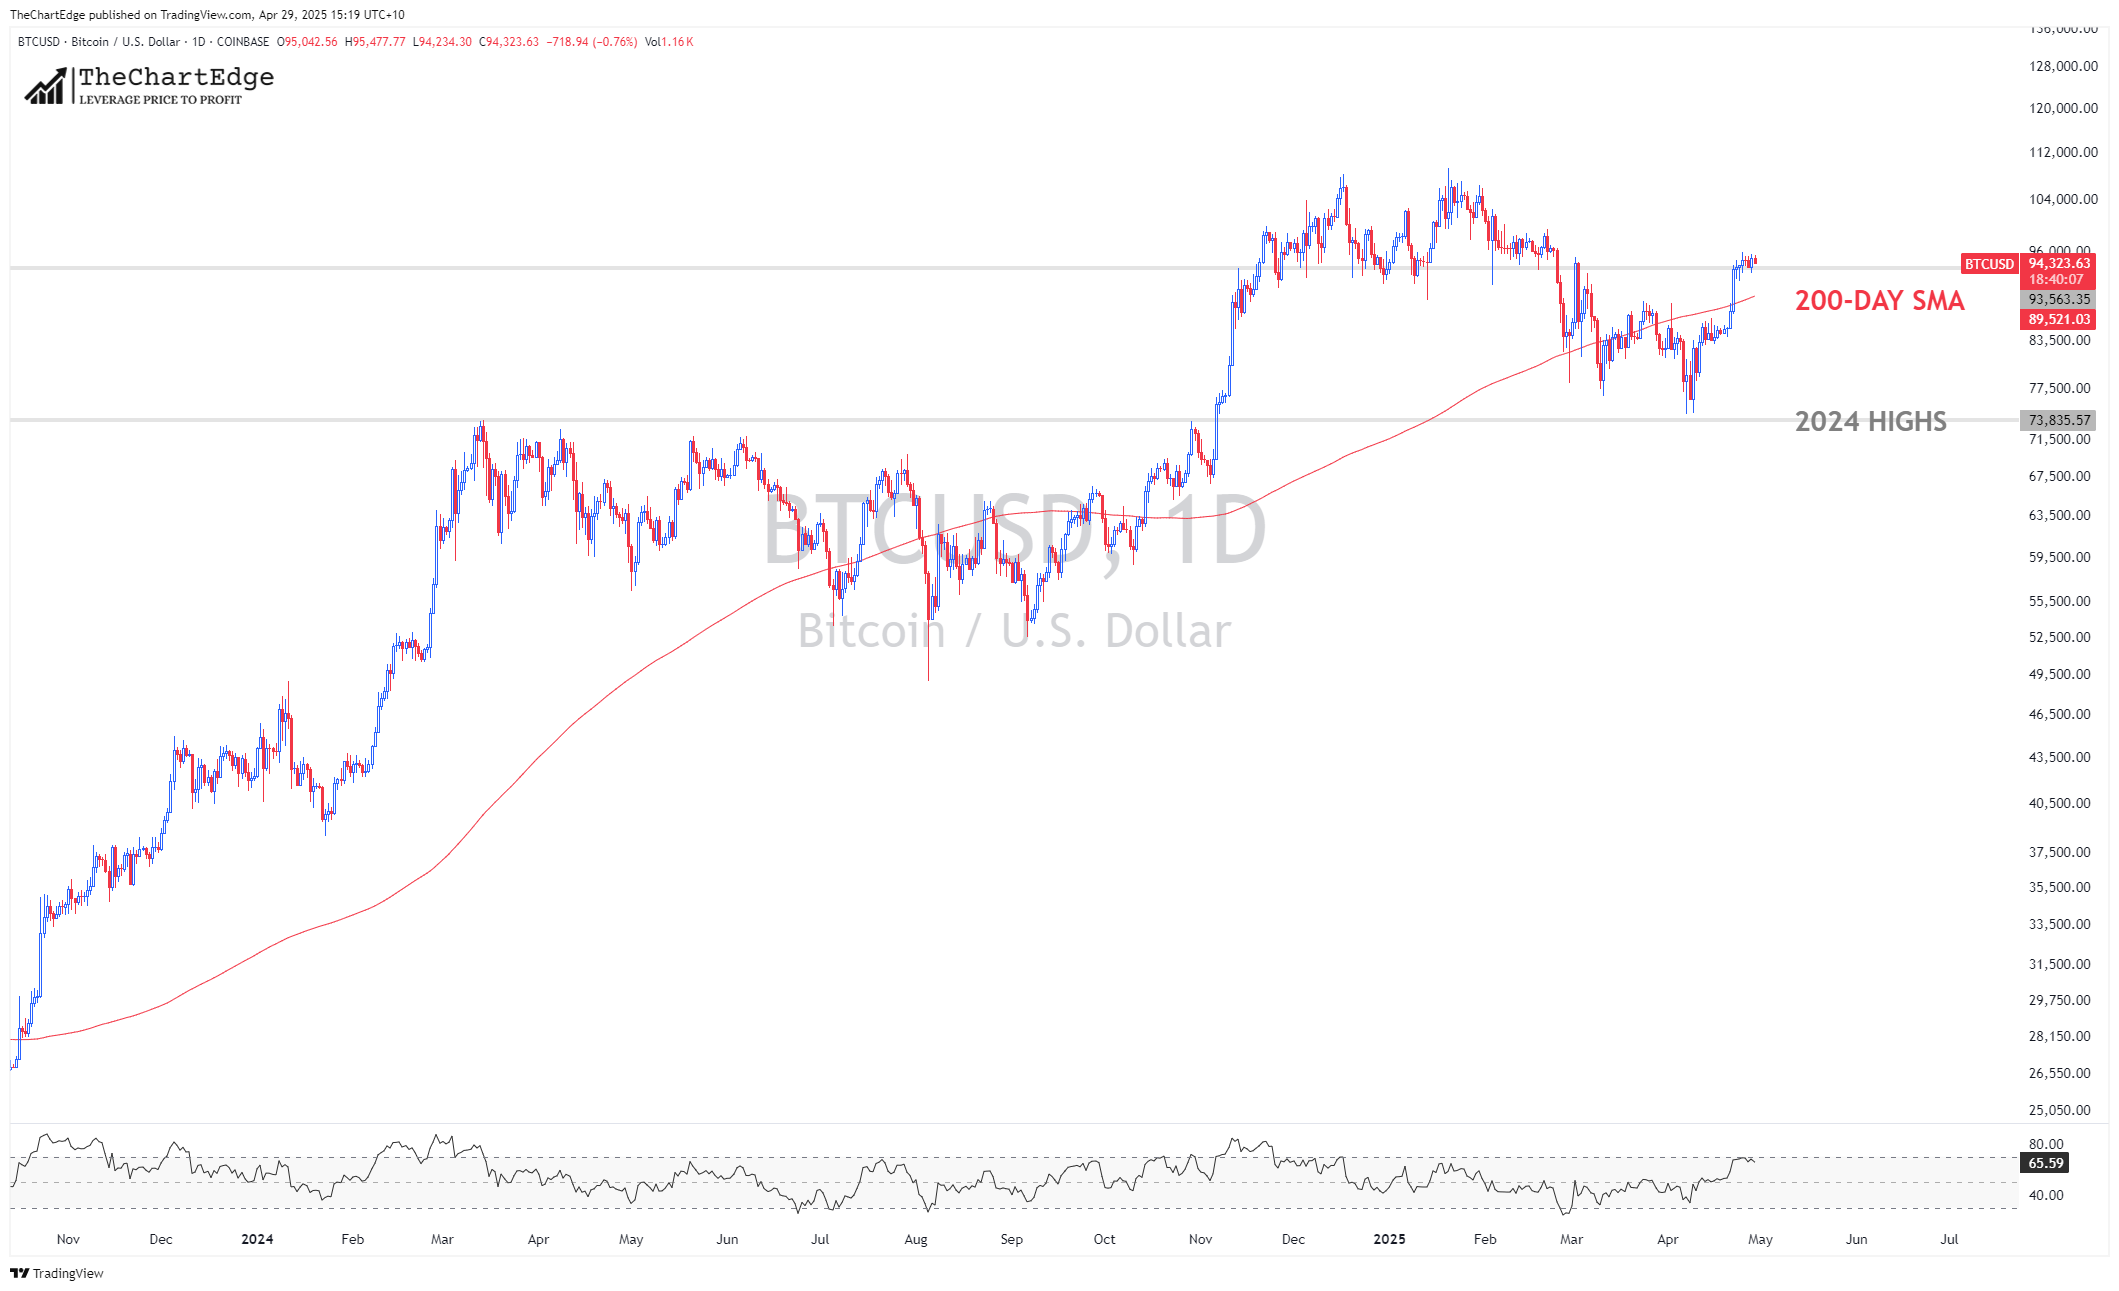
Bitcoin is one of the best-looking charts out there now. It retested and bounced off the 2024 highs (in fact in didn’t quite touch those old highs) and is currently above a rising 200-day SMA. After a big move up early last week, it has been consolidating in a tight range for the last week or so, right at the lower end of its November to February range.
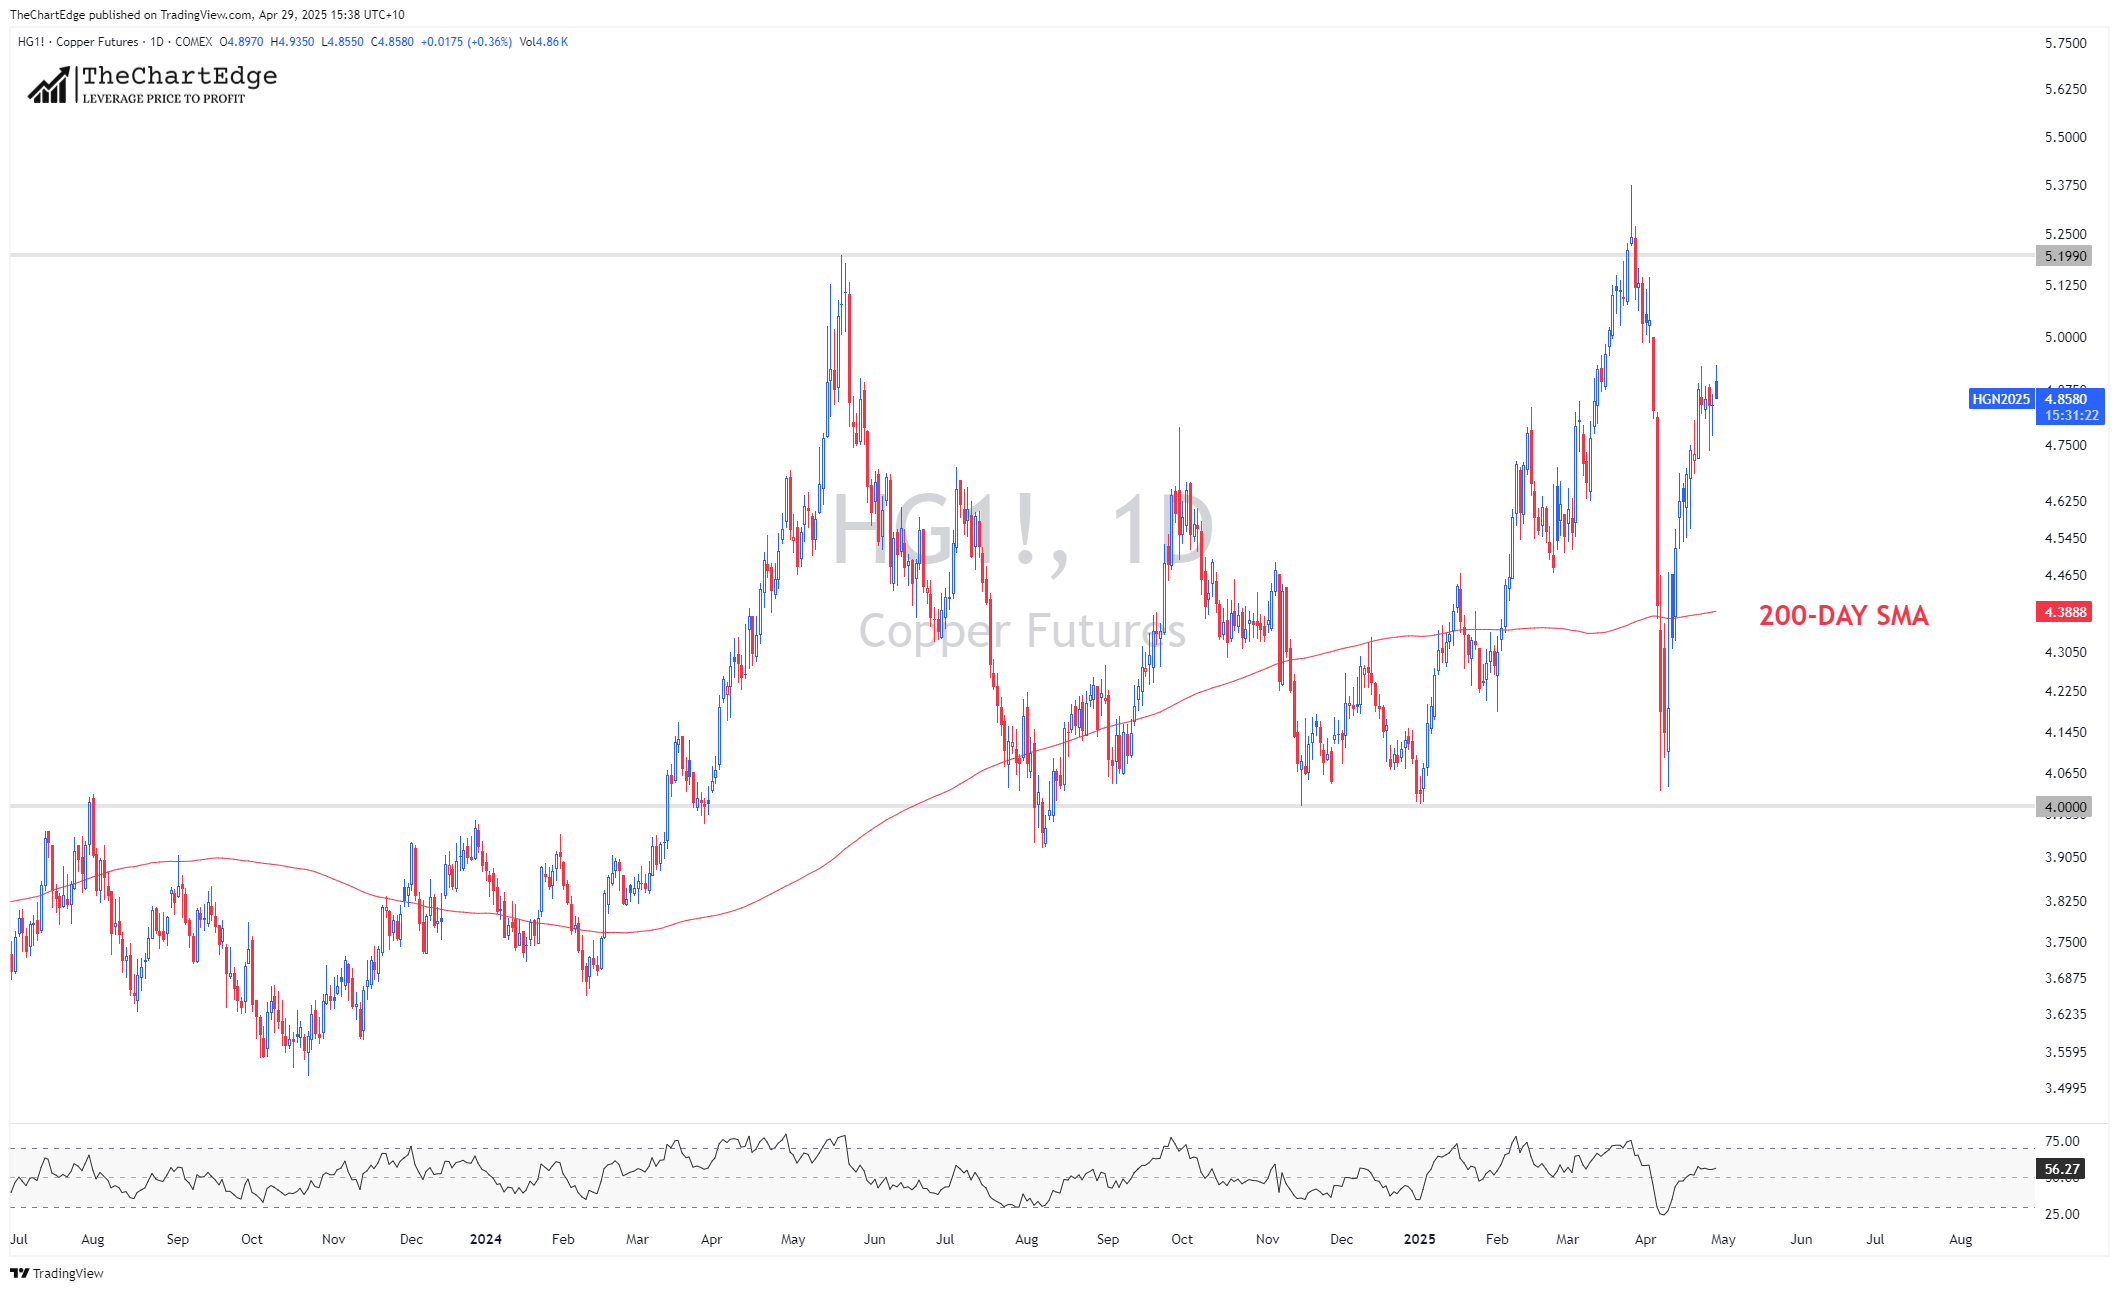
Copper had a failed breakout on March 26th and proceeded to crash about 25% in less than 10 trading days. However, it’s recovery since has been strong. I think this is a positive sign.
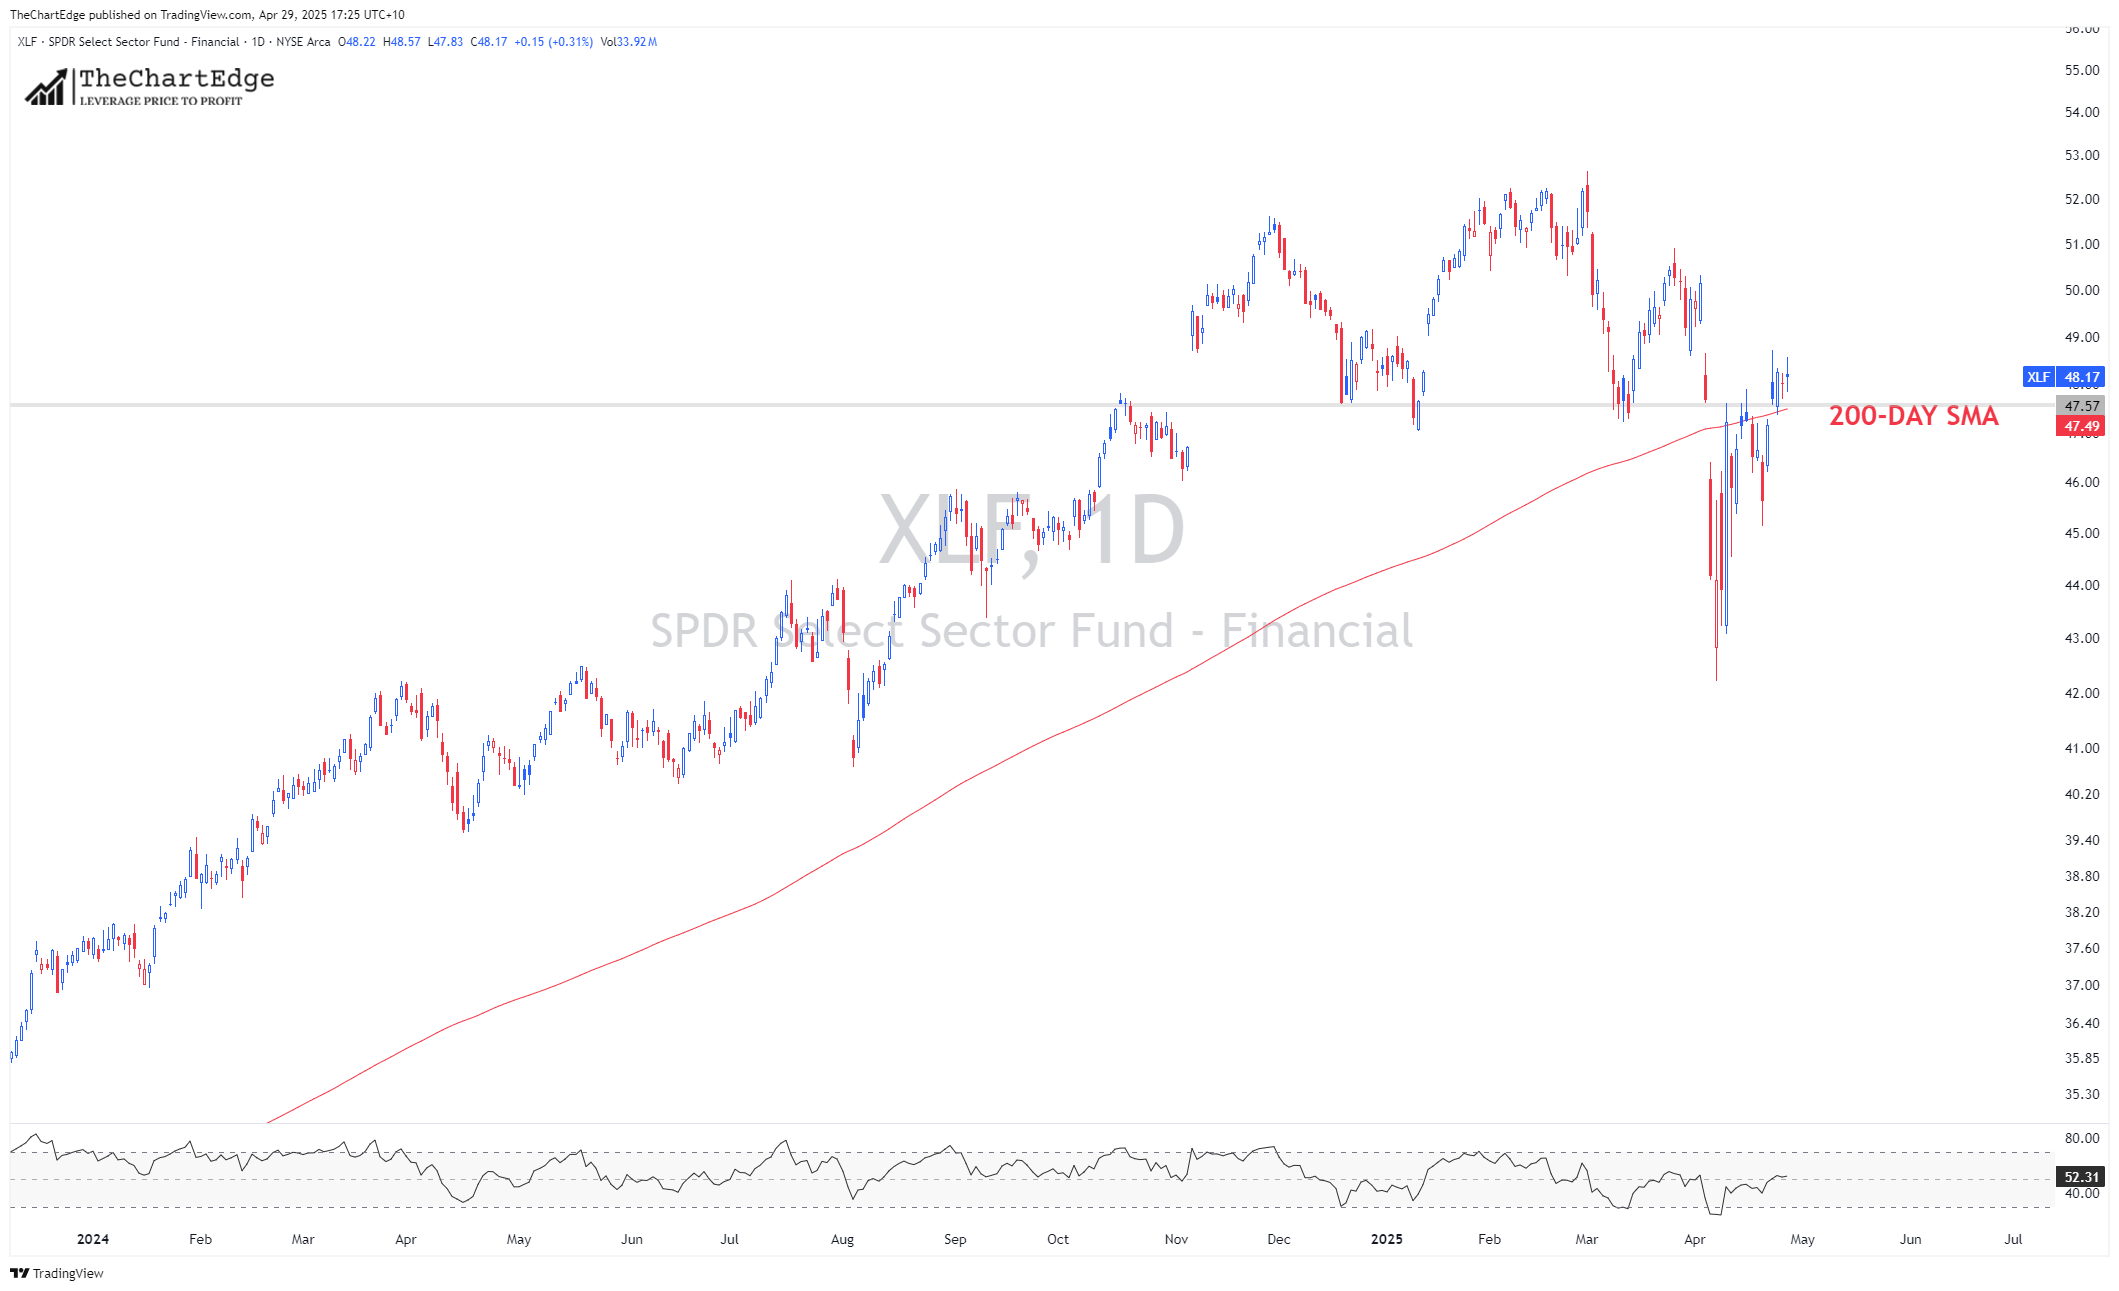
The Financials ETF, XLF didn’t quite touch its prior cycle highs (not shown, but it was close) and is now above a rising 200-day SMA. It is also above the neckline of the head and shoulders pattern it broke down from in early April. XLF is the strongest looking of the major SPDR sector ETFs. Only XLF, XLC, XLU and XLP are above their 200-day SMAs. However, RSI looks a little bit weak, only just above 50 (shown in the bottom pane on the chart).
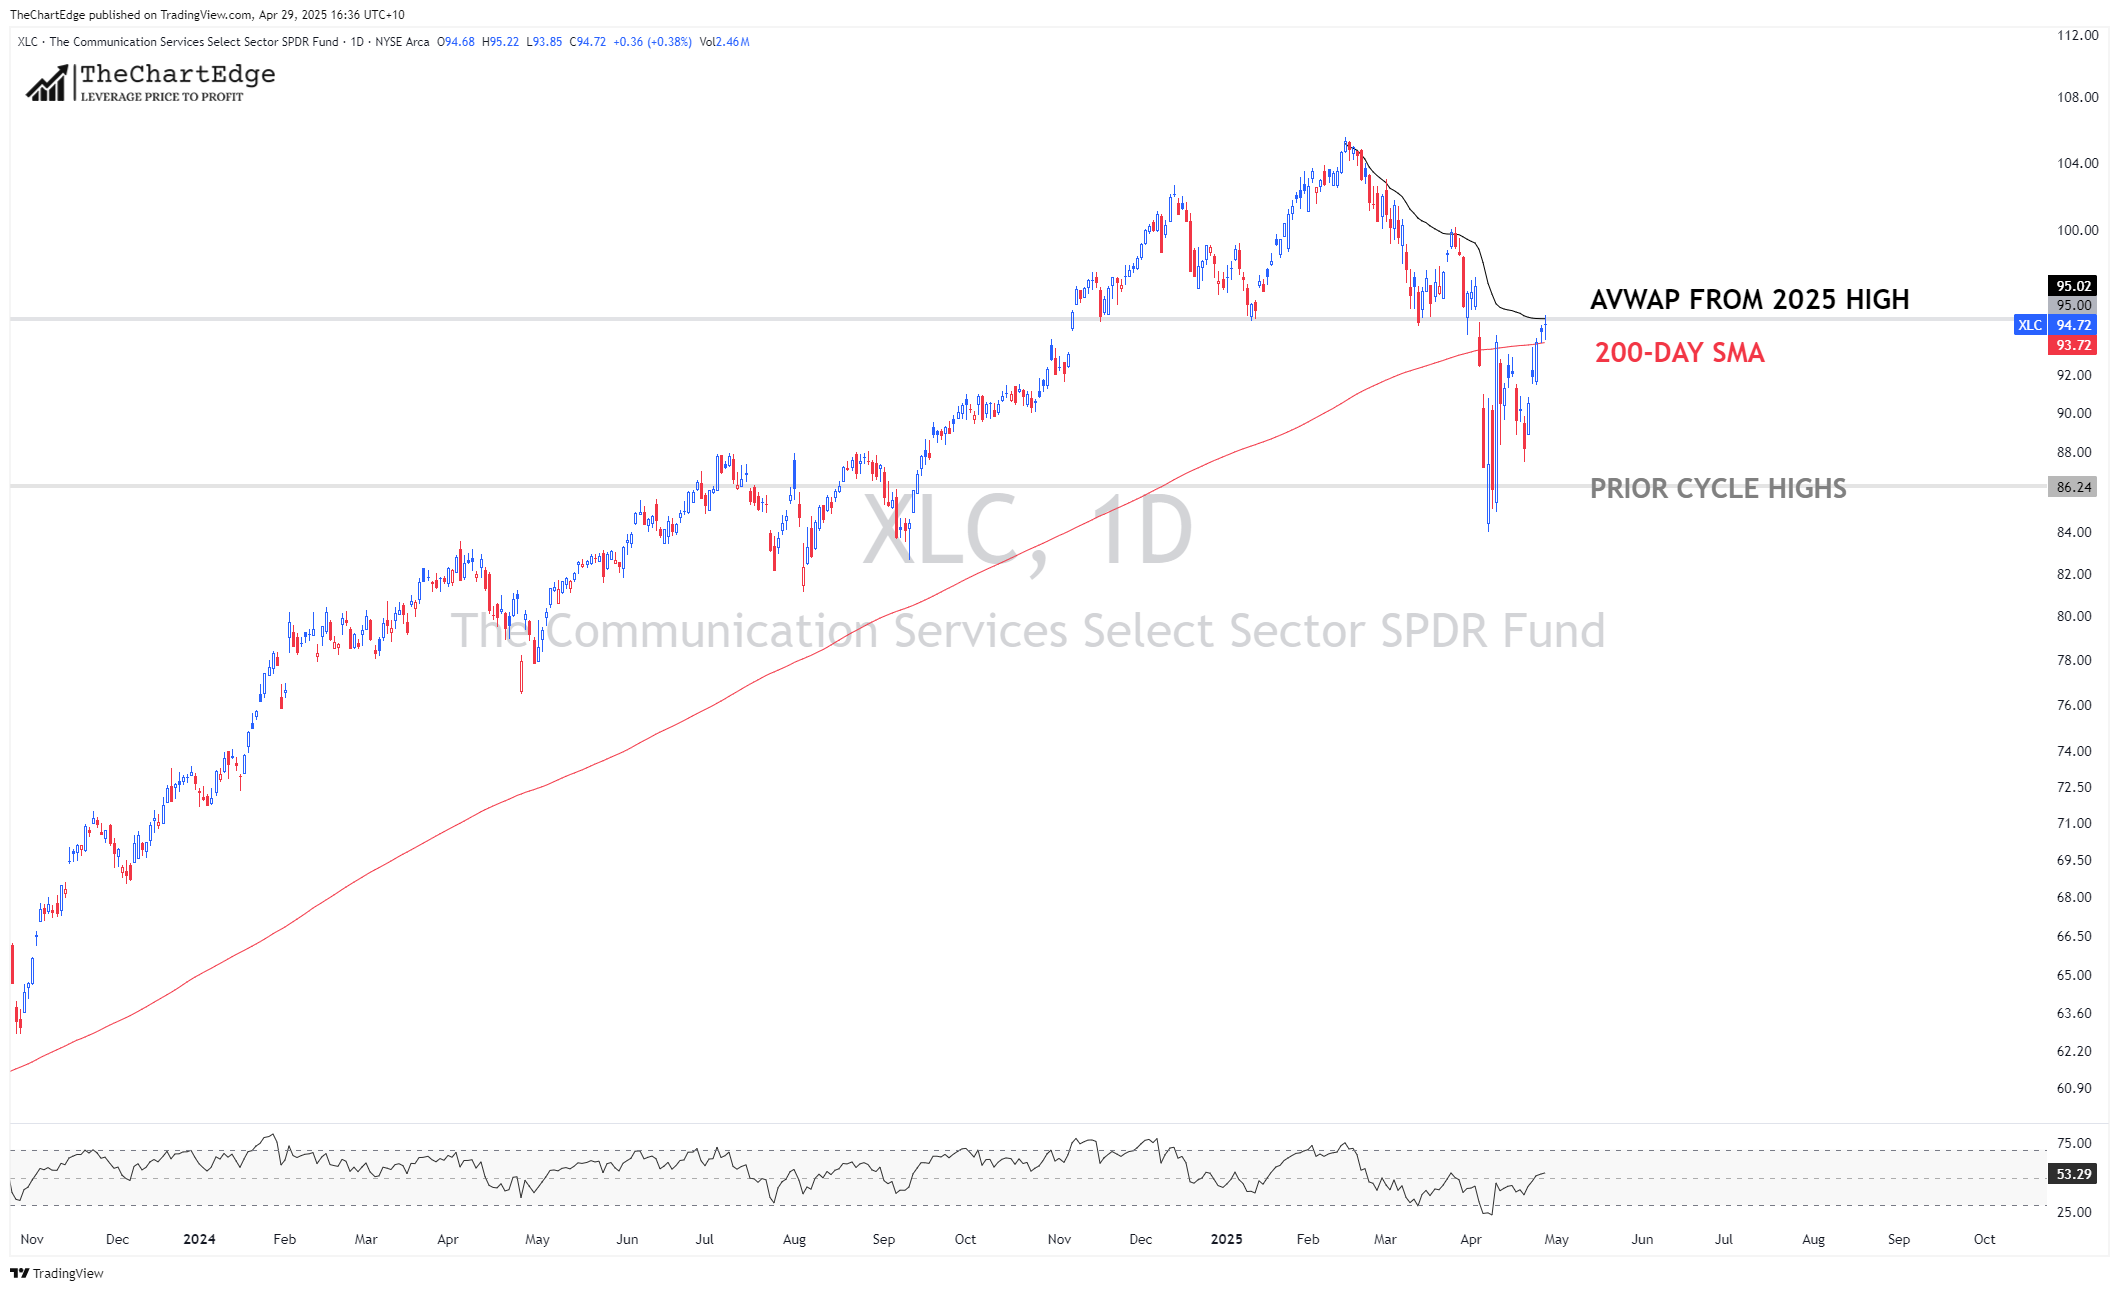
The Communications Services Sector ETF, XLC retested and bounced off its prior cycle highs and is back above a rising 200-day SMA. However, it’s at potential resistance with the AVWAP from the 2025 high and the neckline of the head and shoulders pattern it broke down from in April, sitting just above. The RSI is also a little weak, just above 50.
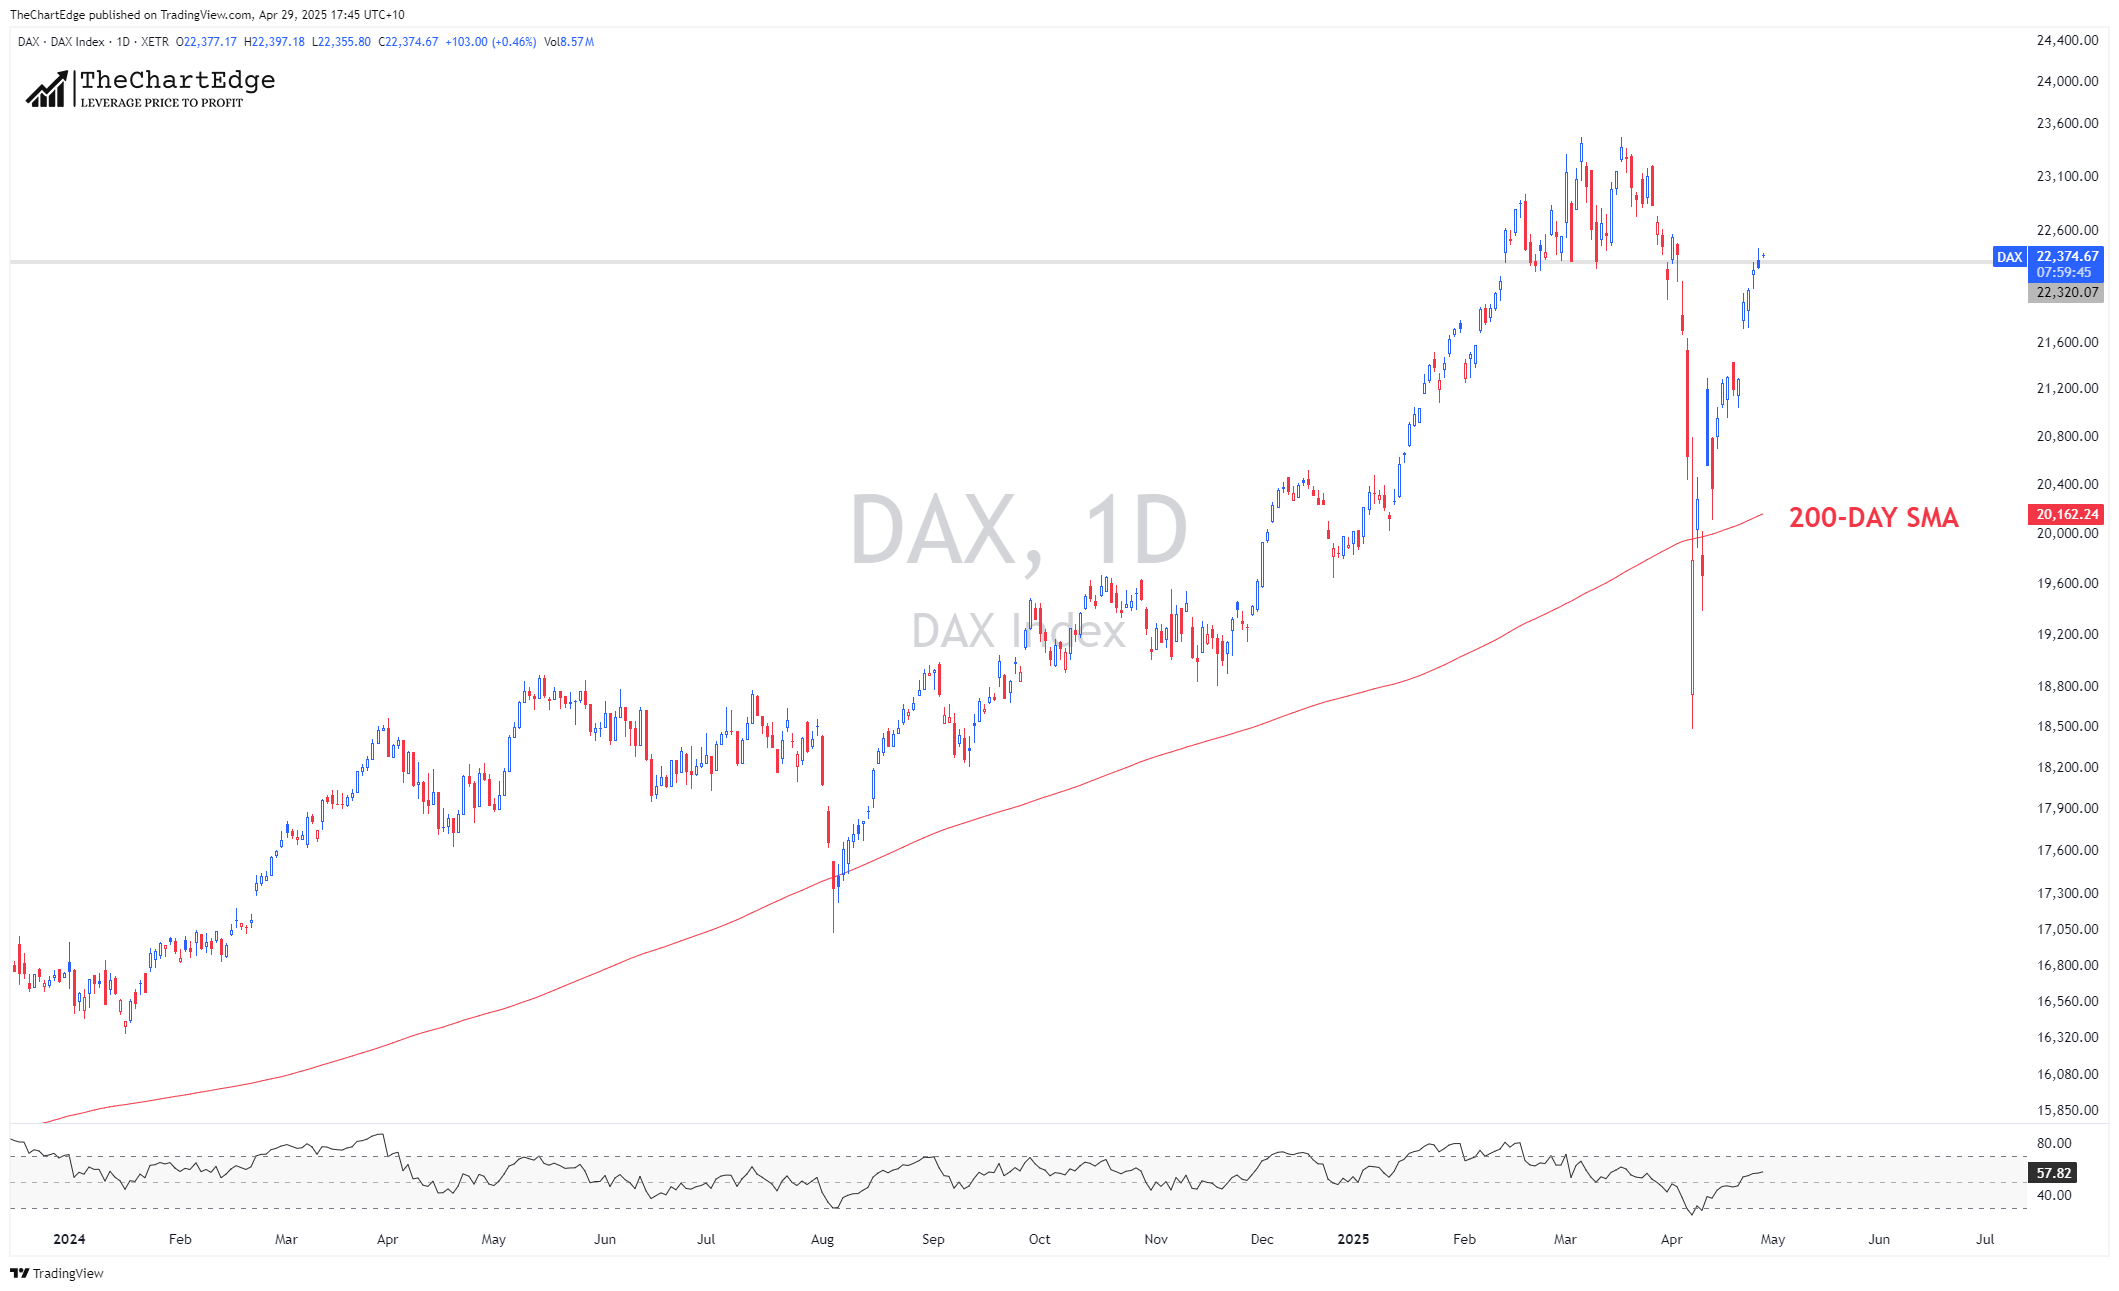
The German DAX looks the strongest of developed international markets. It’s above all its SMAs and AVWAP from the 2025 high. However, its sitting at potential resistance where it broke down in early April.
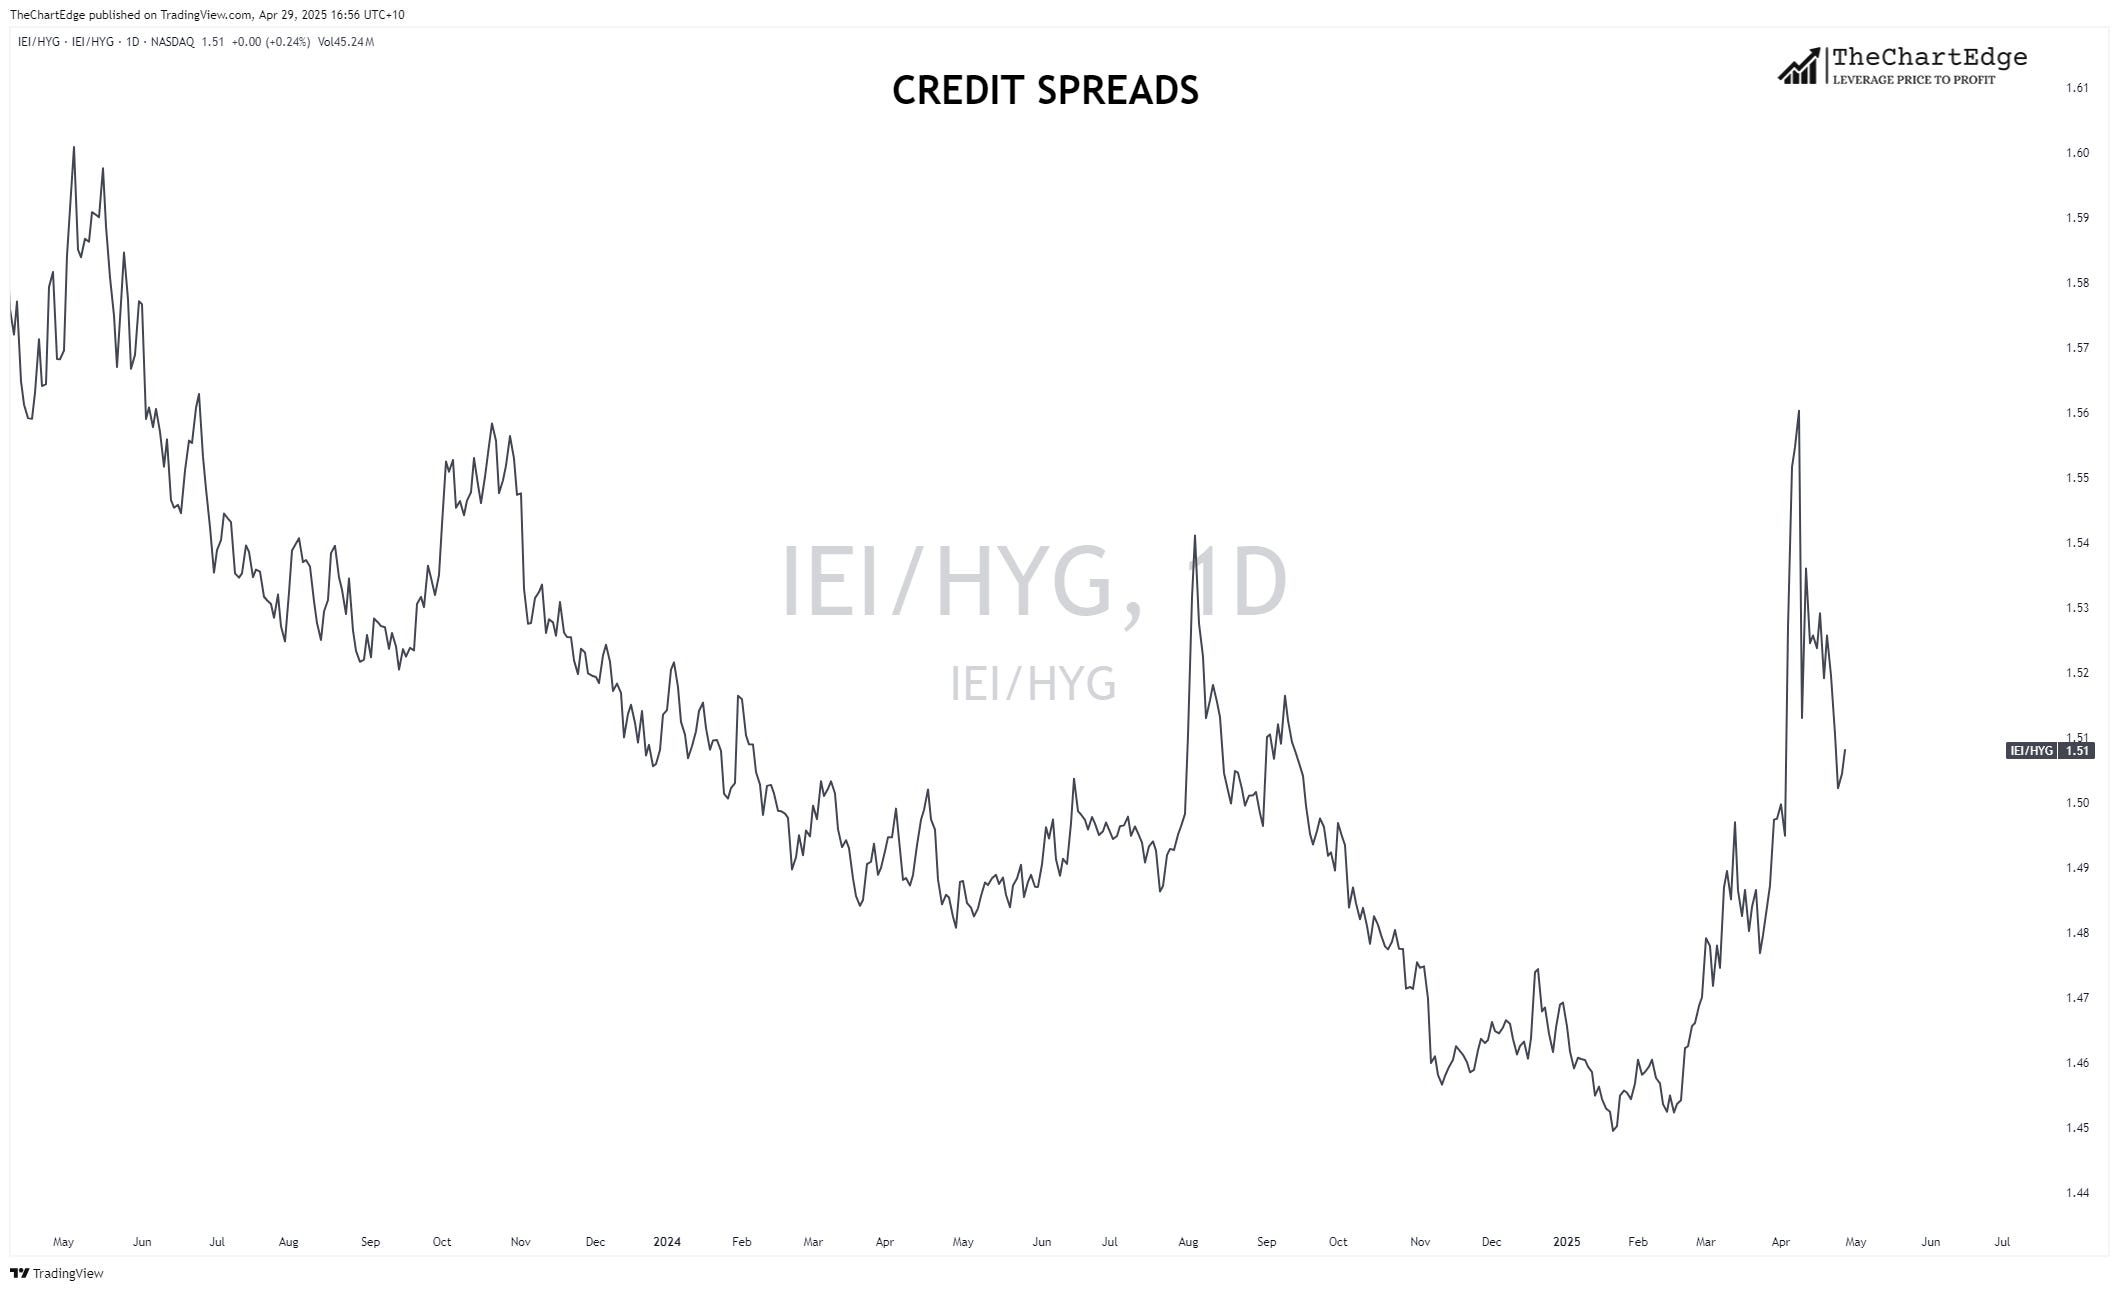
The IEI/HYG ratio, which is used as an indicator for credit spreads, has come in significantly after spiking during the selloff. This is a positive sign.
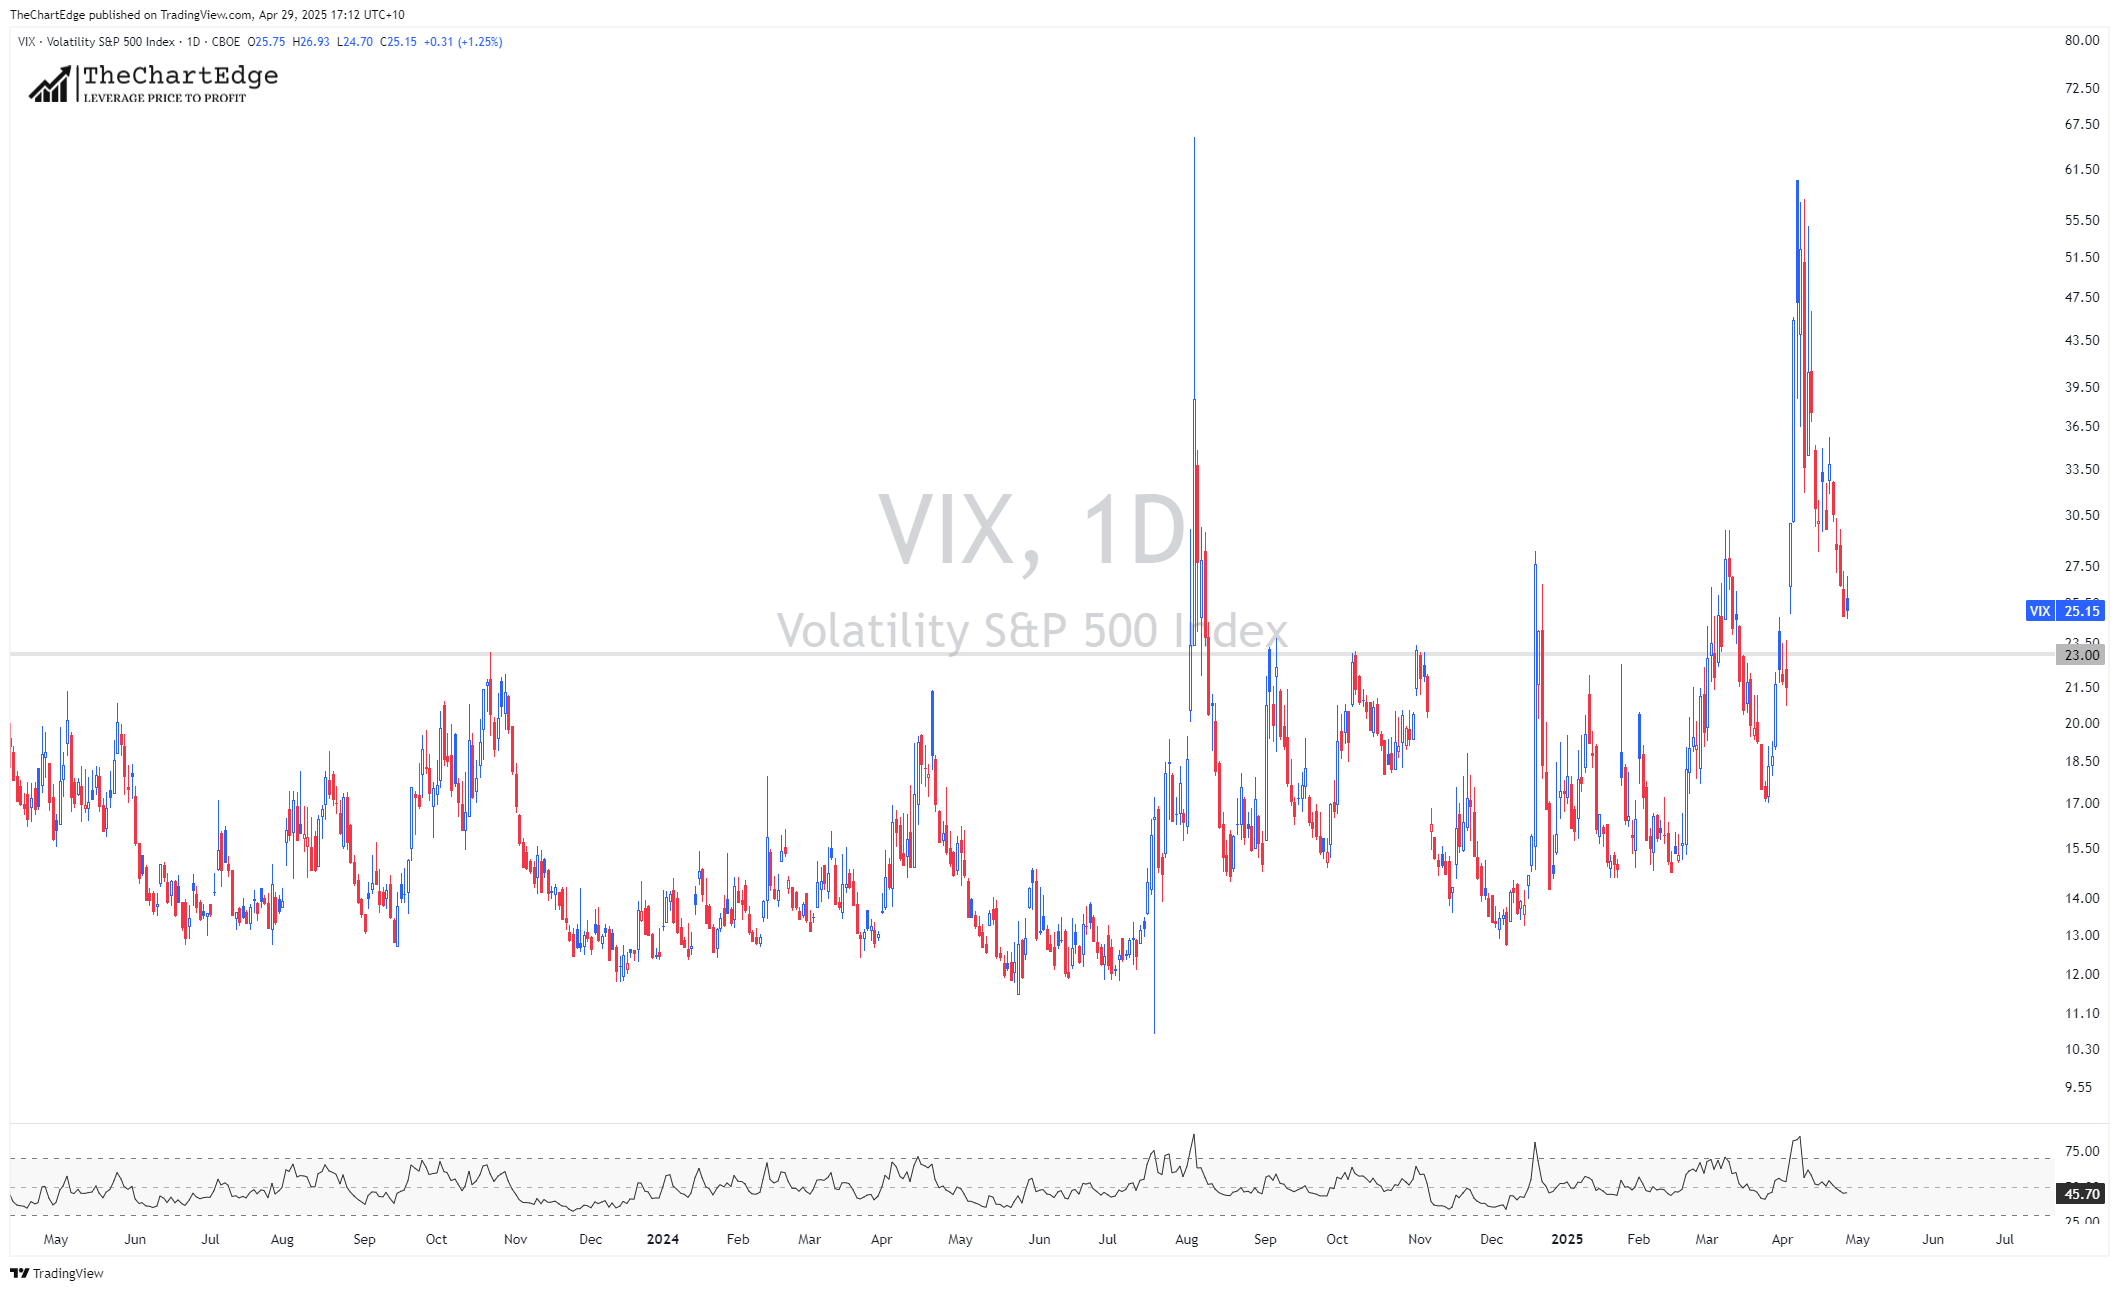
The VIX has also come in after a big spike but is still slightly elevated.
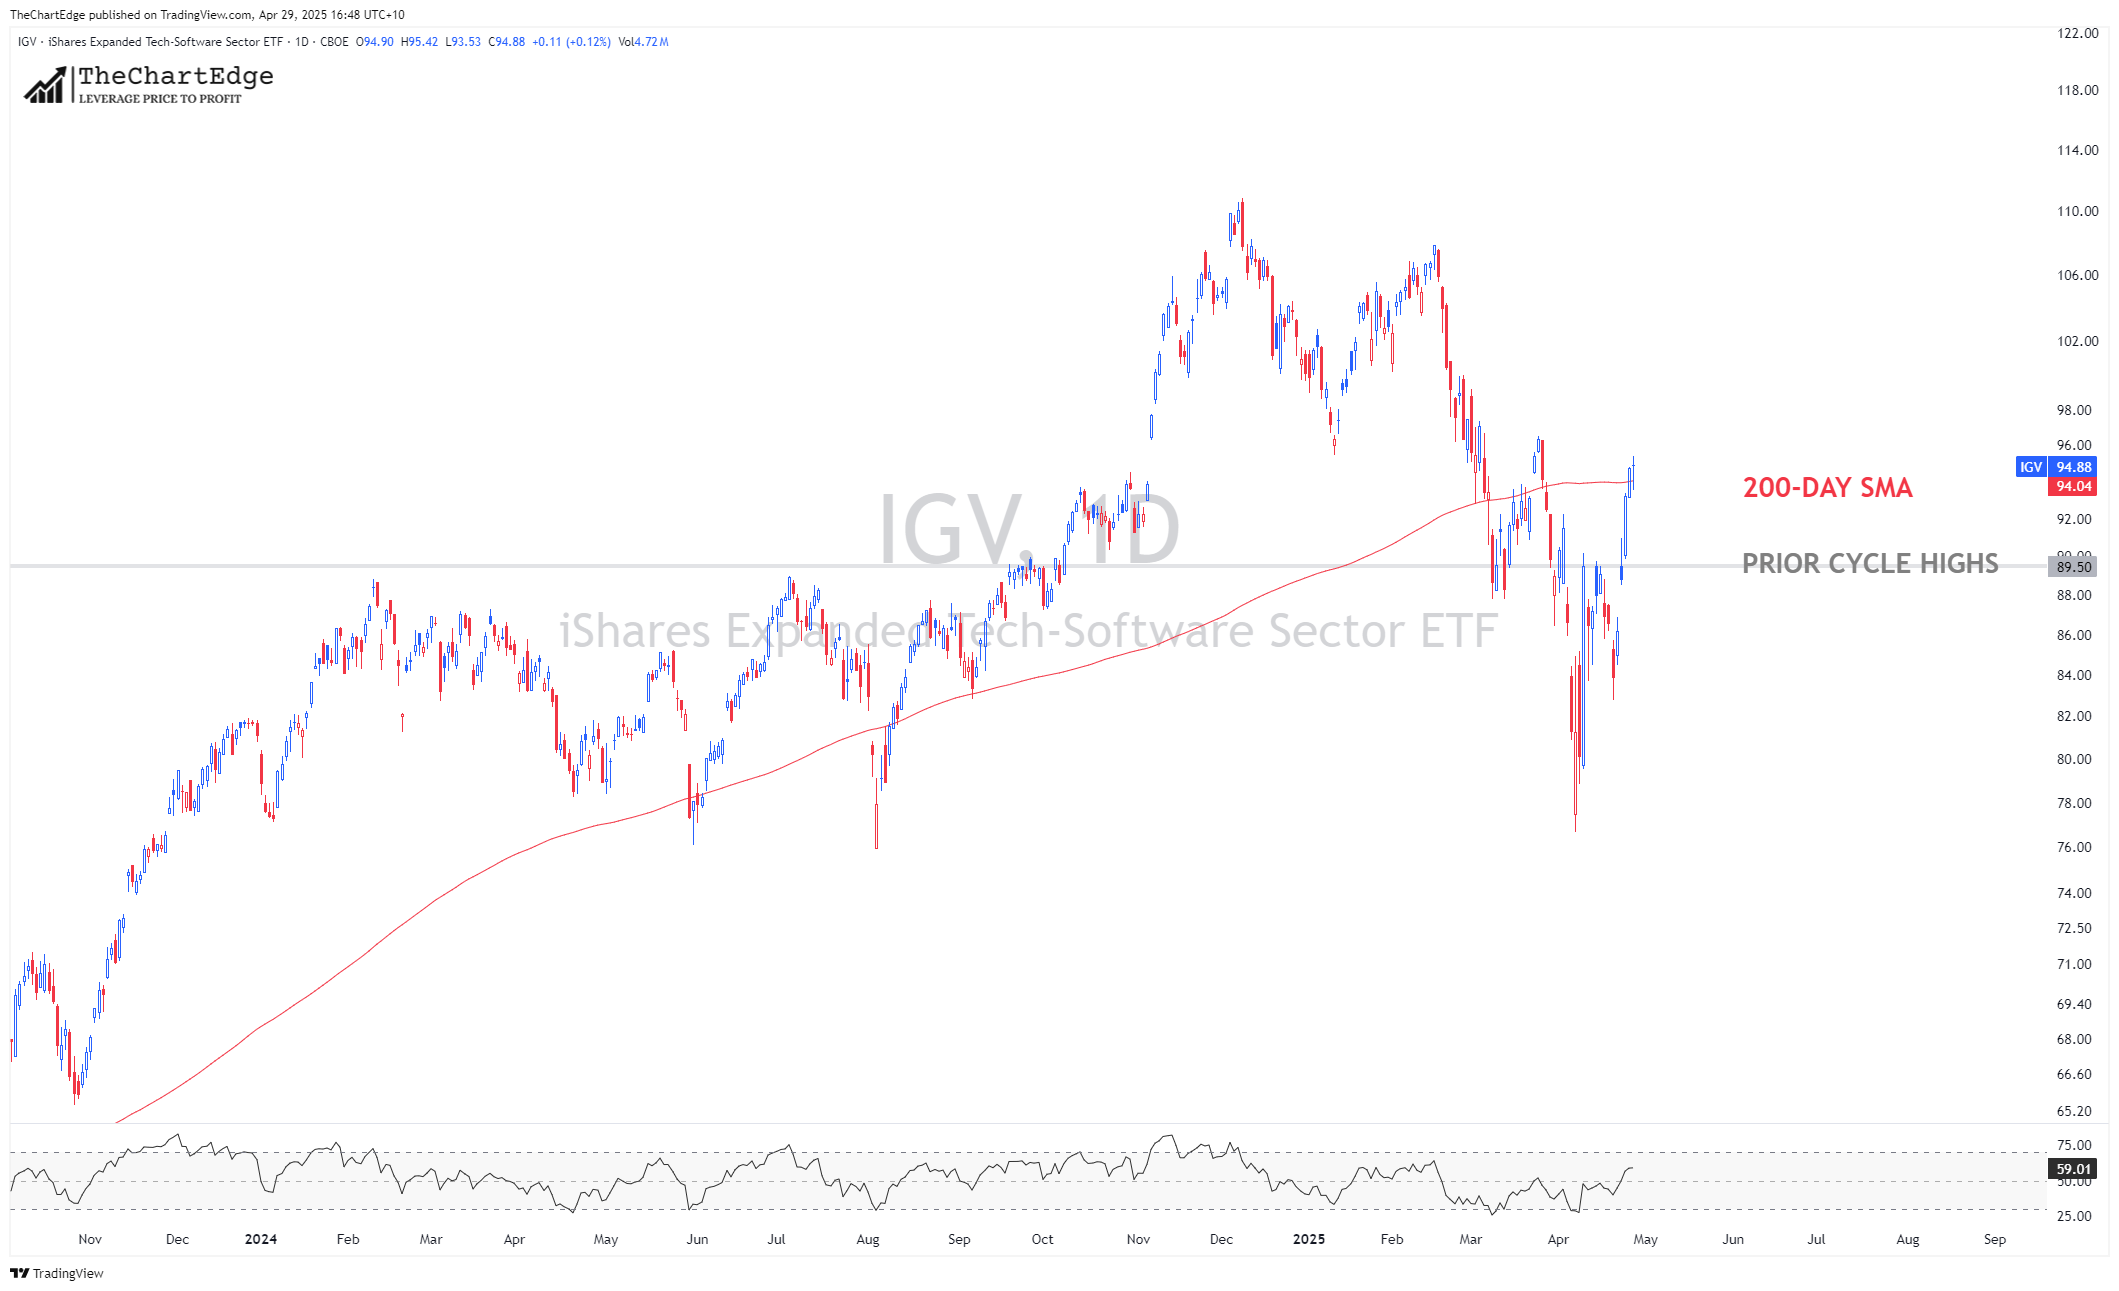
Tech Software sector ETF IGV has had a nice bounce and reclaimed the prior cycle highs and its 200-day SMA. It still has some work to do though.
Now some not so good-looking charts.
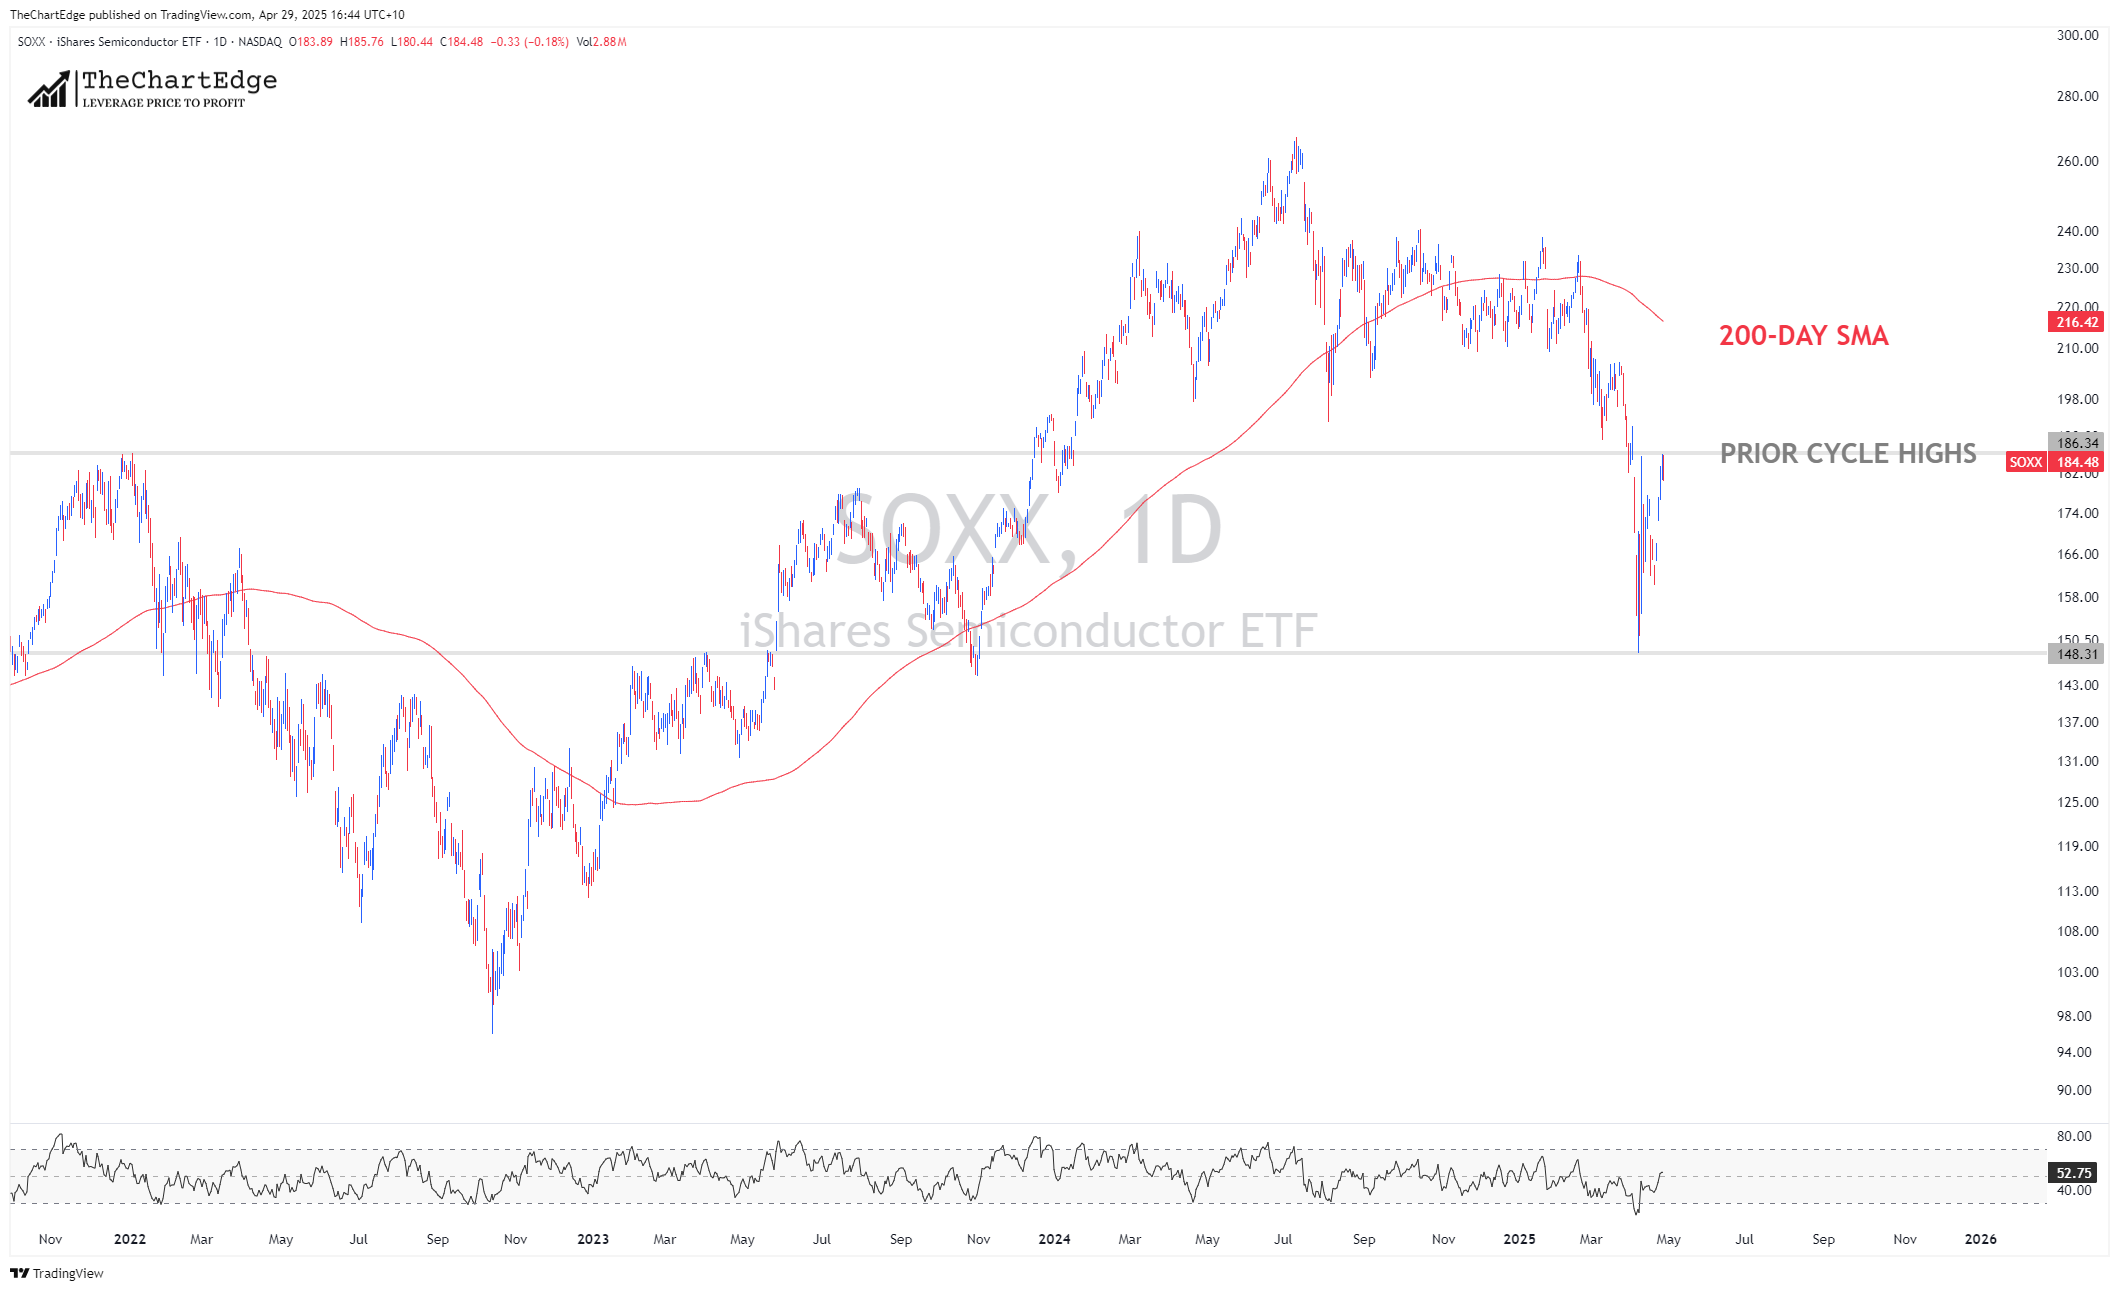
Semiconductor ETF SOXX broke down from a large topping pattern in late February and lost its prior cycle highs in the recent decline. It has bounced and sits just below that level now. It has a lot more overhead supply to get through if it is to make new highs.
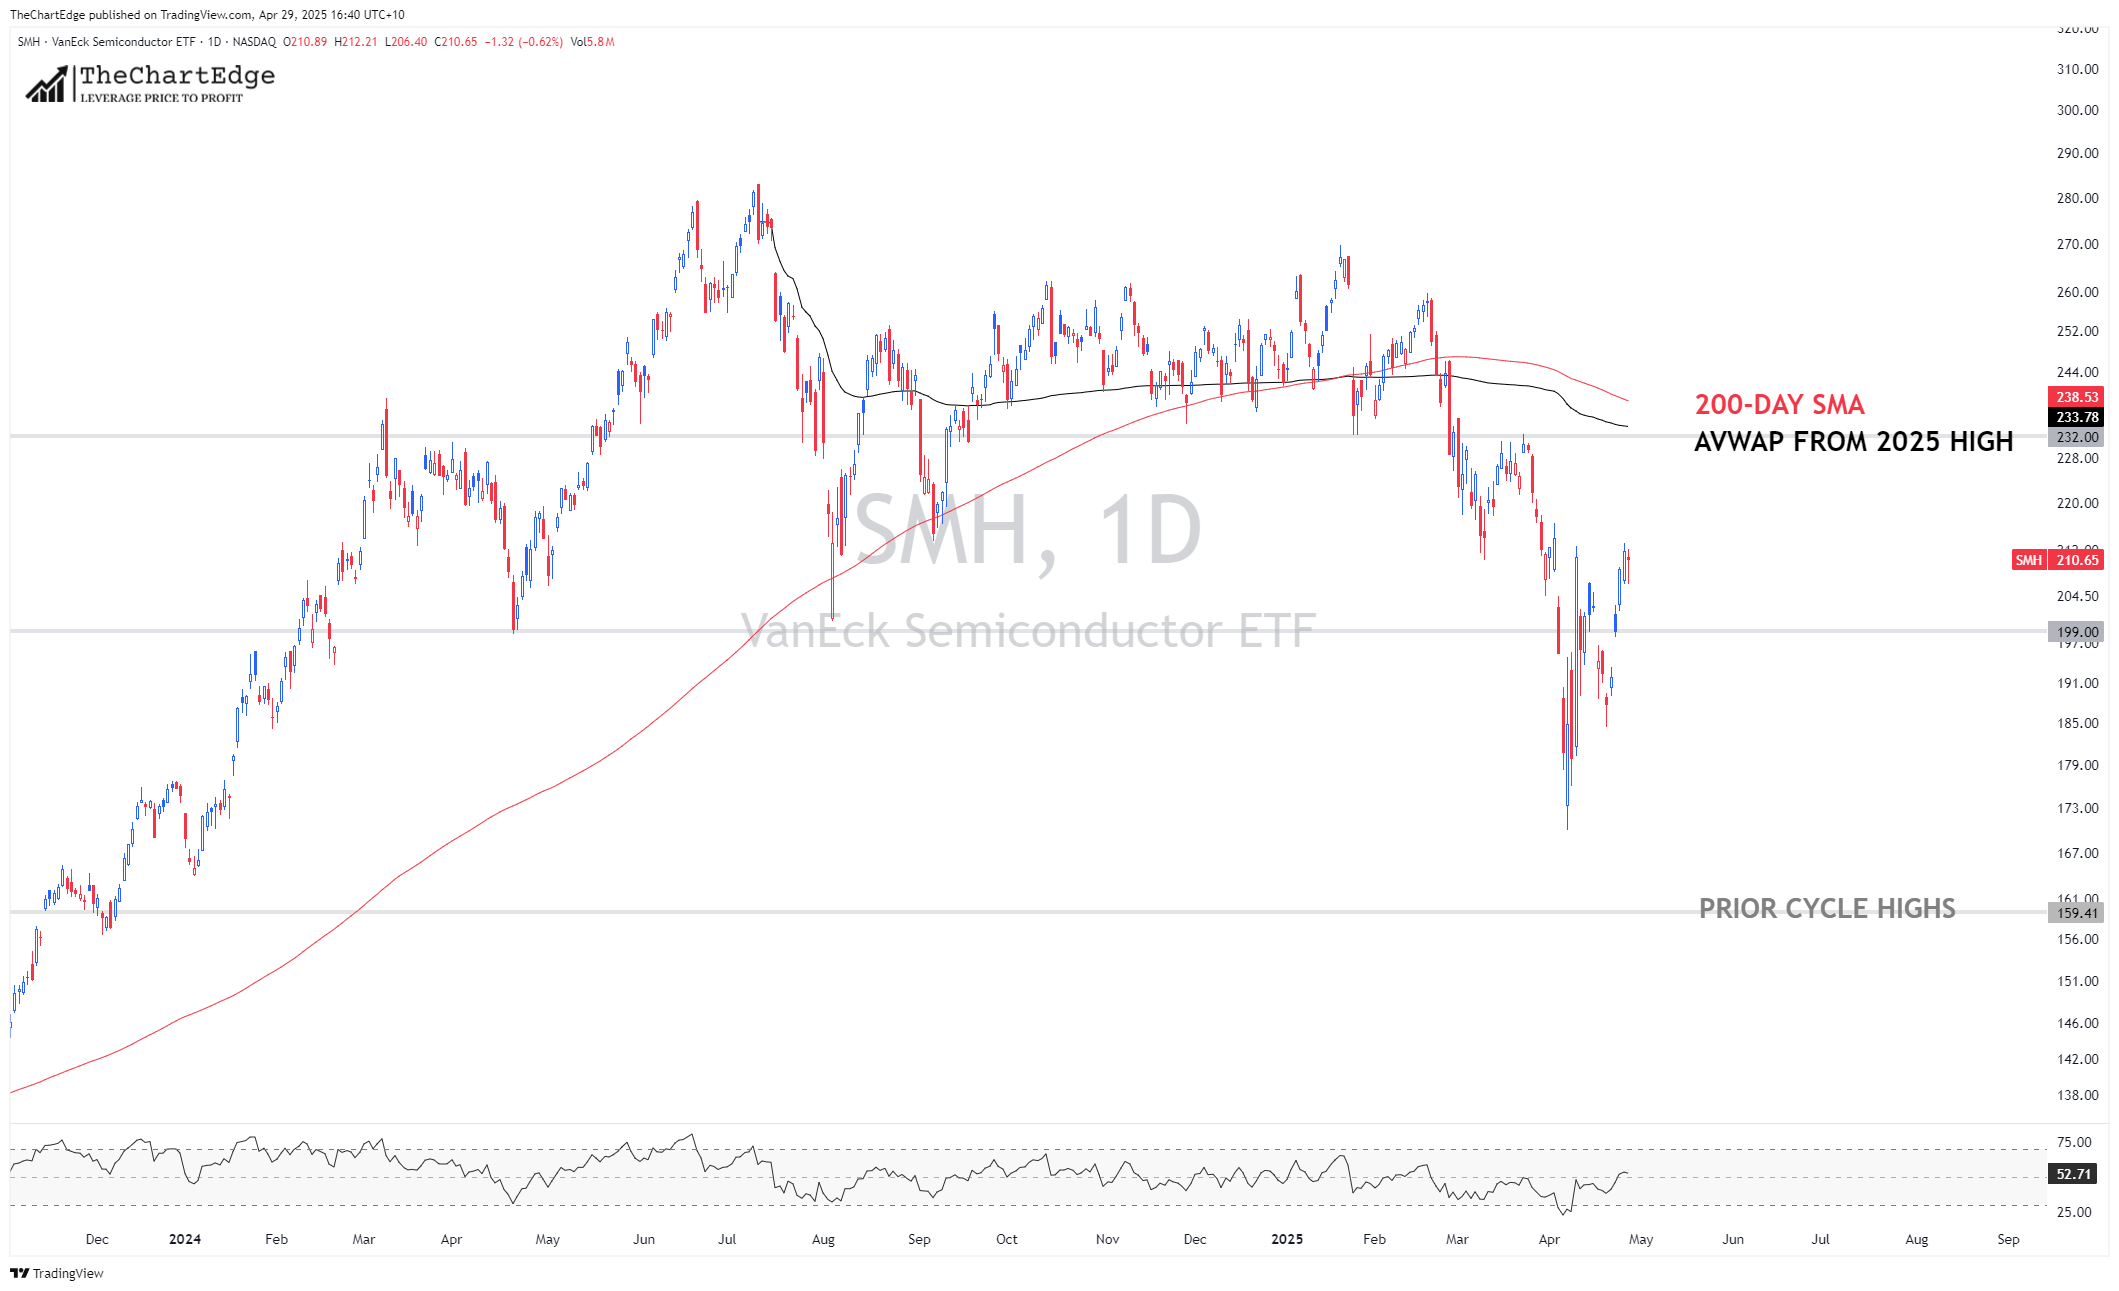
Semiconductor ETF SMH looks better than SOXX but also has a lot of overhead supply.
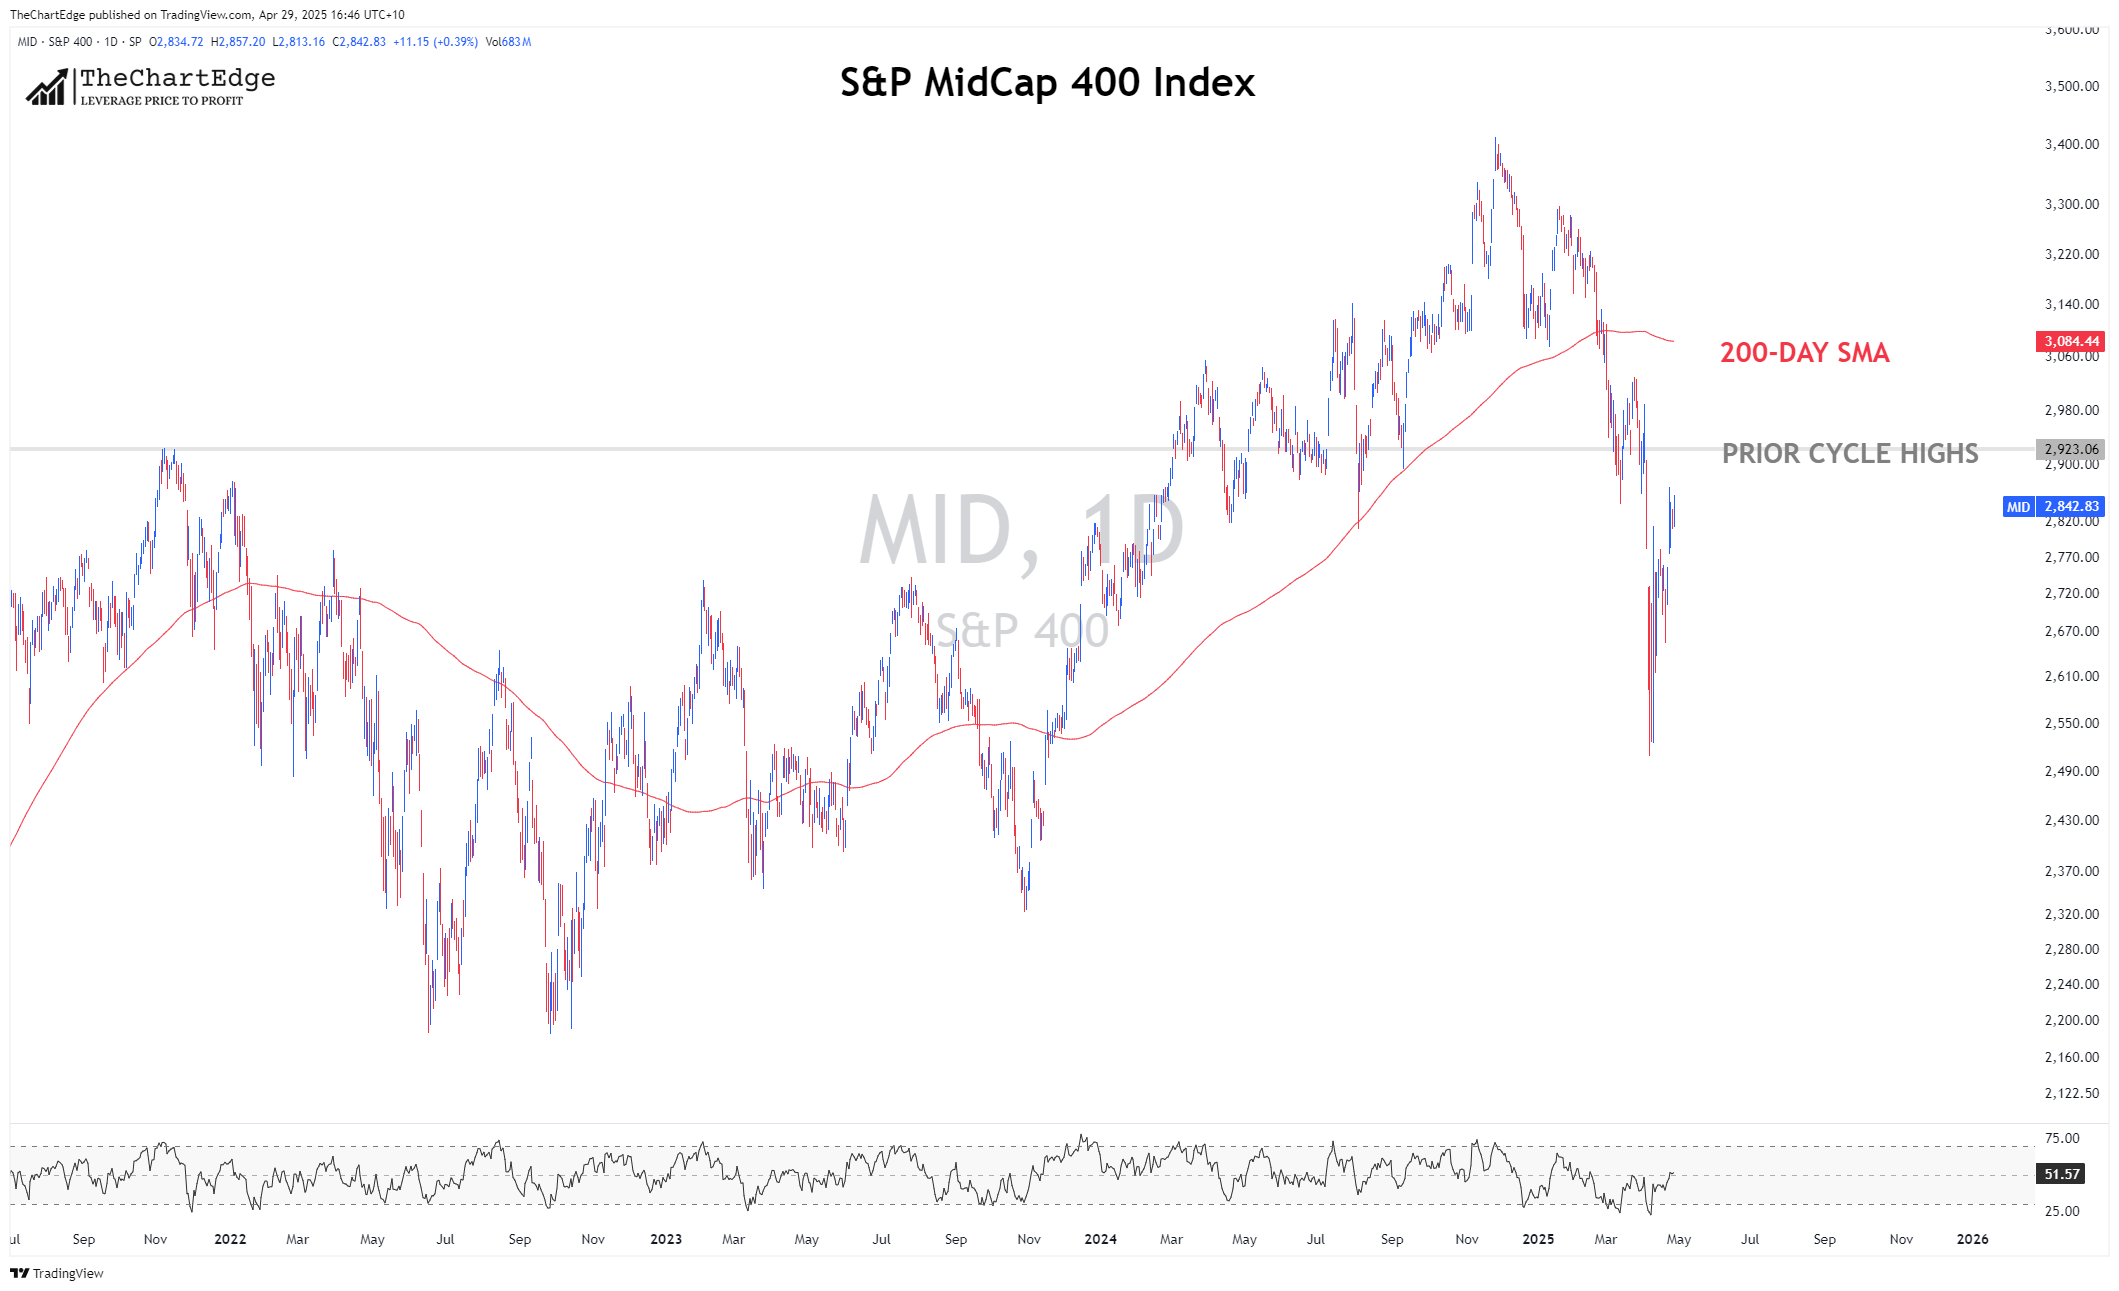
The S&P MidCap 400 Index is below its prior cycle highs with a lot of overhead supply.
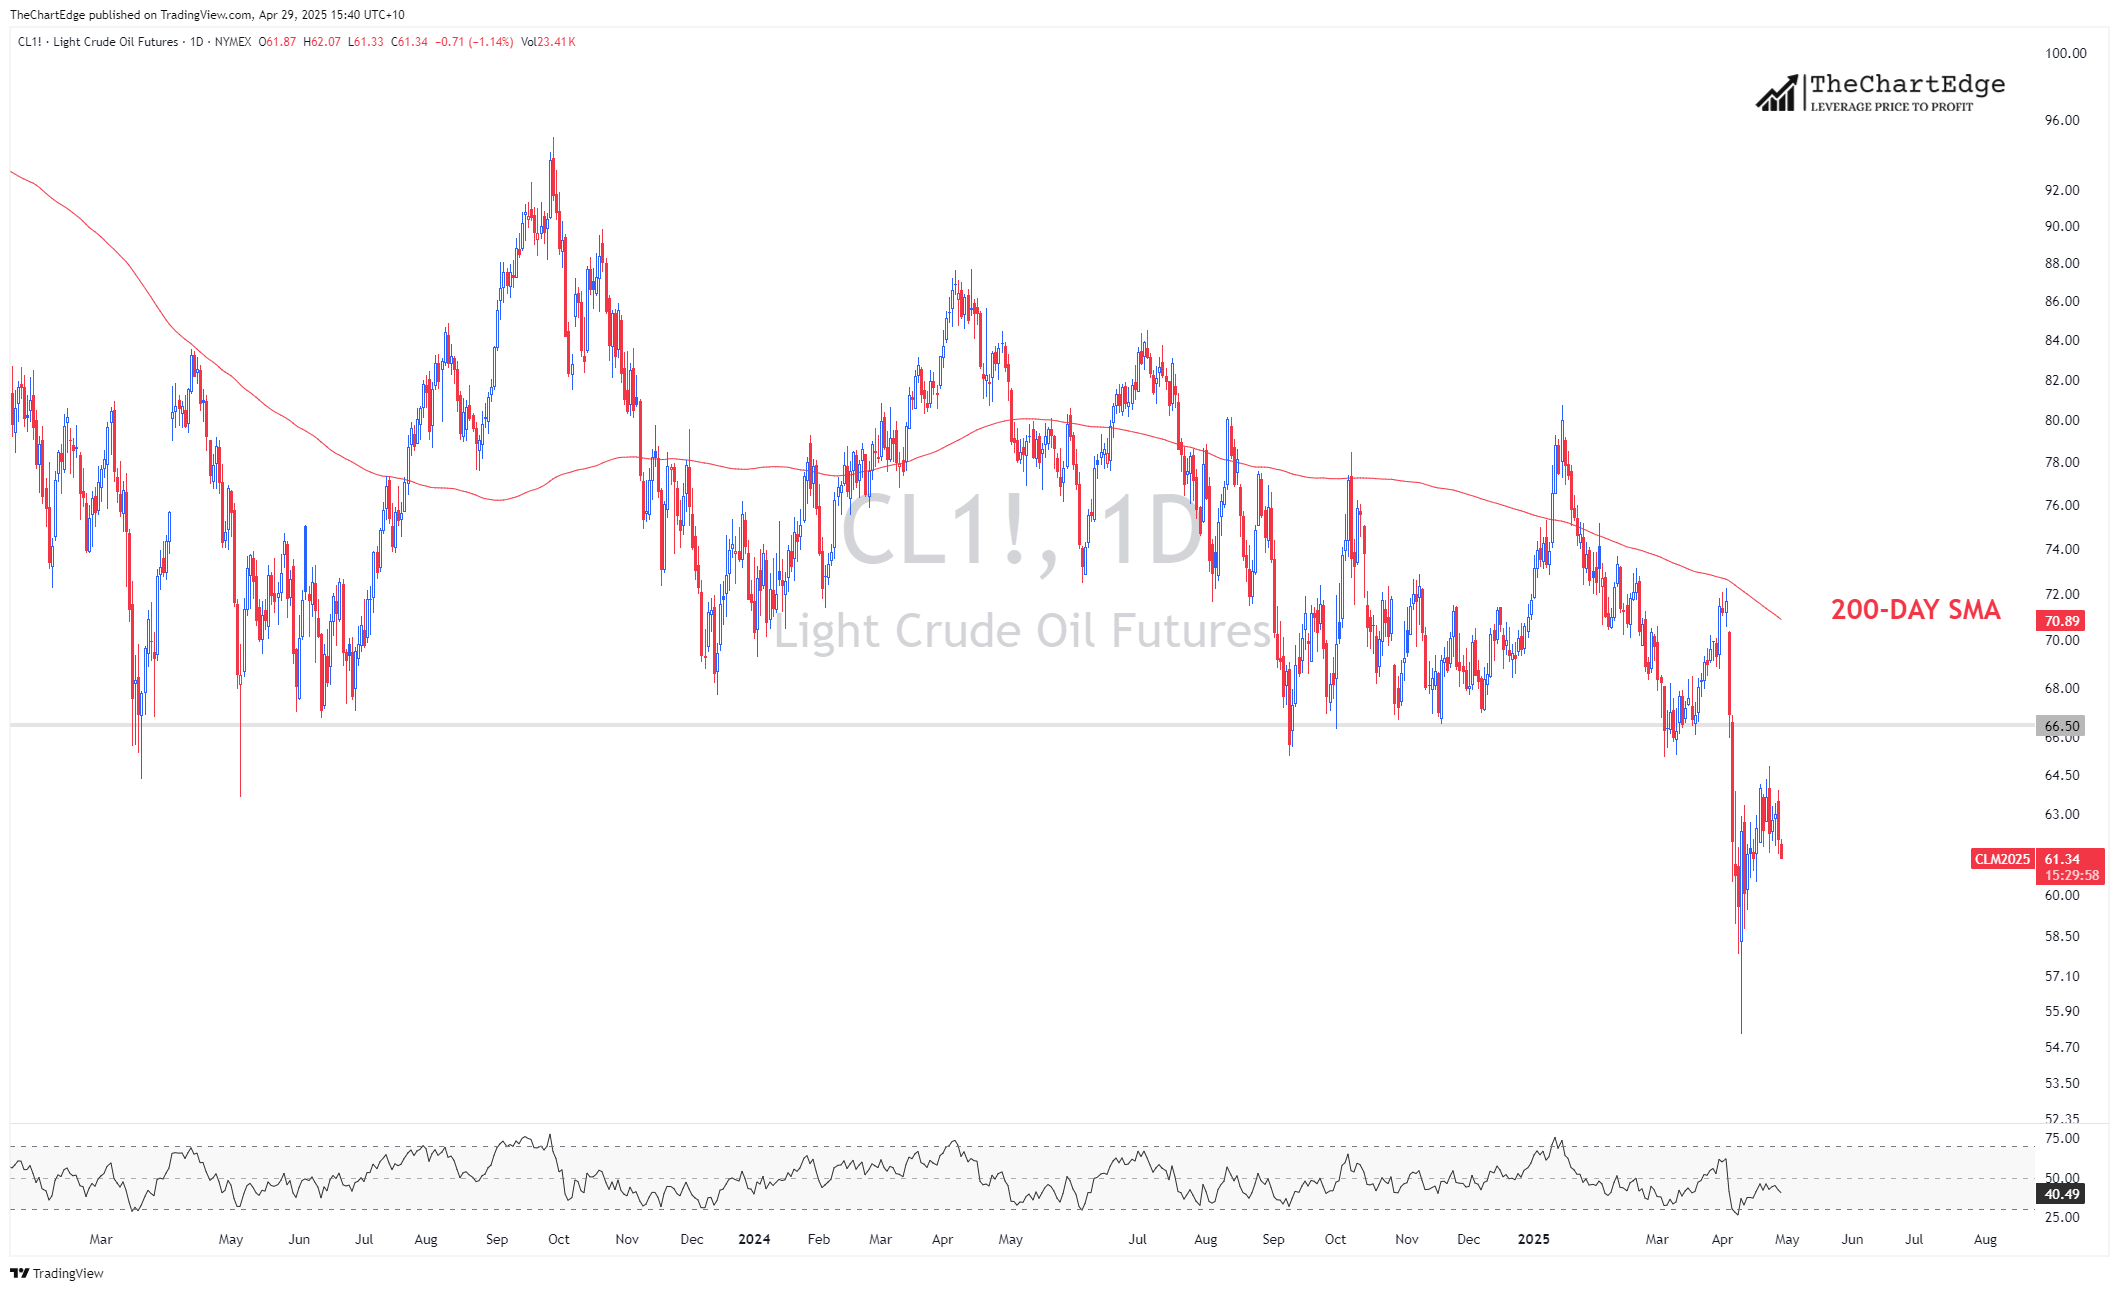
Oil has broken down, which is probably not a good sign for global growth.
Lastly these ratio charts I showed in a previous post are still below prior support. It will be difficult for the S&P 500 to go on to new highs, without tech and semis participating, if not leading.
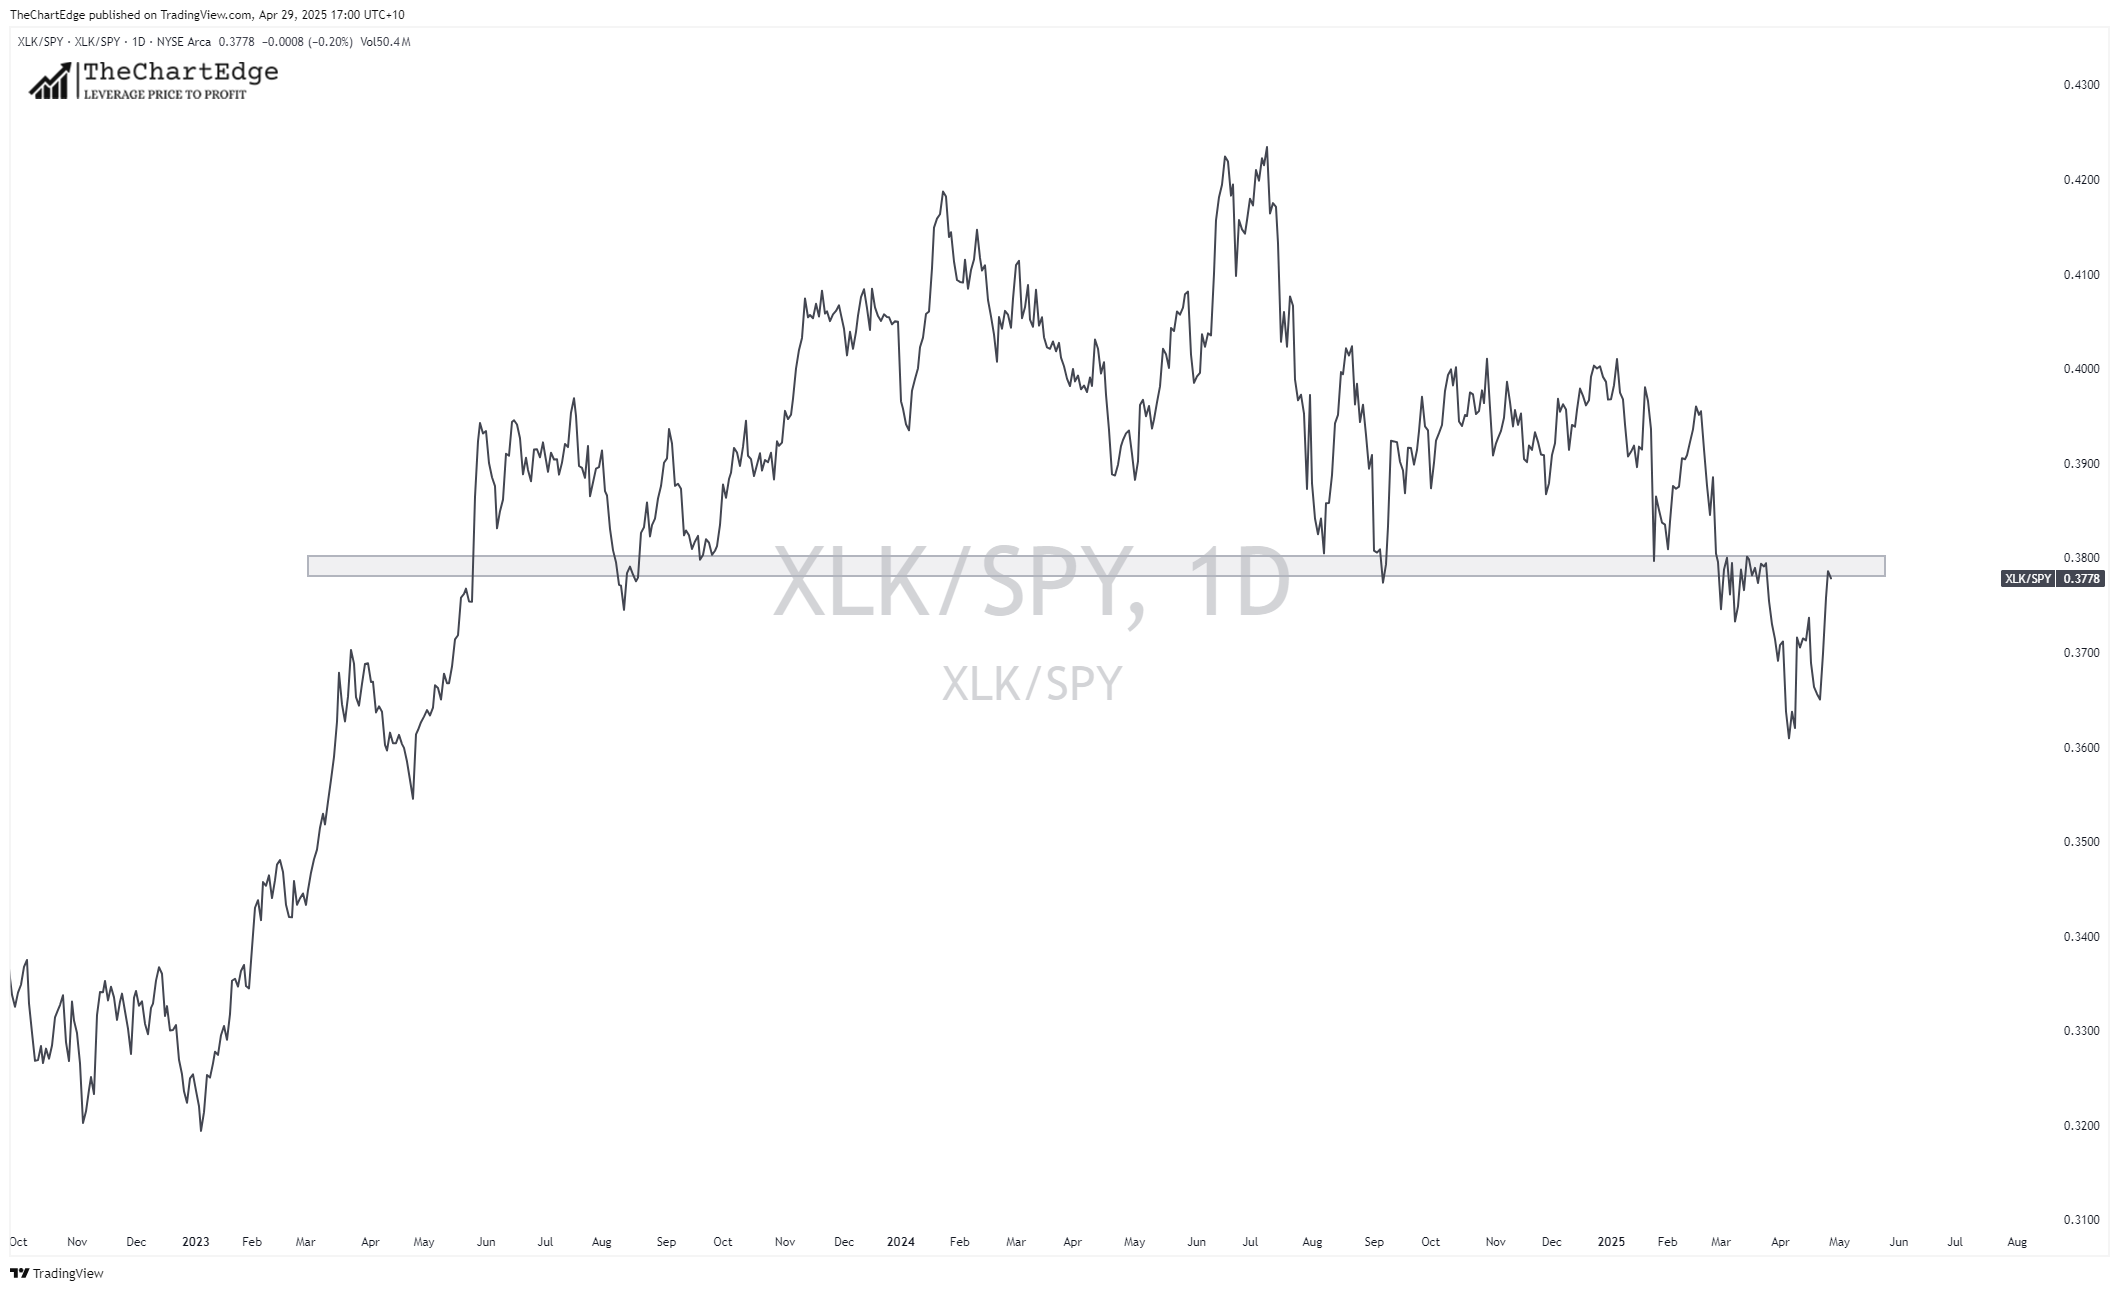
Tech (XLK) relative to SPY.
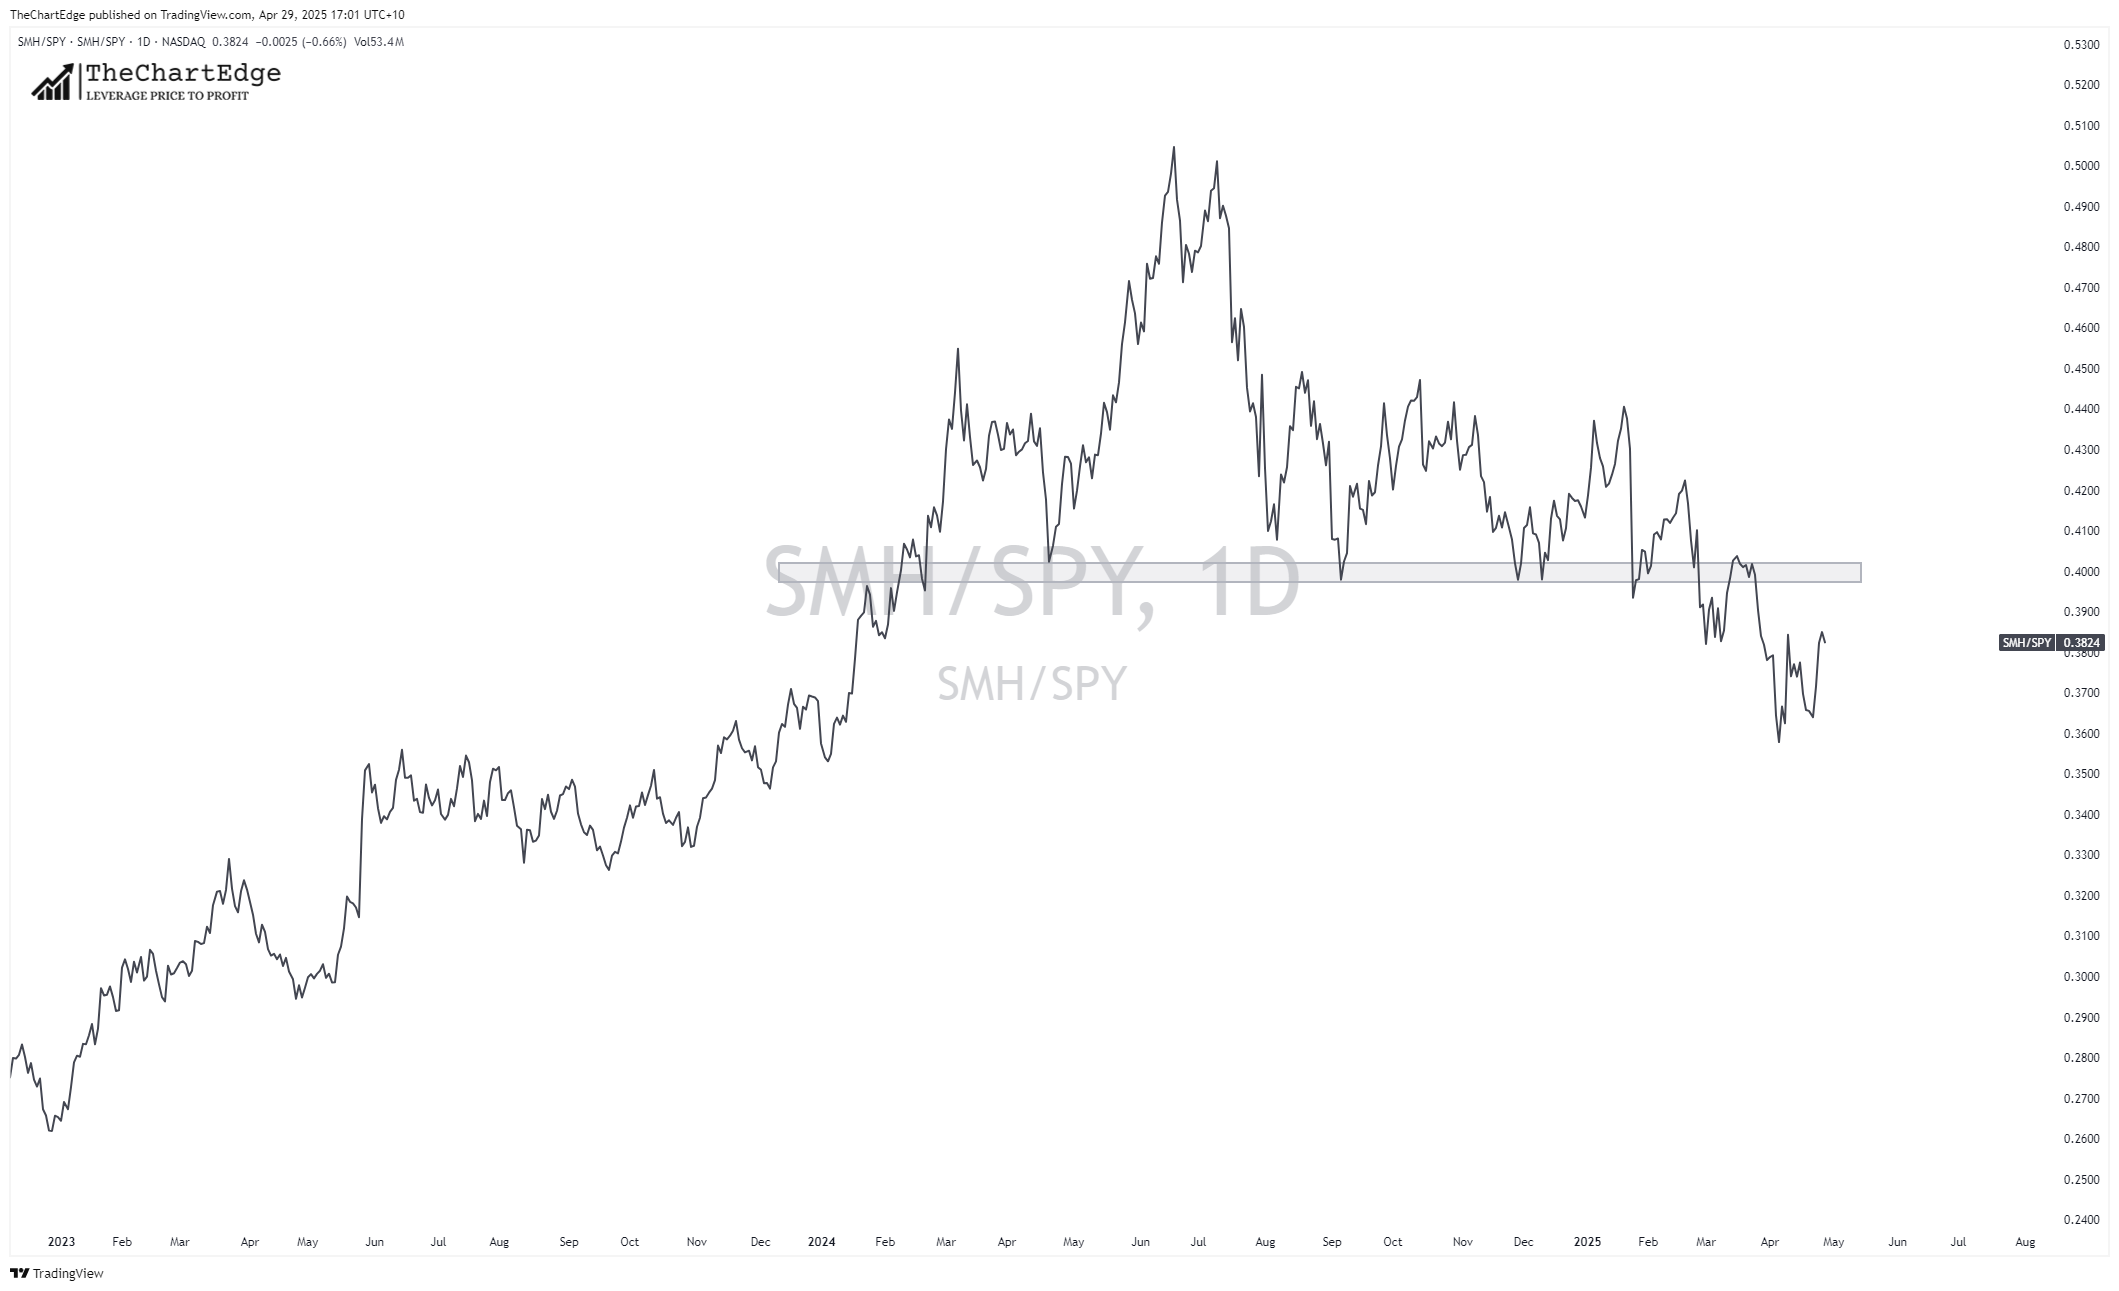
Semis (SMH) relative to SPY.
In conclusion I remain cautious with so much overhead supply in most markets. I wouldn’t be surprised to see the S&P 500 make a lower high somewhere below its 200-day SMA. If that occurs, I will be watching 5340-5380, to see if it can make a higher low in or above this area. If it can’t I think the probability of a retest of the lows increases. However as always, I will remain open minded and react to the price action. If the US and China, make a deal regarding tariffs, markets will likely surge. Although I don’t think there is a high probability of a comprehensive deal in the near term, but hopefully I’m wrong.
Cheers,
Marcus Grant, CFTe
Disclaimer: The content provided in this newsletter is for informational and educational purposes only and should not be considered as financial, investment, or legal advice. The information shared is based on our research and analysis, but we are not a licensed financial advisor, nor can we guarantee its accuracy, completeness, or timeliness. Market conditions and financial instruments can change rapidly, and any opinions expressed may not be suitable for all investors. Any opinions expressed and or securities mentioned do not constitute a recommendation to buy, sell, or hold that or any other security. You should conduct your own due diligence and consult with a licensed financial advisor or other professional before making any investment decisions. Past performance is not indicative of future results, and all investments carry the risk of loss. The authors and publishers of this newsletter are not responsible for any financial decisions made based on the content provided herein. By reading and or subscribing to this newsletter, you acknowledge and agree that you are using the information at your own risk.