


Everything below is as of Friday’s close (ending July 31).
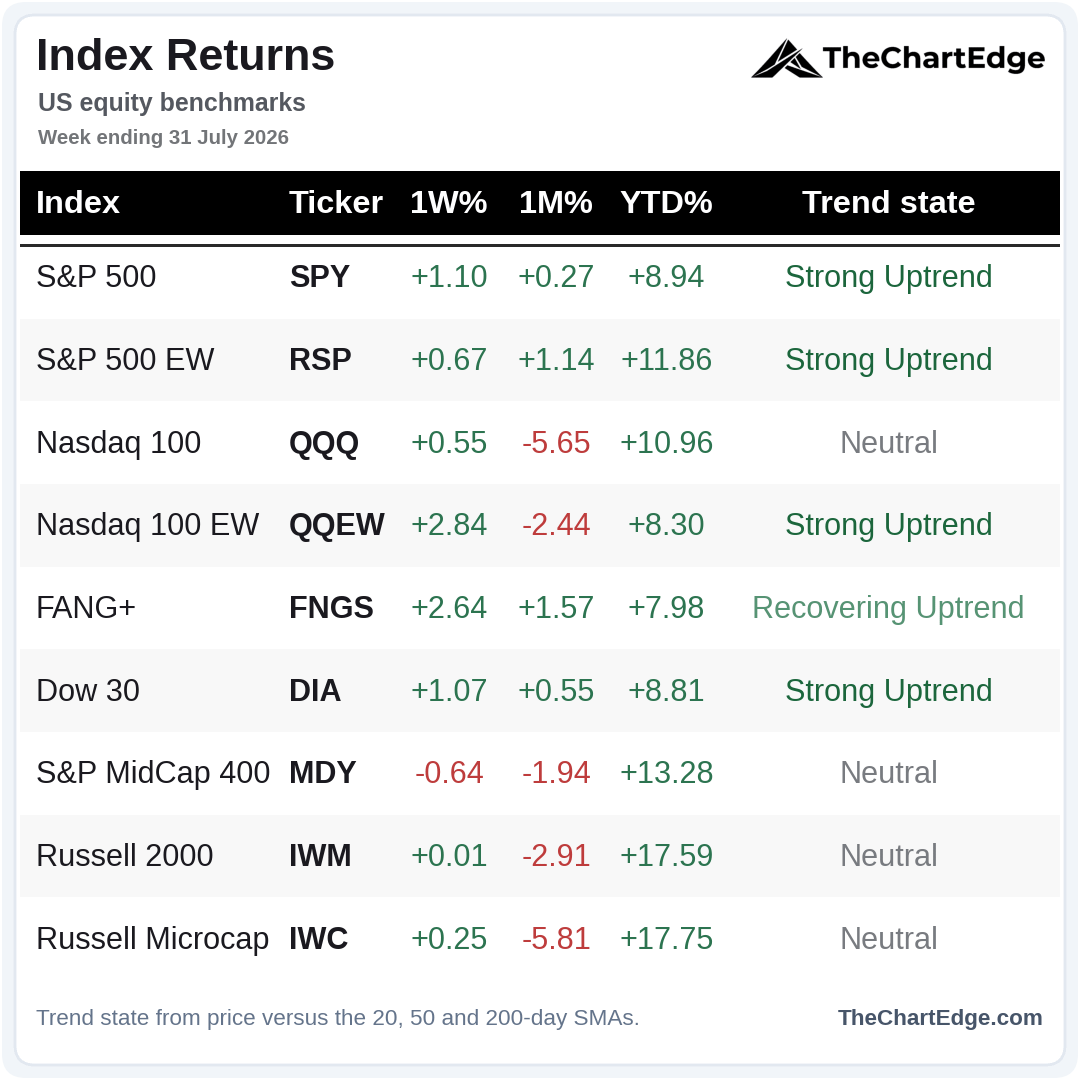
Of the major indices I track, only the S&P Mid-Cap 400 finished the week lower. Interestingly the equal-weight Nasdaq 100 (QQEW) outperformed the cap-weighted index by more than 2%.
SPY Chart
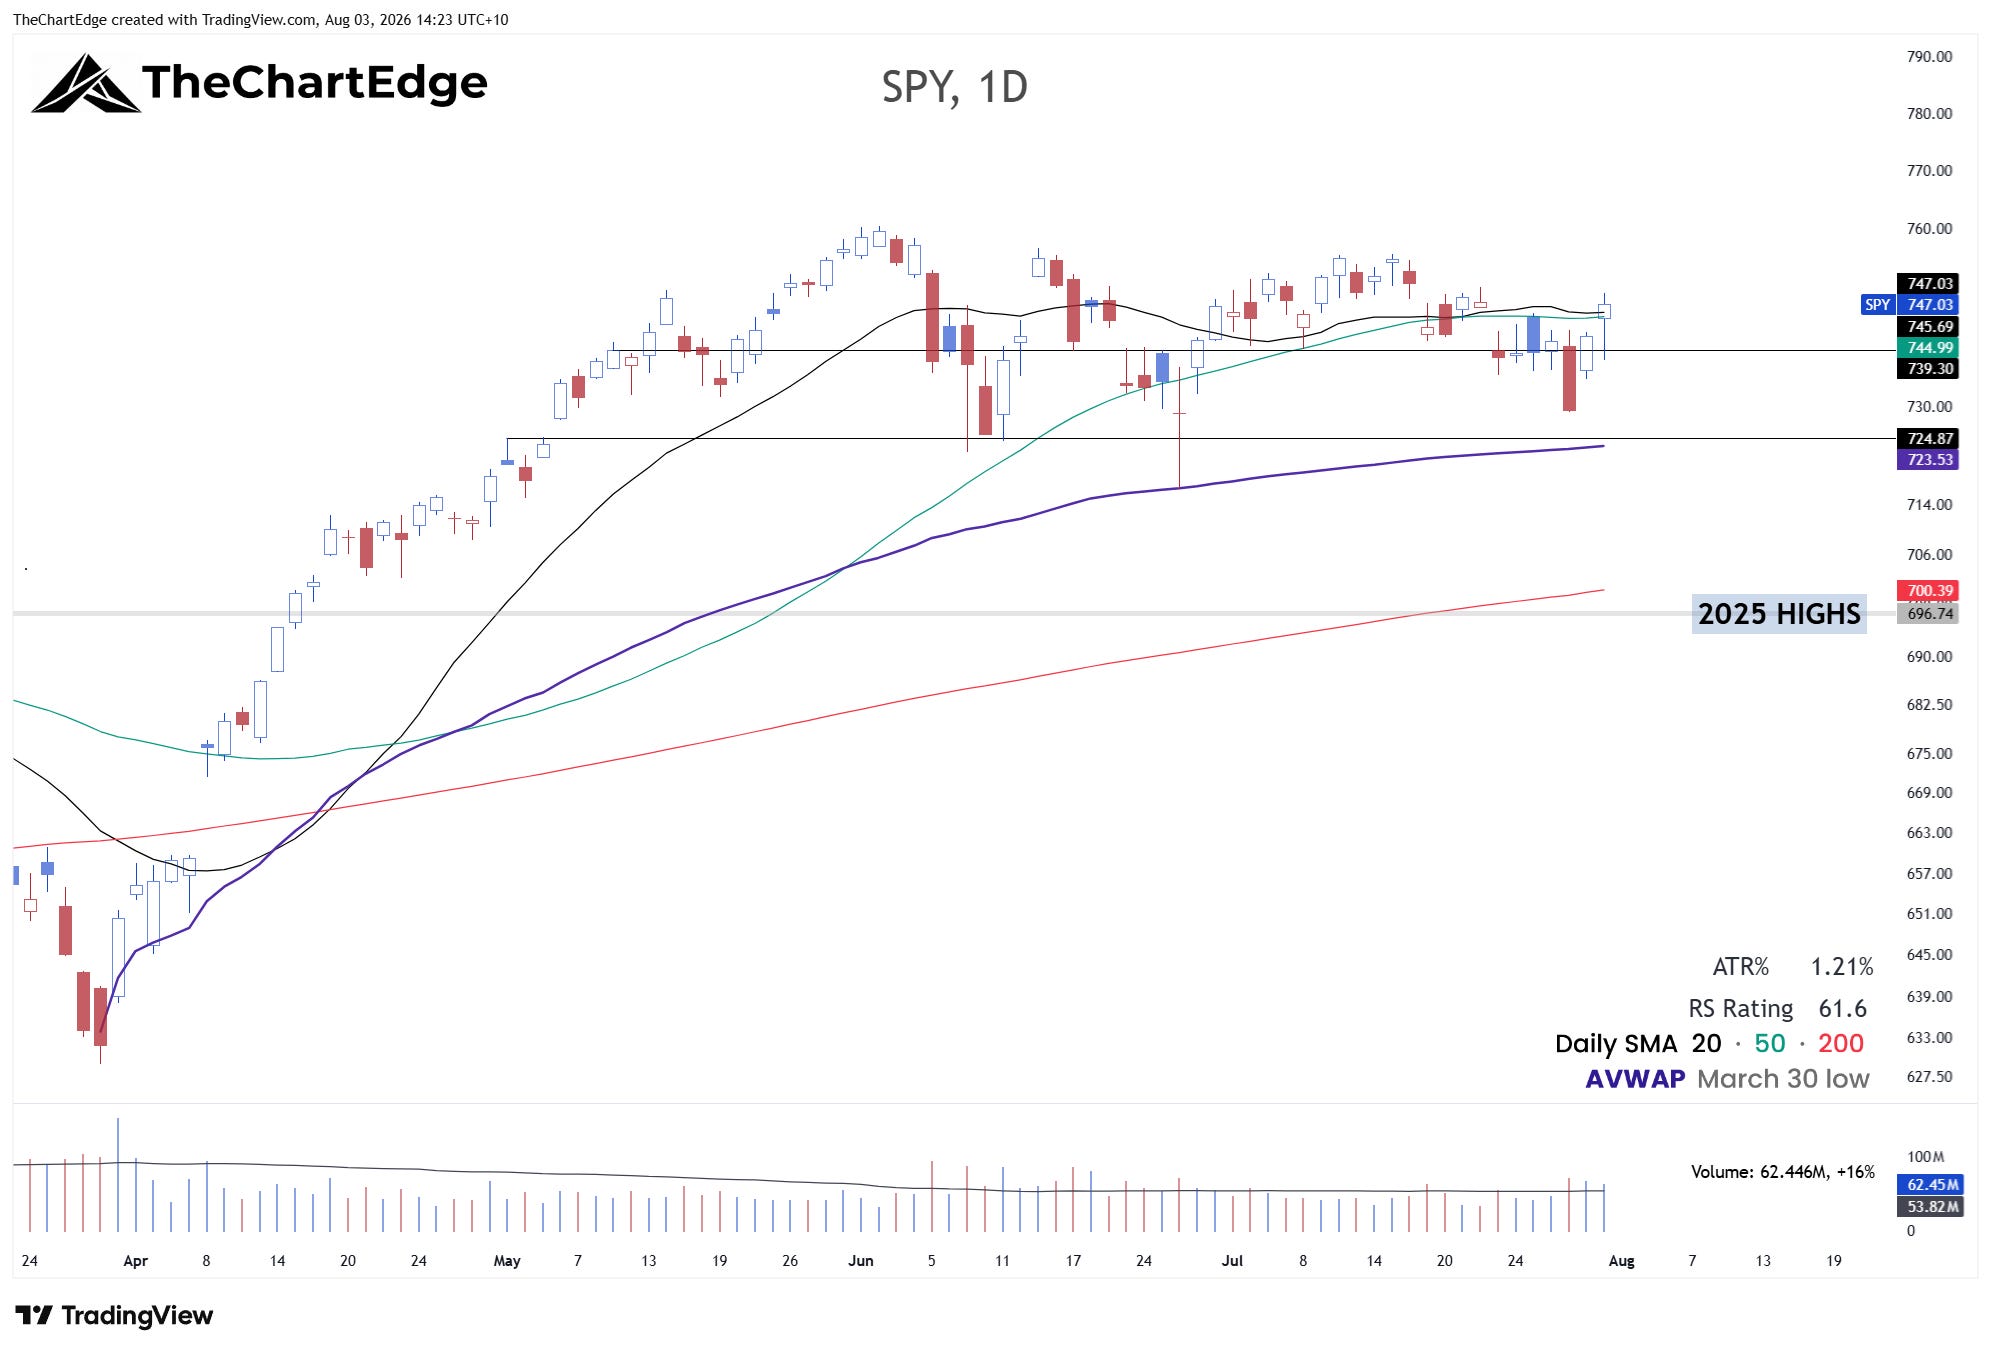
SPY closed above its 20-day SMA on Friday, which is what turned its trend state back to a Strong Uptrend. However, it doesn’t look particularly convincing to me. Both the 20-day and 50-day SMAs are flat and bunched together within less than 0.5% of Friday’s close.
QQQ Chart
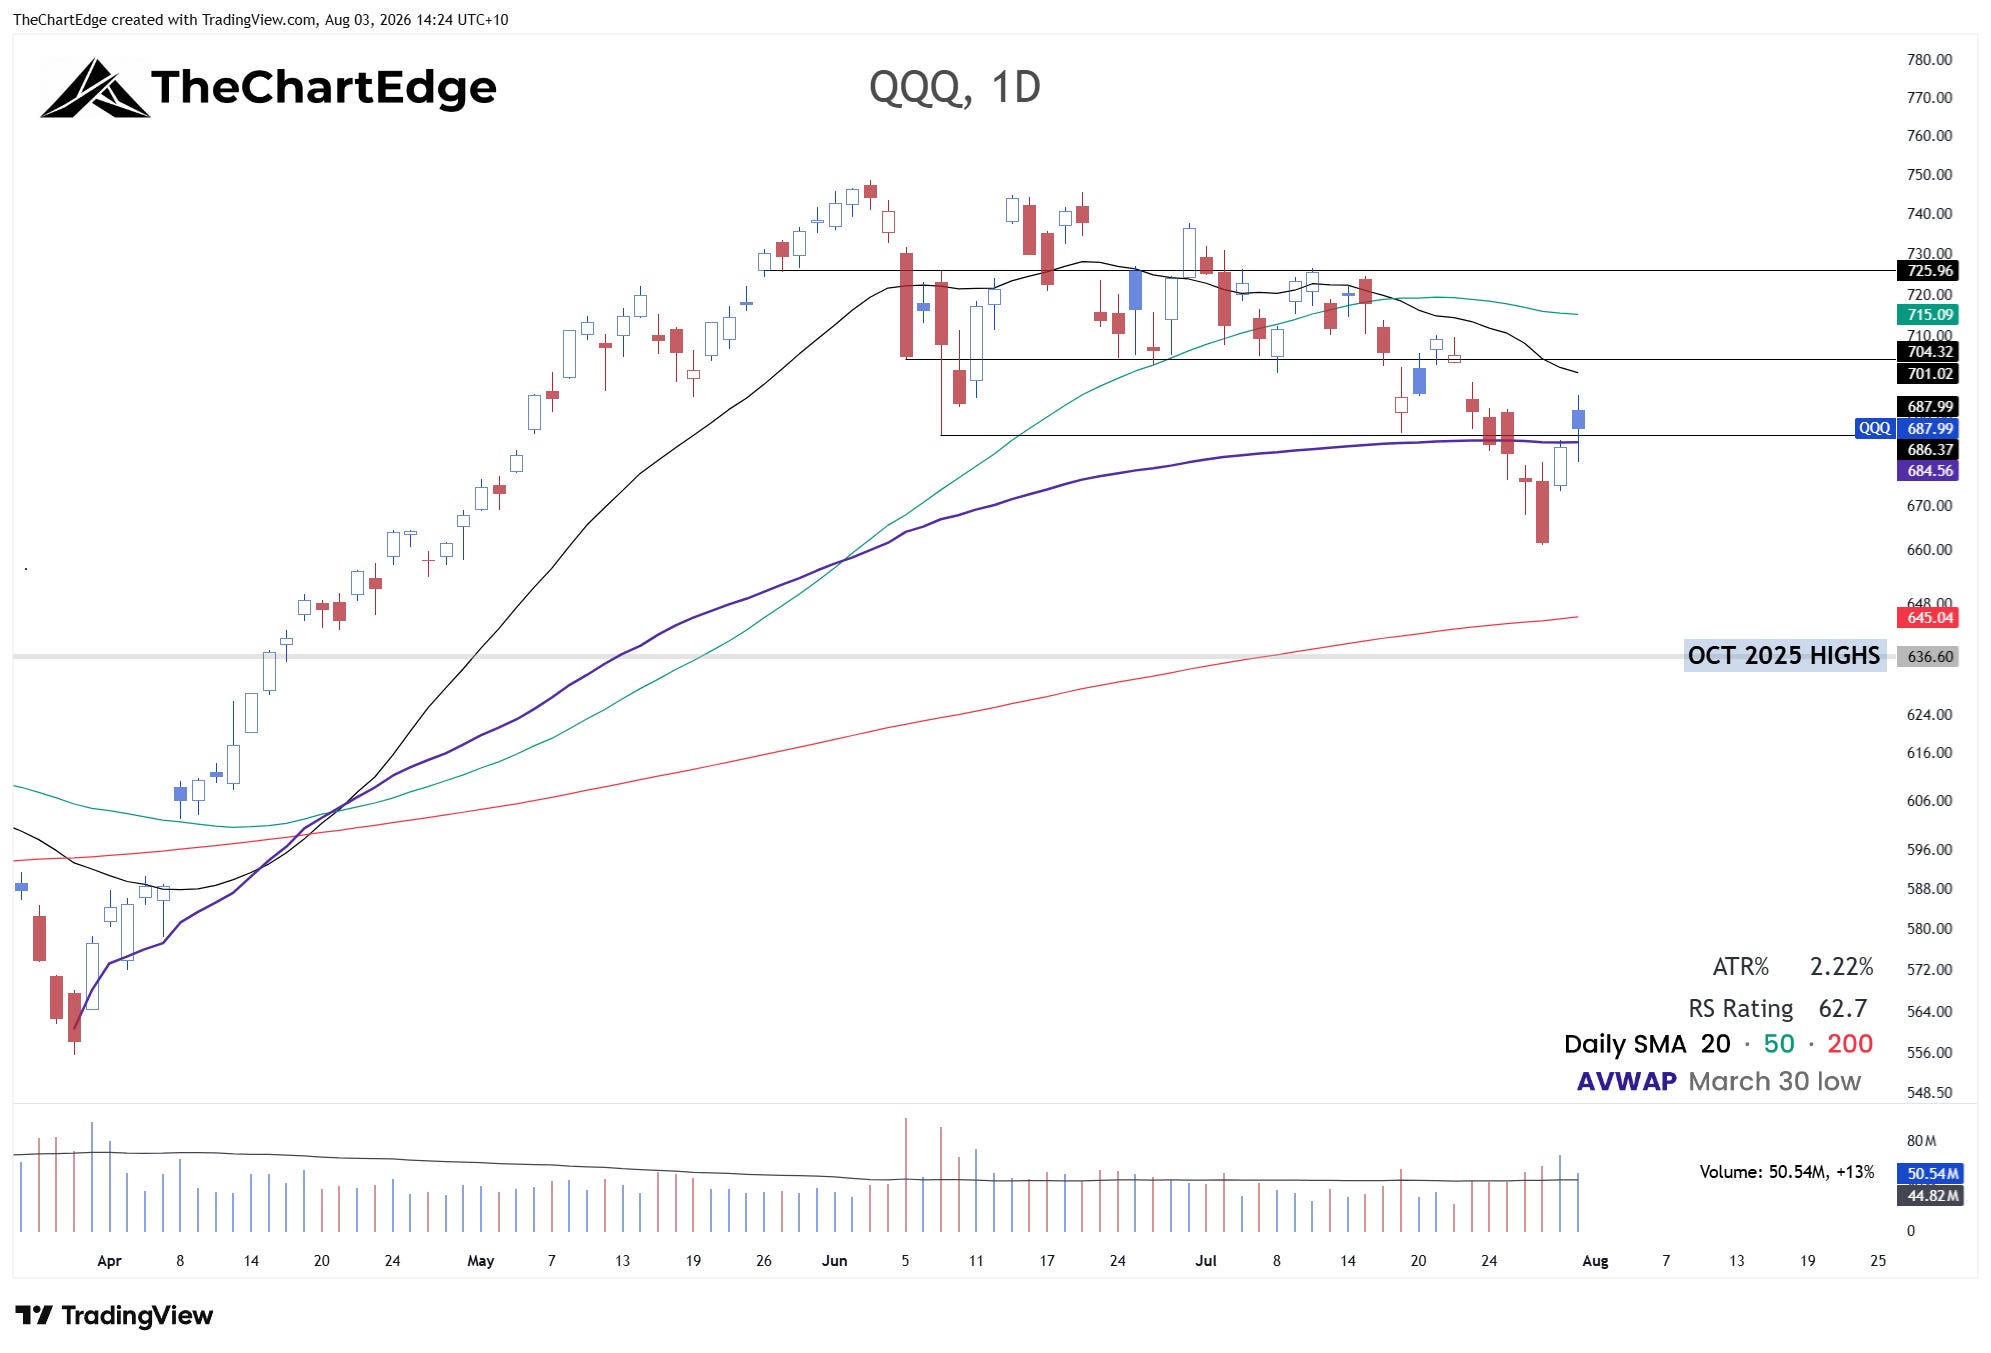
QQQ is still in Neutral and looks weak - making lower highs and lower lows, below its declining 20 and 50-day SMAs. The weekly close was back above the AVWAP from the March 30 low, but only just, as Friday’s gap up was sold into.
Market Temperature
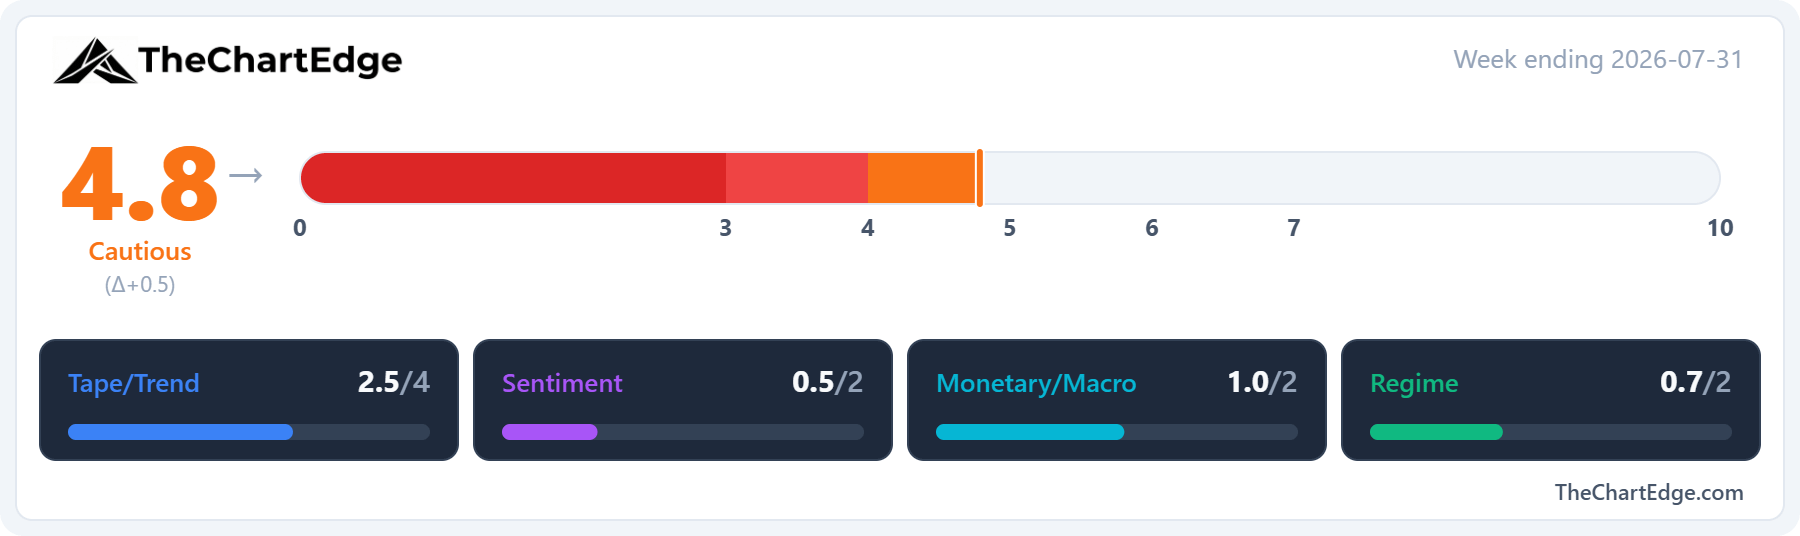
The Market Temperature came in at 4.8, up from 4.3, a third straight week in Cautious. The week-on-week move wasn’t quite big enough to change the direction reading, so it stays Cautious rather than upgrading to Improving.
Almost the entire change was due to SPY flipping back to a Strong Uptrend on Friday. The weekly RSI firmed slightly and breadth was little changed.
The MOVE index rose again, up 8.1% on the week. The level itself, around 83, isn’t at historically stressed levels, but the model looks at the four-week change and over that window it is up around 27%. The US dollar sold off, down over 1.5%, which offset the MOVE’s rise within the Monetary pillar, which ended up basically unchanged.
Interestingly, the VIX fell back to 16.0, from 18.6, which the model reads as a contrarian negative signal, thus the Sentiment pillar was down compared to last week.
GICS Sector Relative Strength
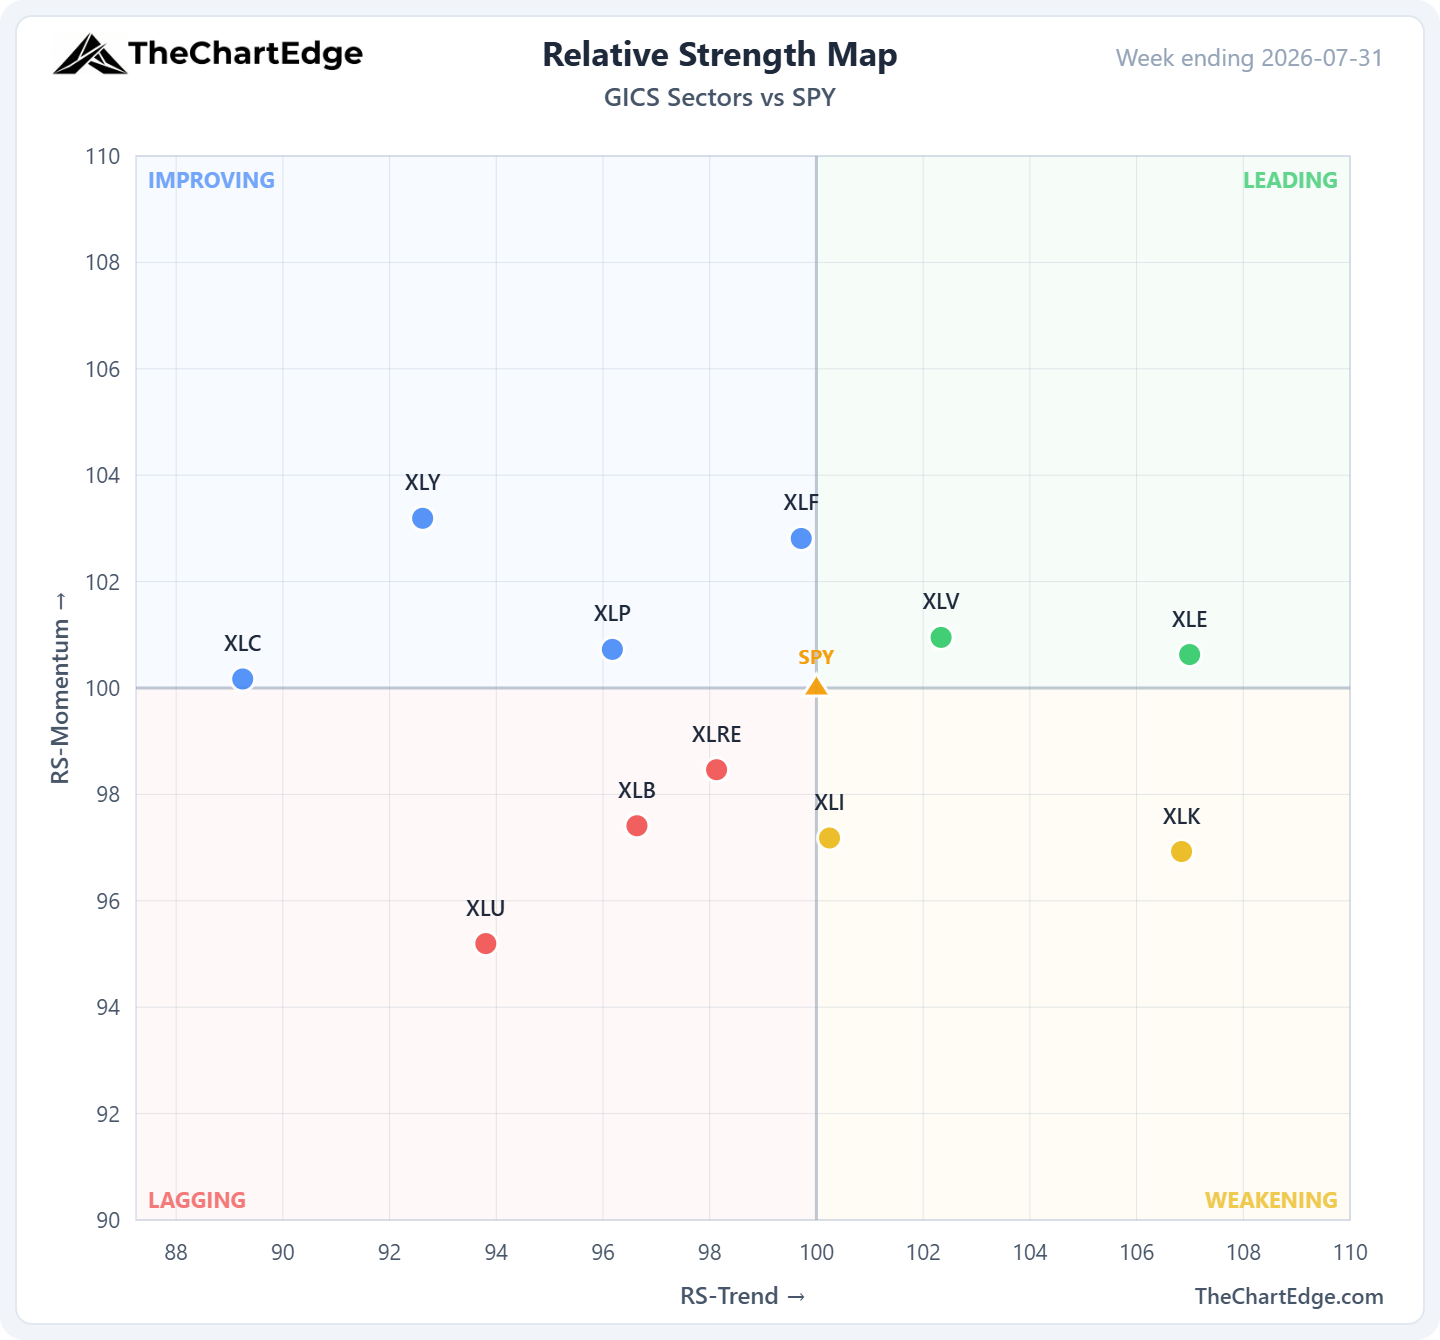
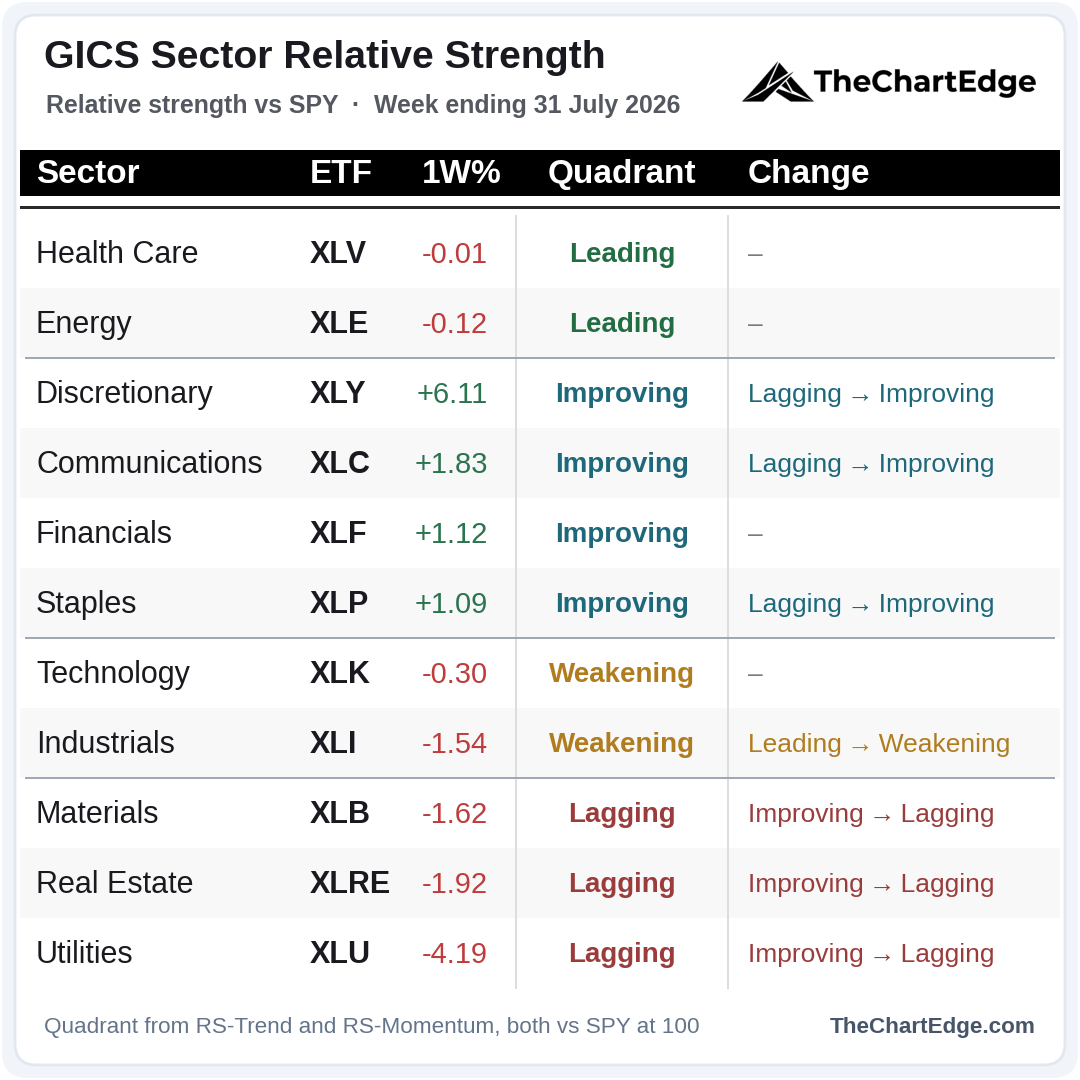
Only four of the eleven sectors finished the week higher, with discretionary up over 6% and utilities down over 4%. The Leading quadrant is now down to just healthcare and energy, as industrials fell out after falling 1.5% for the week.
Momentum Leaderboard
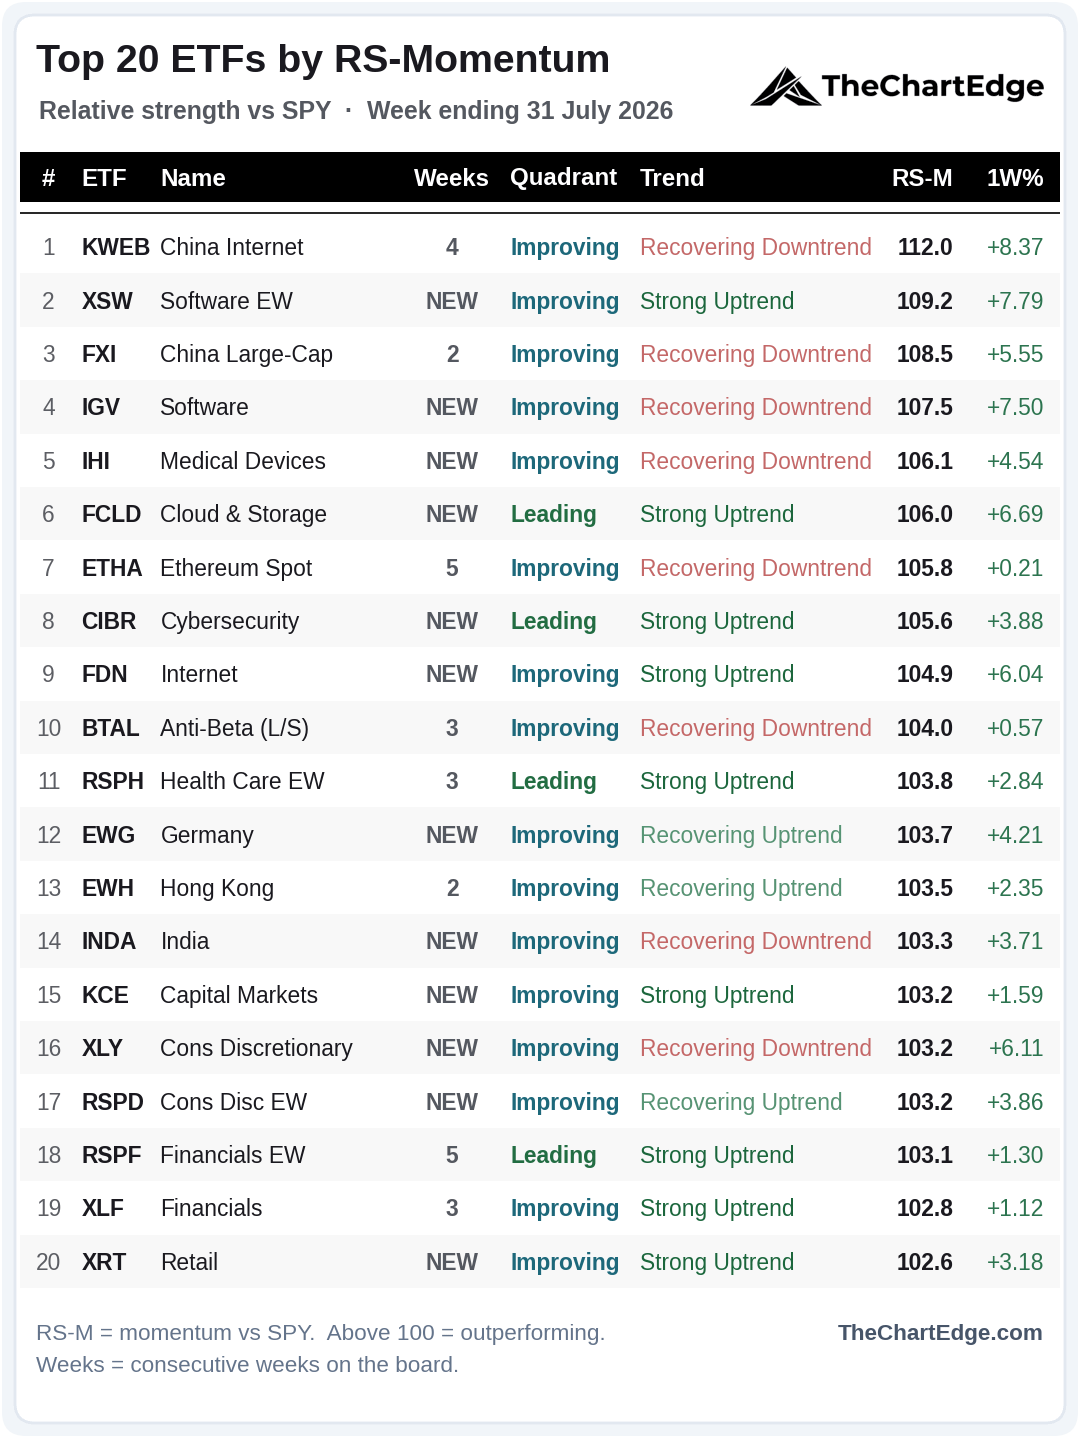
Twelve of the twenty are new this weekend. Software, internet and consumer names returned, and the energy related names all dropped off.
International names stood out - five of the twenty, with China Internet (KWEB) on top.
Six of the top ten in Recovering Downtrend states, and Anti-Beta (BTAL) on the board for a third straight week at number ten, speak to the current state of the market.
Trend States Across the Universe
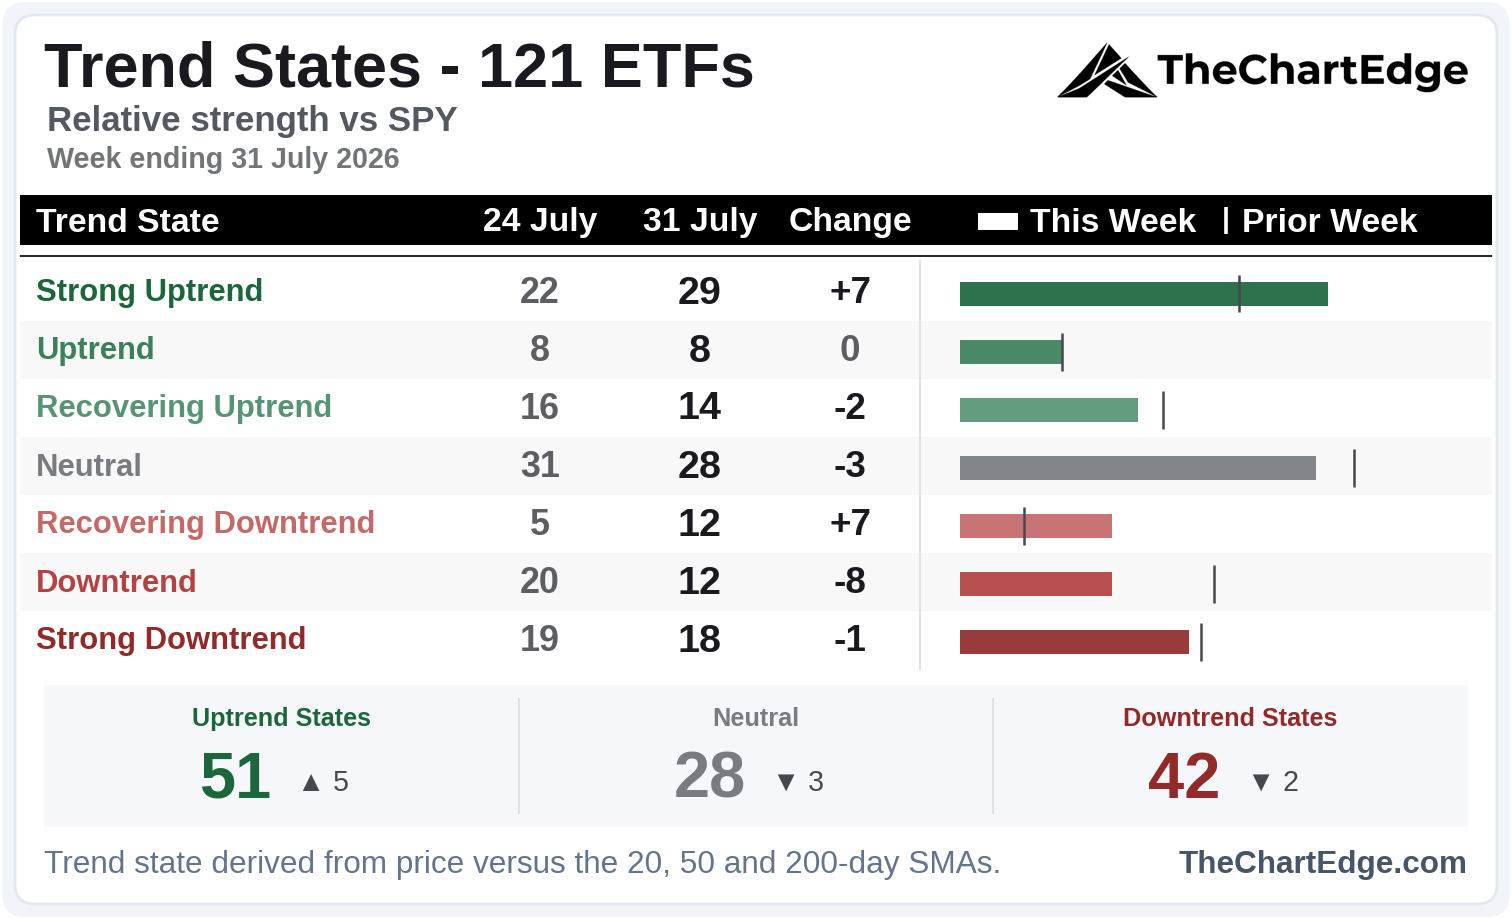
Some improvement this weekend with more Strong Uptrends, and fewer Downtrends and Strong Downtrends.
Industry Breadth
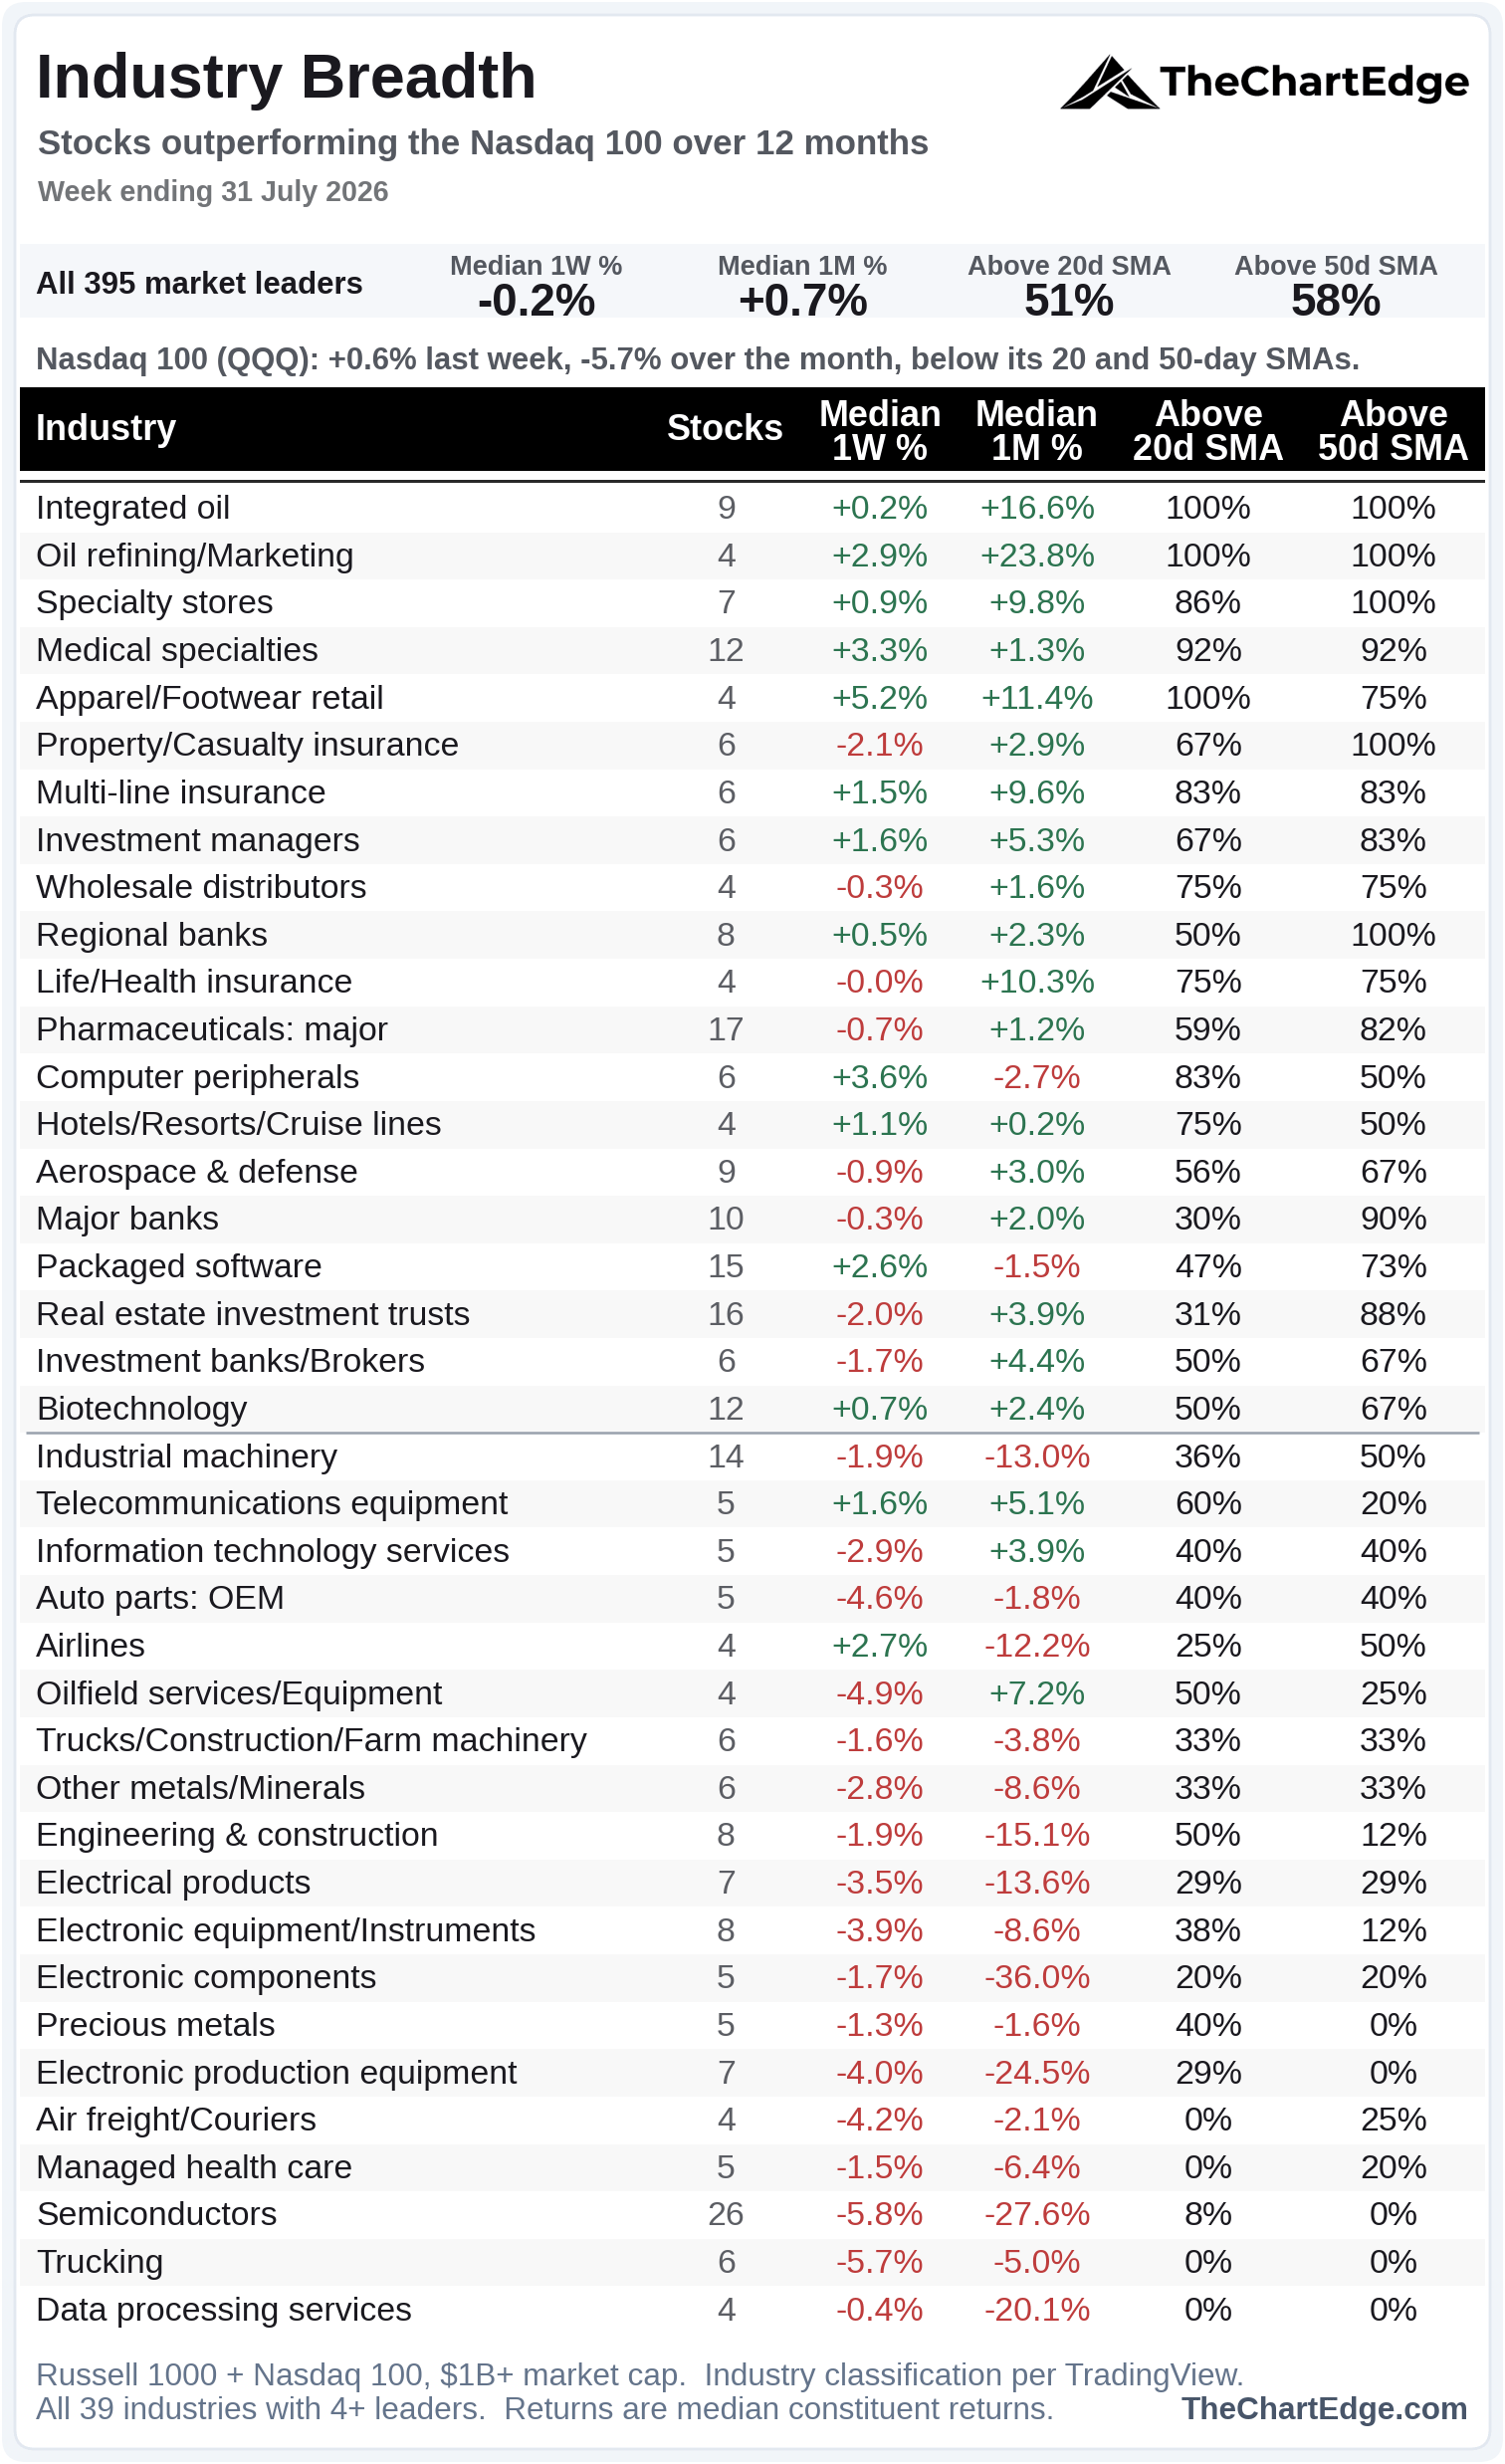
One thing to keep in mind reading this board. The universe is every Russell 1000 and Nasdaq 100 stock that has exceeded the Nasdaq 100 return over the past twelve months, so it’s a snapshot of longer-term leadership. A significant part of this cohort came from a year of AI leadership. Semiconductors has more individual names (26) than any other industry - but now sits third last on the board, with only 8% of stocks above their 20-day SMA and none above their 50-day.
Seven of the nine technology industries sit below the line, which shows where the average of names above the 20 and 50-day drops below 50%. Packaged software is the notable exception, driven by the likes of Snowflake, Datadog, CrowdStrike and Palo Alto.
Integrated oil and the refiners hold the top two spots on this board, while oilfield services sits in the bottom half. The TradingView industry groups here are much narrower than the energy ETFs.
Semis
SMH Chart
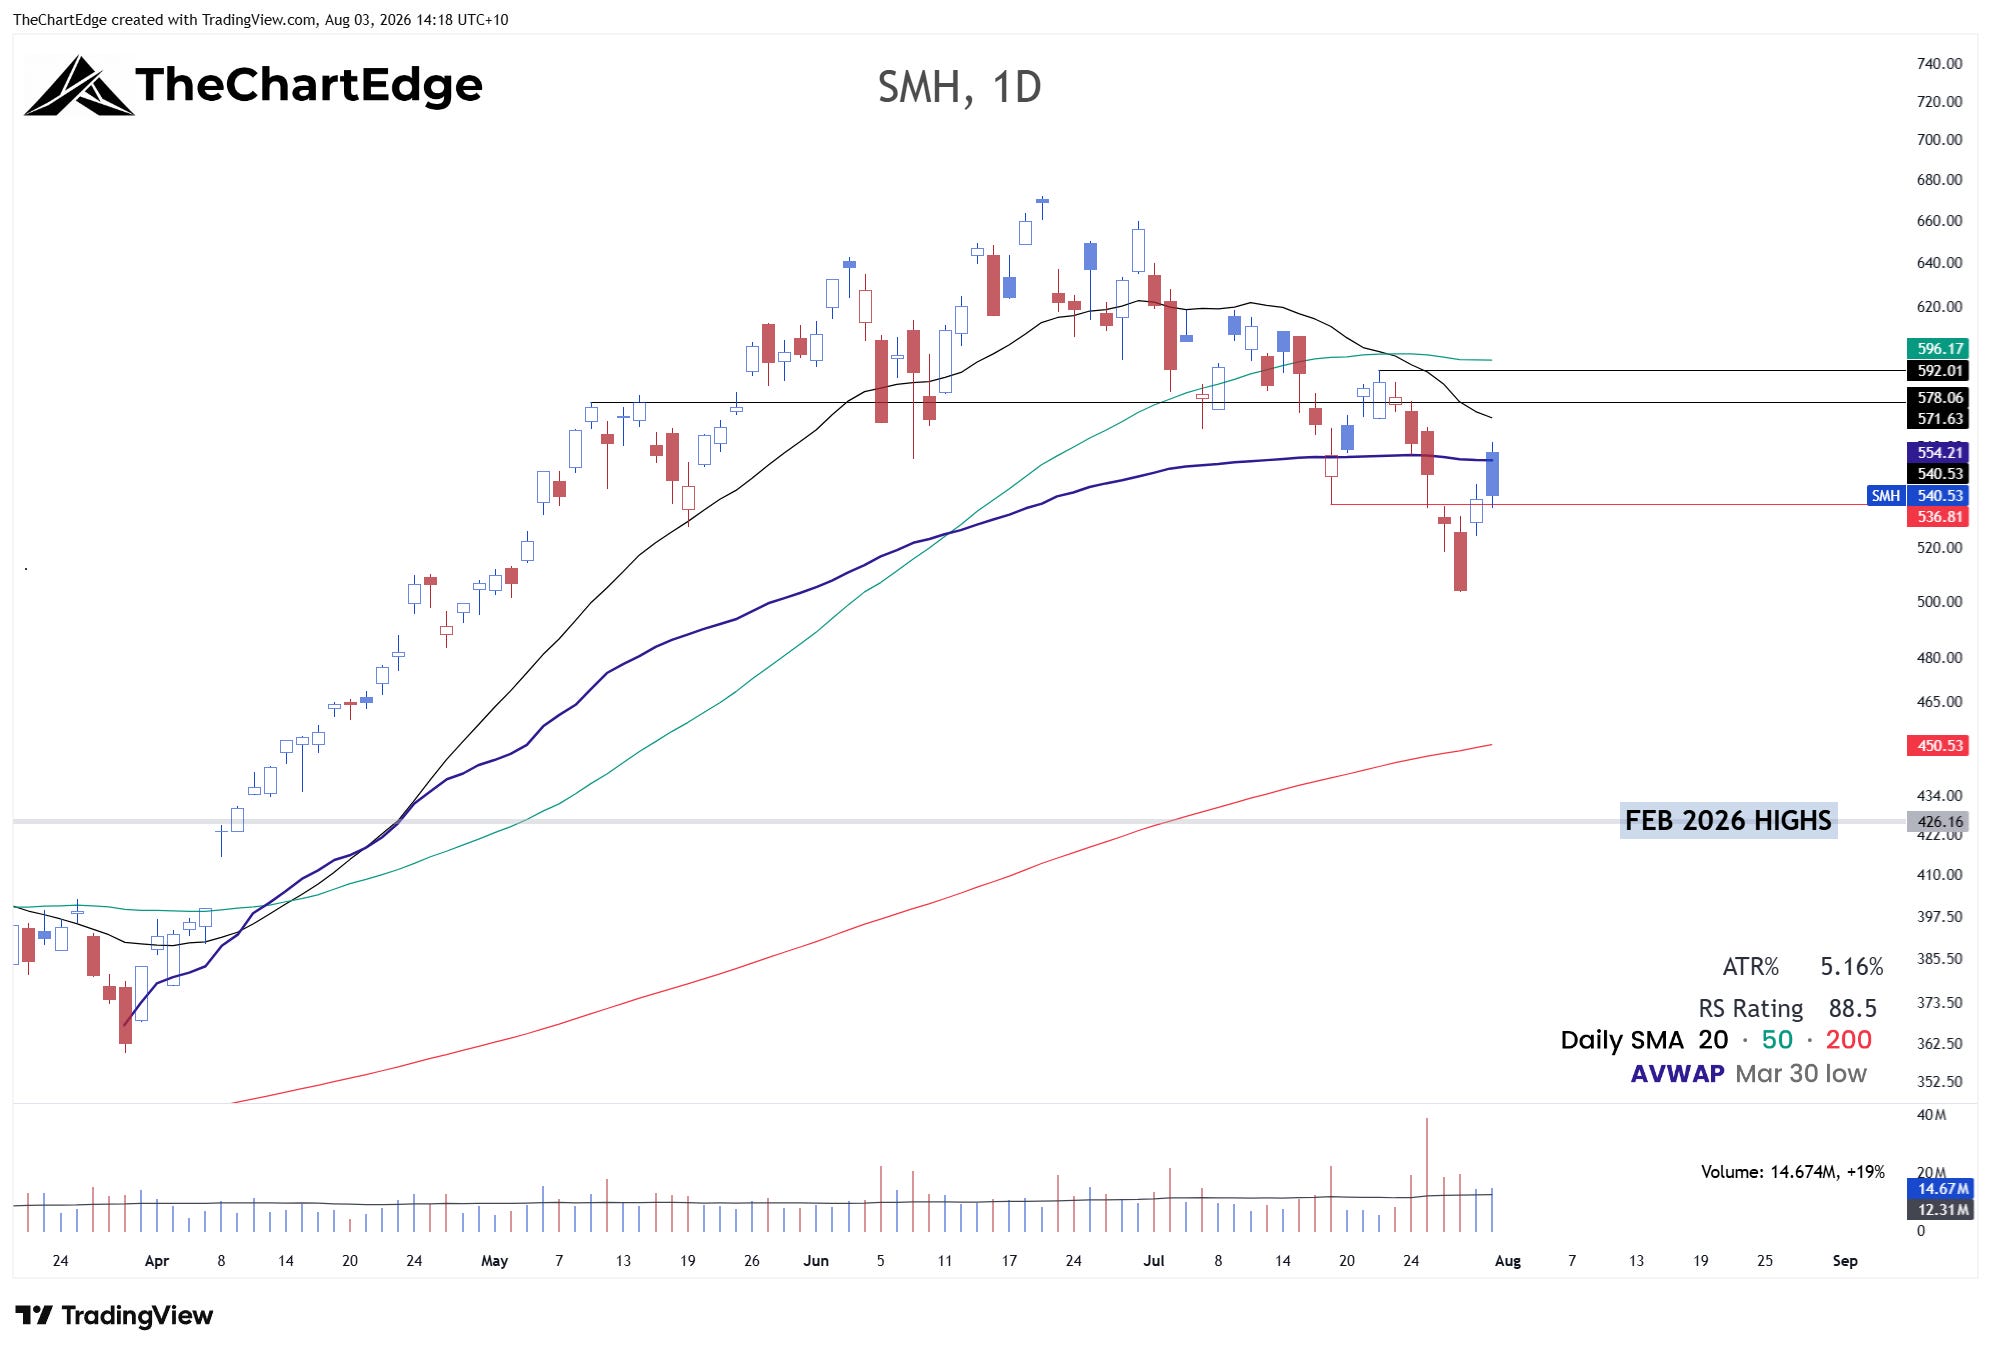
Last weekend I said I was watching 536 and 592 on SMH. It closed the week at 540.53, but this doesn’t tell the story of volatility throughout the week. Monday through Wednesday, SMH was down over 10%. It bounced on Thursday and Friday, but Friday’s gap up was sold into, right around the AVWAP from the March 30 low. The chart looks broken for now, making lower highs and lower lows under its 20 and 50-day SMAs.
Levels I Was Watching on the Dollar Index and TLT
The levels I flagged last weekend were broken, but not in the way I expected.
The dollar broke down - going from about 101.5 to 99.8. However this was at least partially due to Japanese intervention in the USDJPY market late last week. It’s trading a little lower again as I write this on Monday.
DXY Chart
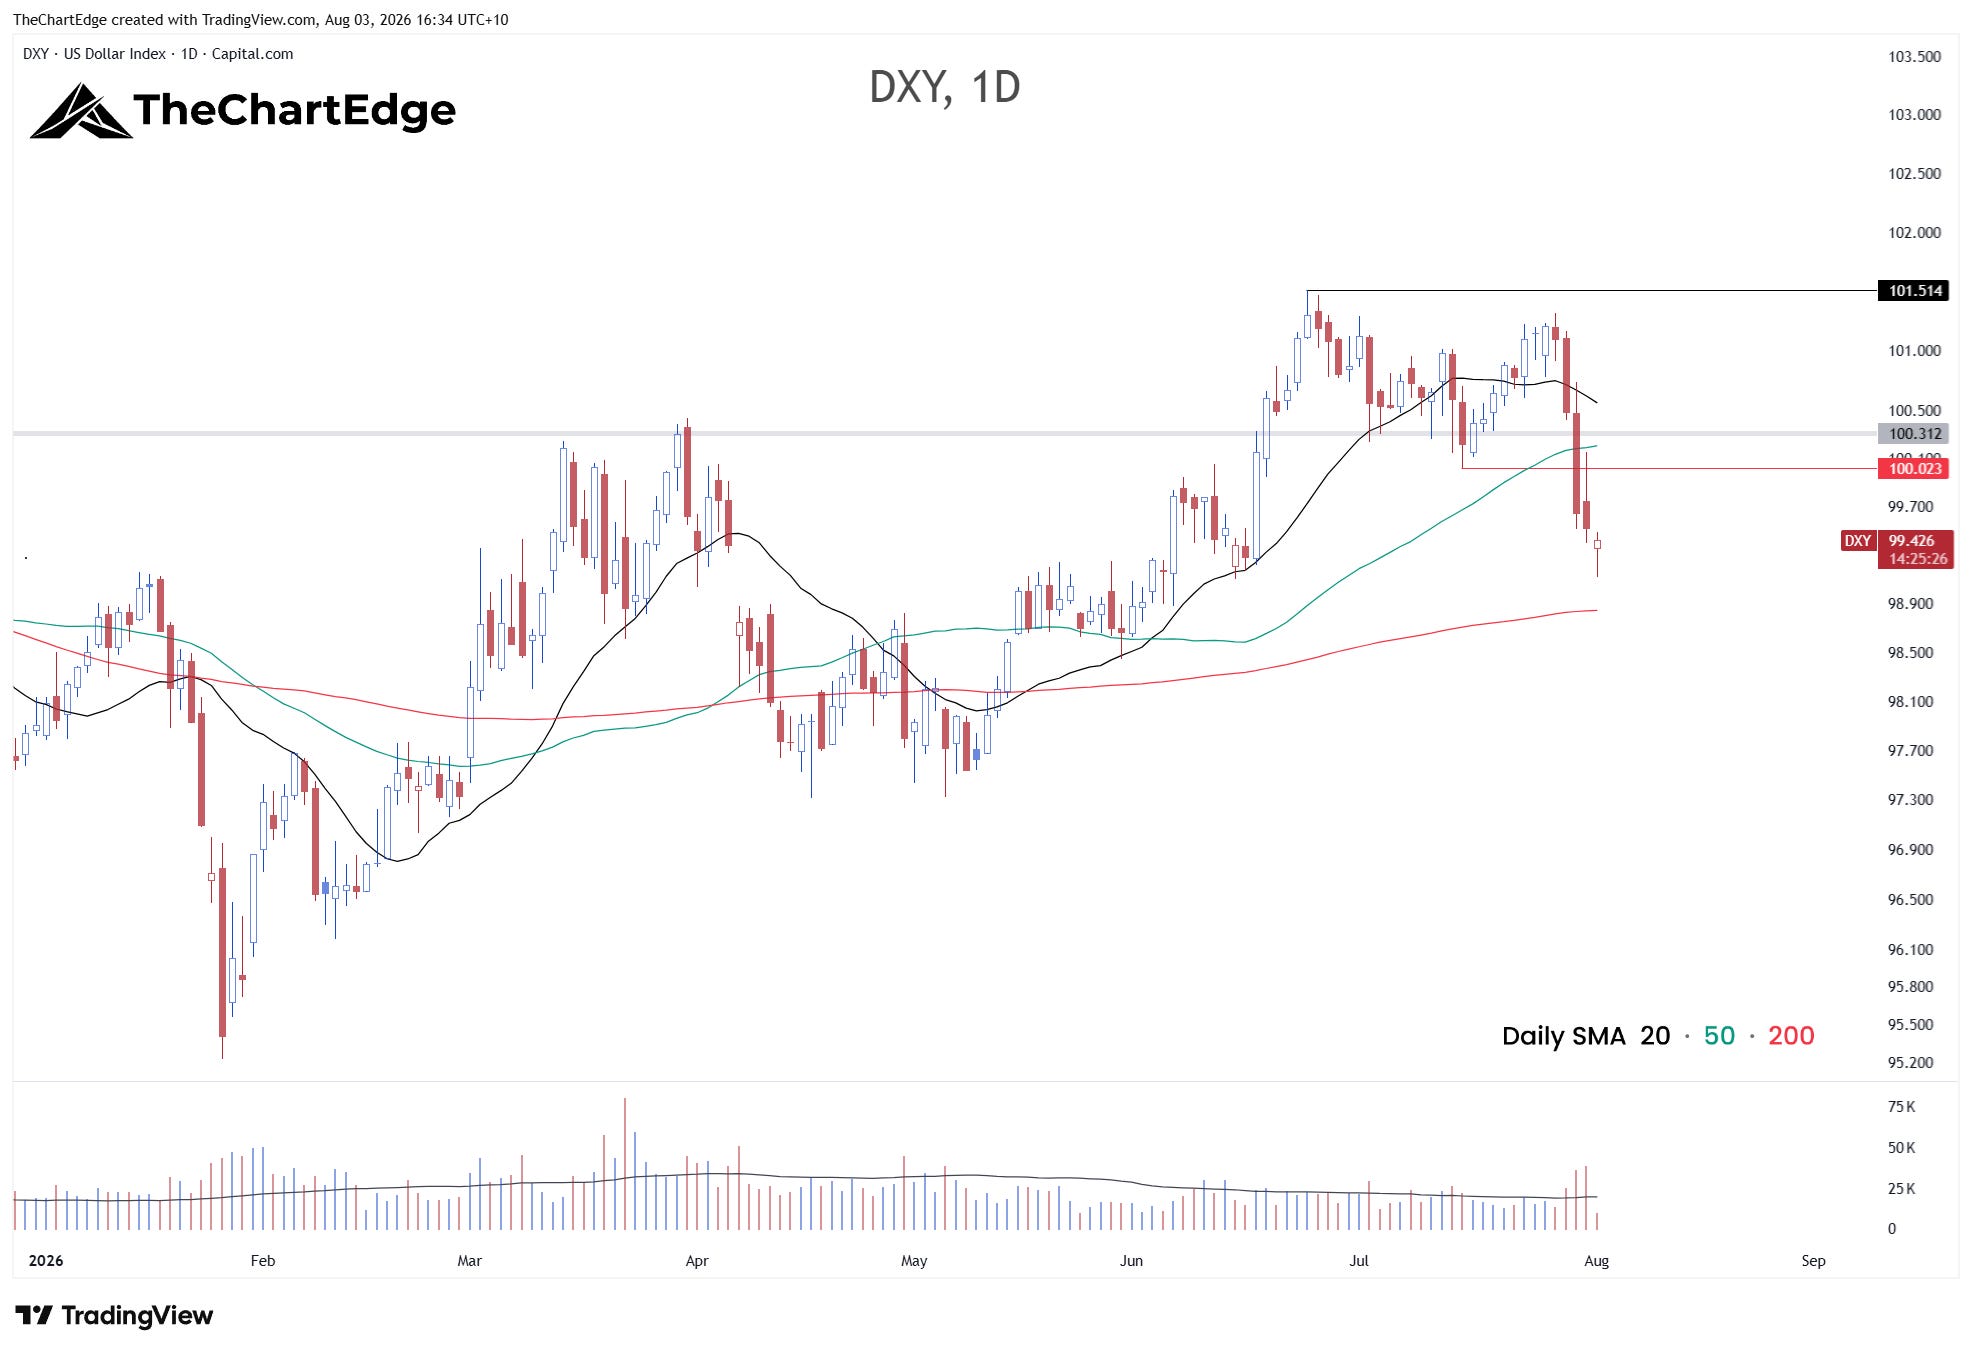
Chart captured Monday - the last candle is still open.
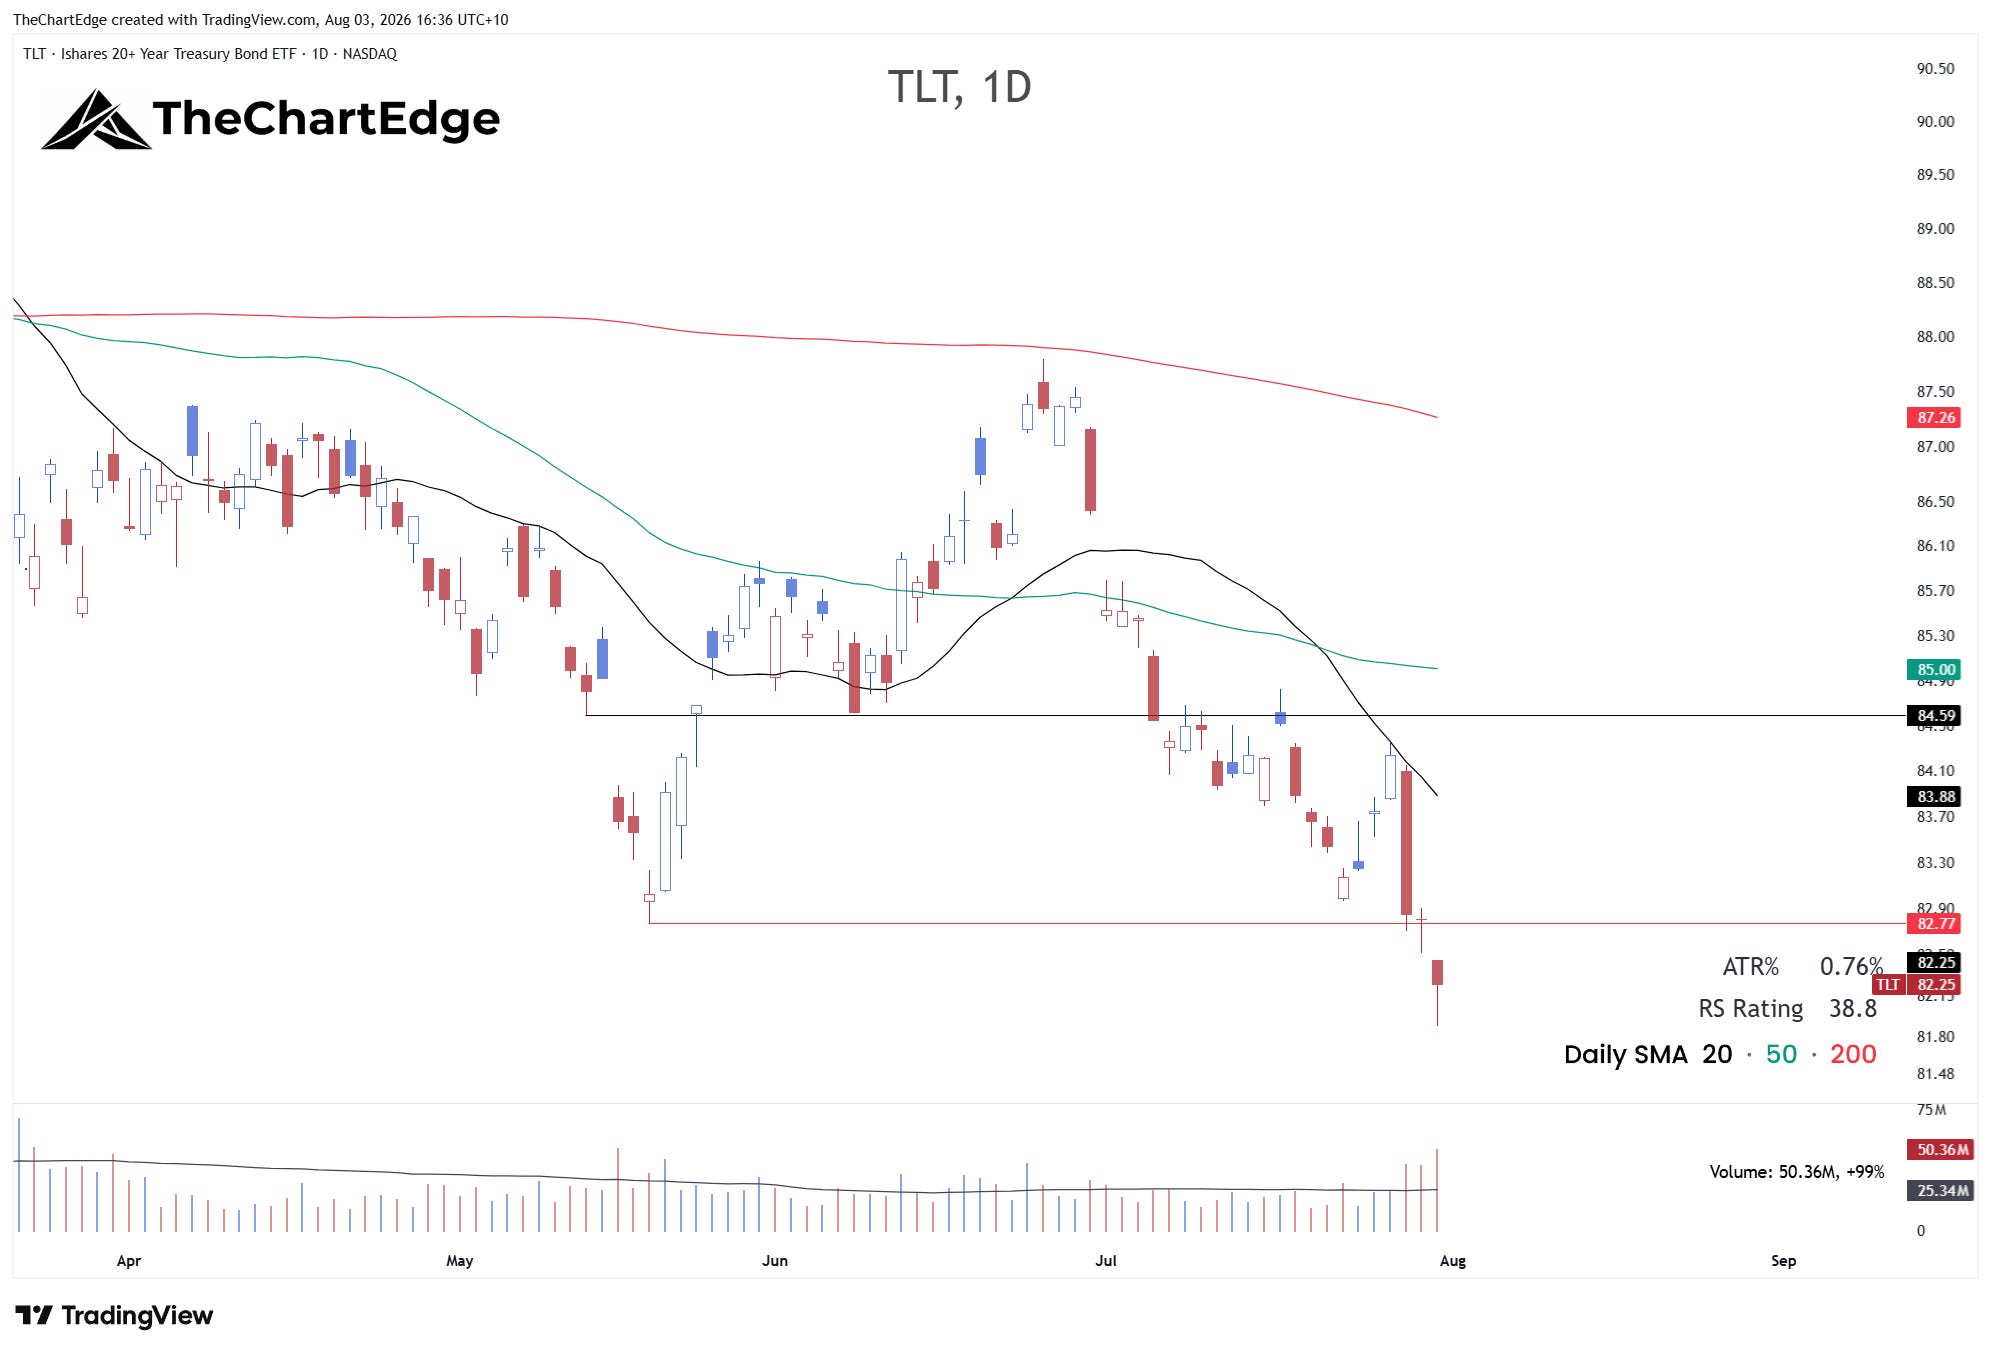
TLT broke the May 19 low of 82.77, closing at 82.25. The spike in yields is somewhat concerning. The 10-Year Treasury Yield closed at 4.74% and the 30Y at 5.27%.
TLT Chart
Follow-Up on Last Week’s Names
I didn’t put on any of the trades I outlined in my watchlist in last week’s note. On Monday the SPY and QQQ gapped up only to sell off hard in the first hour or so.
AMD, Dell (DELL), J.B. Hunt (JBHT), Targa Resources (TRGP) and ATI were hit the hardest - all slicing through their 20 and 50-day SMAs and where I would have had my stop loss during the week. Hewlett Packard Enterprise (HPE) held up better but still undercut both SMAs on Tuesday and Wednesday.
Bank of New York Mellon (BNY), Viking Holdings (VIK), Royalty Pharma (RPRX) and Millicom (TIGO) fared better, but with the volatility during the week and the uncertainty leading into the weekend regarding Iran, I was happy to just watch from the sidelines.
The Week Ahead
Looking through the individual charts this weekend, both ETFs and individual names, there’s nothing I really want to buy here. Even within the stronger looking charts I’m not seeing any clean setups. Conditions are still not favourable for my trading style, and I’m staying focused on capital preservation. Plenty of earnings again this week, but I will be particularly interested in watching the reaction to AMD on Tuesday, as well as Eli Lilly (LLY), Western Digital (WDC) and SanDisk (SNDK) on Wednesday. I’ll also be on the lookout for an IBD “Follow-Through Day” and/or whether the QQQ can push higher early in the week and have a more orderly pullback and set a higher low above 685.
Stay open-minded and manage risk carefully.
Cheers,
Marcus Grant, CFTe
Disclaimer: The content provided in this newsletter is for informational and educational purposes only and should not be considered as financial, investment, or legal advice. The information shared is based on our research and analysis, but we are not a licensed financial advisor, nor can we guarantee its accuracy, completeness, or timeliness. Market conditions and financial instruments can change rapidly, and any opinions expressed may not be suitable for all investors. Any opinions expressed and or securities mentioned do not constitute a recommendation to buy, sell, or hold that or any other security. You should conduct your own due diligence and consult with a licensed financial advisor or other professional before making any investment decisions. Past performance is not indicative of future results, and all investments carry the risk of loss. The authors and publishers of this newsletter are not responsible for any financial decisions made based on the content provided herein. By reading and or subscribing to this newsletter, you acknowledge and agree that you are using the information at your own risk.