

Market Temperature Ticks Up to 5.7 - Leadership Narrows Back Towards Tech & AI Names
Tech & AI names had a strong week, the banks stalled at their recent highs, and oil continued lower

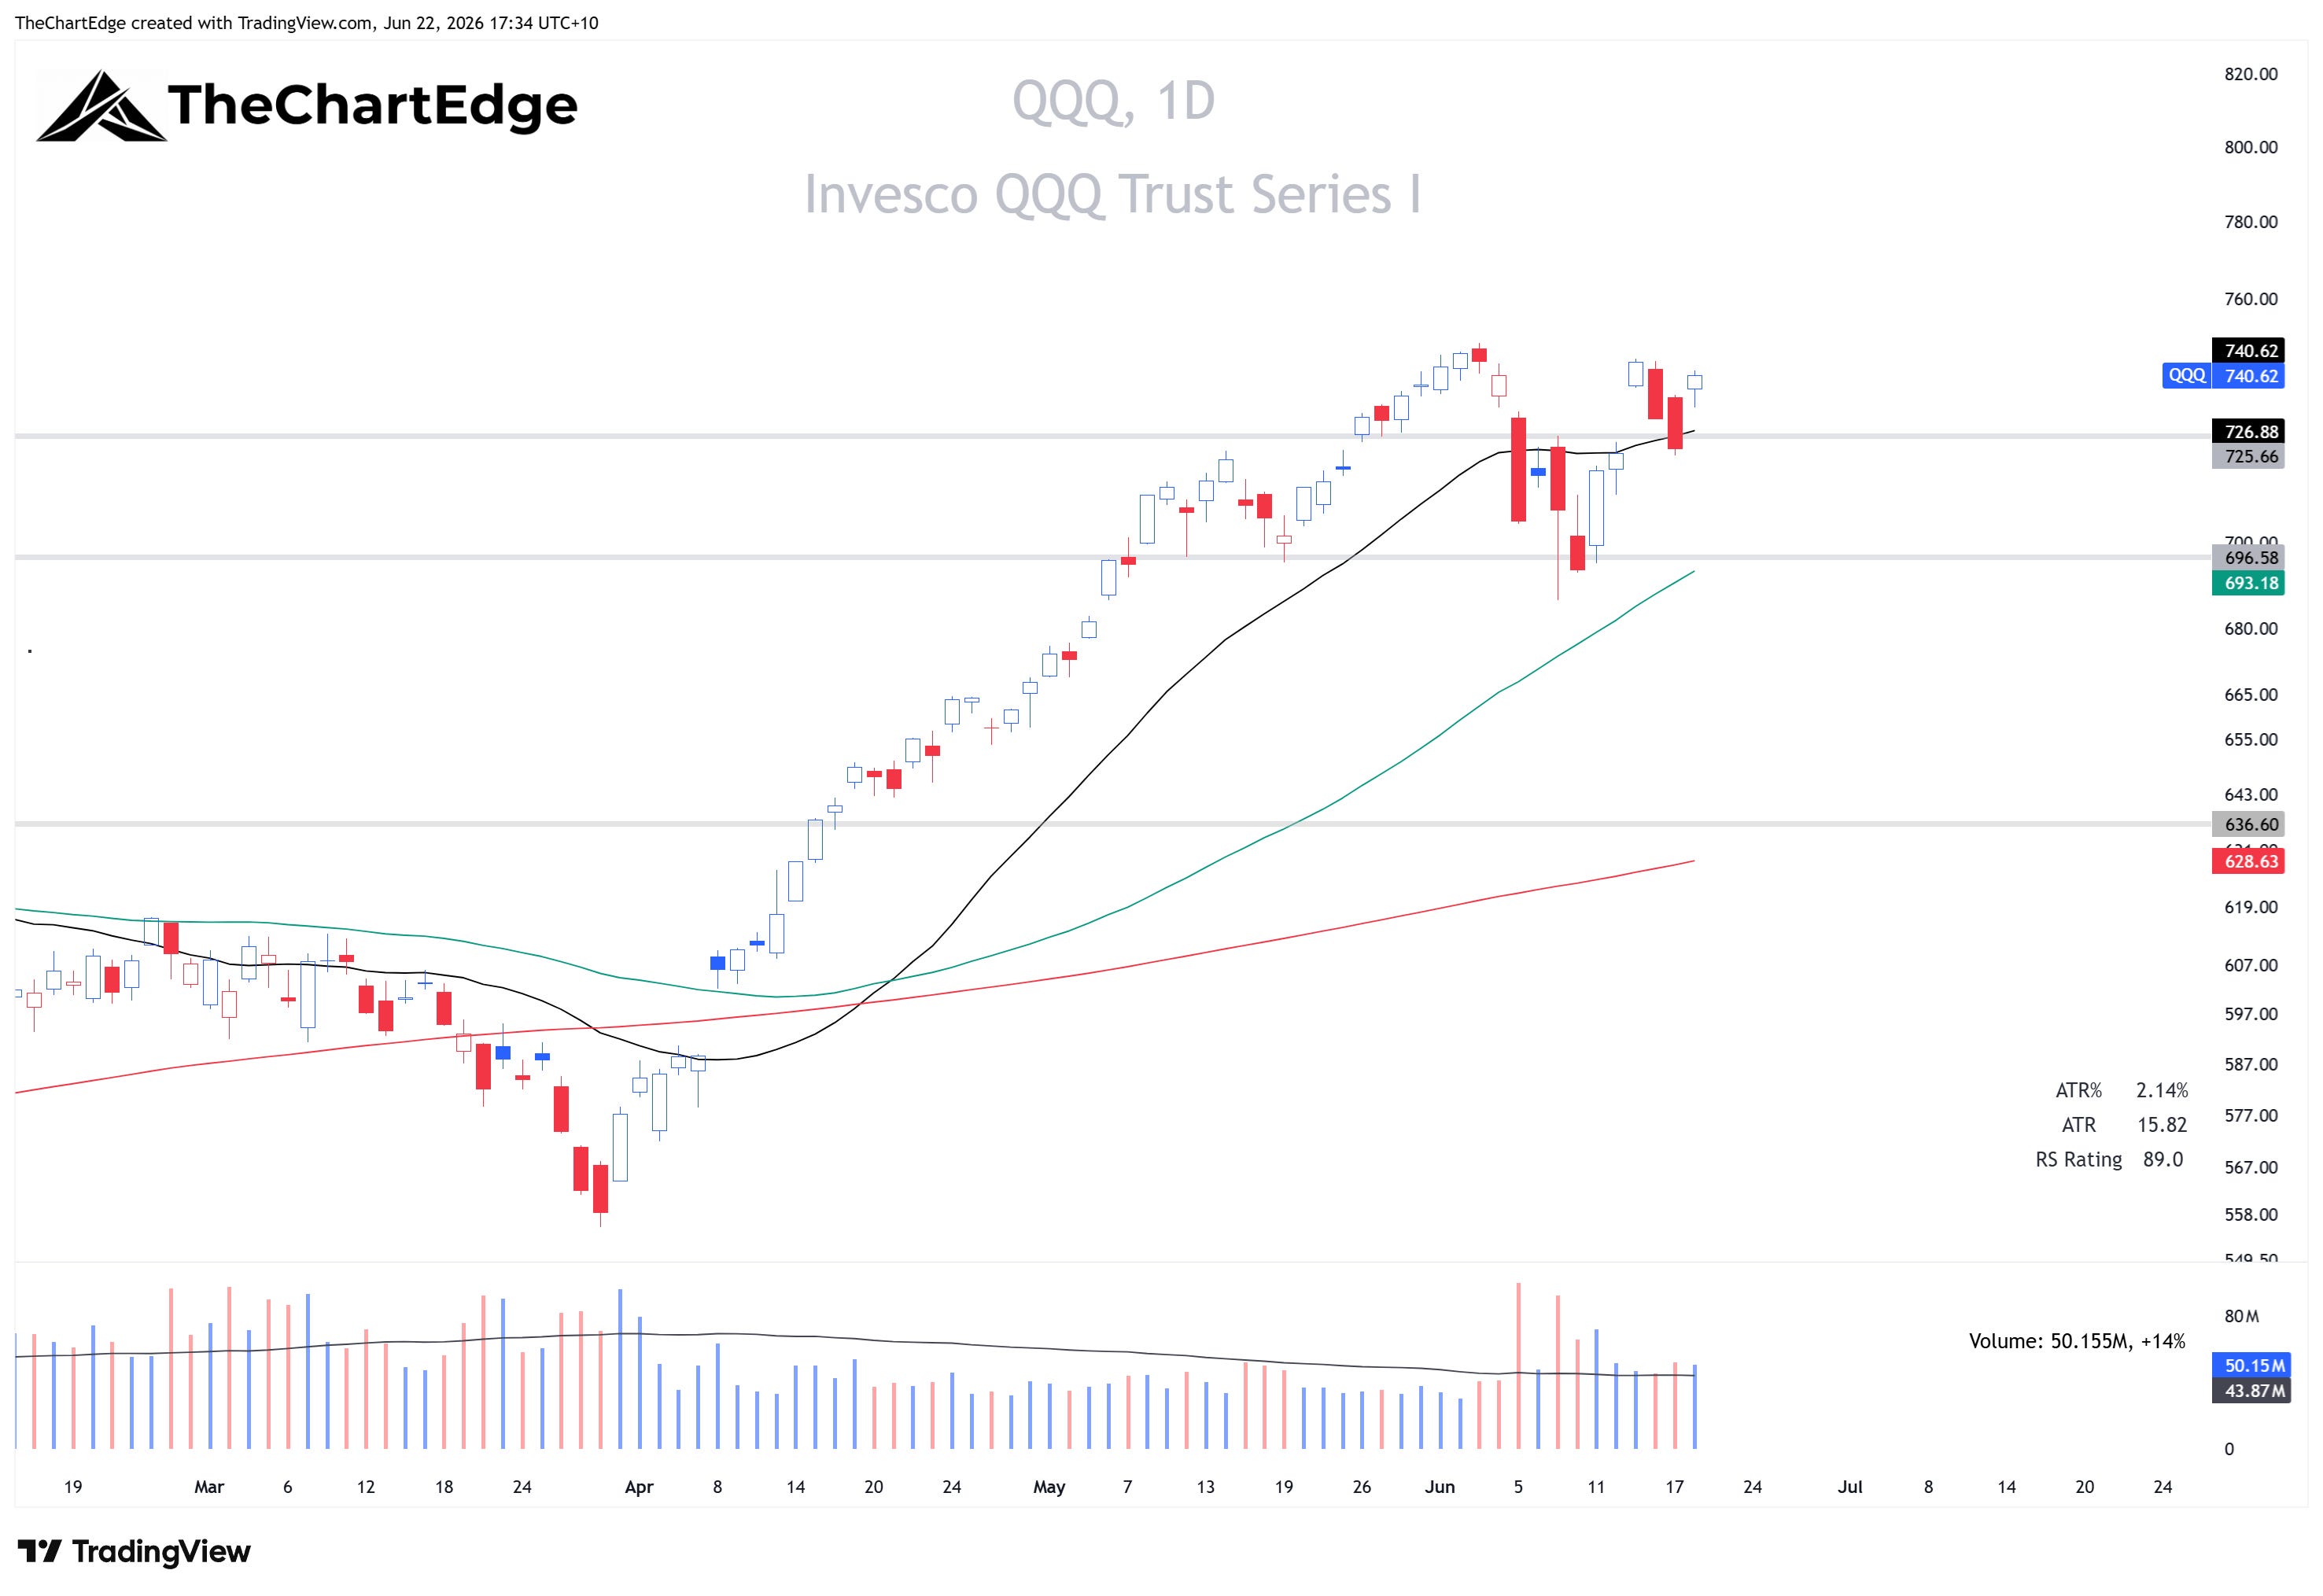
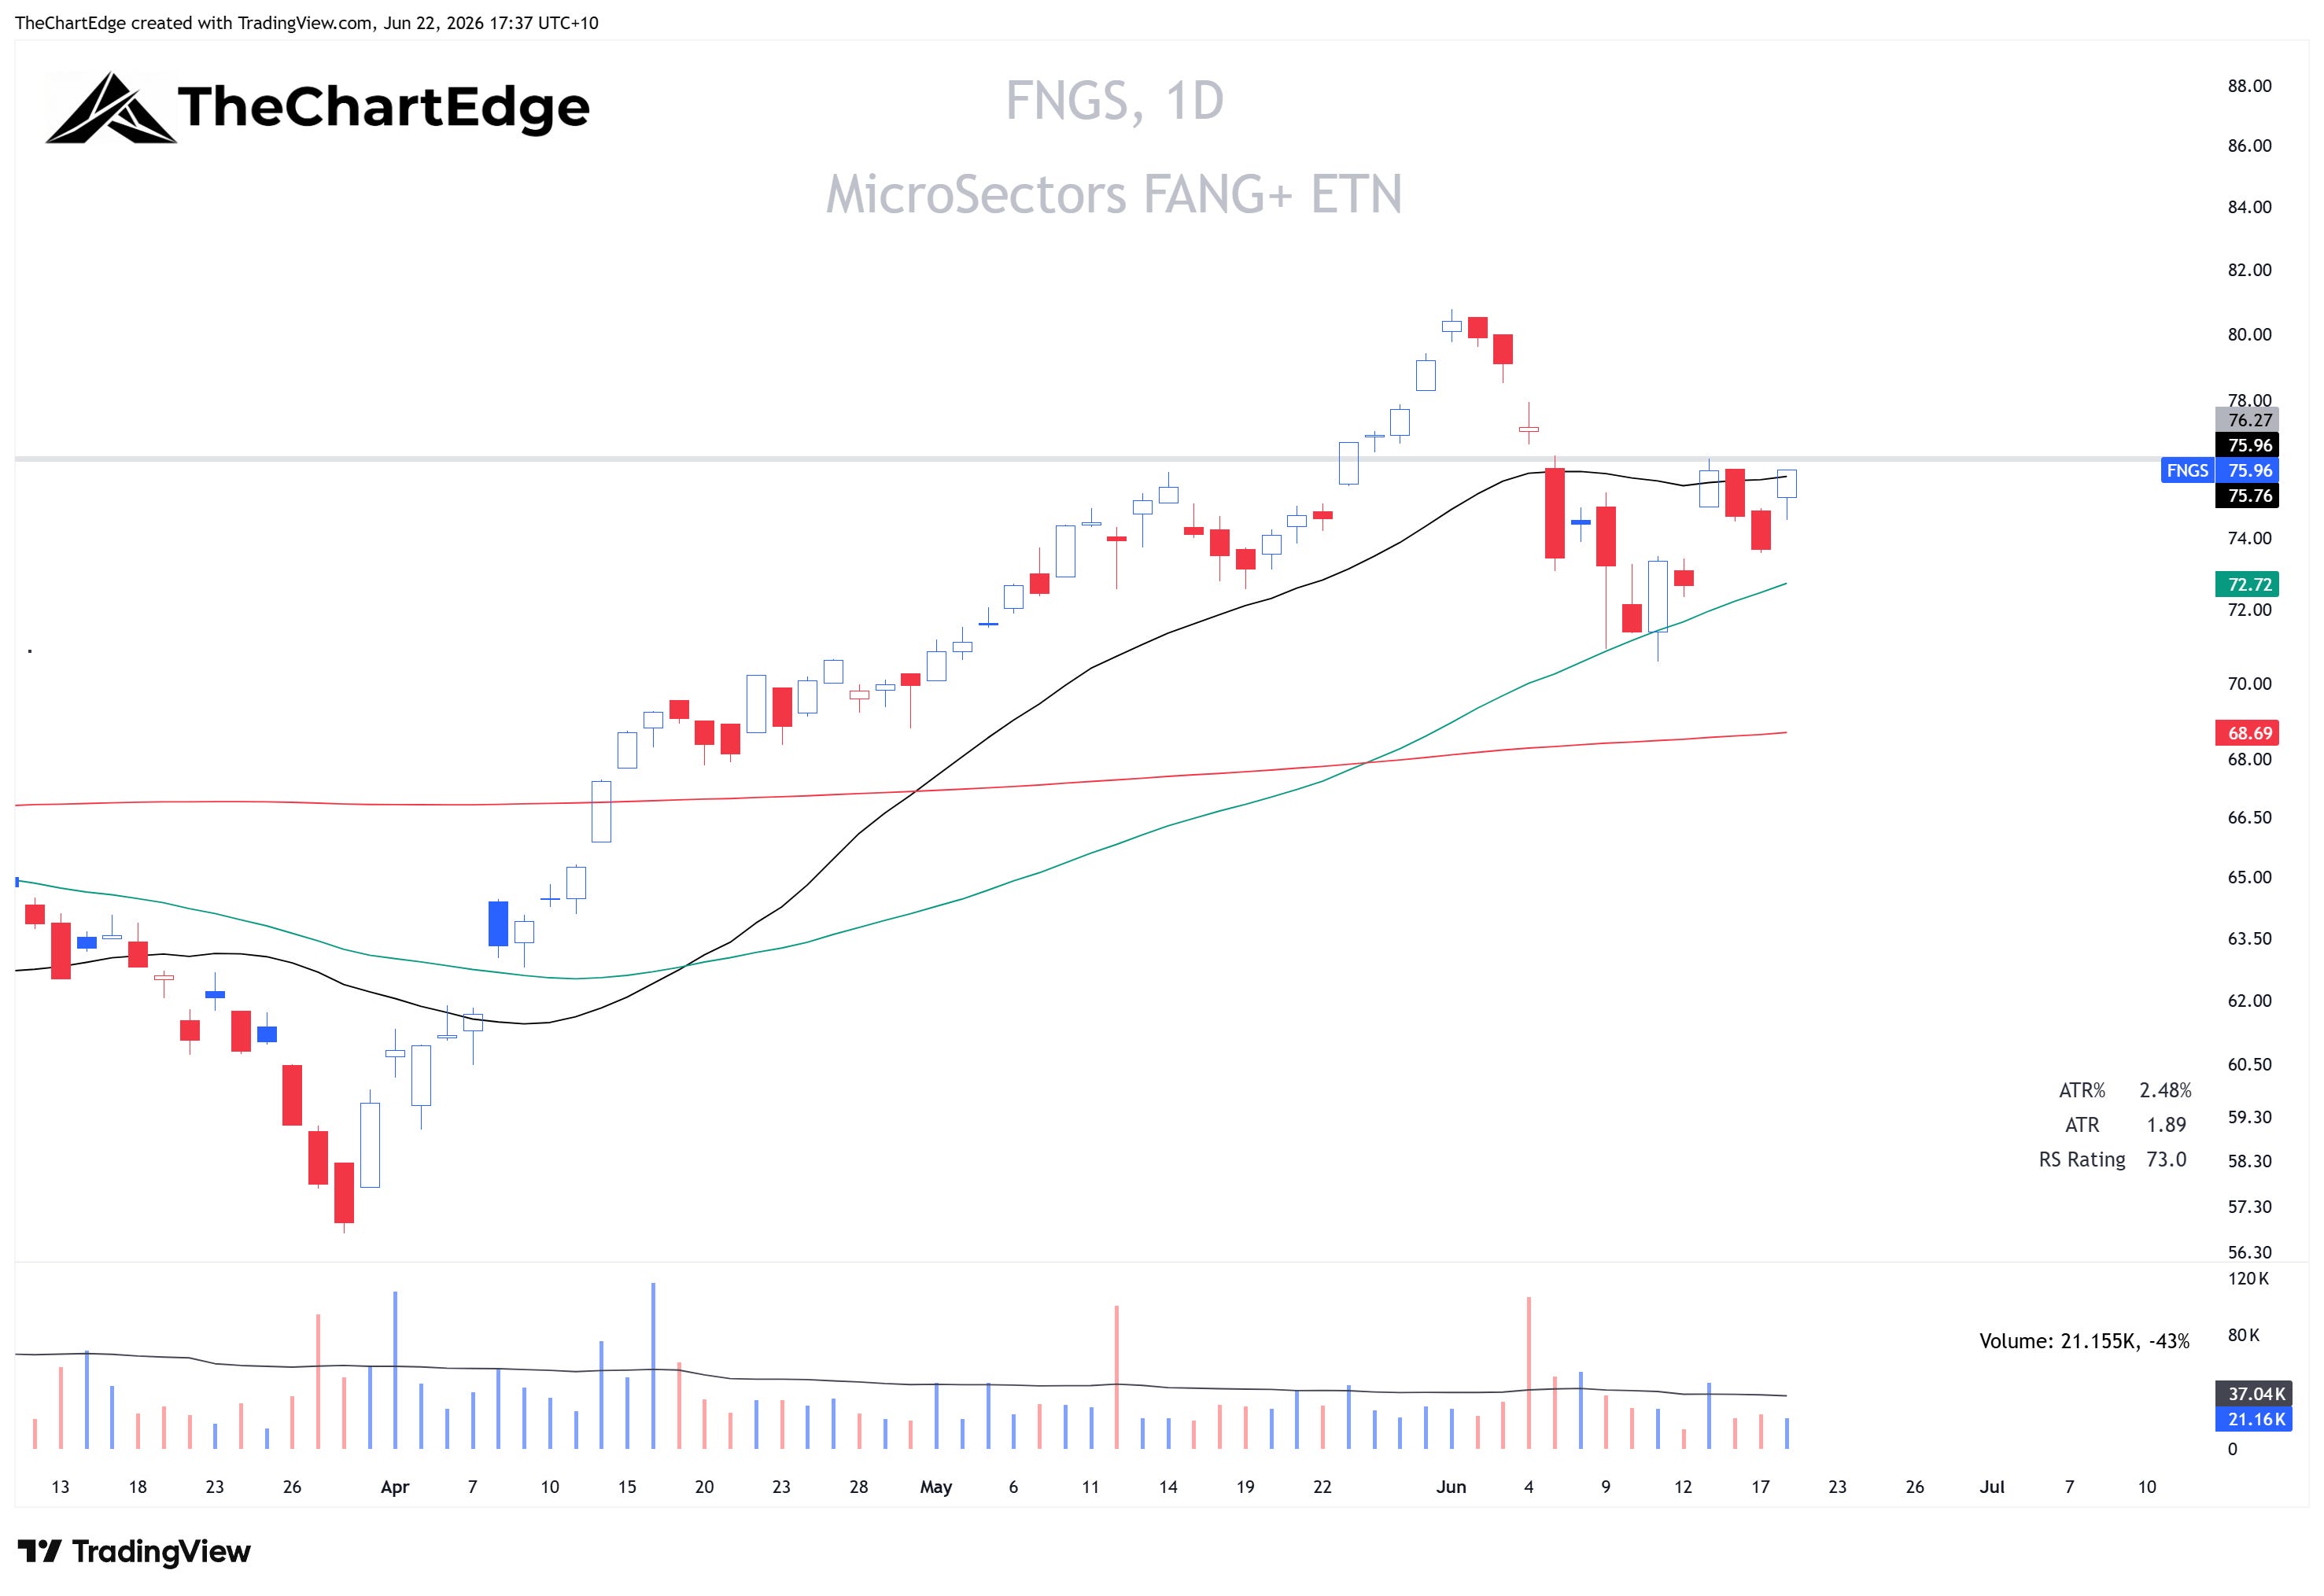
US markets were closed Friday for Juneteenth, so last week’s data runs to the Thursday June 18 close, except the VIX, which kept trading on Friday in Cboe’s extended-hours session. The Nasdaq 100 (QQQ) rose 2.7% and the S&P 500 (SPY) 0.7%. FANG+ (FNGS) jumped 4.5%. The S&P MidCap 400 (MDY) slipped 0.4%. Small caps held firm, with the Russell 2000 (IWM) up 0.9% and microcaps (IWC) 1.5%, while the equal-weight S&P 500 (RSP) eased 0.8%.
SPY Chart
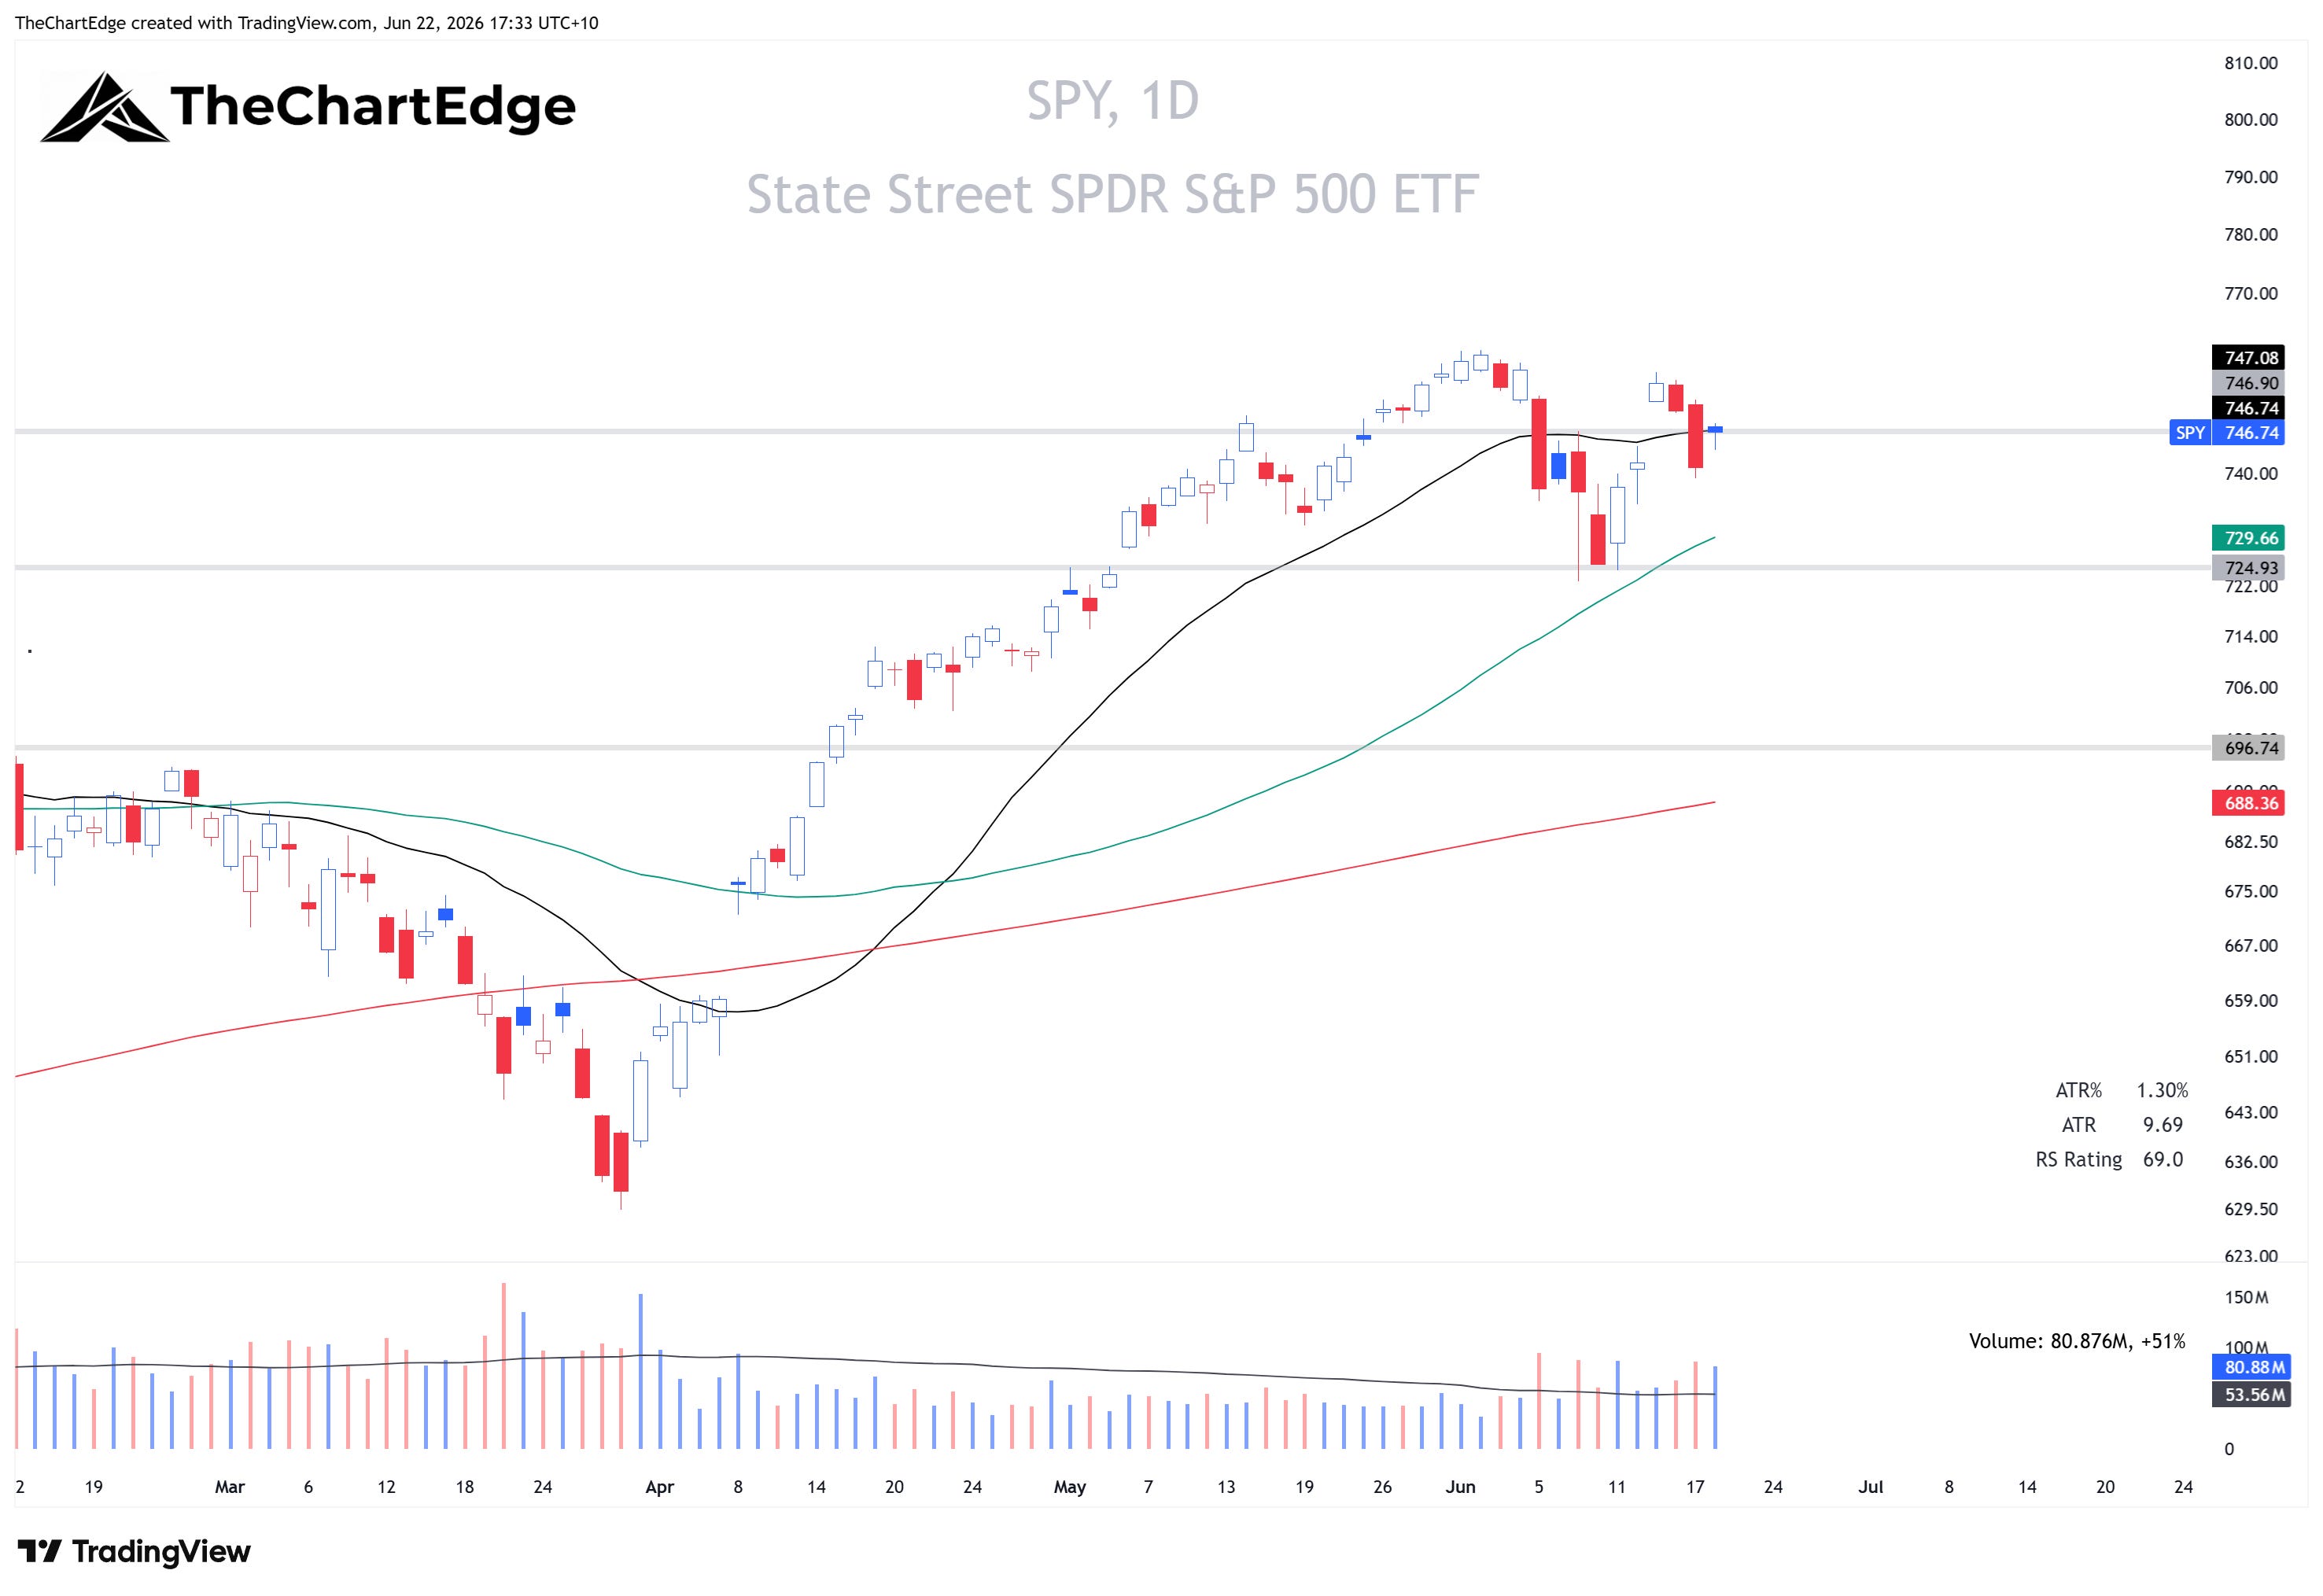
For all daily charts the black line is the 20-day SMA, the green is the 50-day SMA, and the red is the 200-day SMA.
QQQ Chart
FNGS Chart
Market Temperature Up to 5.7
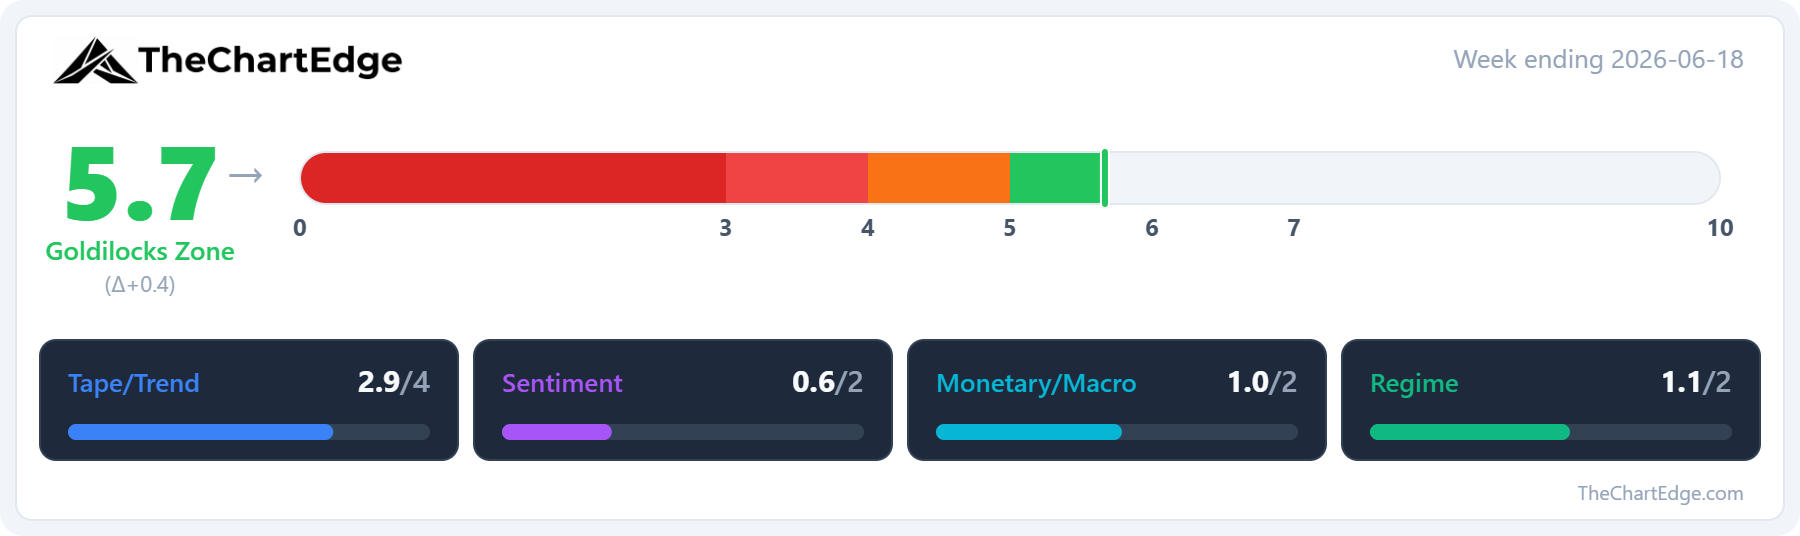
The Market Temperature rose to 5.7 from 5.3 and held in the Goldilocks Zone. The lift came entirely from the Tape/Trend pillar. The QQQ flipped back into a Strong Uptrend, while the S&P 500 held its Uptrend, finishing right on its 20-day SMA rather than above it. The S&P 500’s weekly RSI also edged up to 66.3 from 65.1 - a small move week-on-week, but the model has a 2-week lookback window, so it gave the score a bigger lift. Breadth held roughly steady, with the share of US stocks above their 50-day moving average easing only slightly to 53.1% from 56.6% and the 200-day count flat near 55%.
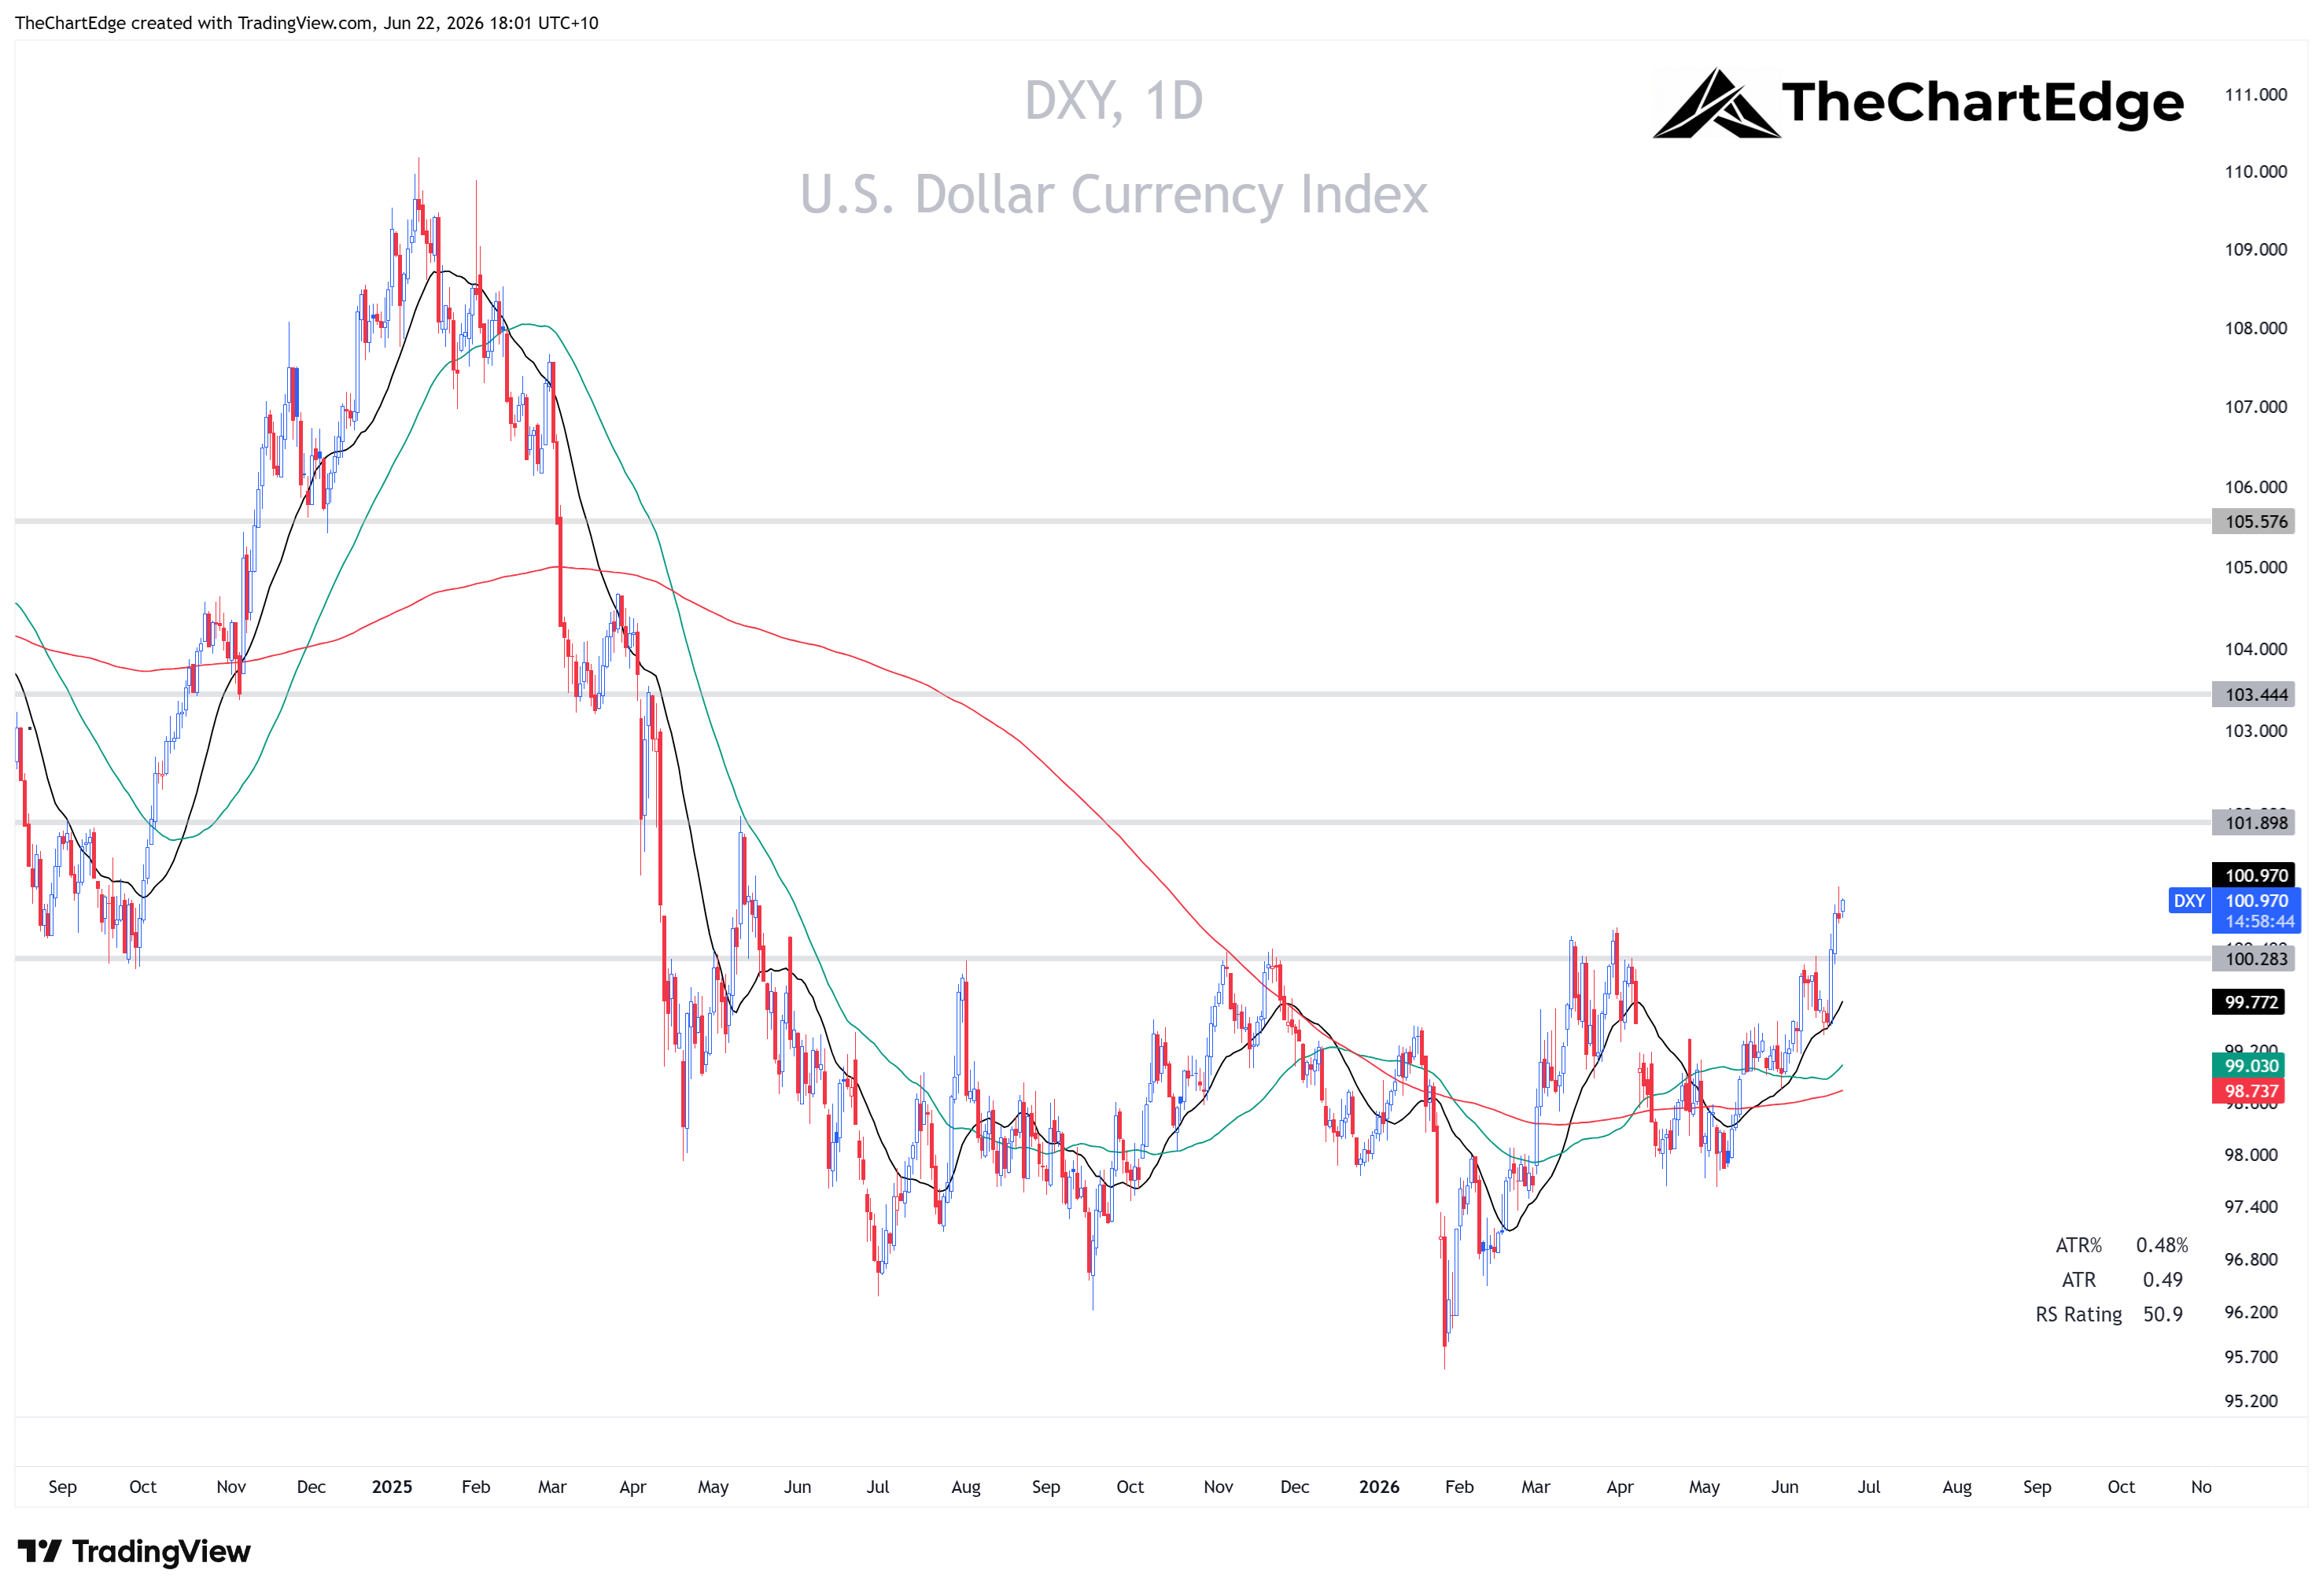
On the Monetary/Macro side, bond volatility compressed further, with the MOVE index down to 65.4 from 69.4. The US dollar had a strong week, which the model reads as a drag. I’ll be watching the dollar closely over the week ahead. If it keeps moving up strongly, it could cause some headwinds for equities.
Sentiment stayed a small negative: the VIX eased to 16.8 from 17.7, which the model treats as a contrarian signal. The Regime pillar score held steady, unchanged from last week.
DXY Chart
GICS Sector Relative Strength
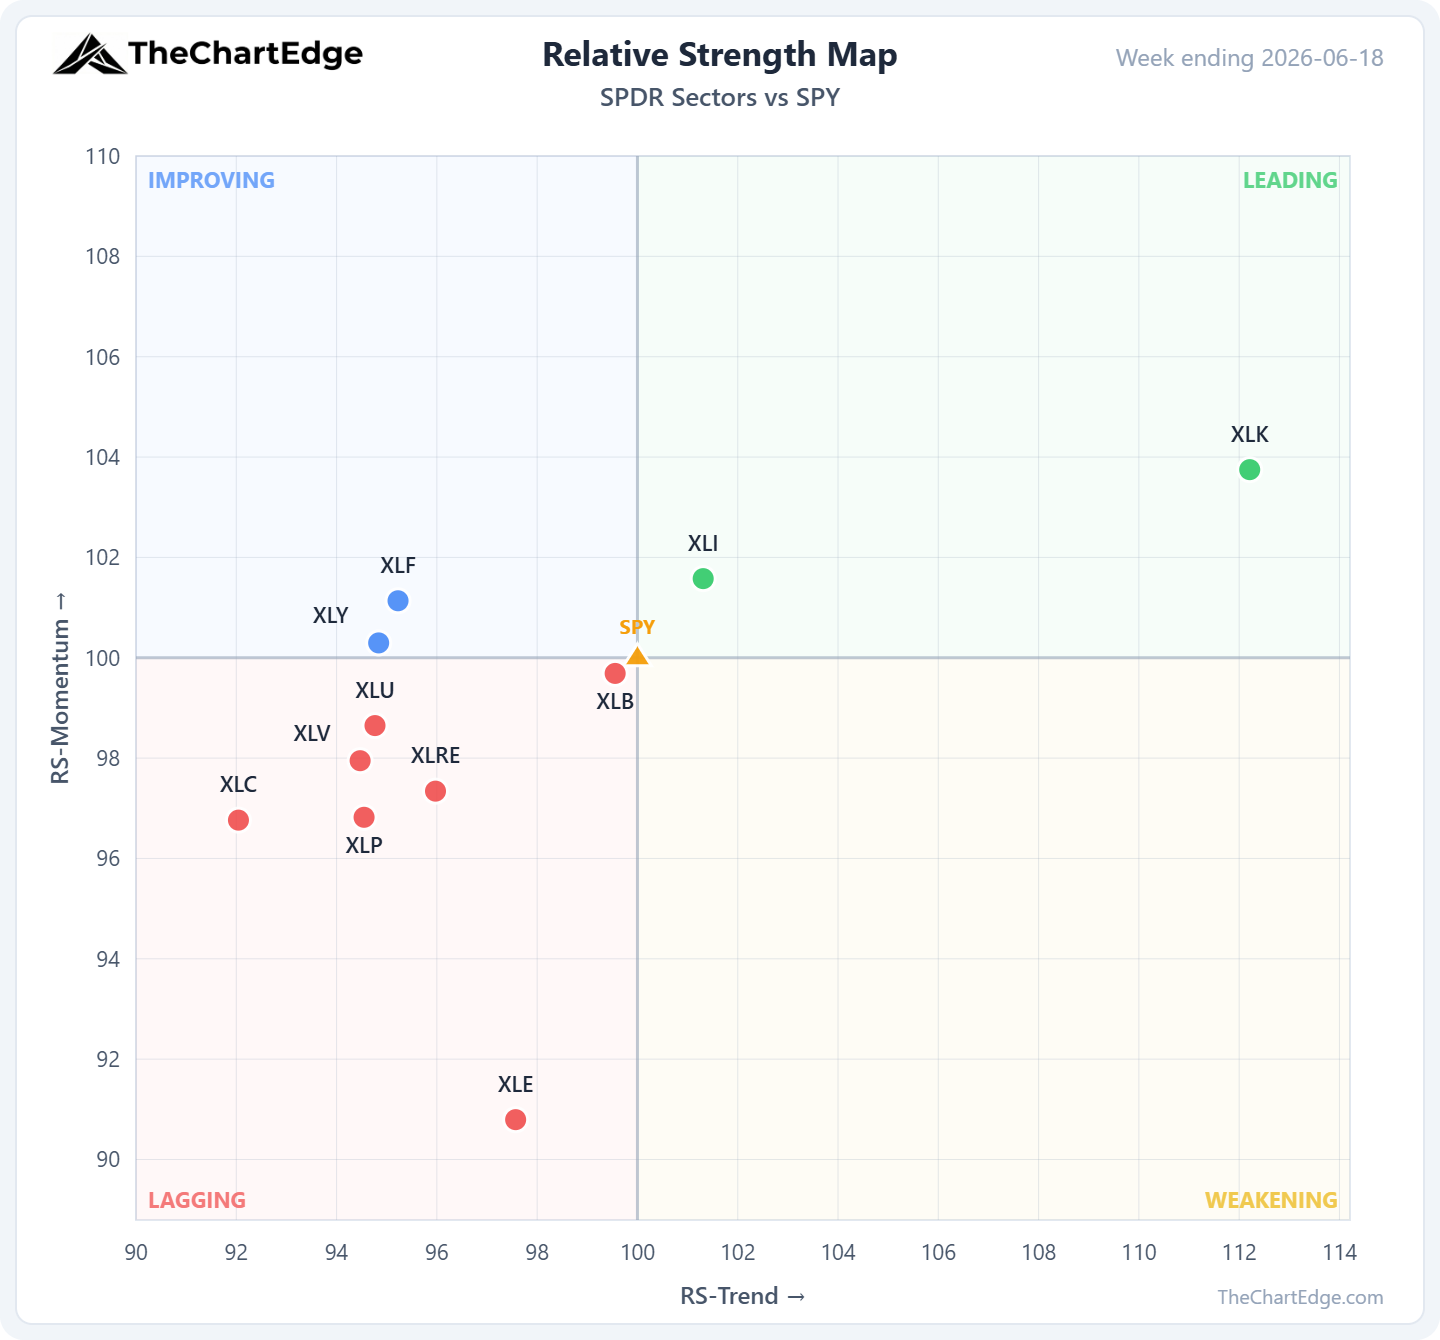
Only two of the eleven GICS sectors are in Leading: Technology (XLK), up 3.6%, and Industrials (XLI), which crossed in from Weakening after a 2.7% week. Two sectors sit in Improving, Financials (XLF) and Discretionary (XLY), and none are in Weakening.
That leaves seven in Lagging. Materials (XLB) dropped out of Leading after leading the week before, and Real Estate (XLRE), Staples (XLP) and Health Care (XLV) all slid from Improving to Lagging. Energy was the softest sector, with XLE off 6.6%.
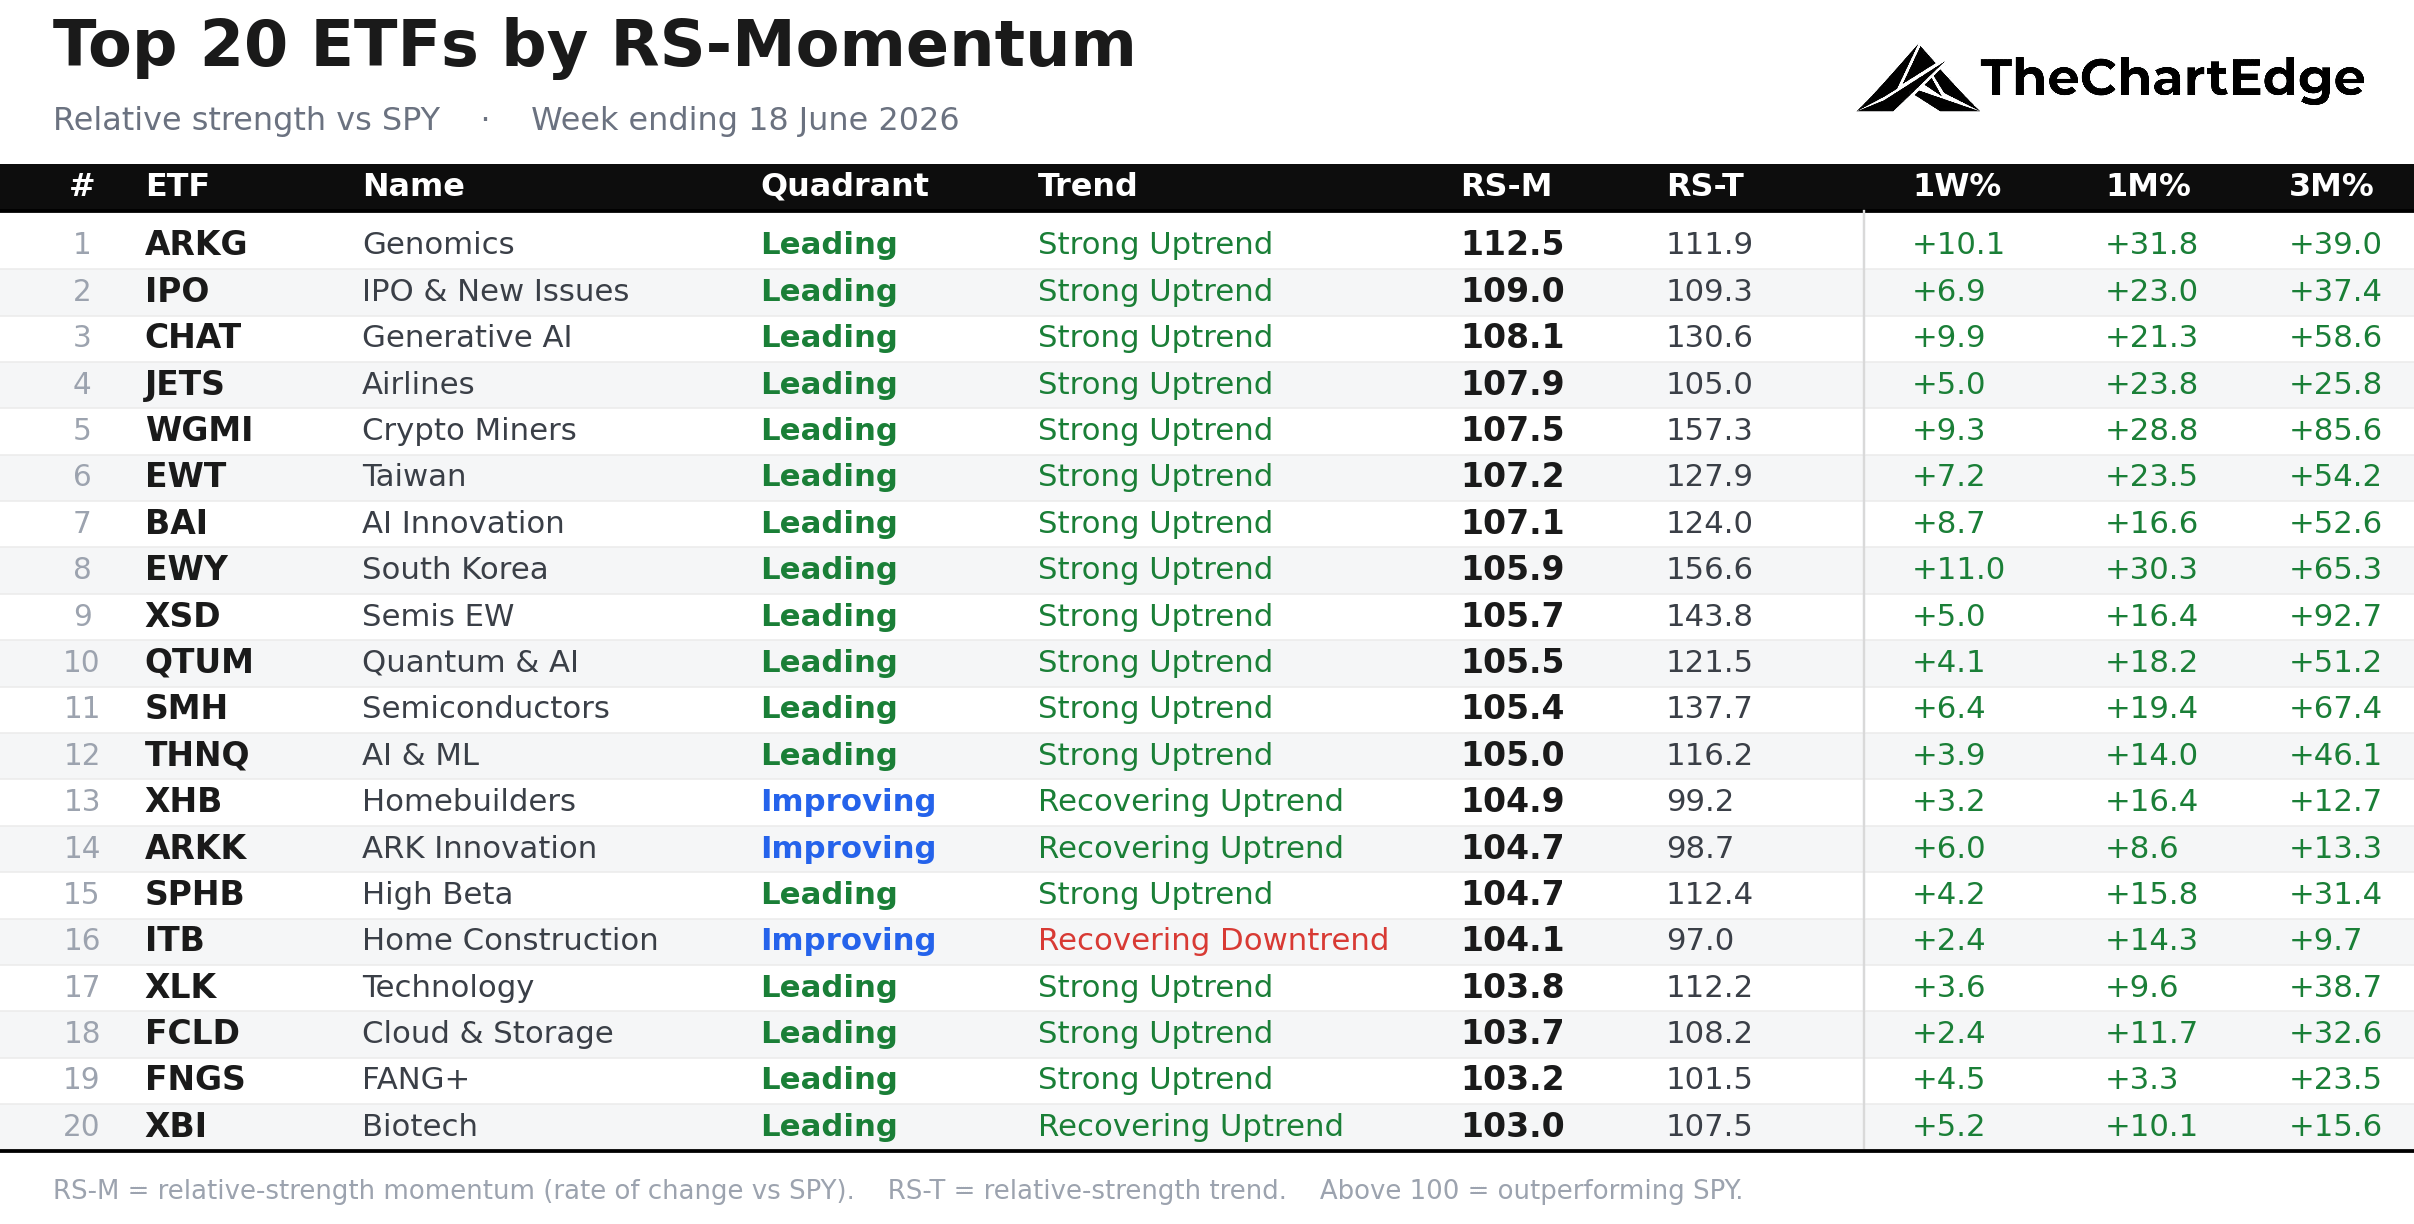
Momentum Leaderboard
Tech and AI names dominate the top 20 again, with Taiwan (EWT) and Korea (EWY) the only international names to make it.
Tech & AI Related Names Resume Their Outperformance
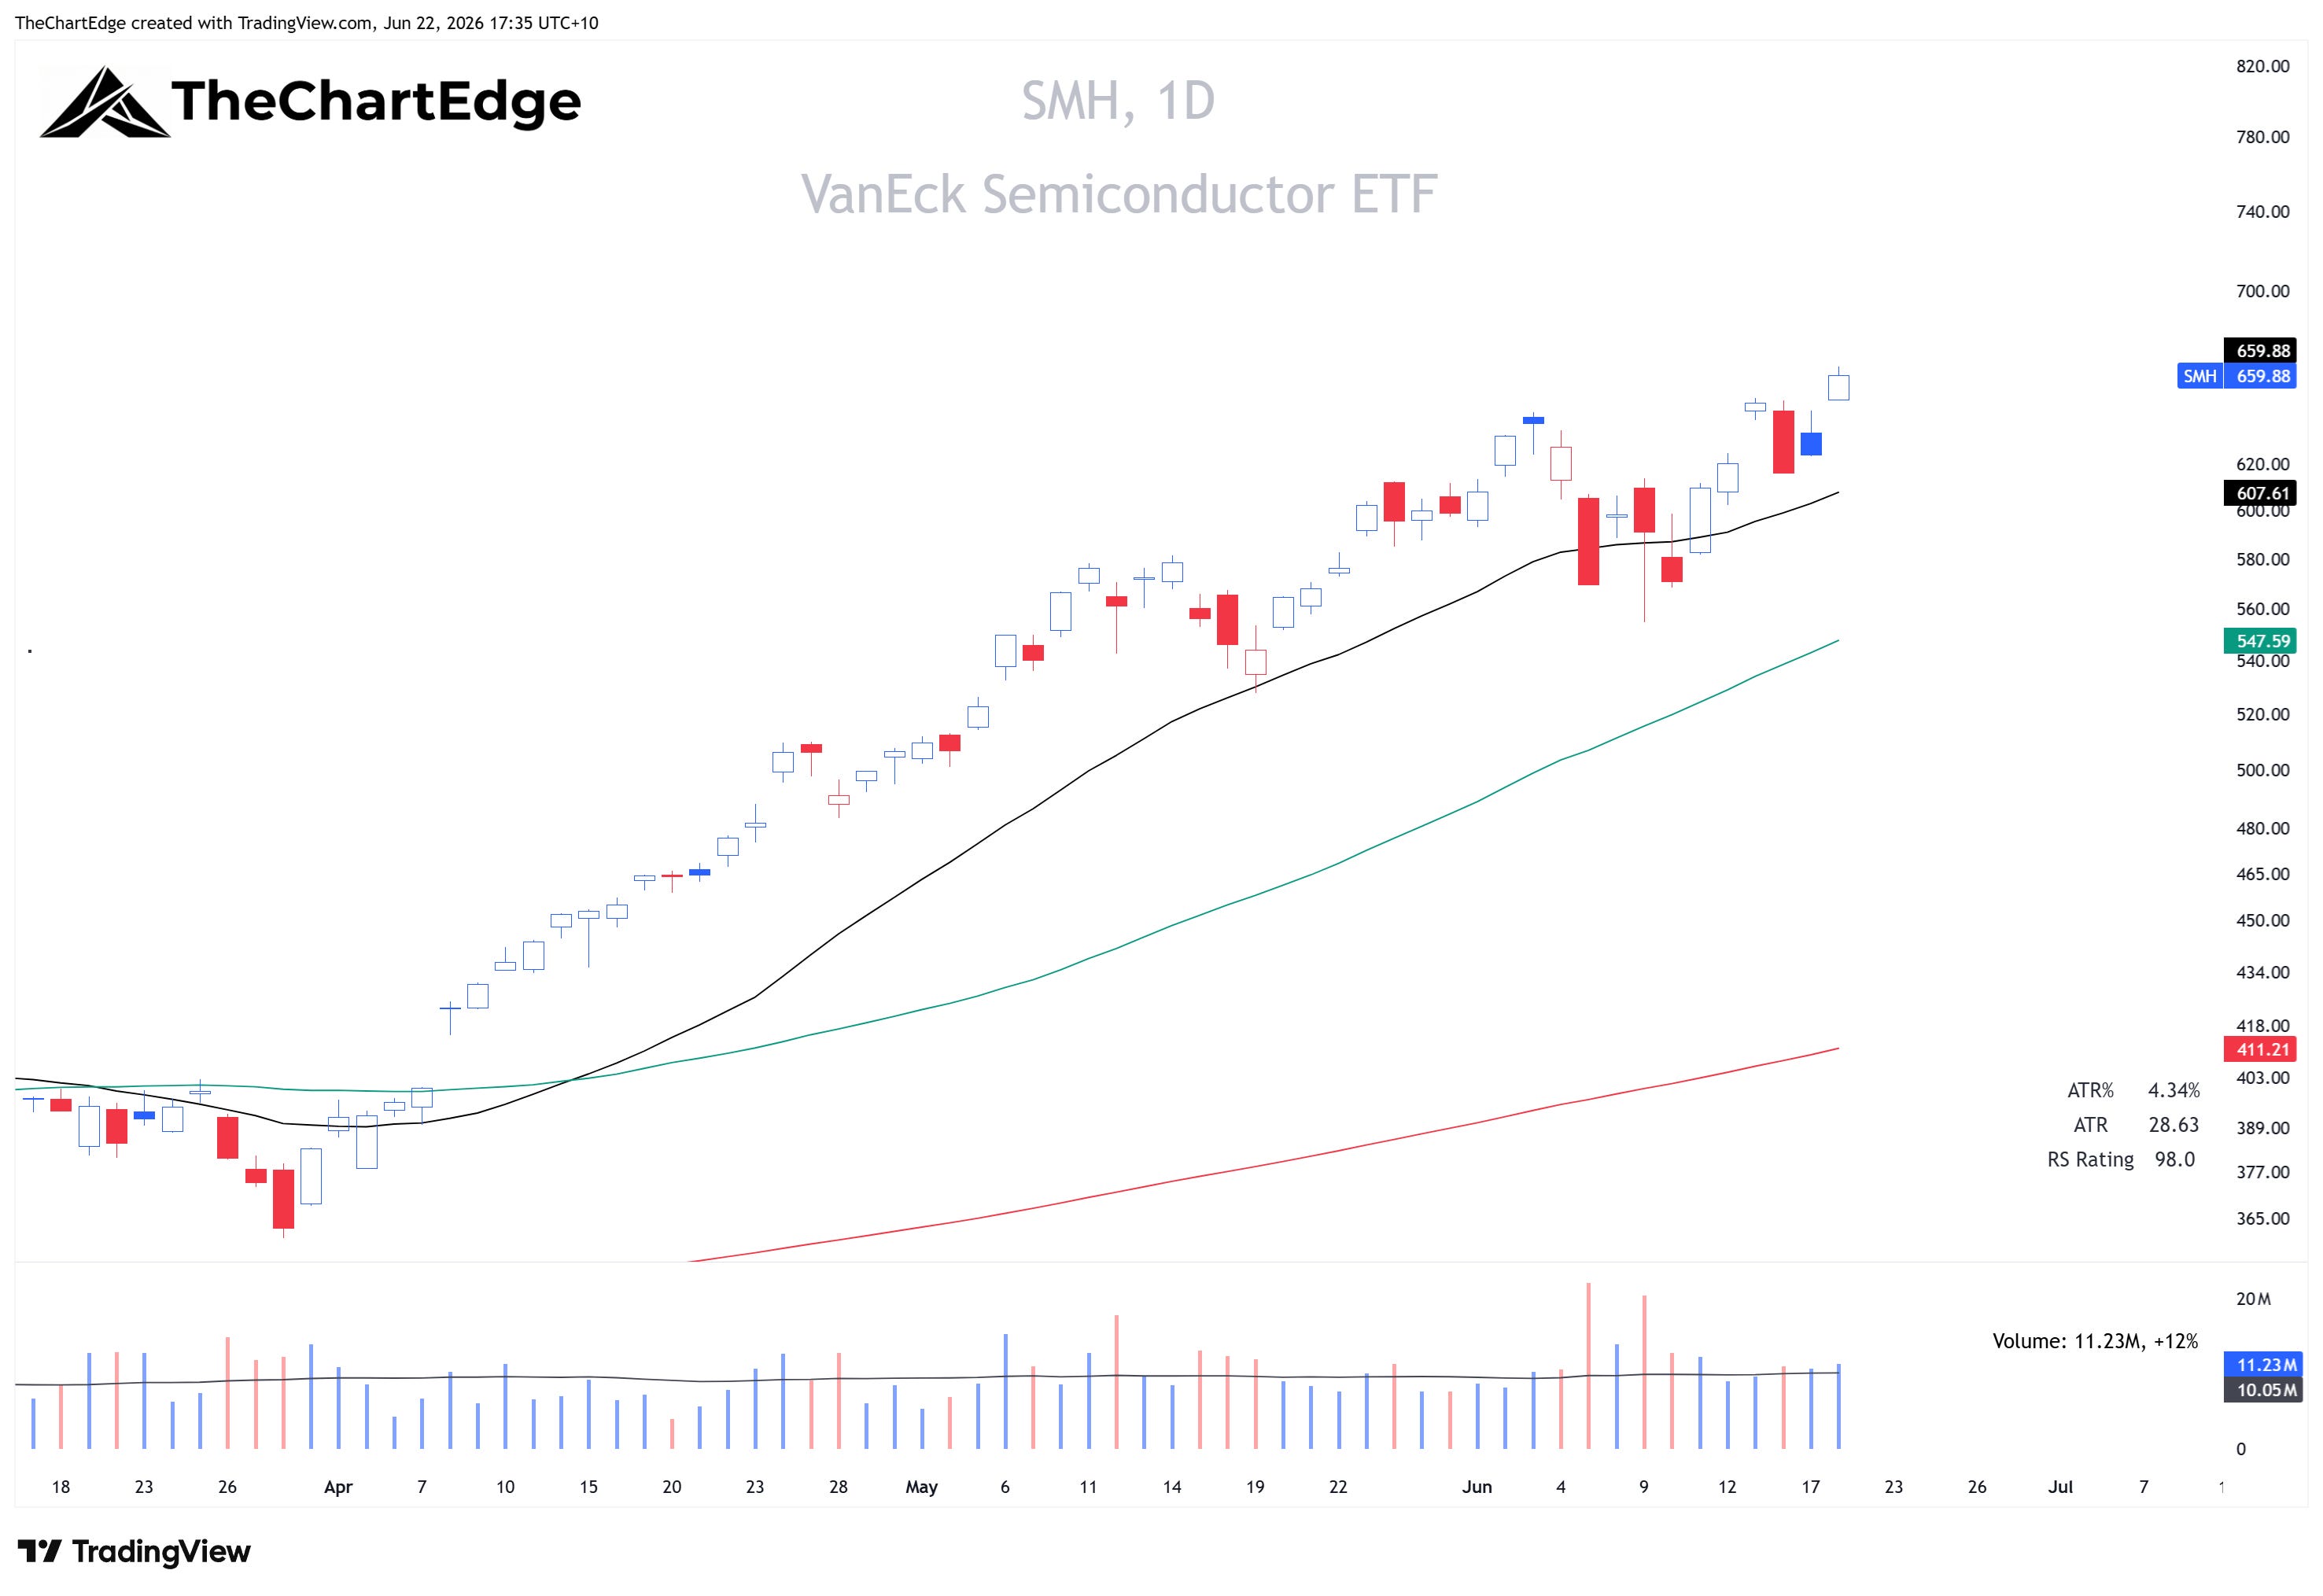
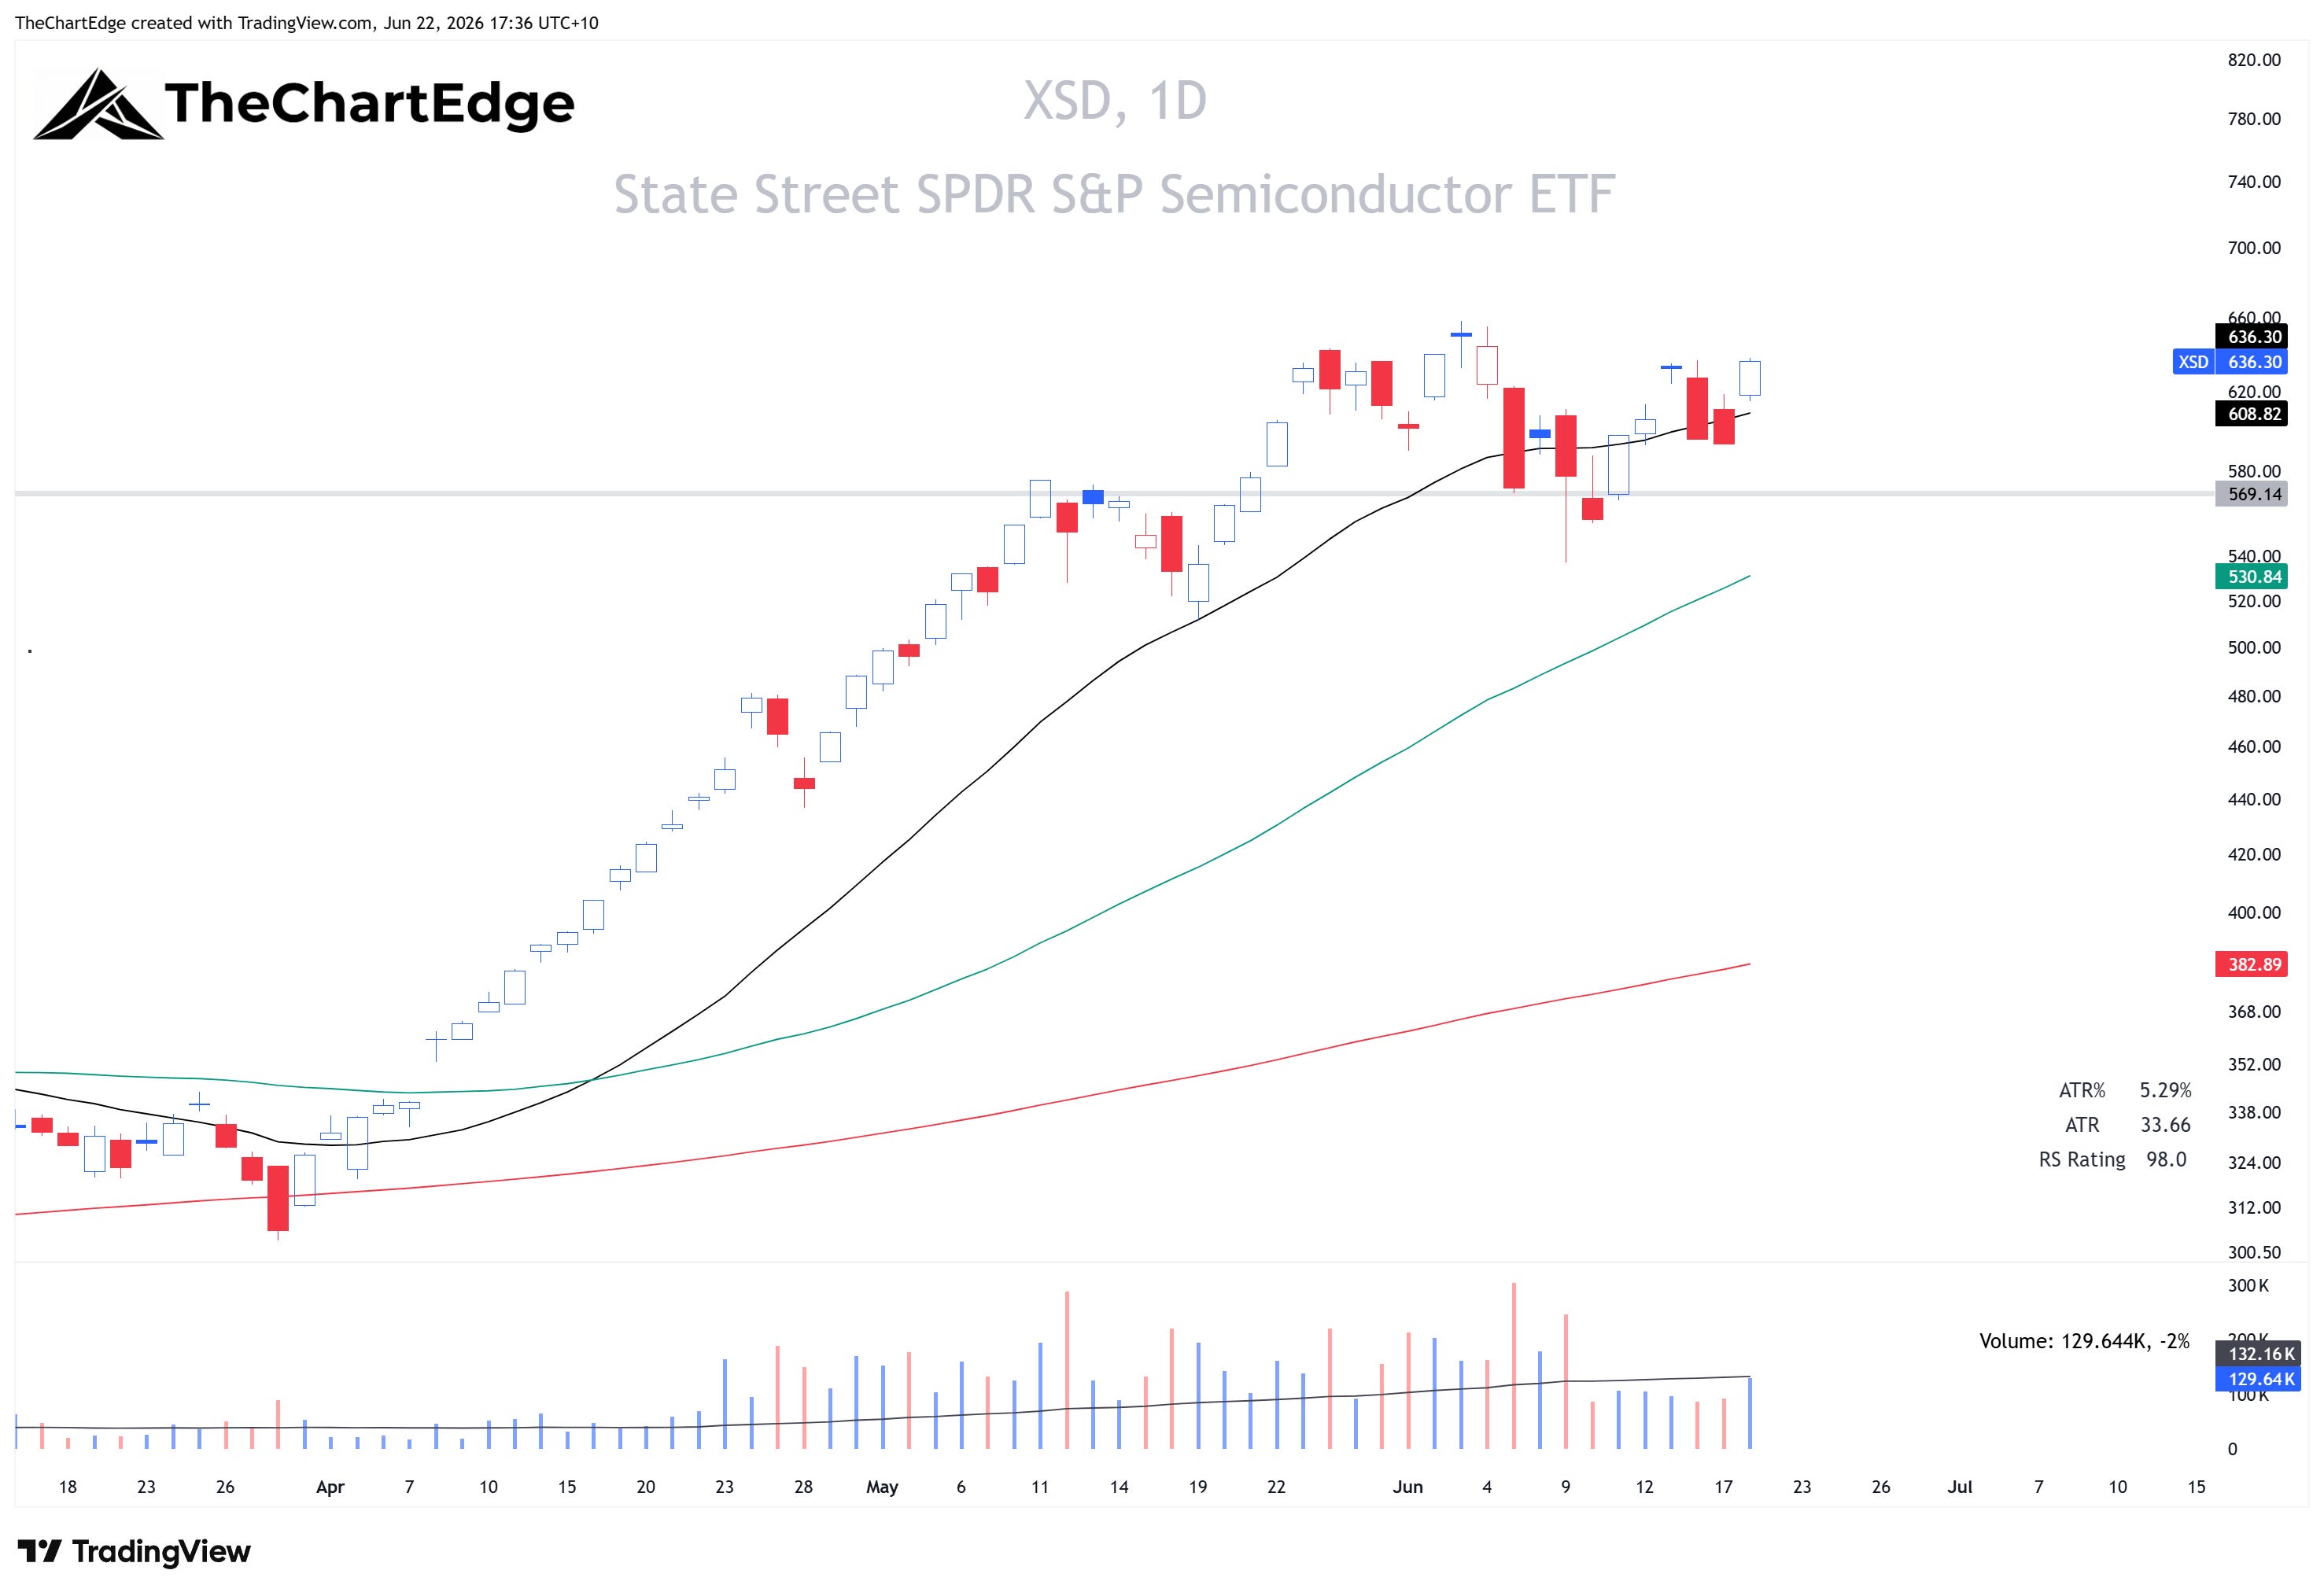
SMH rose 6.4%, its second strong week running, and equal-weight semis (XSD) 5.0%, both in Strong Uptrends and sitting at or near their highs.
SMH Chart
XSD Chart
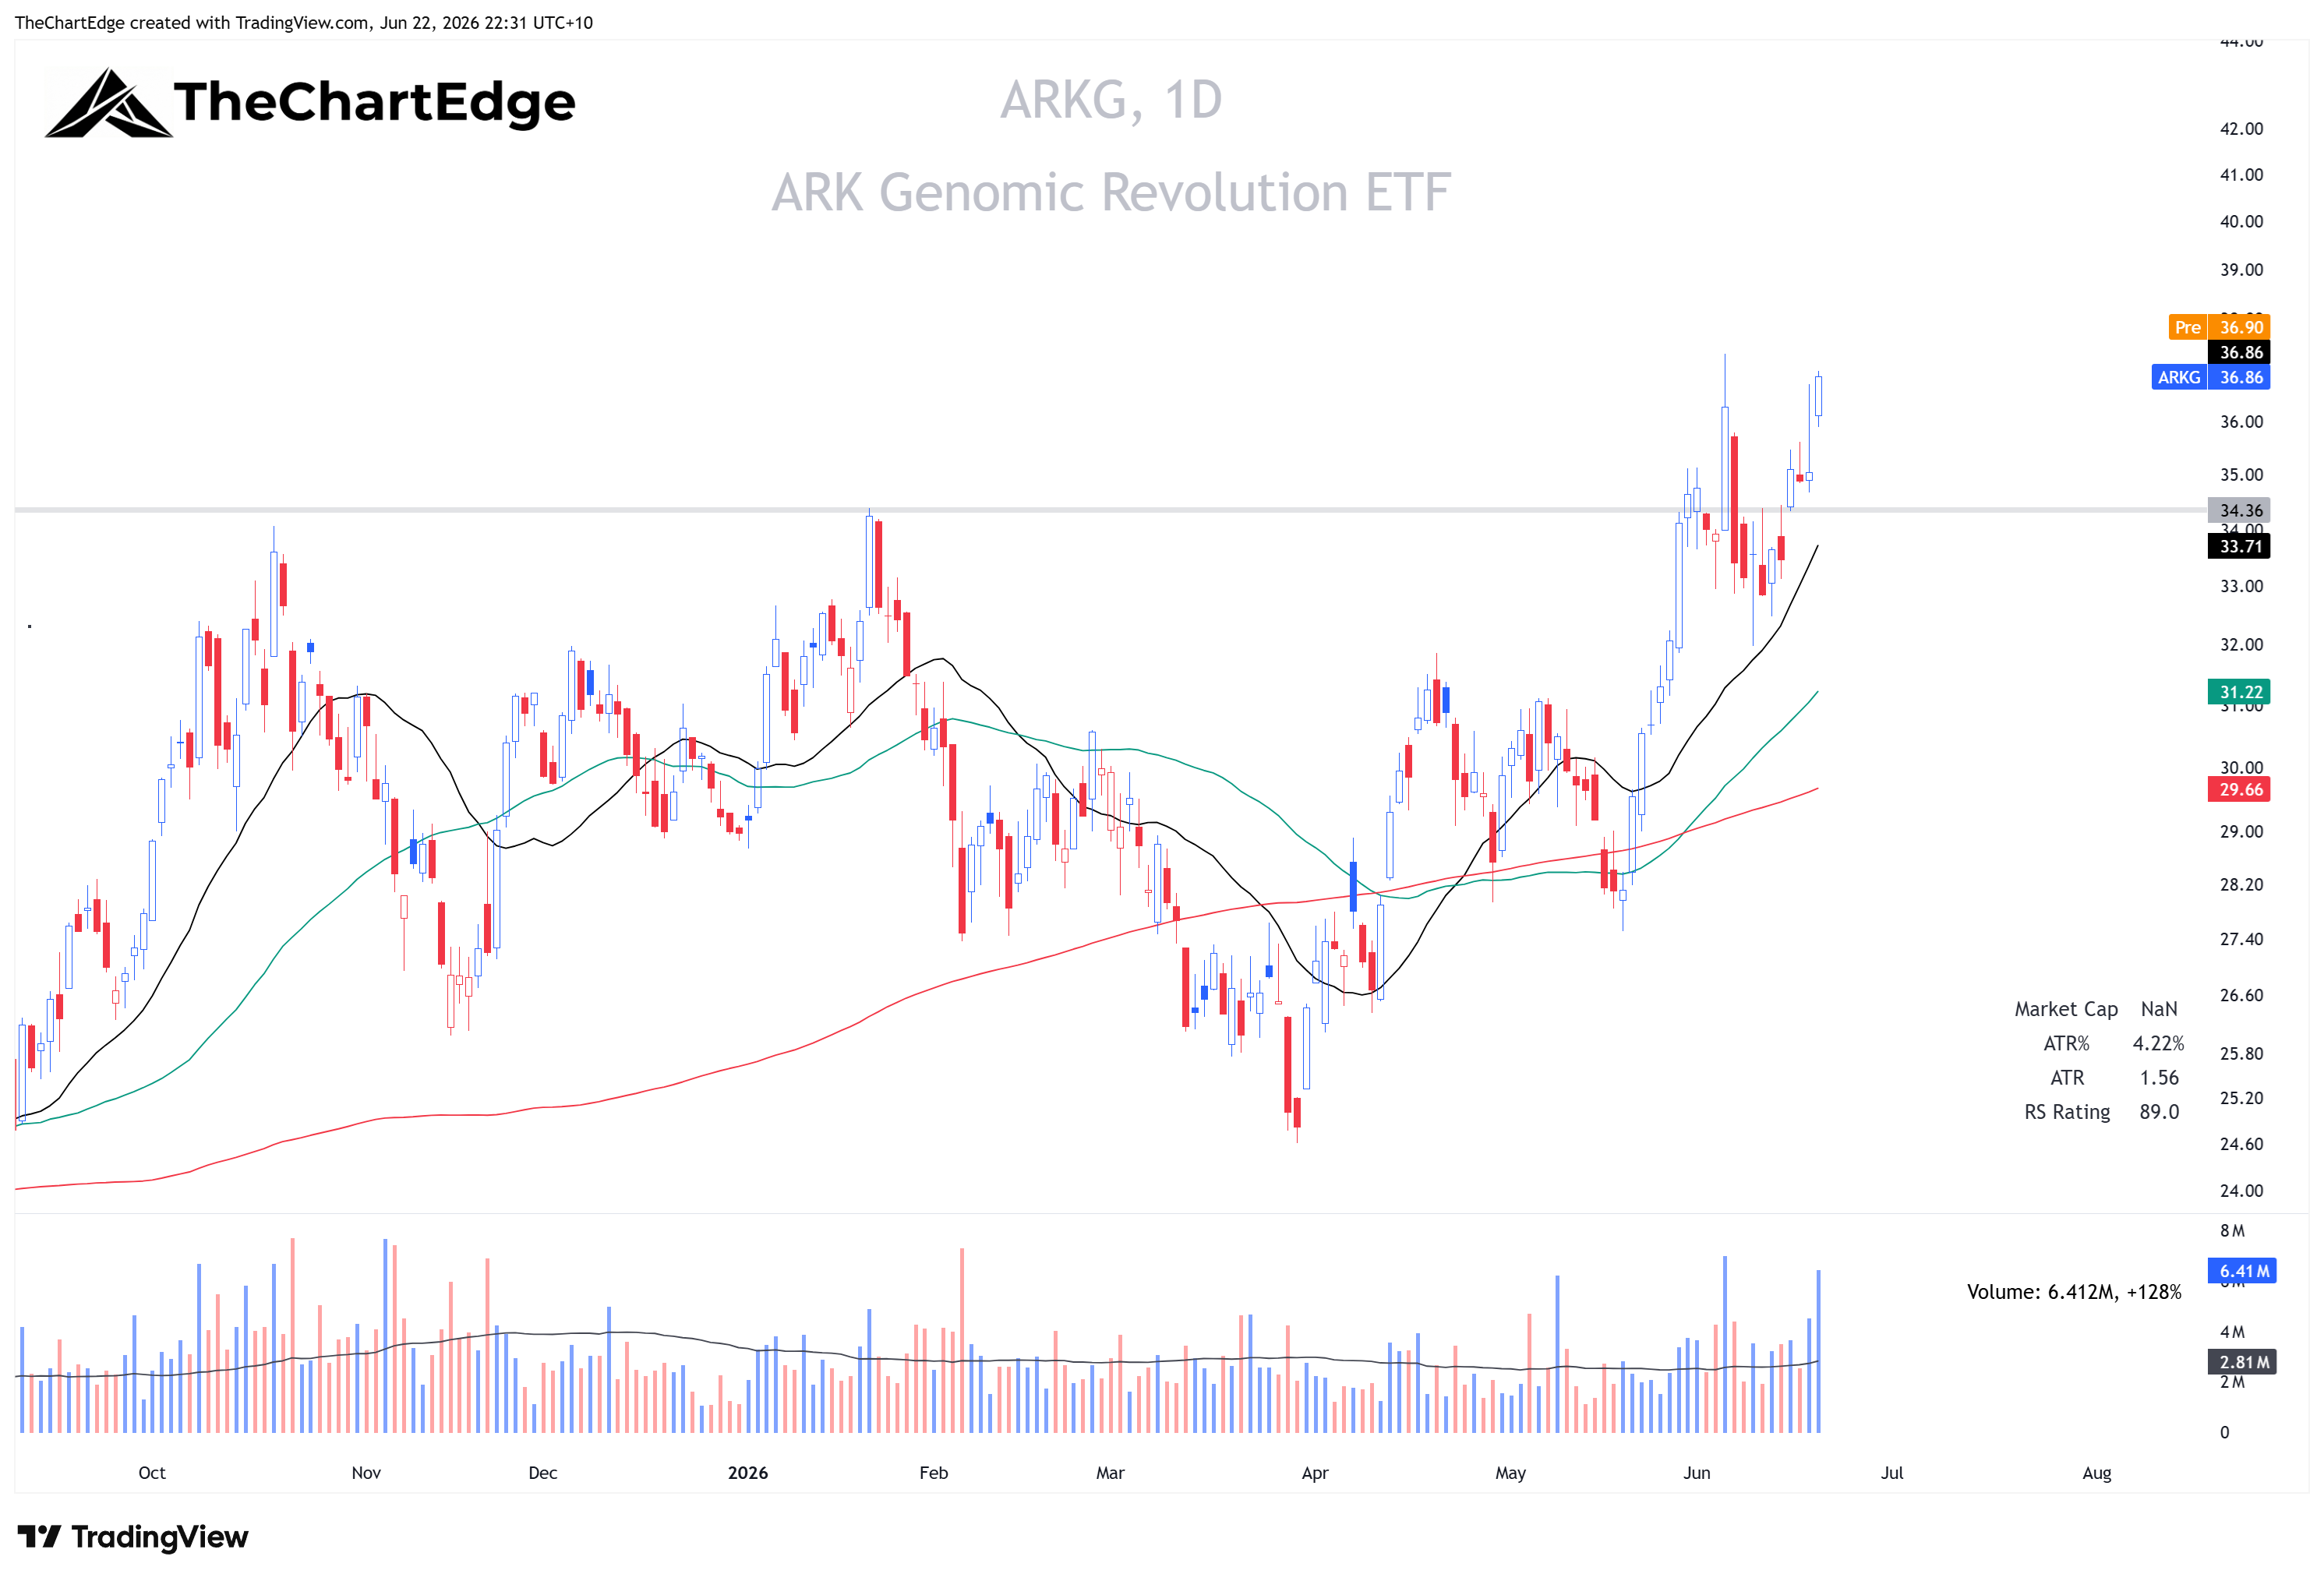
ARK Genomics (ARKG) jumped over 10% but is still a long way off its prior all-time highs.
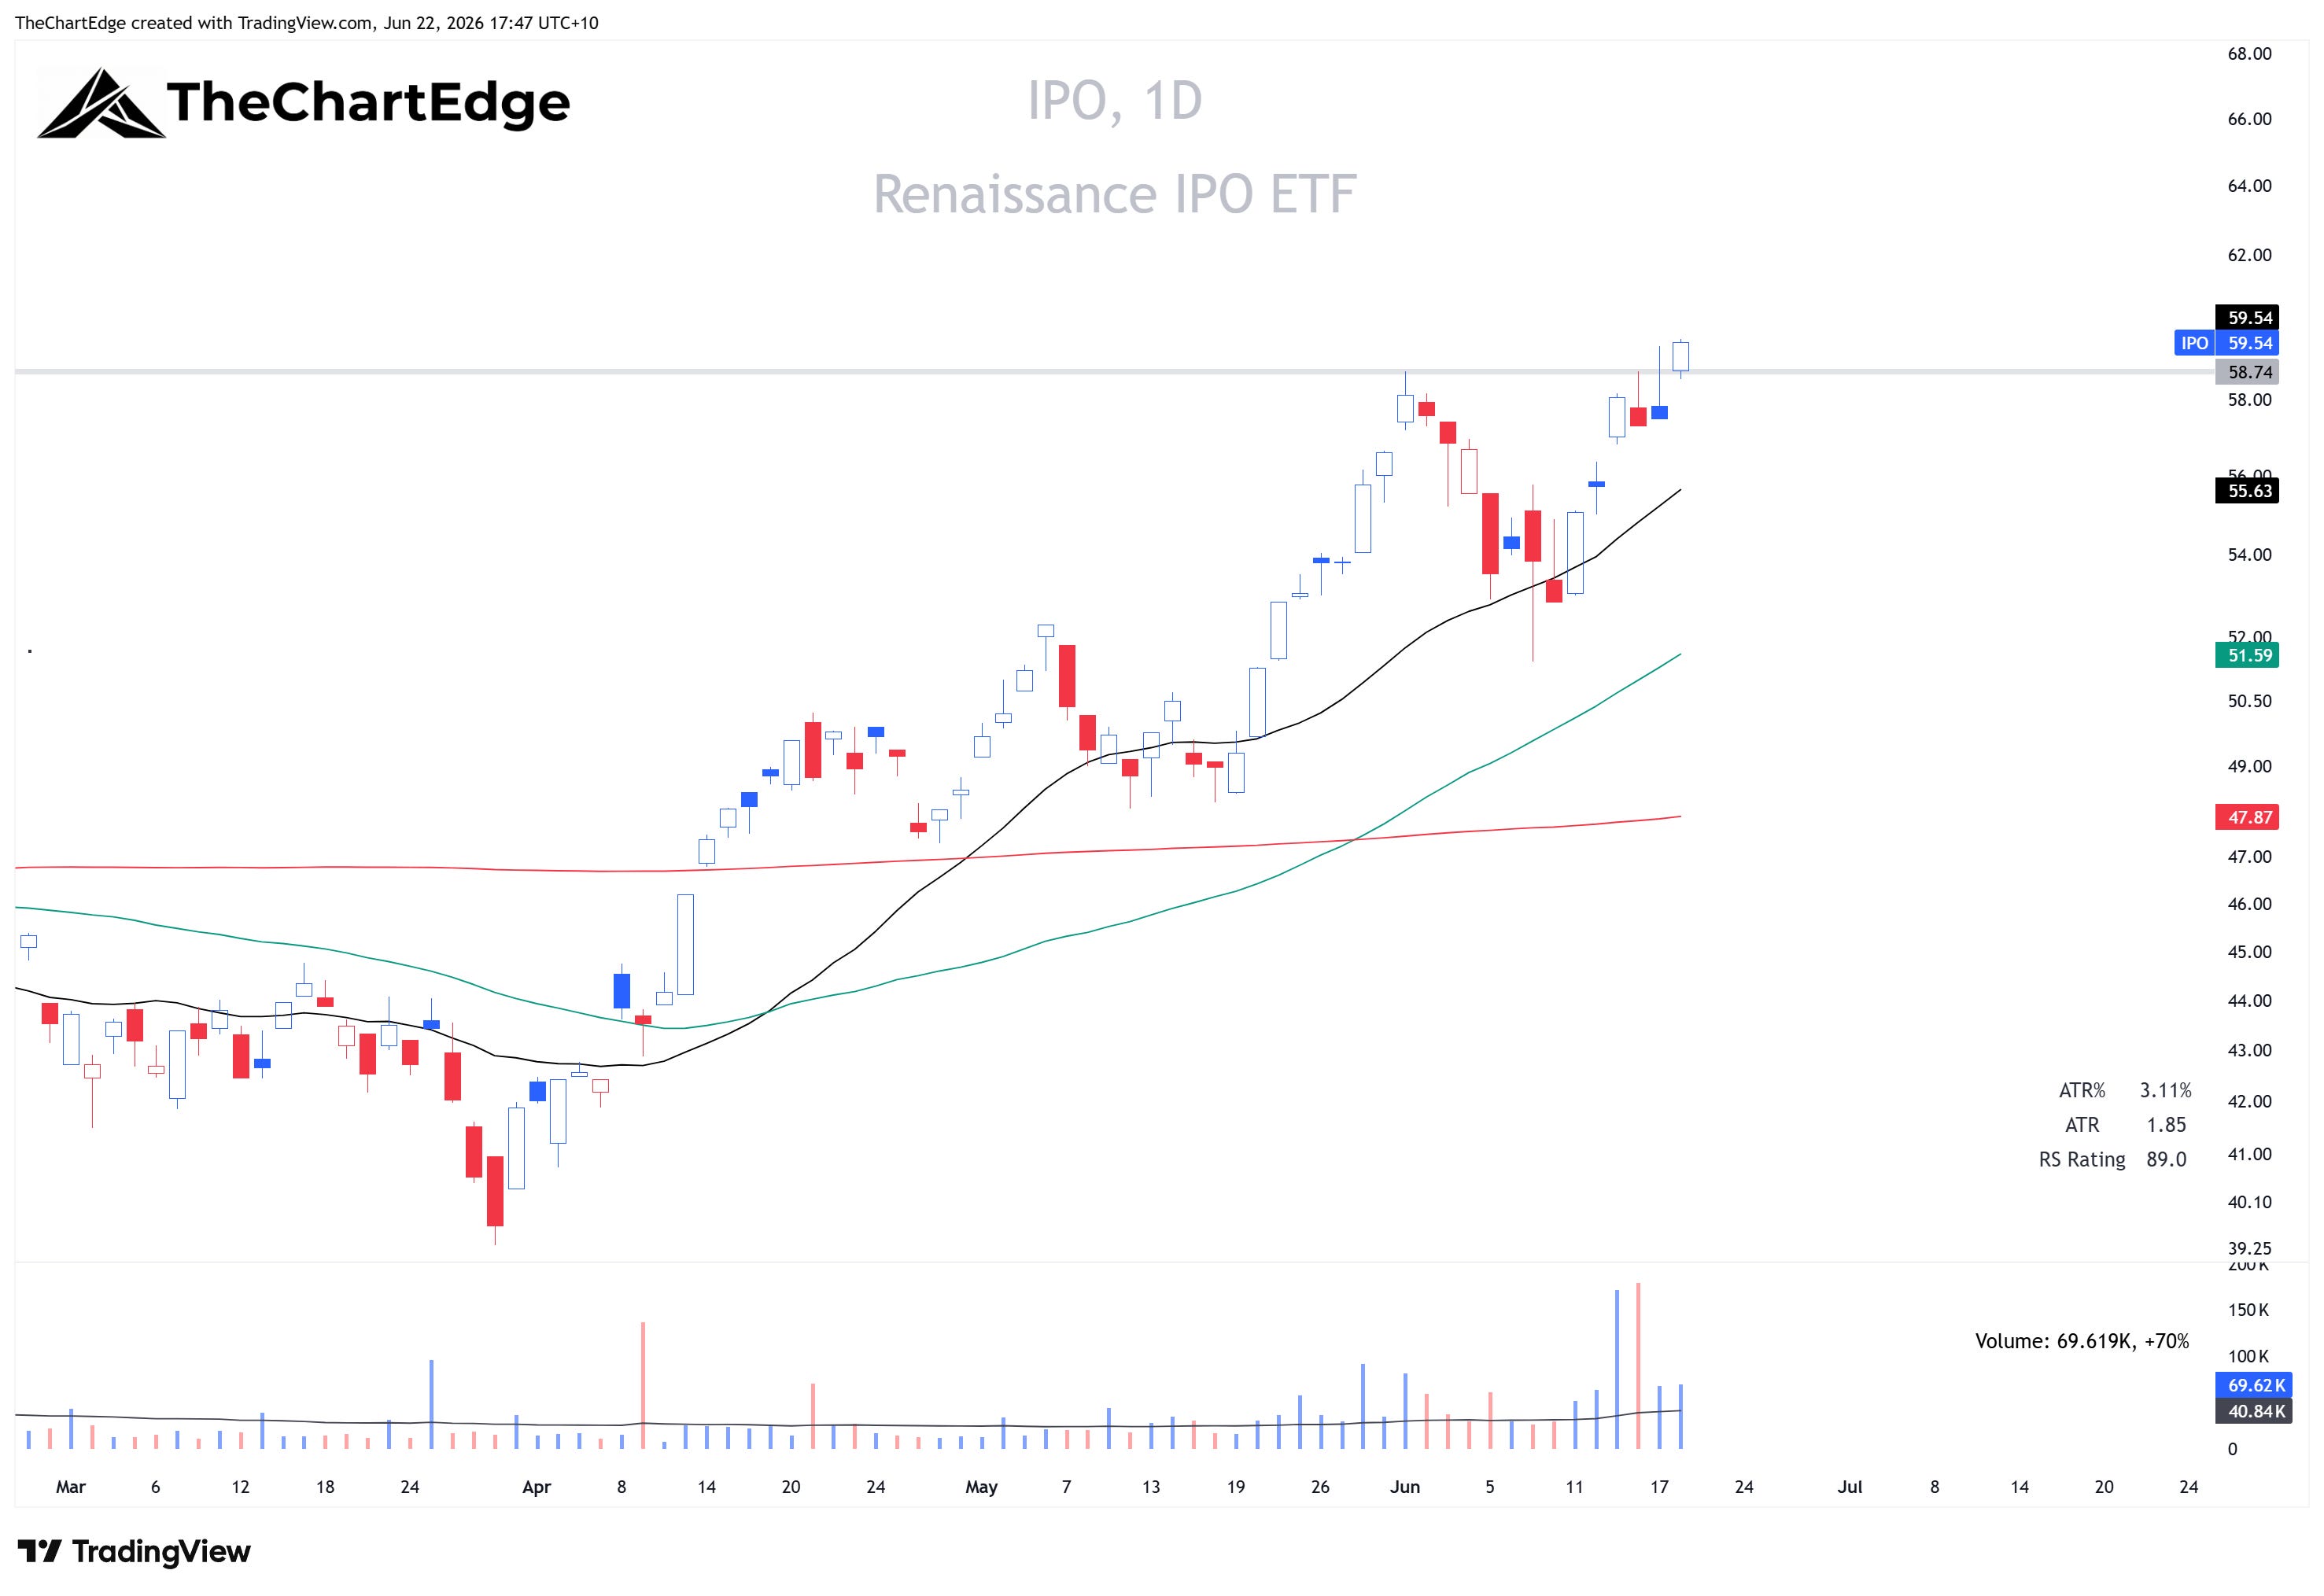
The new-issues ETF basket (IPO) had another big week and still sits second on the table.
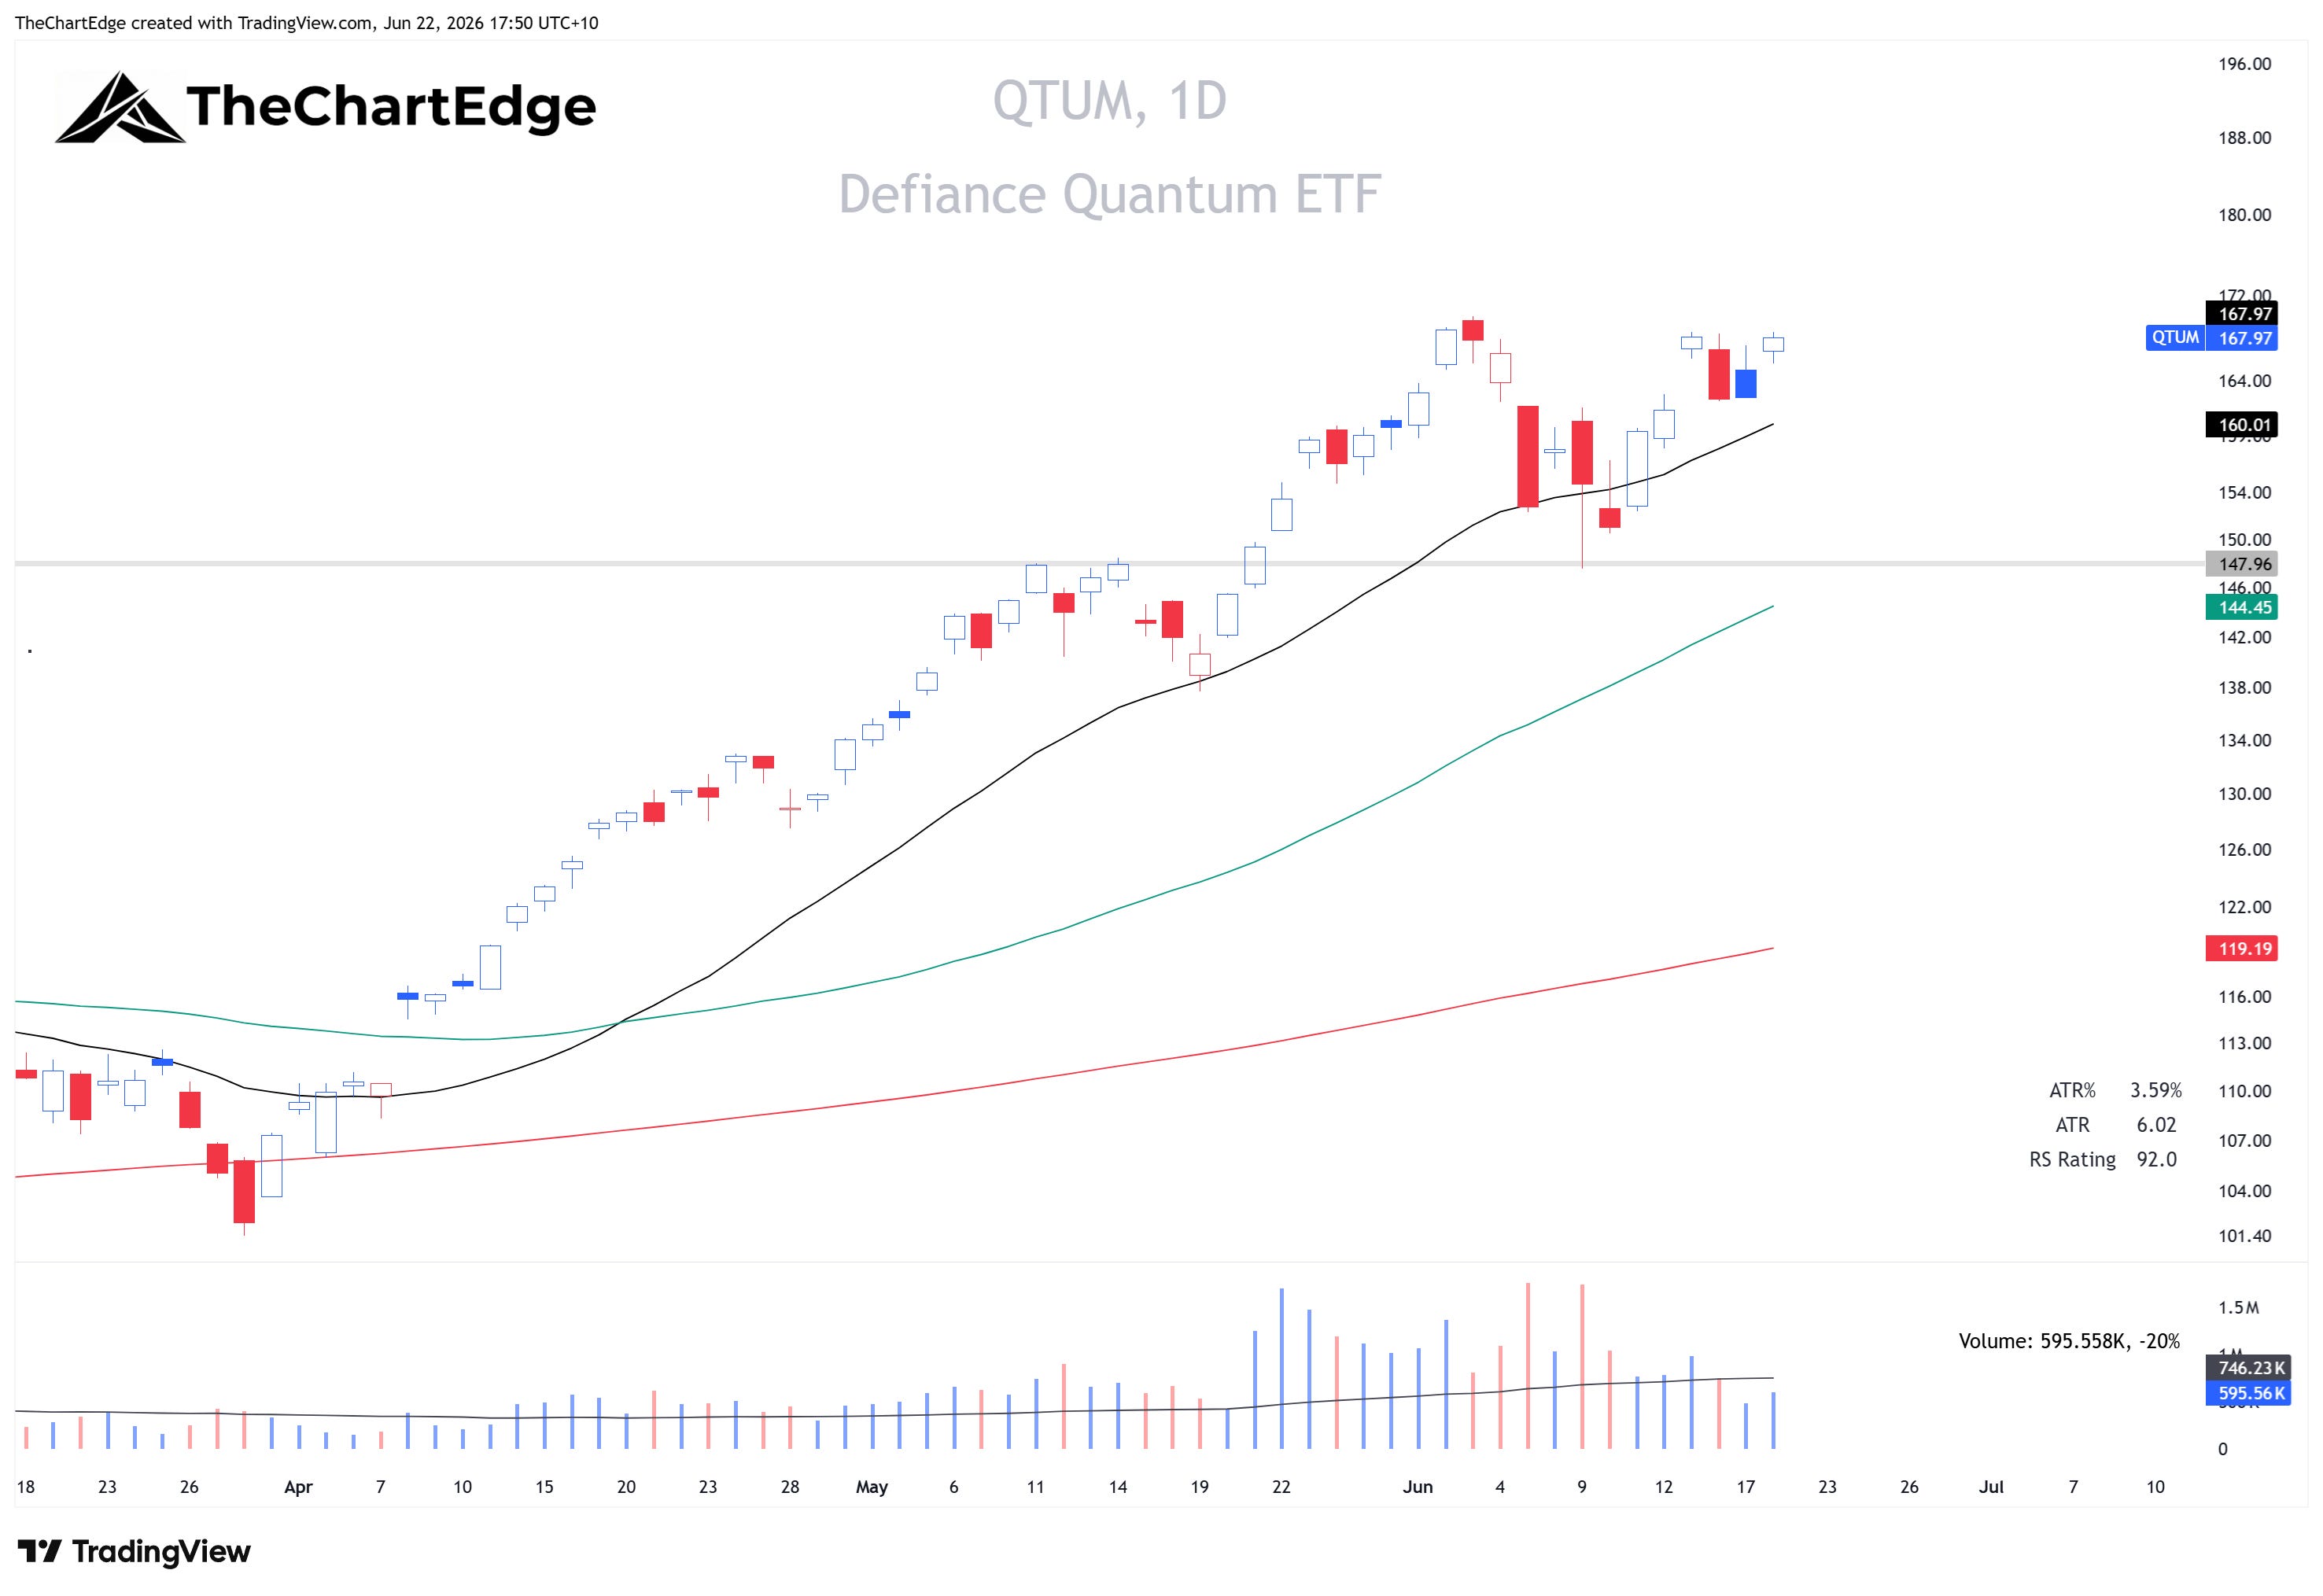
QTUM is on the verge of a breakout to all-time highs.
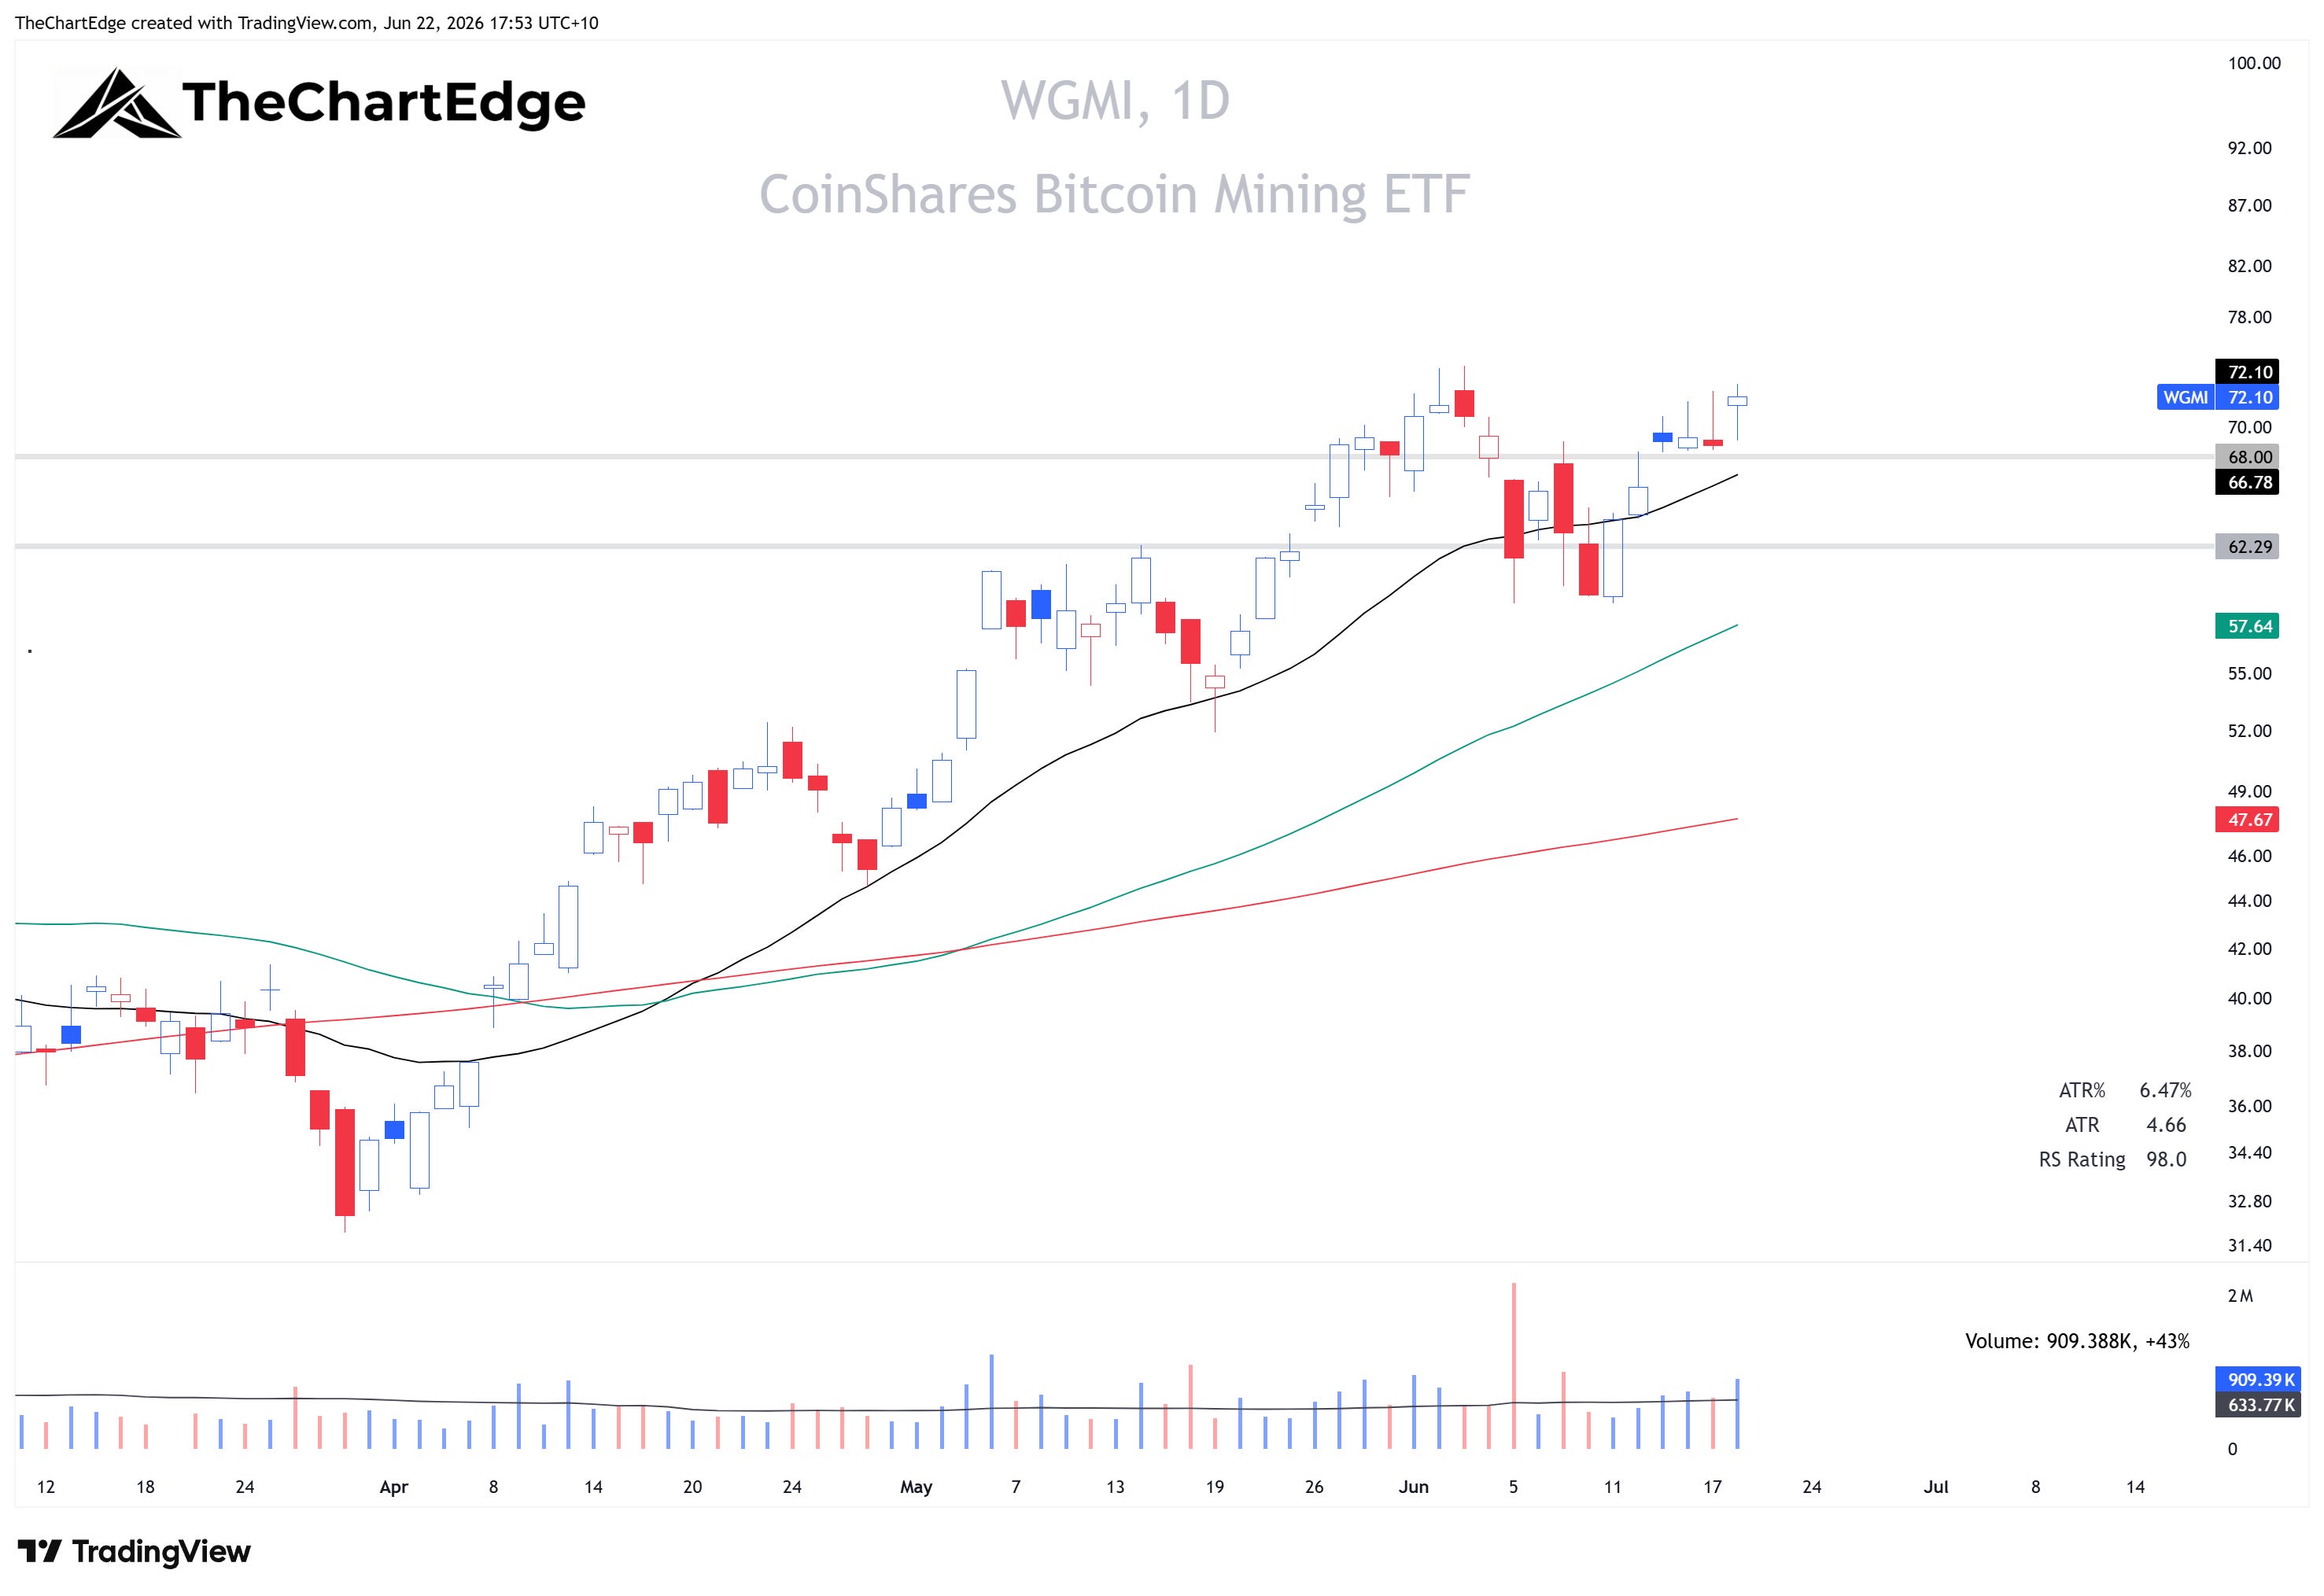
Crypto miners (WGMI) sit in fifth place again, even though Bitcoin (IBIT) and Ether (ETHA) are both in Strong Downtrends - most crypto miners trade as an AI proxy now.
WGMI Chart
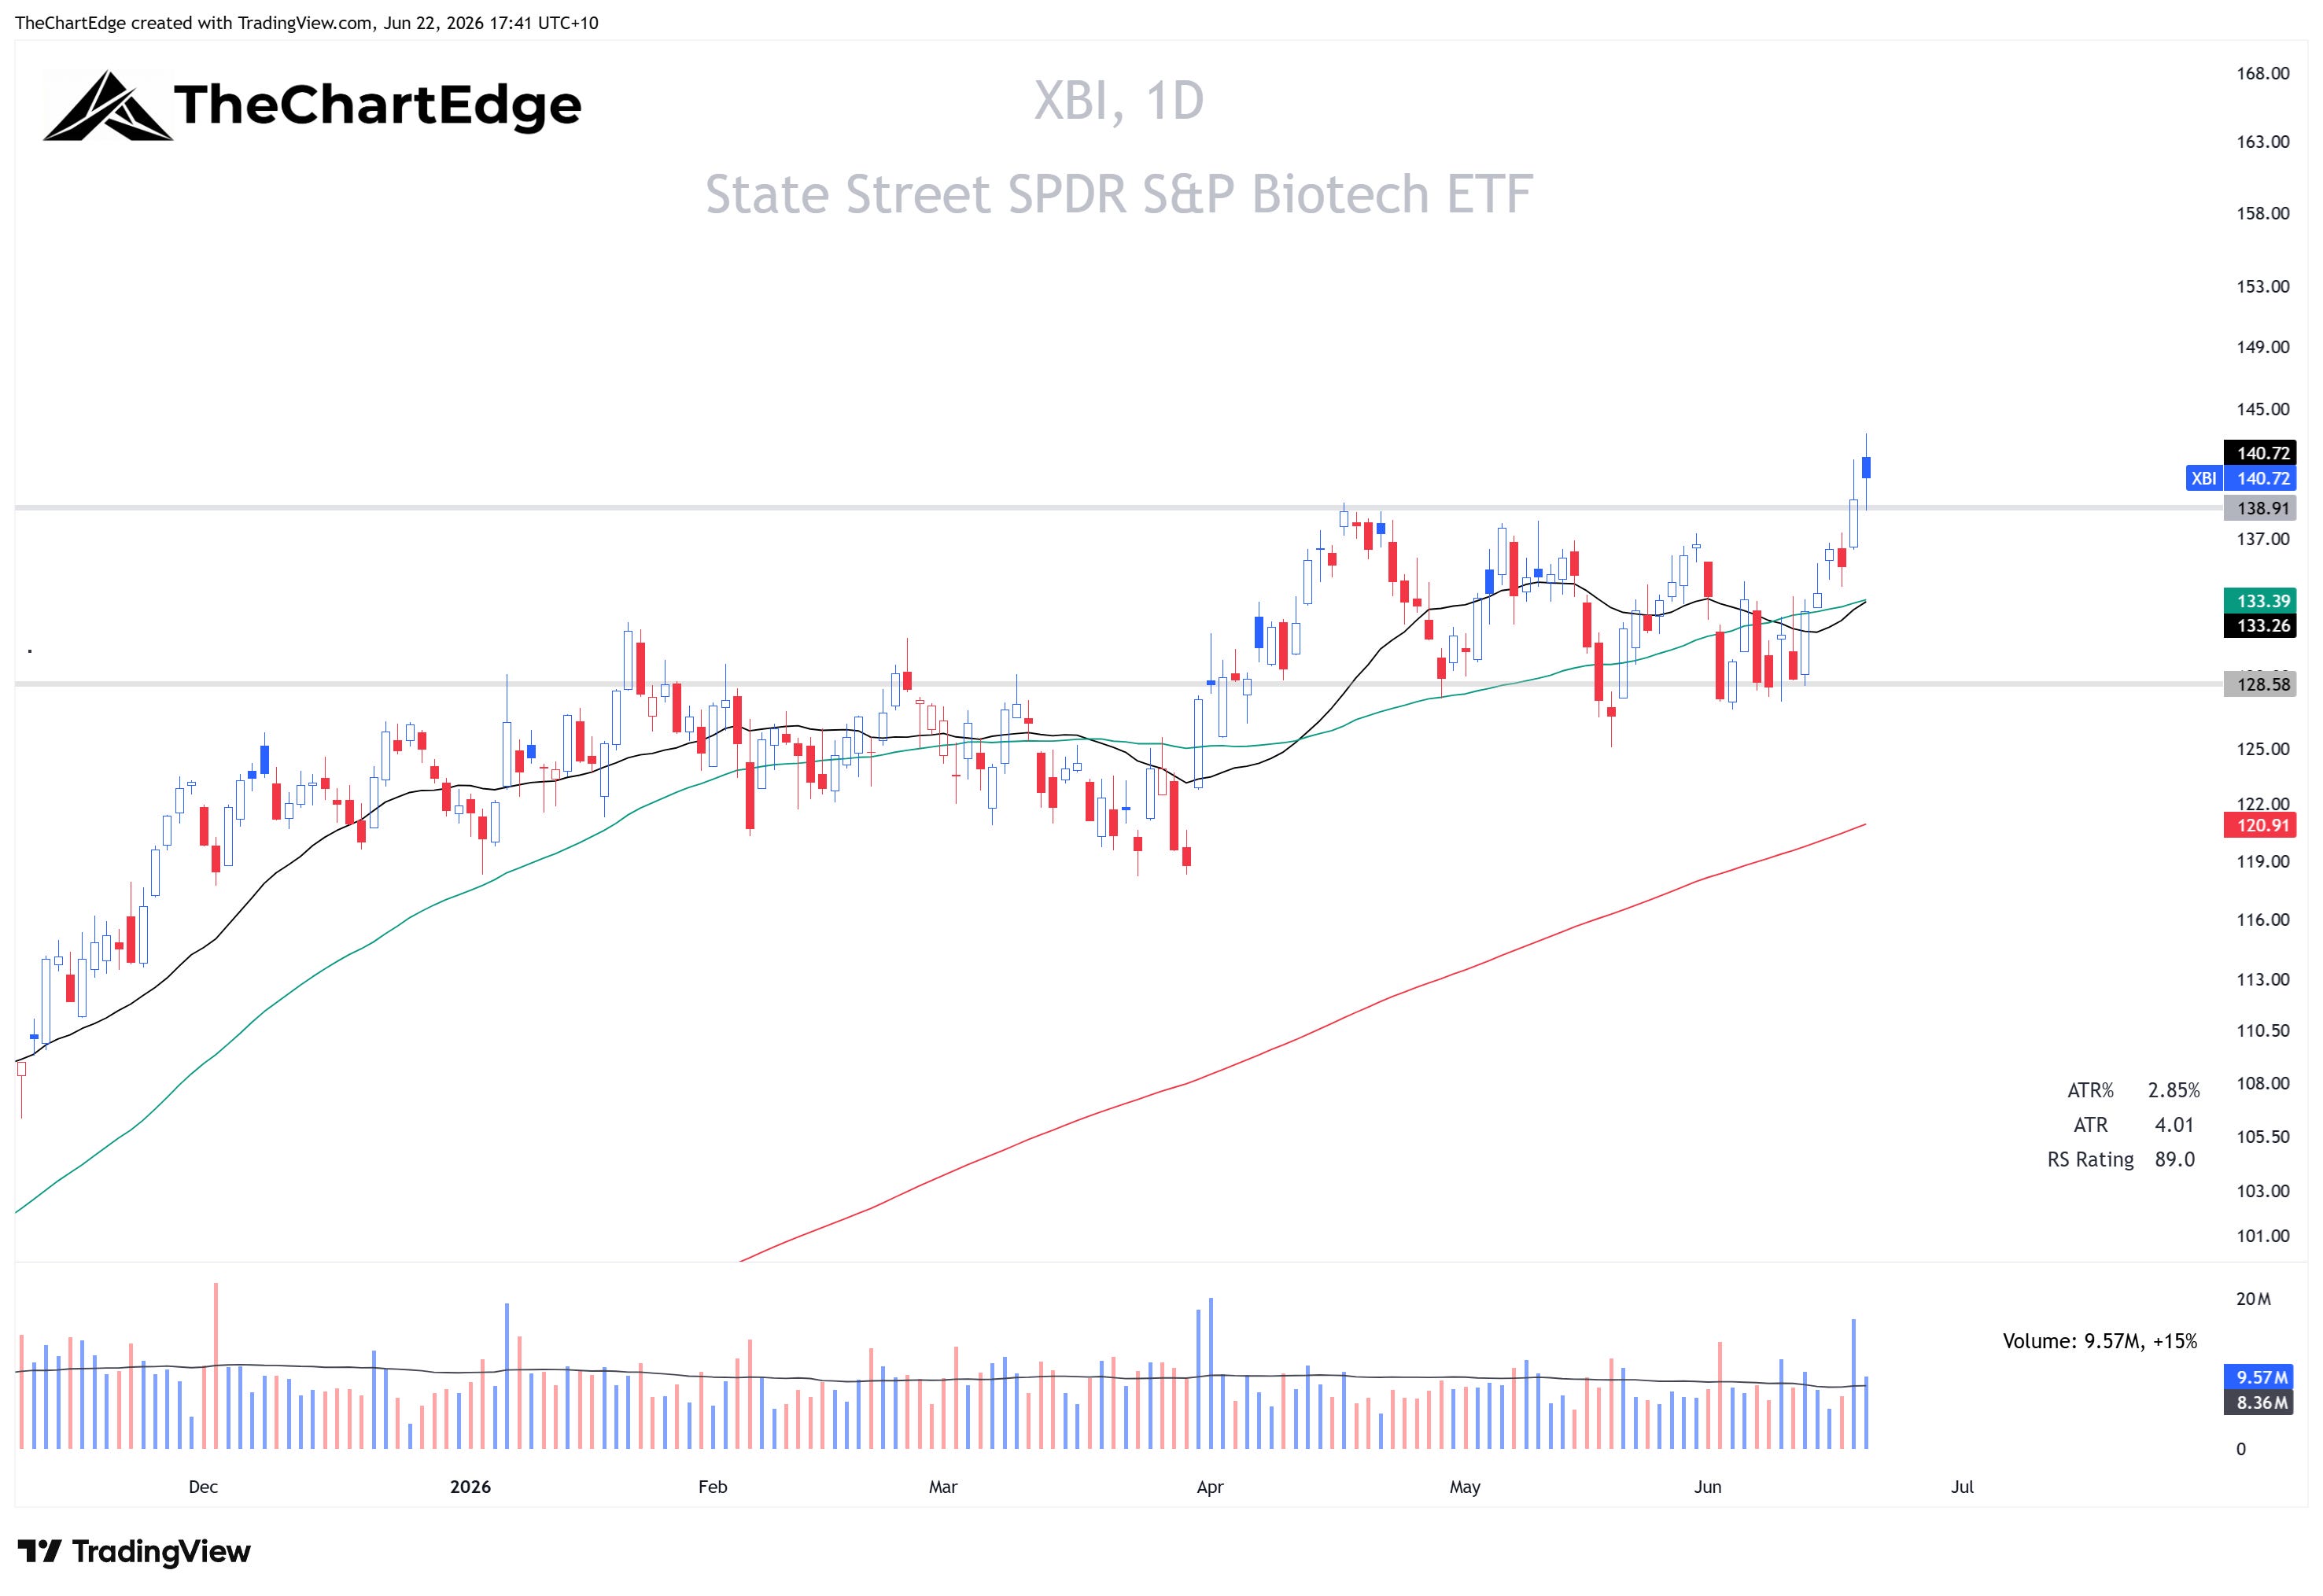
Biotech firmed too. XBI is back in Leading and has finally broken out of the range it’s been in since mid-April.
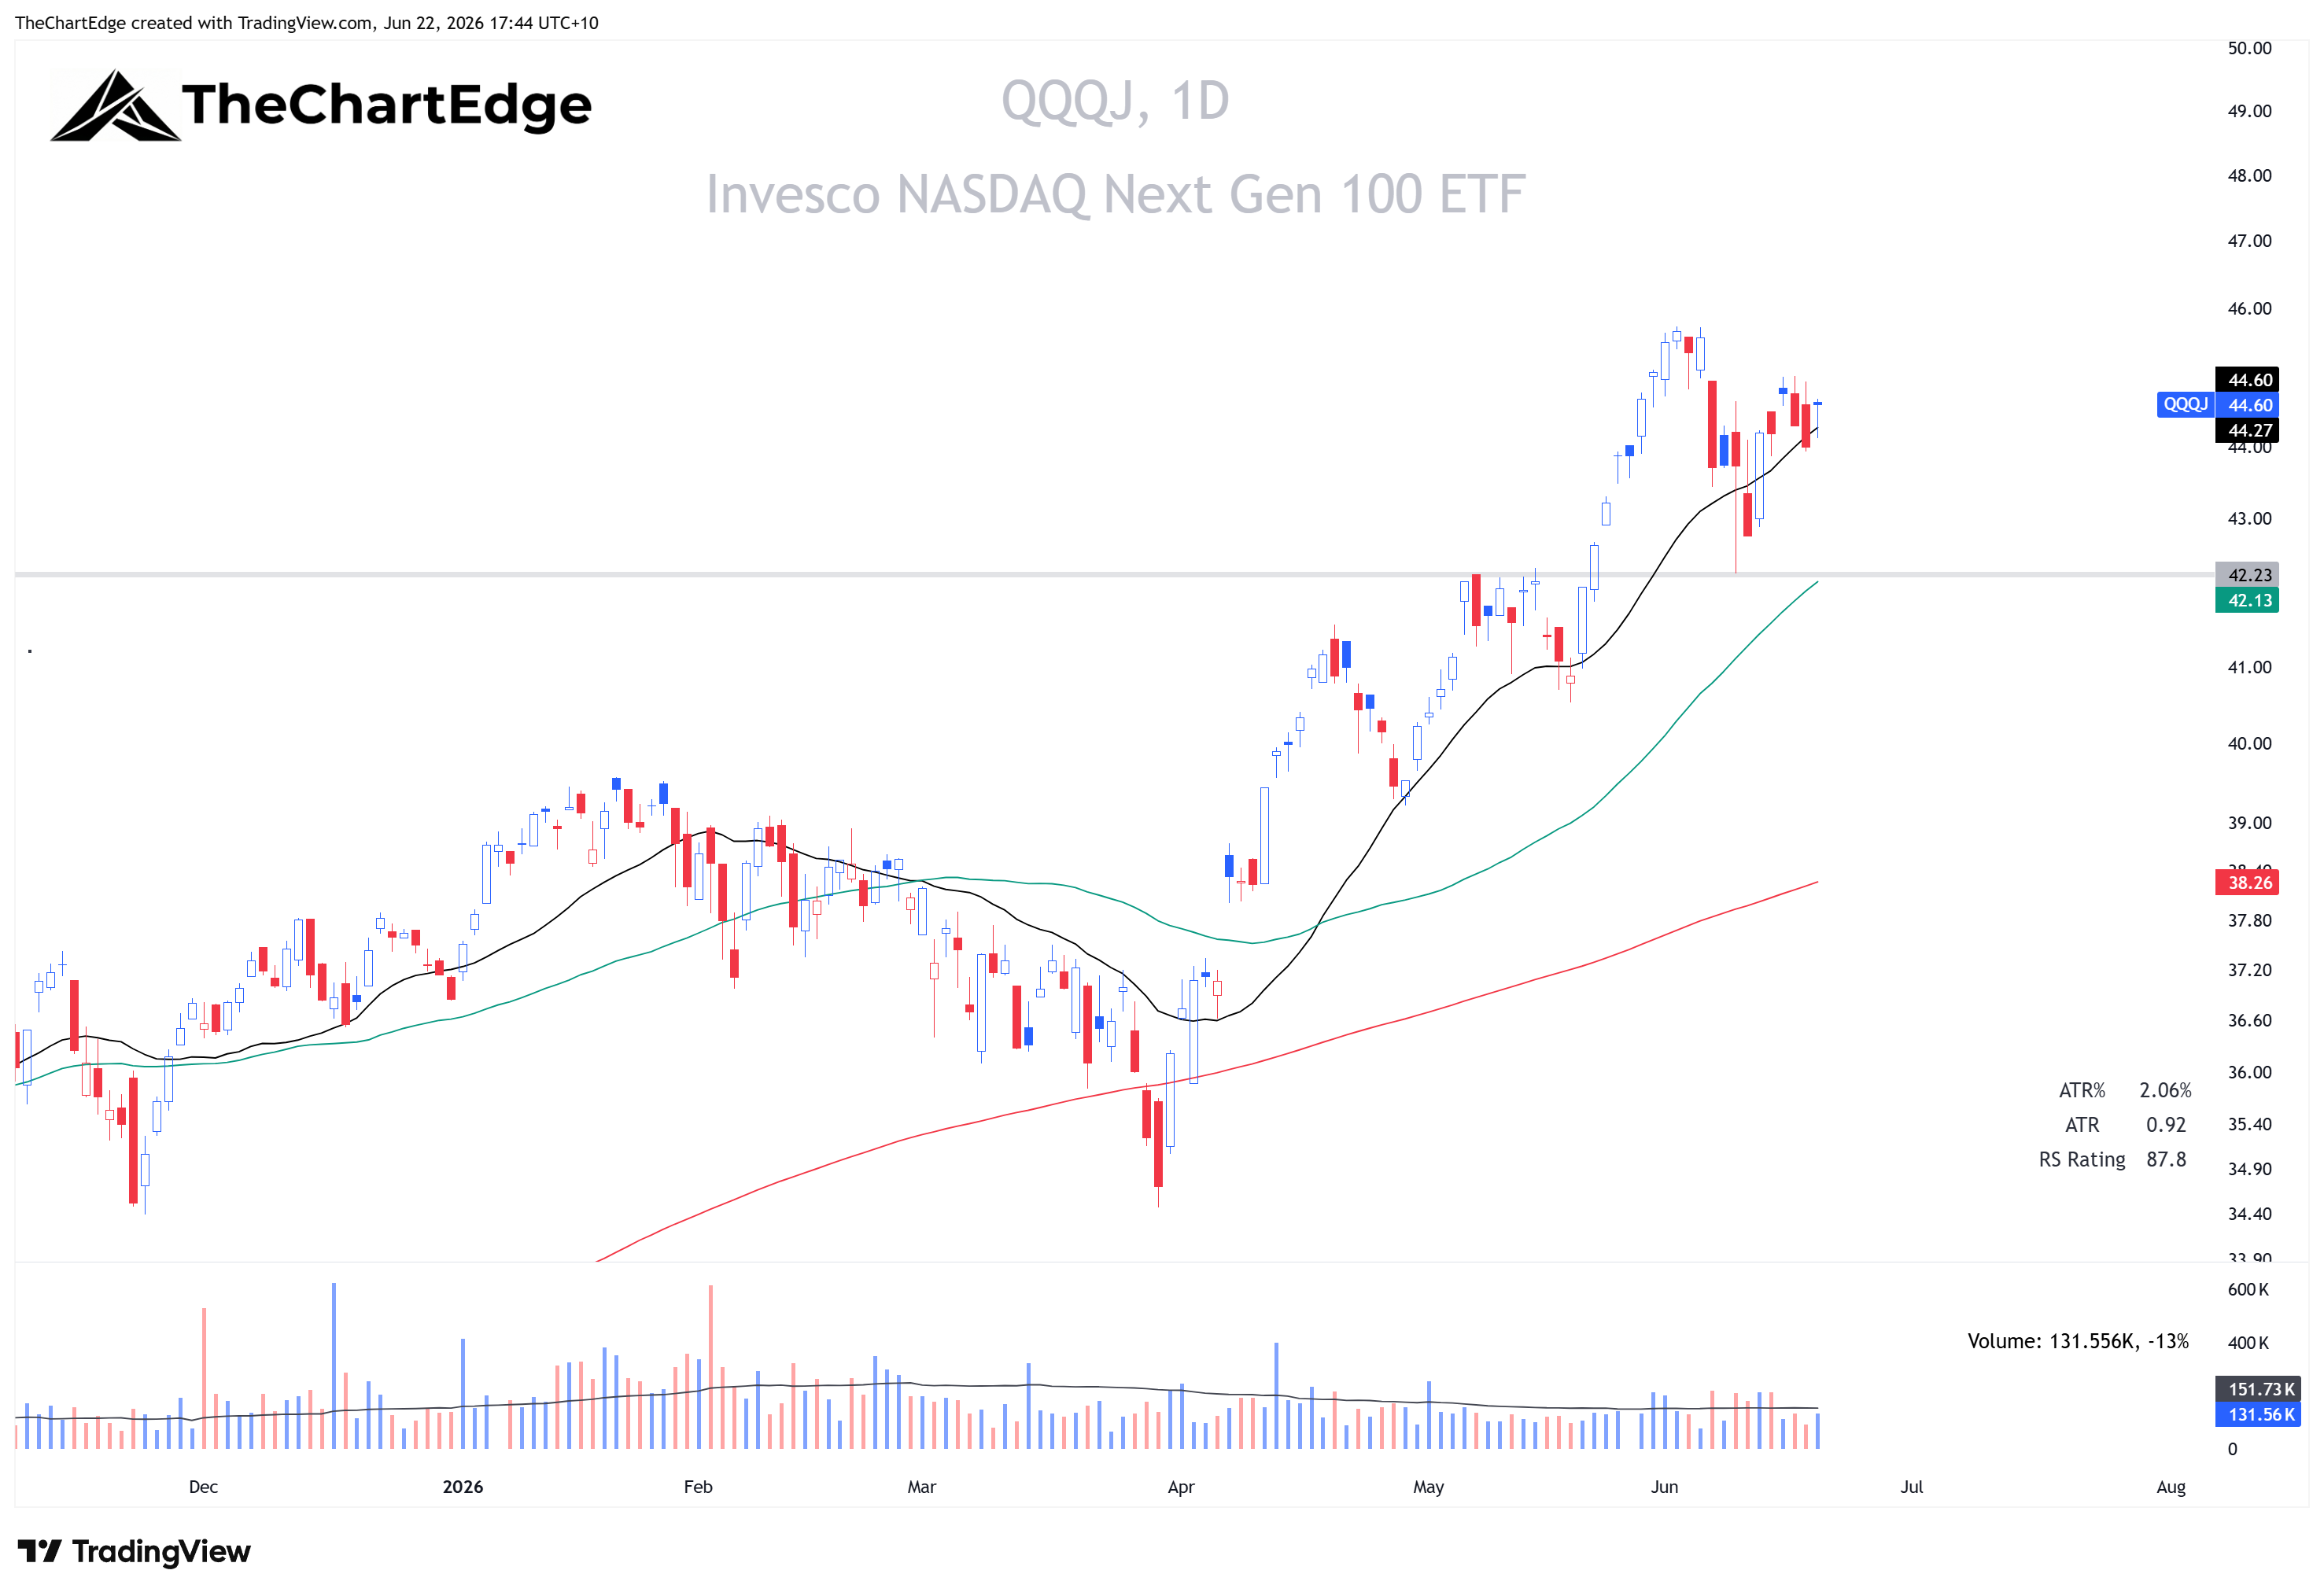
The Nasdaq Next Gen 100 (QQQJ) looks like it might be ready to make another run: Leading, in a Strong Uptrend, and within 2.5% of its all-time highs.
The Banks Stall Out
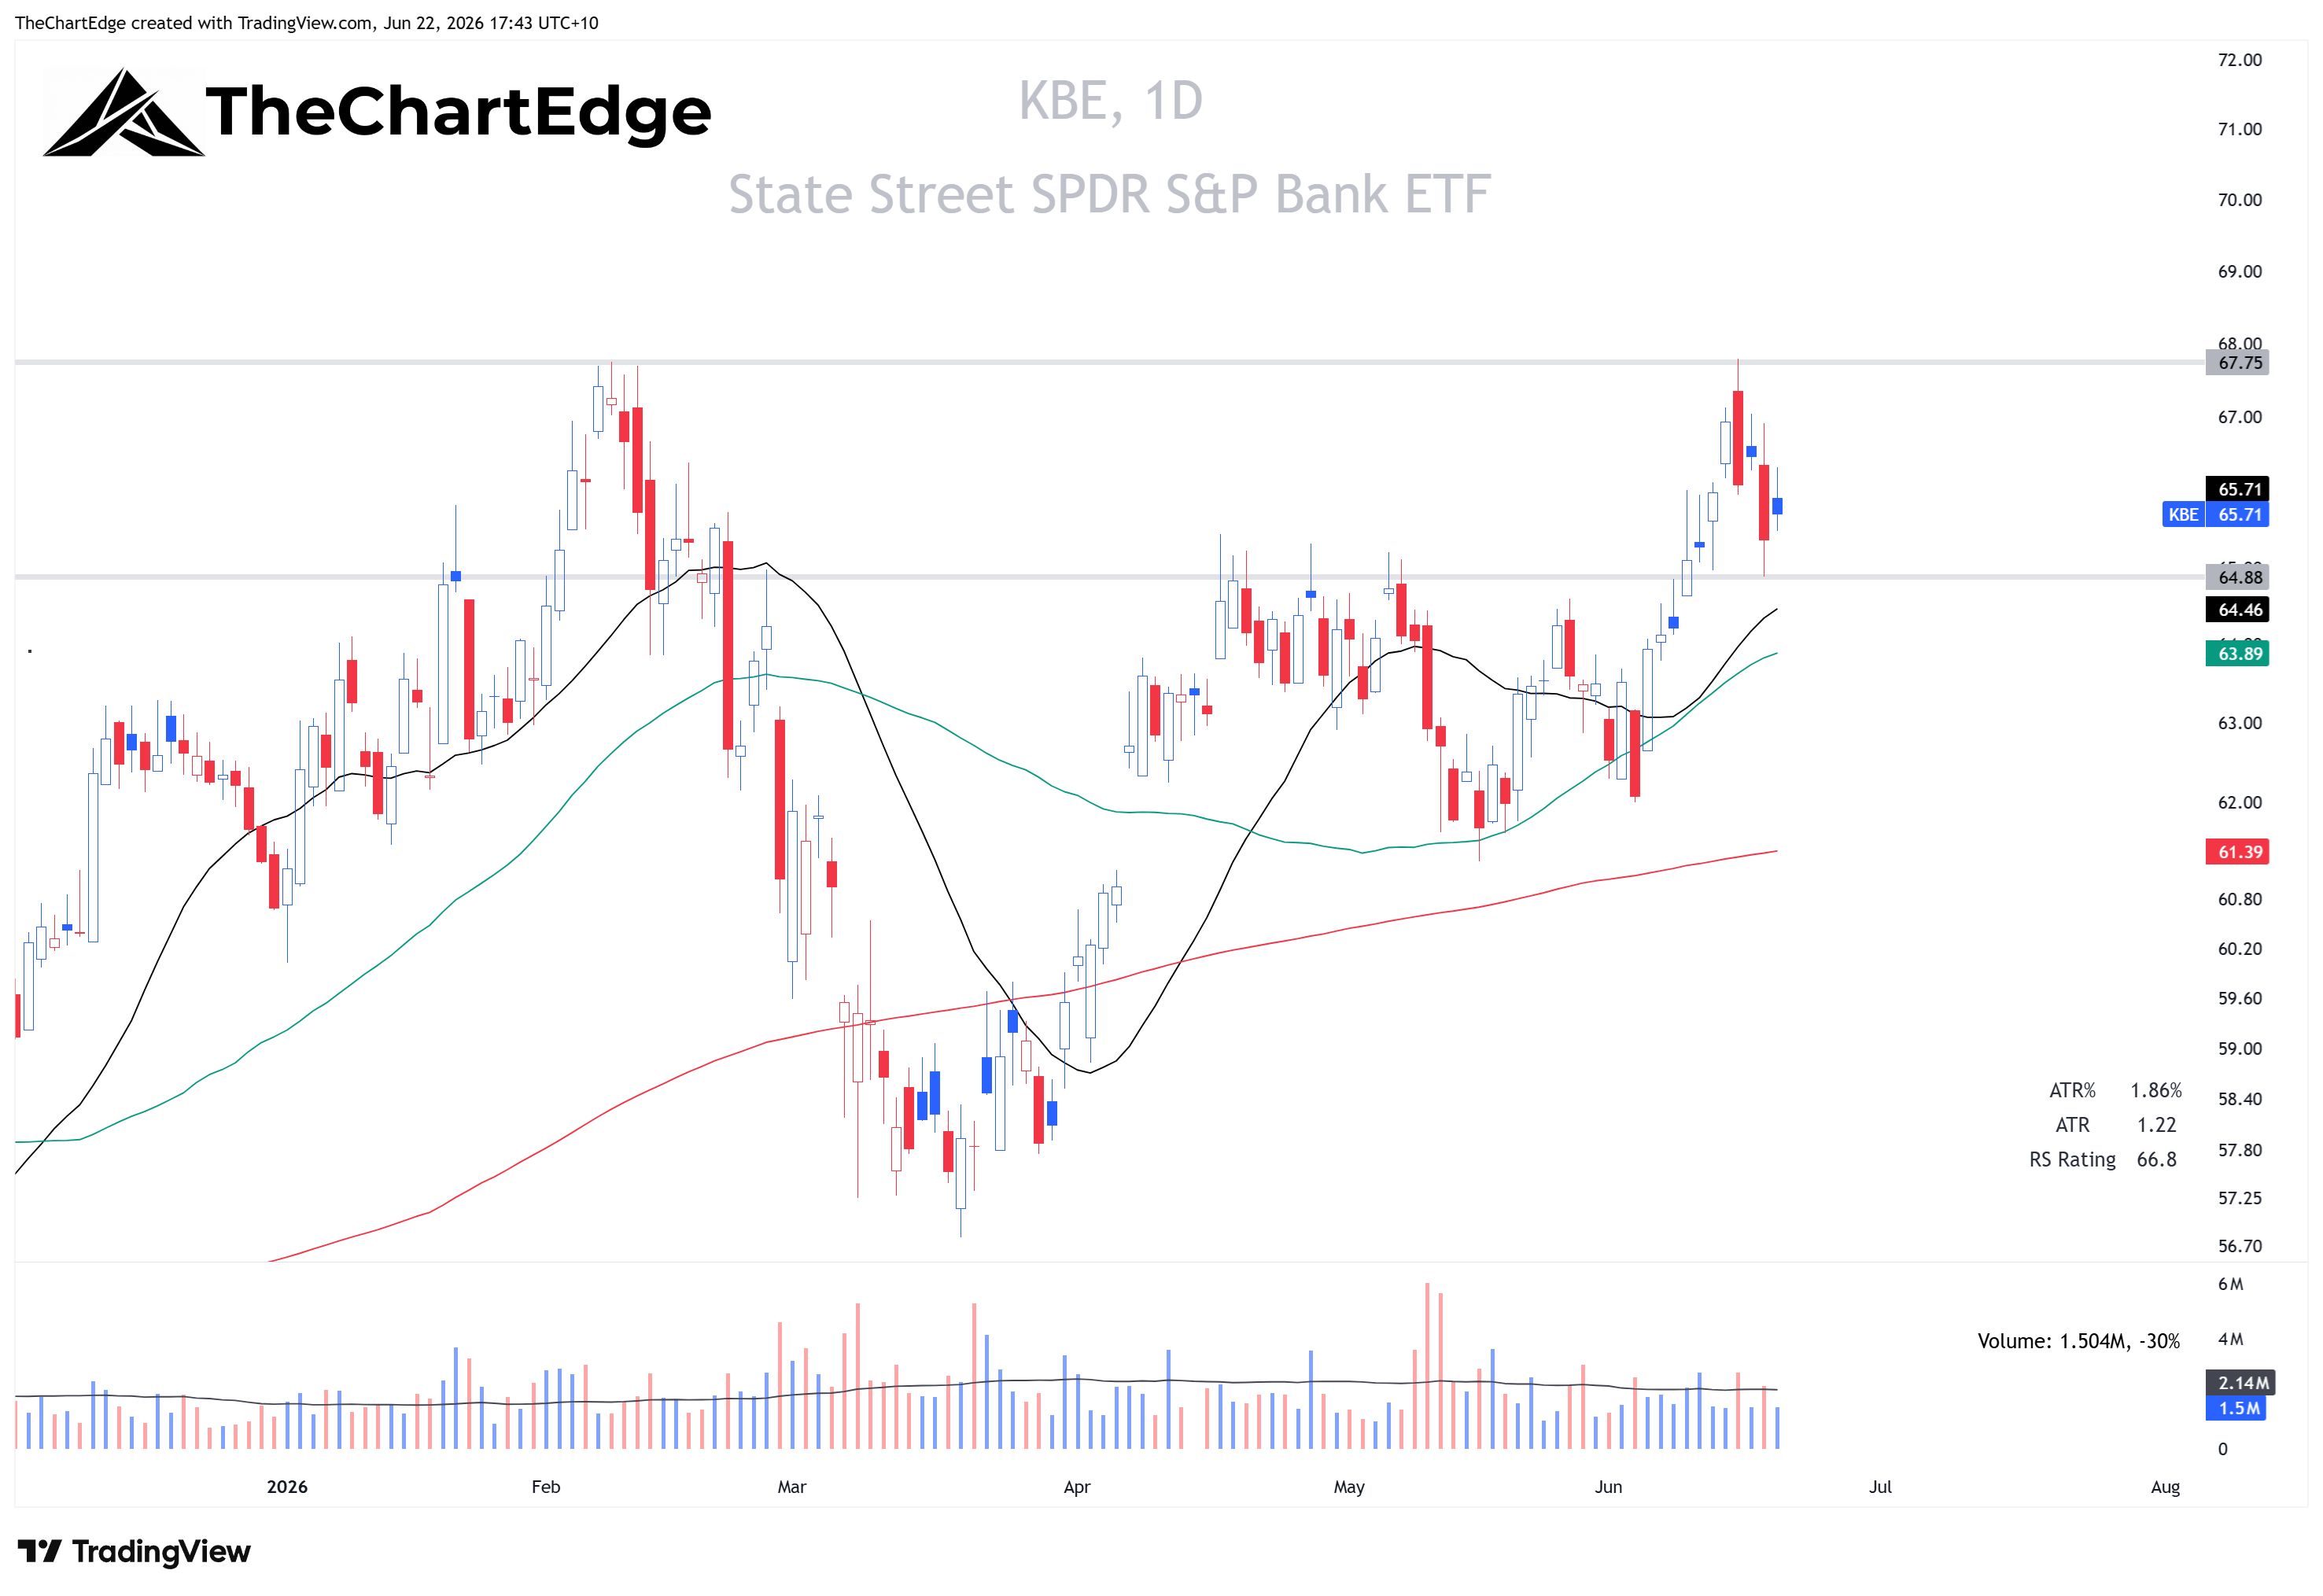
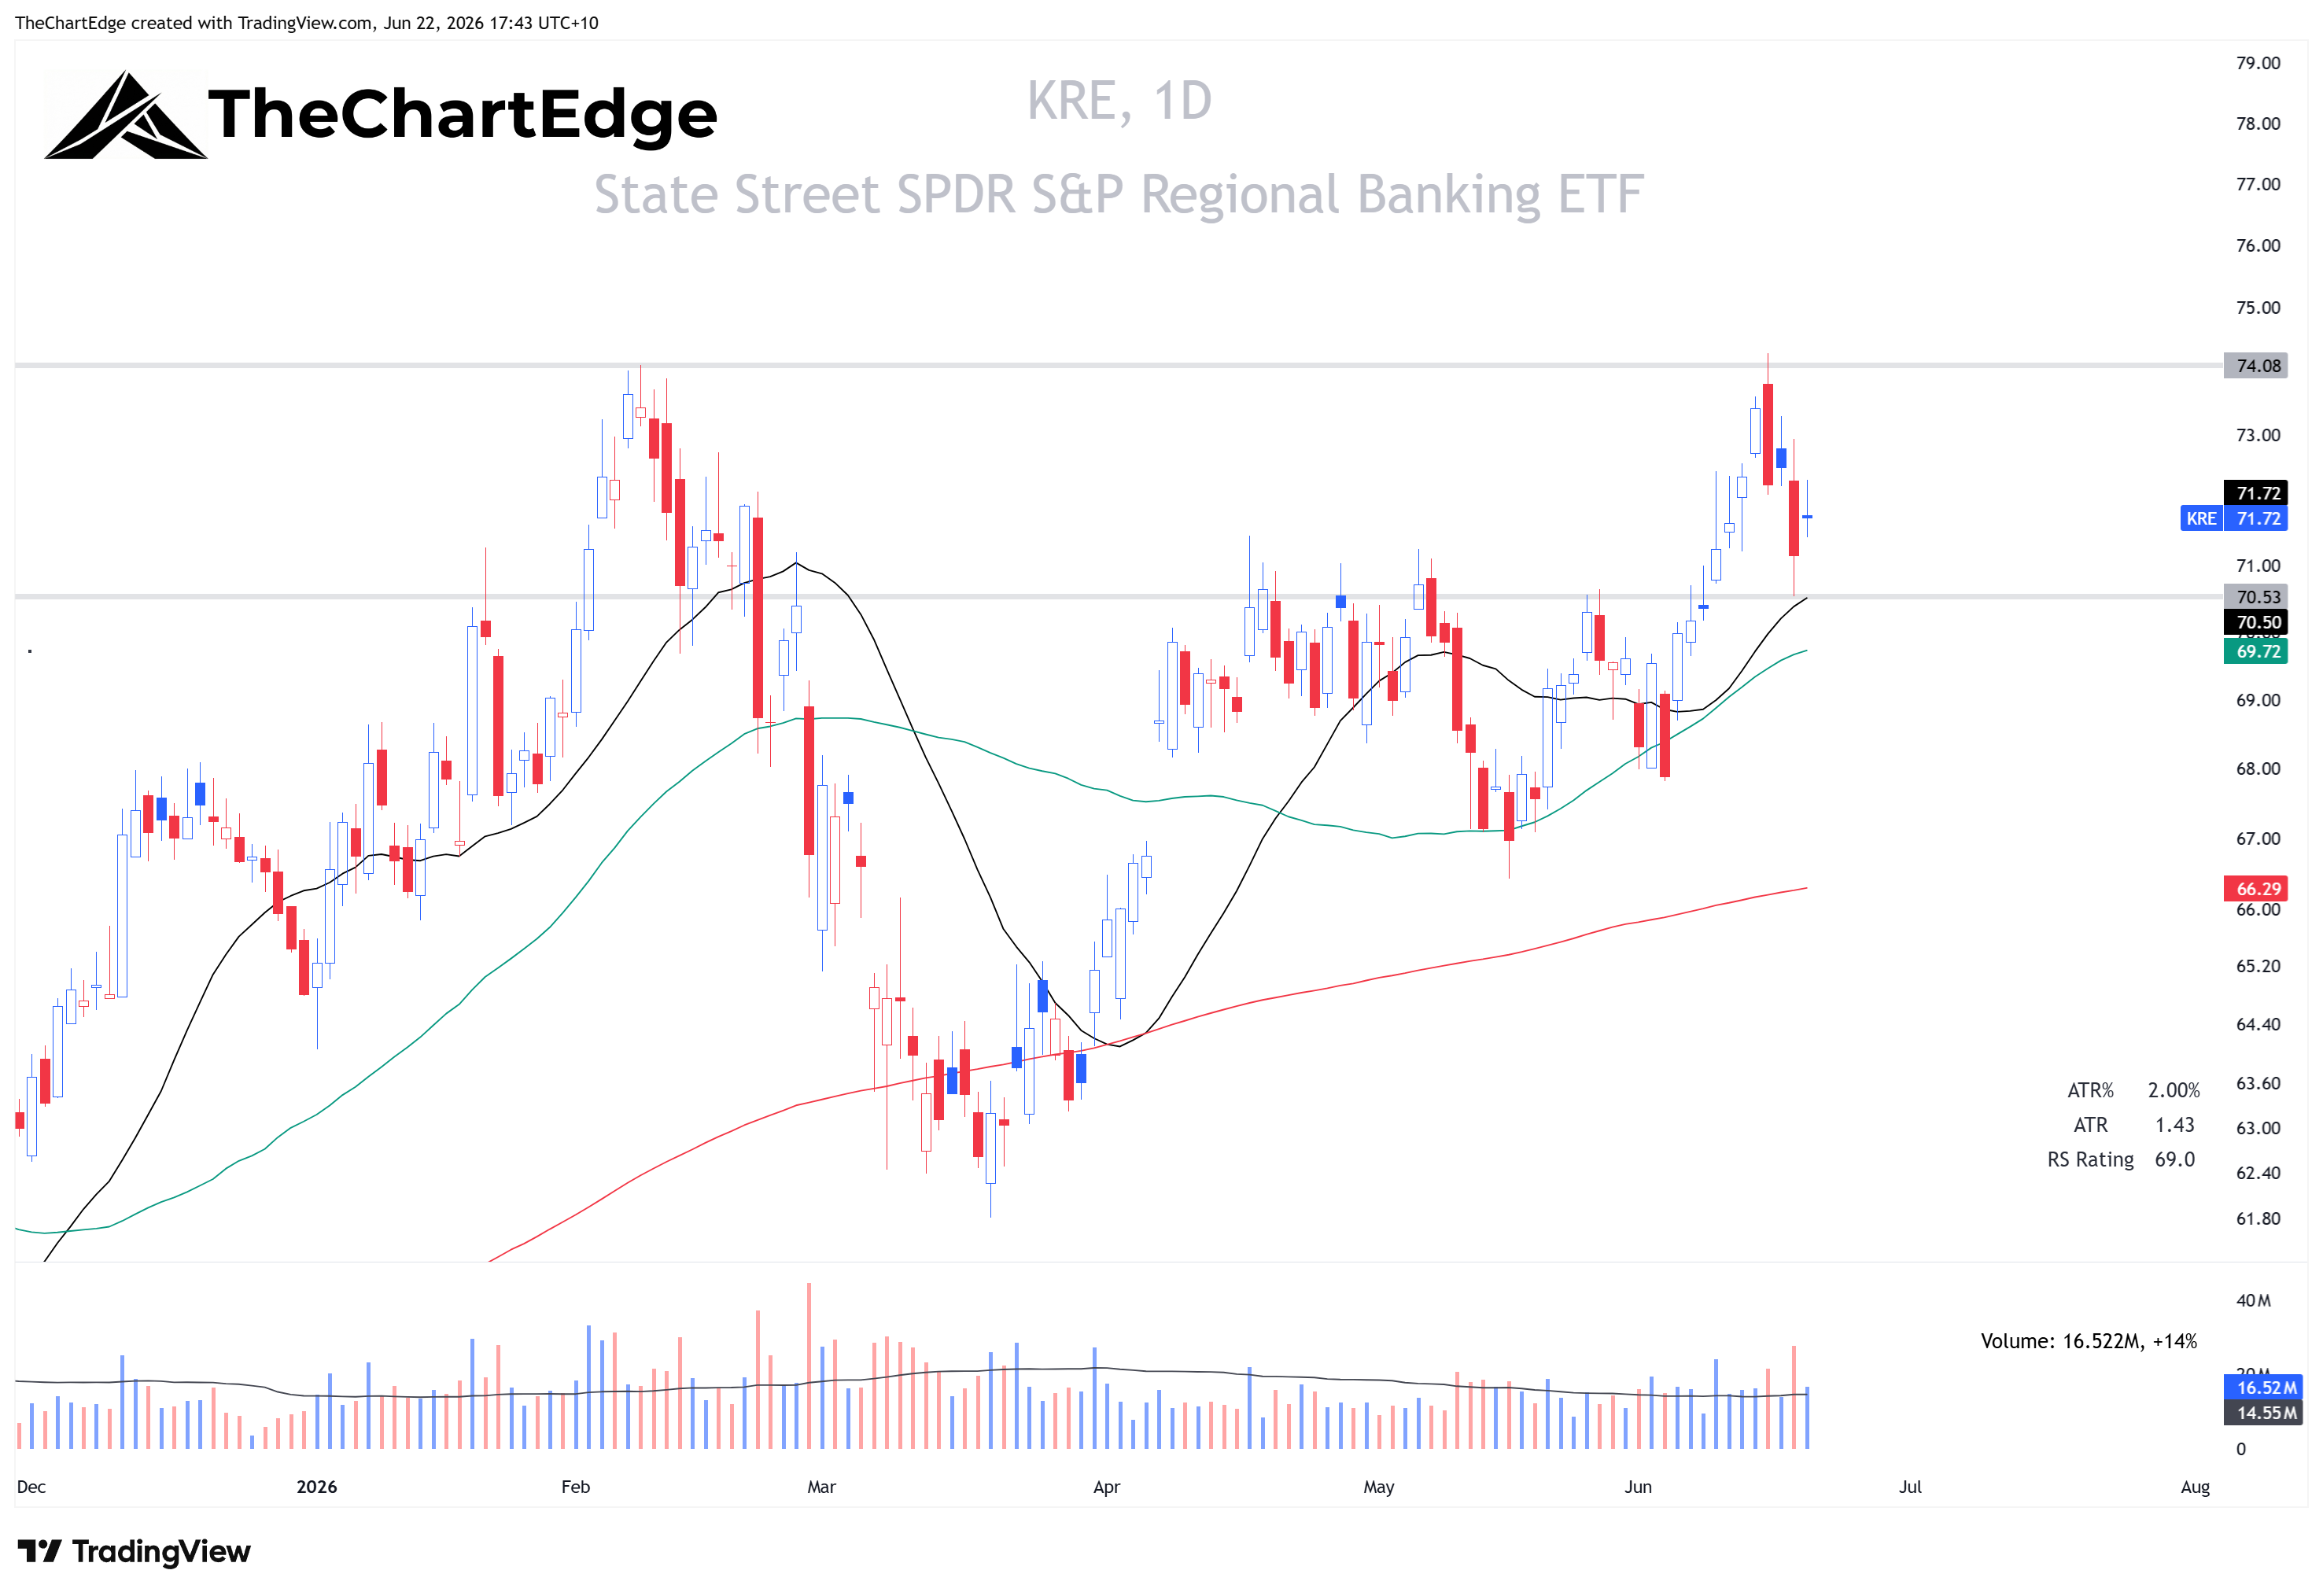
The banks stalled out right at their recent highs. I posted on X midweek about the bearish engulfing candles on the S&P Bank ETF (KBE) and the Regional Banking ETF (KRE).
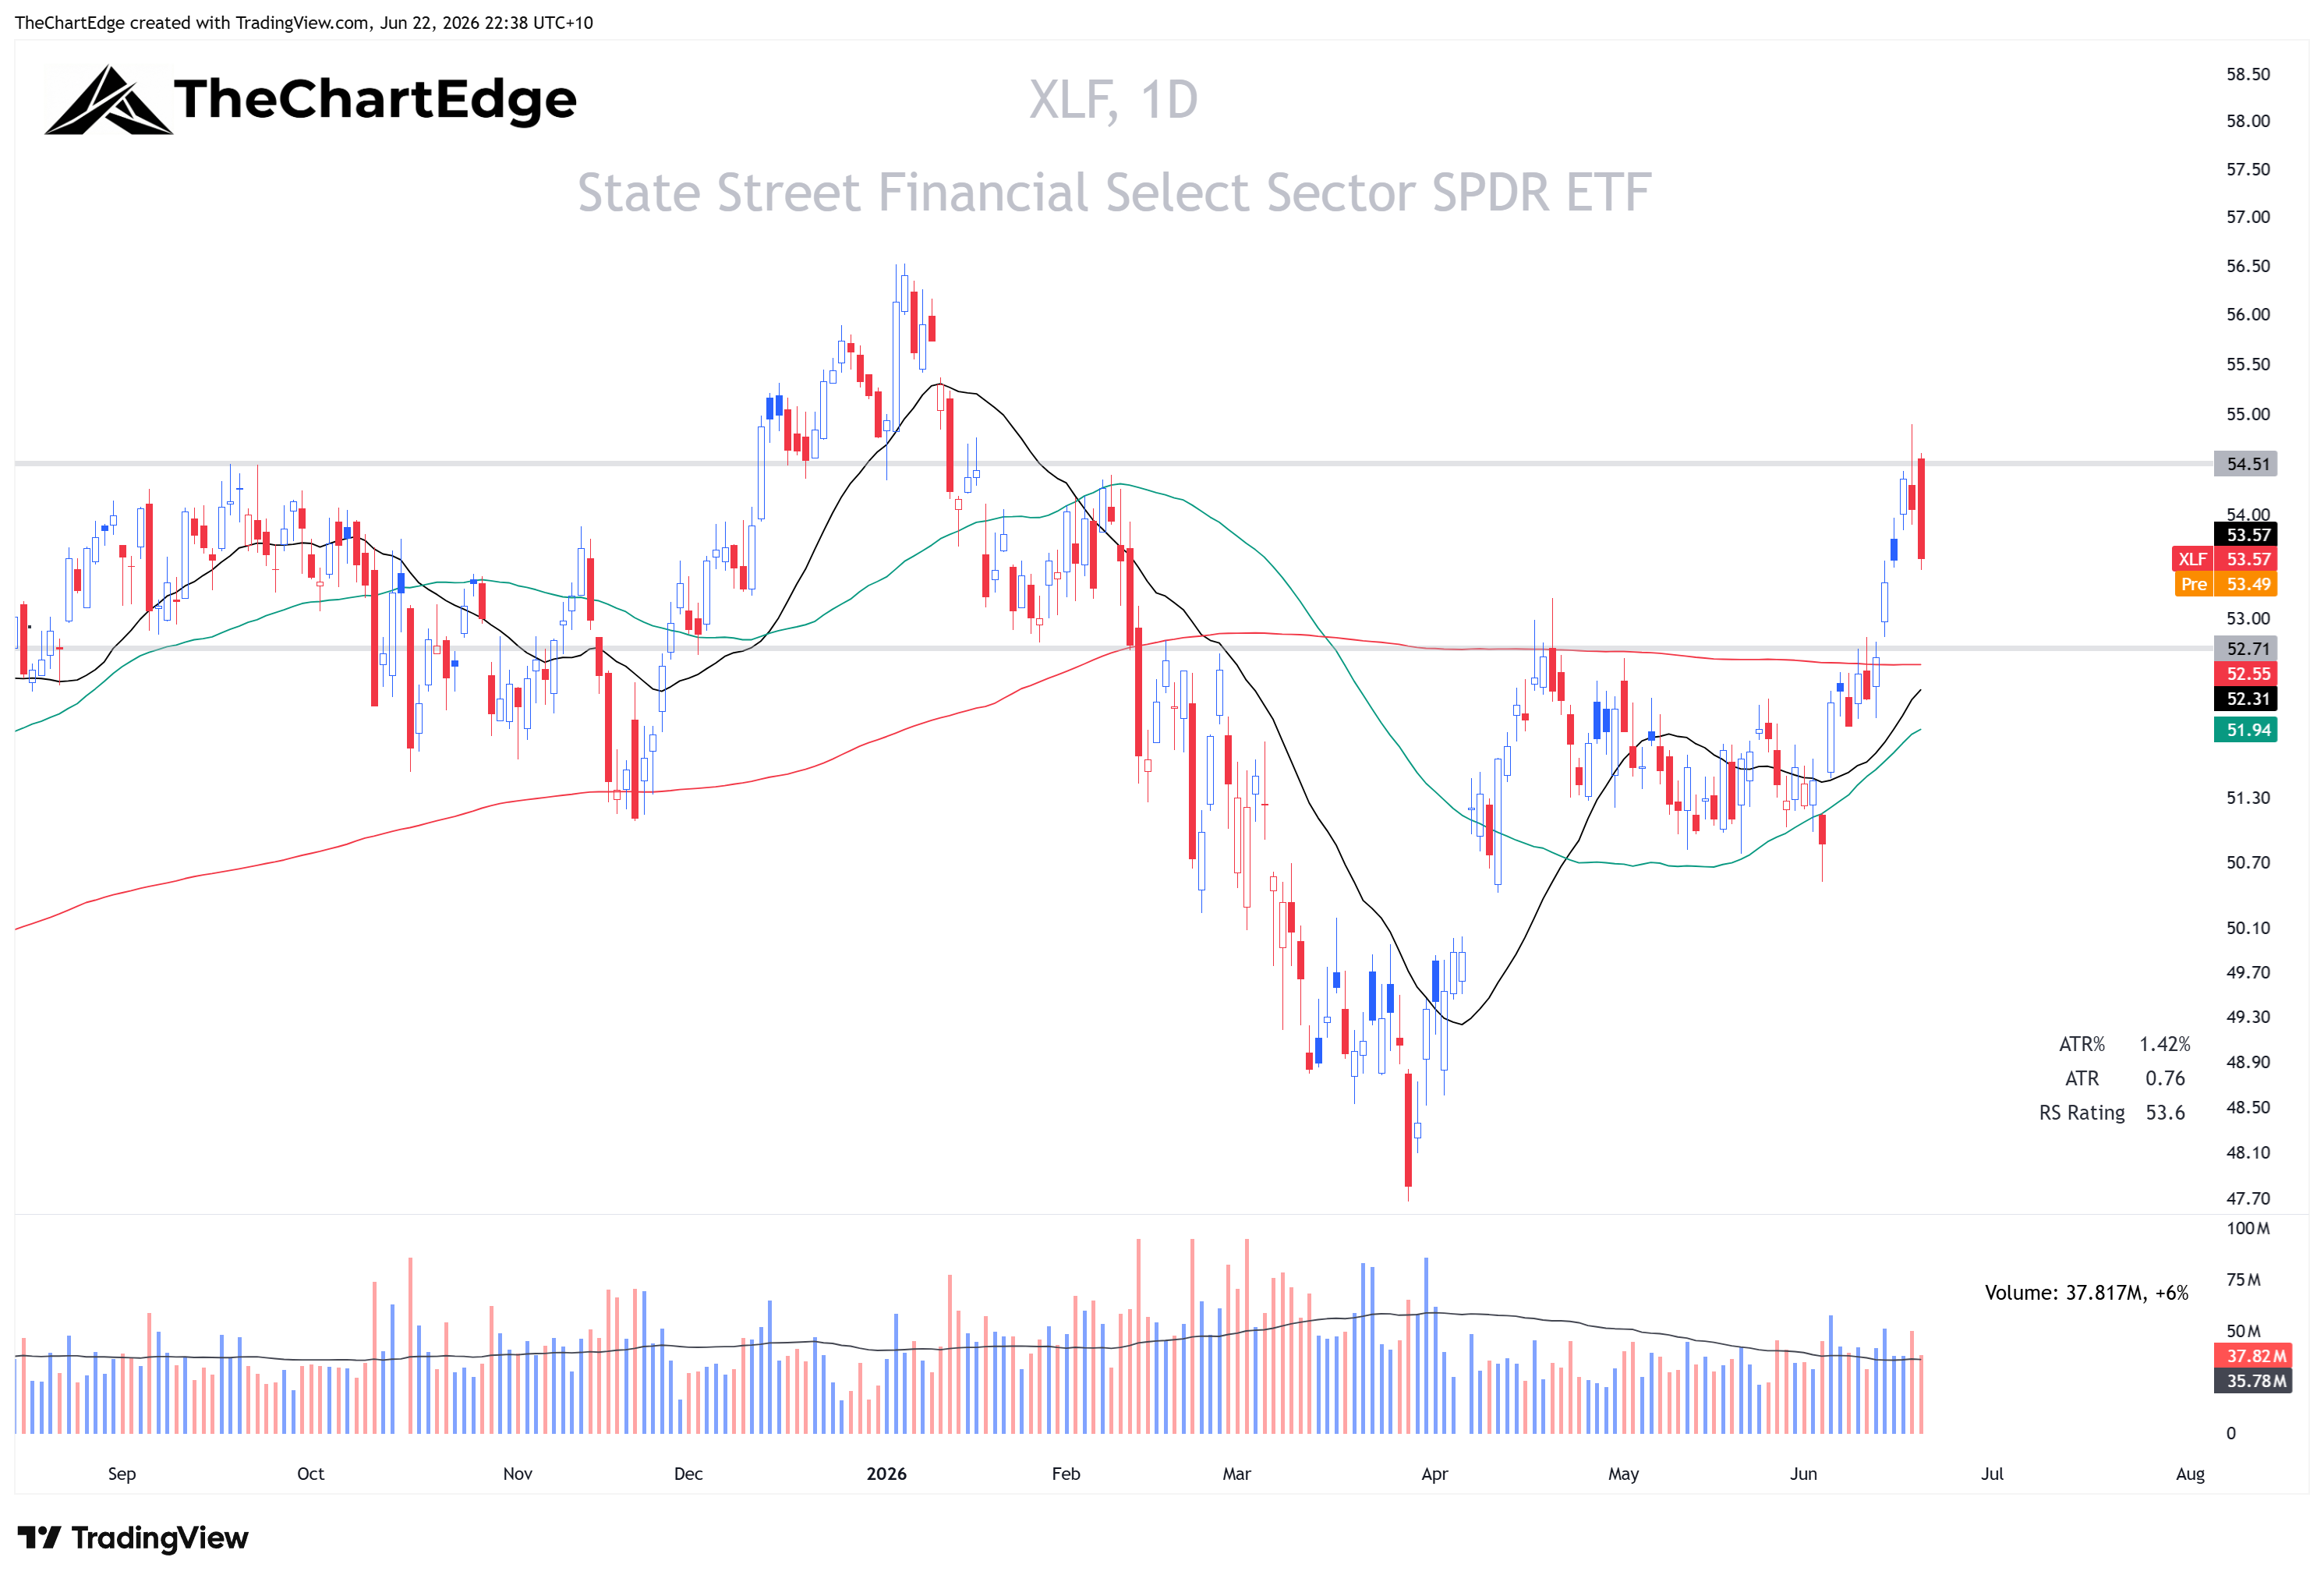
By Thursday’s close it had fed through to the relative strength. KBE slipped from Leading to Lagging and KRE from Leading to Weakening. Broad financials (XLF) held positive on the week but printed a bearish engulfing candle on Thursday.
KBE Chart
KRE Chart
XLF Chart
The Week Ahead
The Market Temperature is up slightly to 5.7 and the QQQ reclaimed and held its 20-day SMA, so I’ll be looking to add more exposure this week, primarily in tech and AI names and probably through ETFs and Nasdaq 100 CFDs, as most of the leading AI names have very high ATRs and the individual stock positions I’ve currently got on don’t have enough of a cushion yet for me to add new positions aggressively. I also like XBI here and bought the breakout on Wednesday.
I’ll update and post my This Week’s Trading Plan later tonight, if I have time, or tomorrow, Melbourne time.
Stay open-minded and manage risk carefully.
Cheers,
Marcus Grant, CFTe
Disclaimer: The content provided in this newsletter is for informational and educational purposes only and should not be considered as financial, investment, or legal advice. The information shared is based on our research and analysis, but we are not a licensed financial advisor, nor can we guarantee its accuracy, completeness, or timeliness. Market conditions and financial instruments can change rapidly, and any opinions expressed may not be suitable for all investors. Any opinions expressed and or securities mentioned do not constitute a recommendation to buy, sell, or hold that or any other security. You should conduct your own due diligence and consult with a licensed financial advisor or other professional before making any investment decisions. Past performance is not indicative of future results, and all investments carry the risk of loss. The authors and publishers of this newsletter are not responsible for any financial decisions made based on the content provided herein. By reading and or subscribing to this newsletter, you acknowledge and agree that you are using the information at your own risk.