

Market Temperature Ticks Up to 5.3 - A Broad Bounce, But Mixed Signals
Strength broadened out across AI, semis, small caps and cyclicals - while mega-cap growth and software lagged

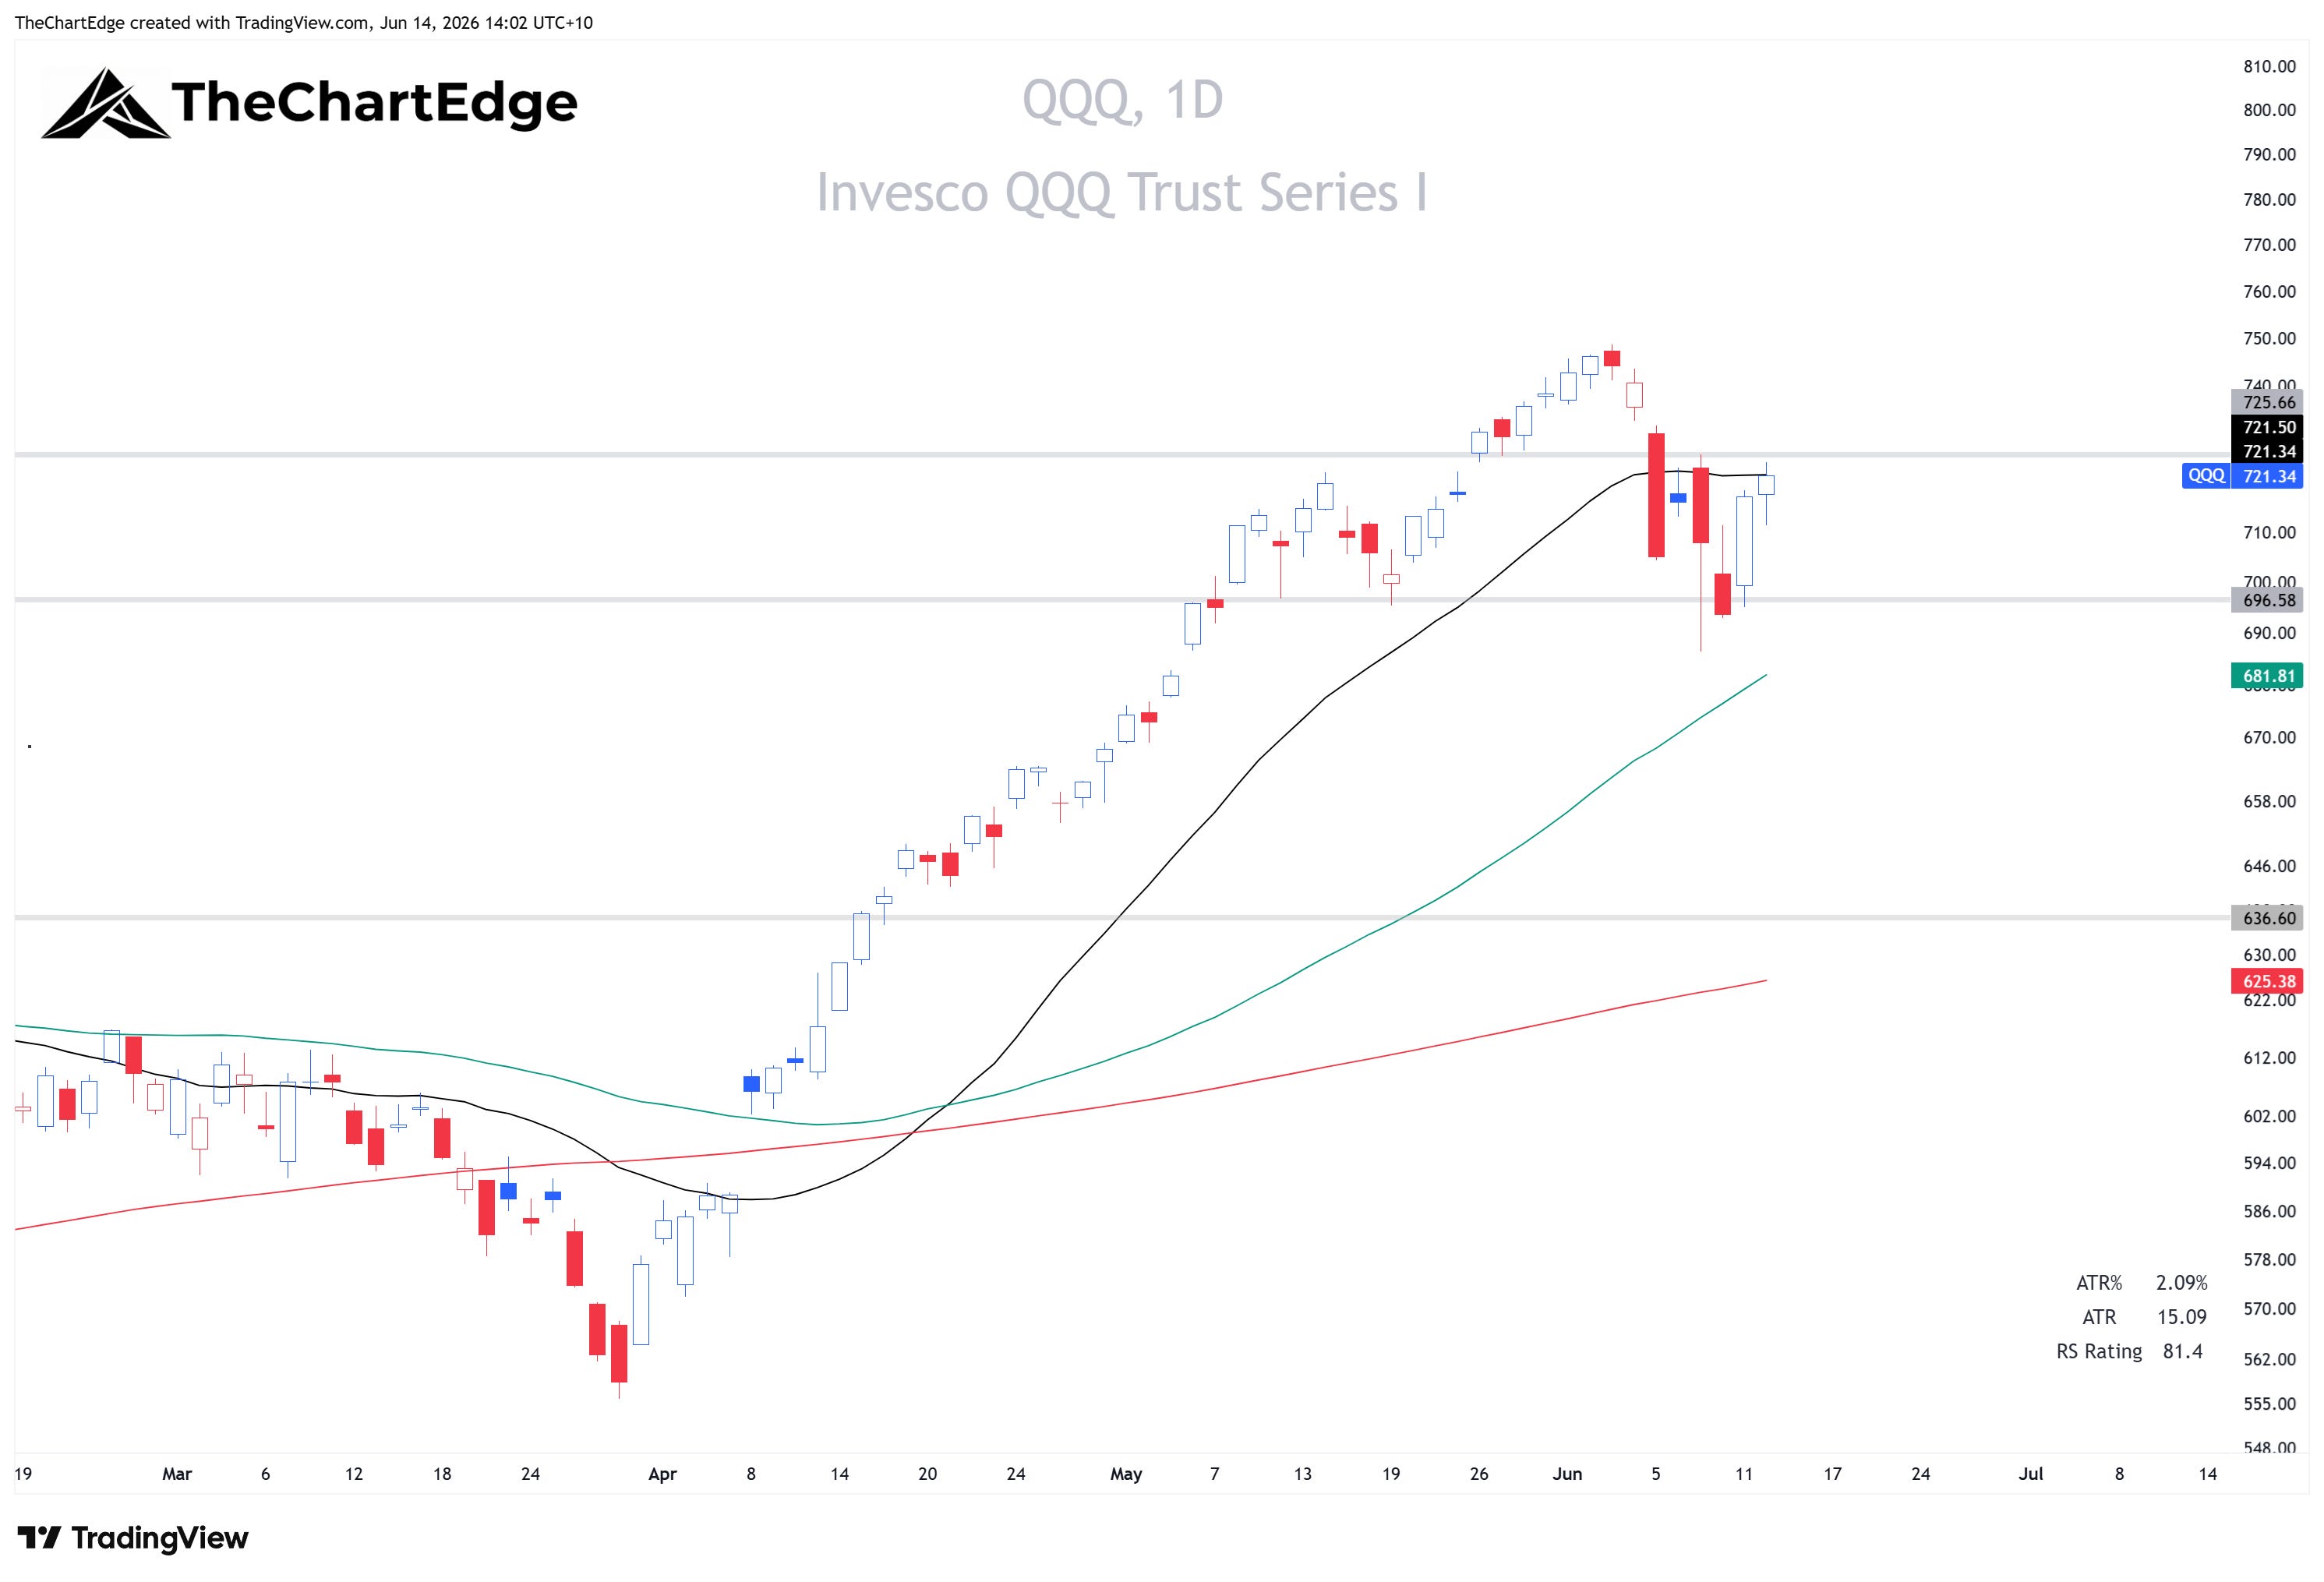
Last week the Nasdaq 100 (QQQ) rose 2.3% and the S&P 500 (SPY) 0.6% (week ending June 12). But FANG+ (FNGS) fell 1% and Russell 1000 Growth (IWF) 0.9%.
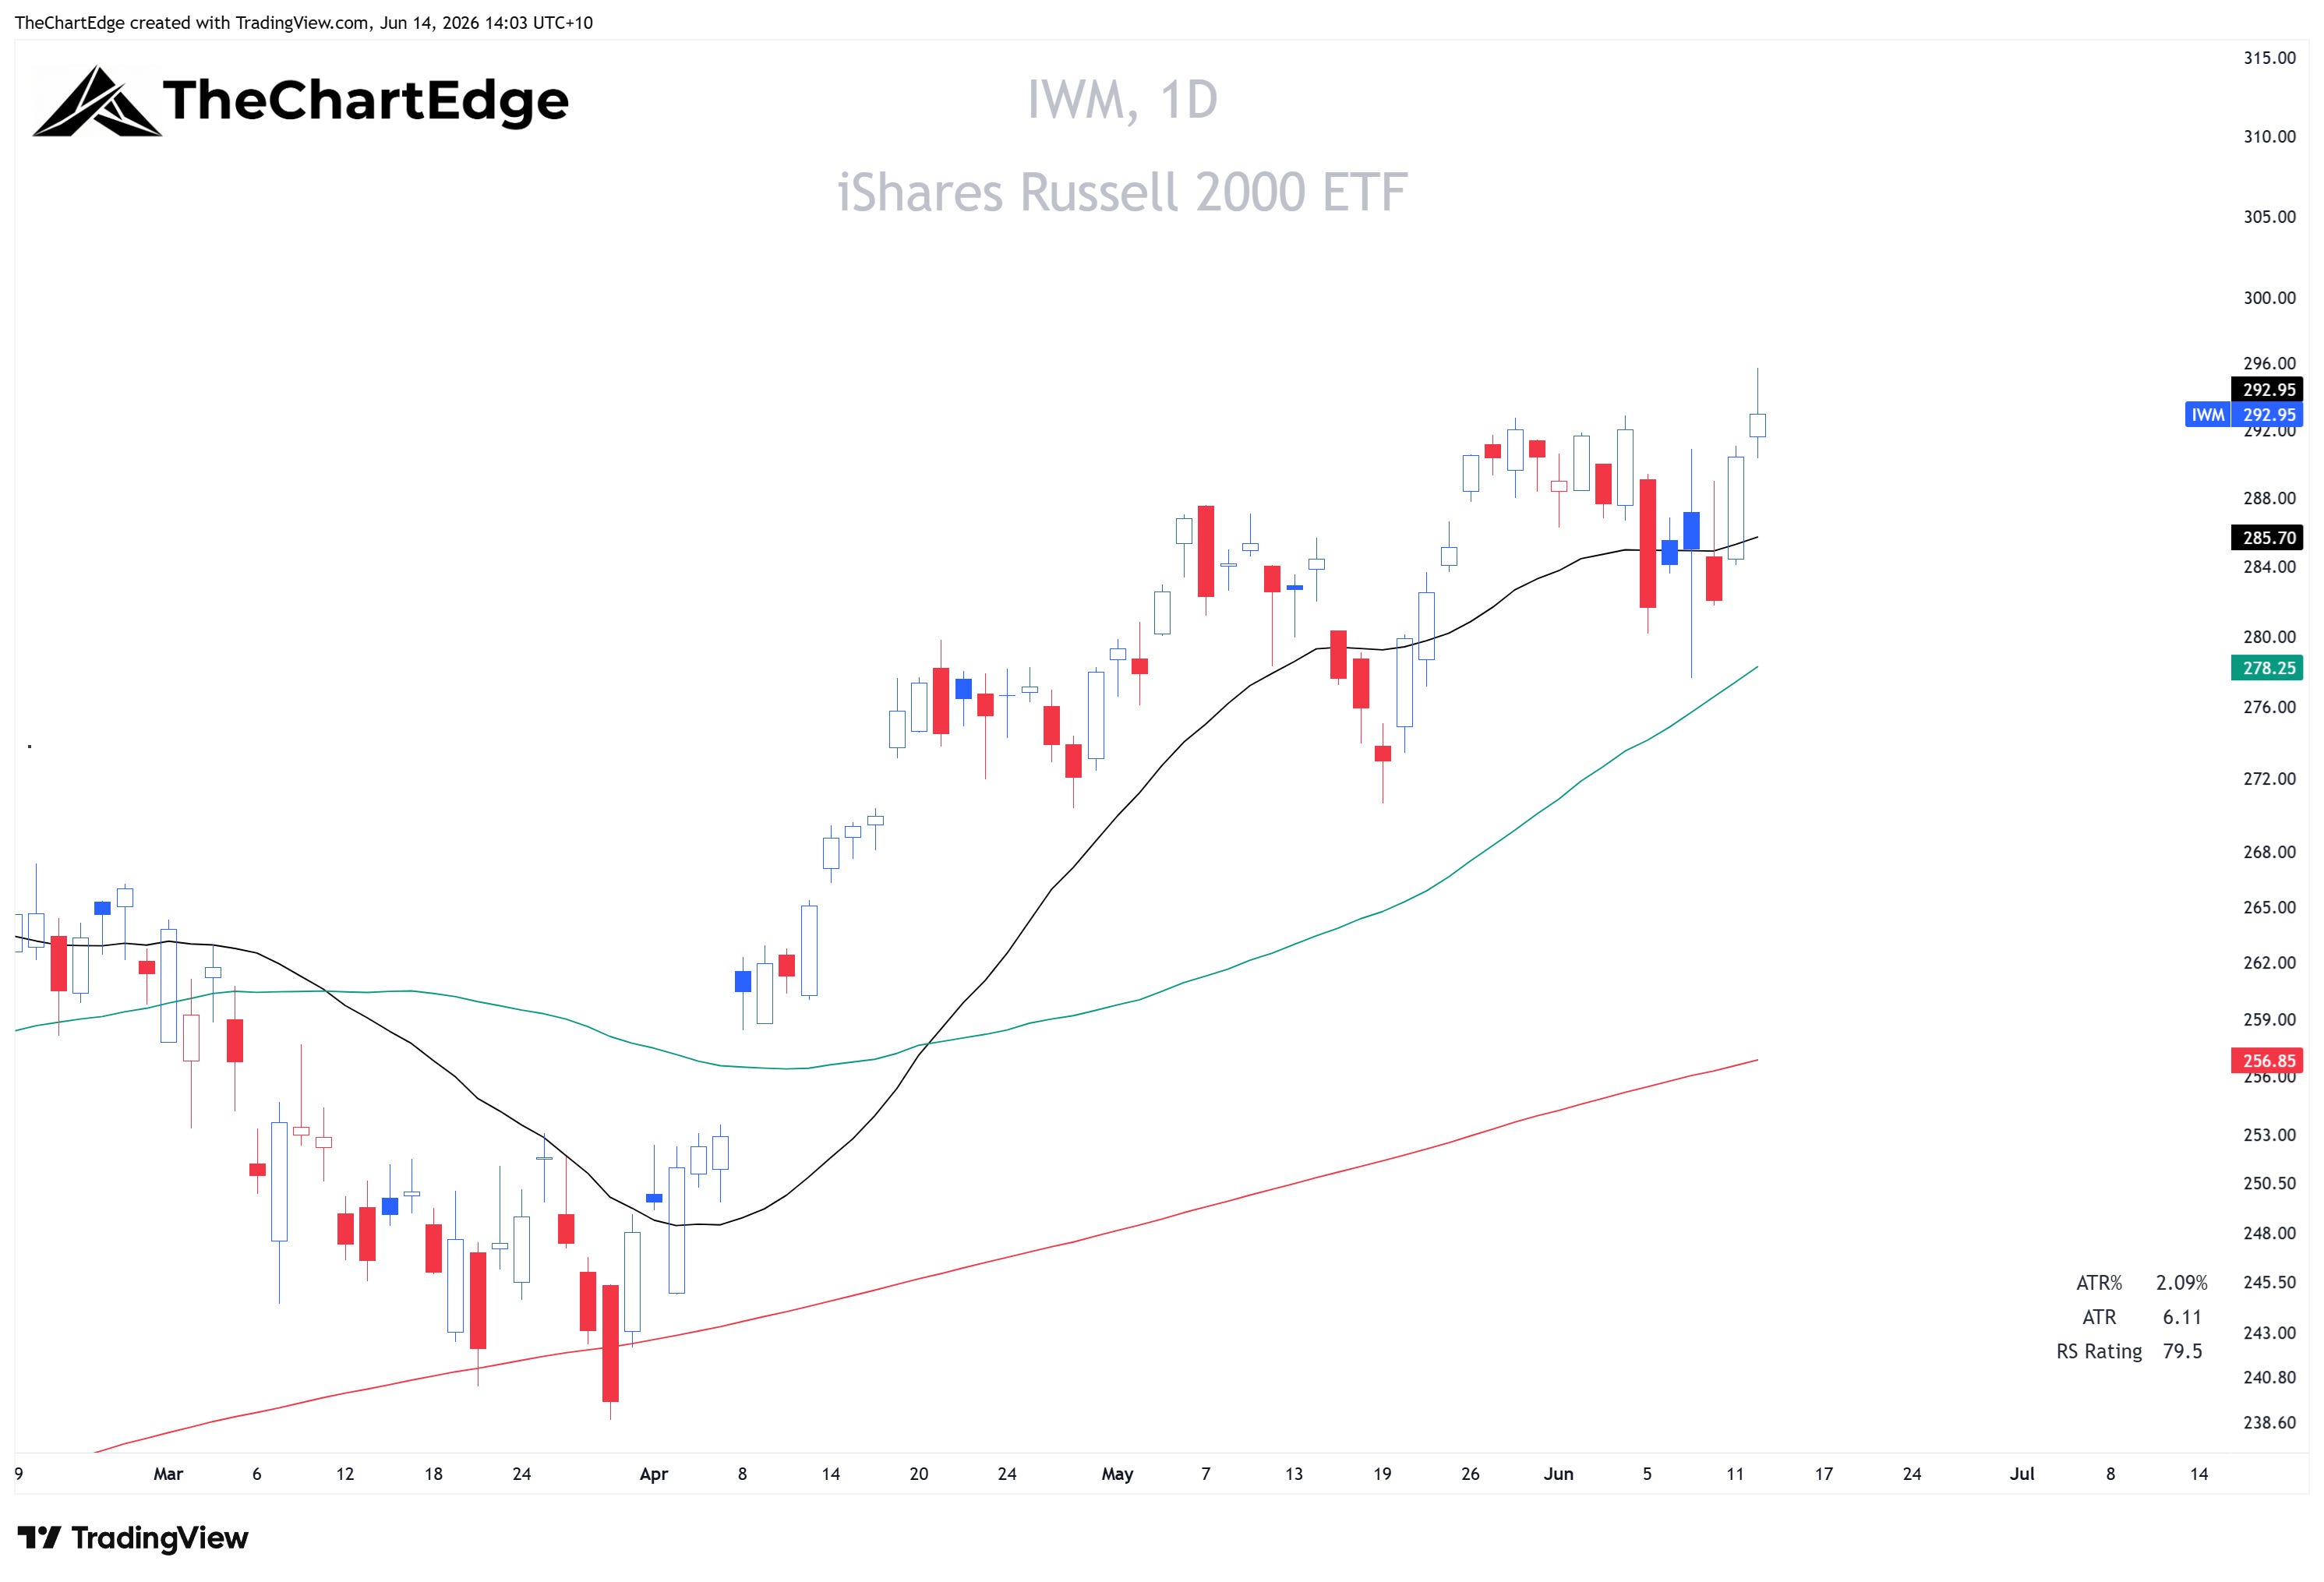
The small-cap Russell 2000 (IWM) rose 4%, microcaps (IWC) 4.4%, the S&P MidCap 400 (MDY) 2.8%, the equal weight S&P 500 (RSP) 1.8%, and Russell 1000 Value (IWD) 2.4%.
RSP, MDY and the small caps (IWM) closed at weekly all-time highs and are all in Strong Uptrends. SPY is still a touch below its 20-day SMA, the QQQ closed right on it. I want to see a daily close above their 20-day SMAs and the highs from Tuesday the 9th of June before assuming this pullback is over and getting more aggressive.
SPY Chart
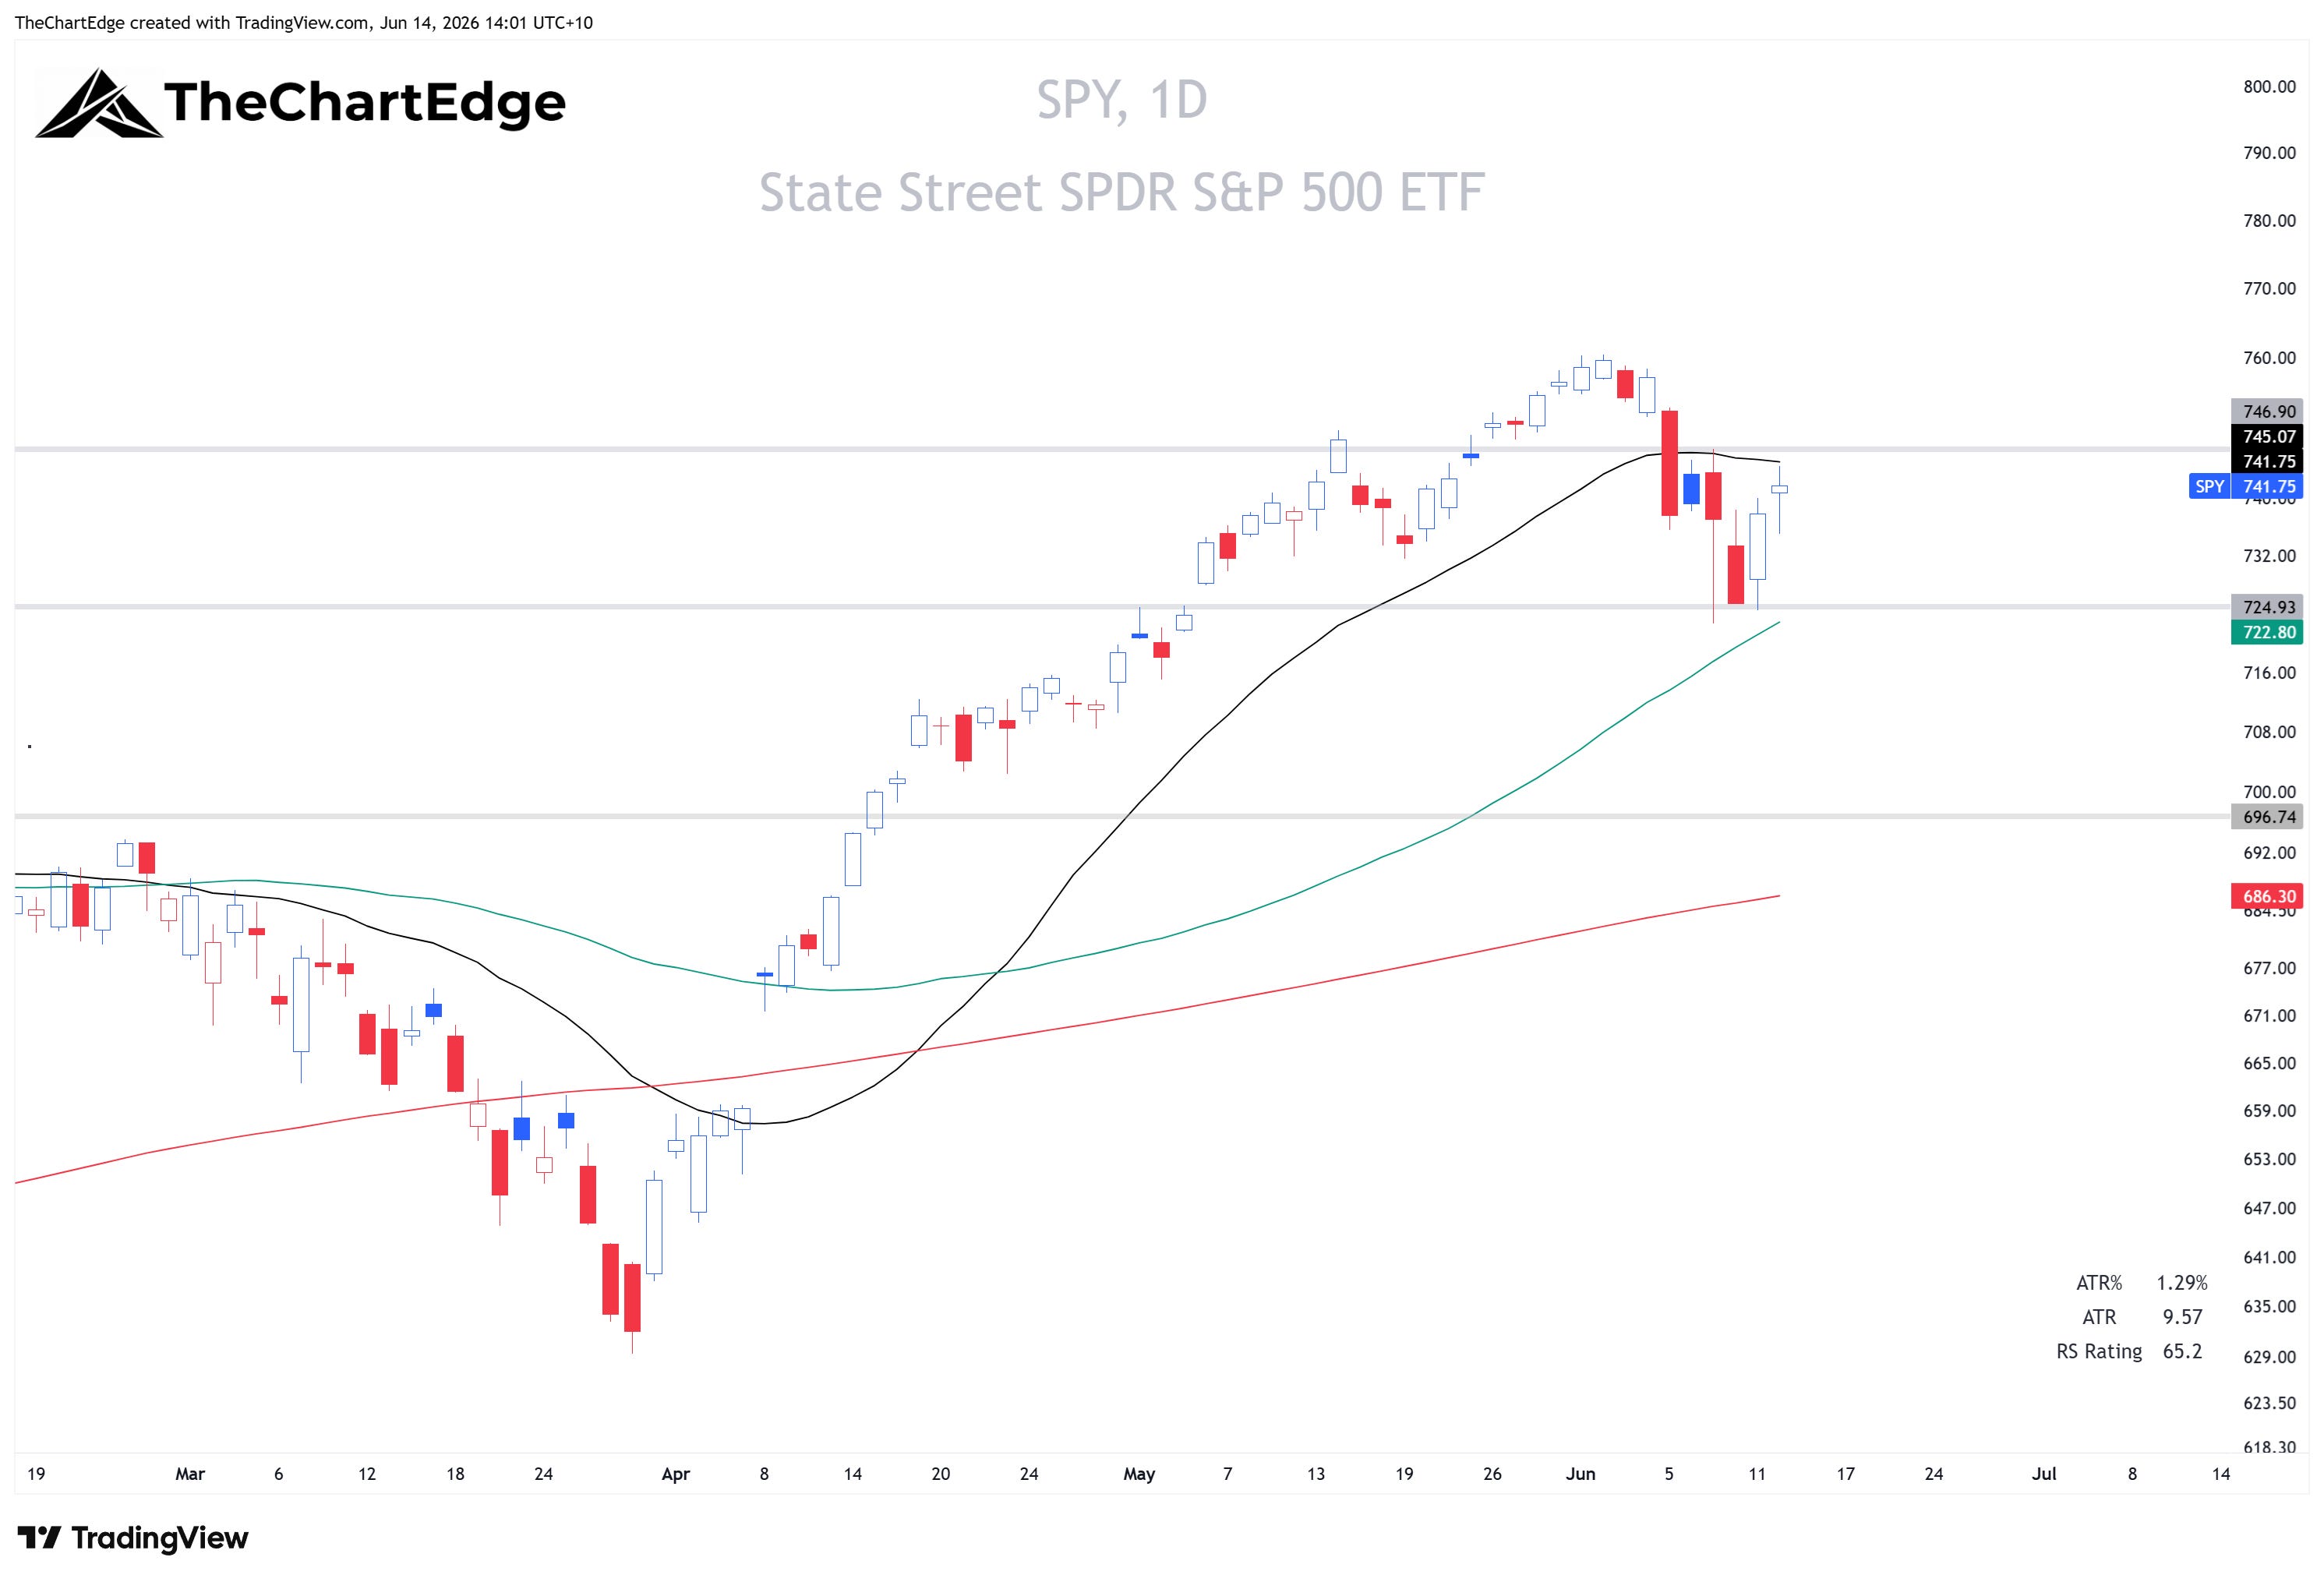
For all daily charts the black line is the 20-day SMA, the green is the 50-day SMA, and the red is the 200-day SMA.
QQQ Chart
IWM Chart
Market Temperature Ticks Up to 5.3
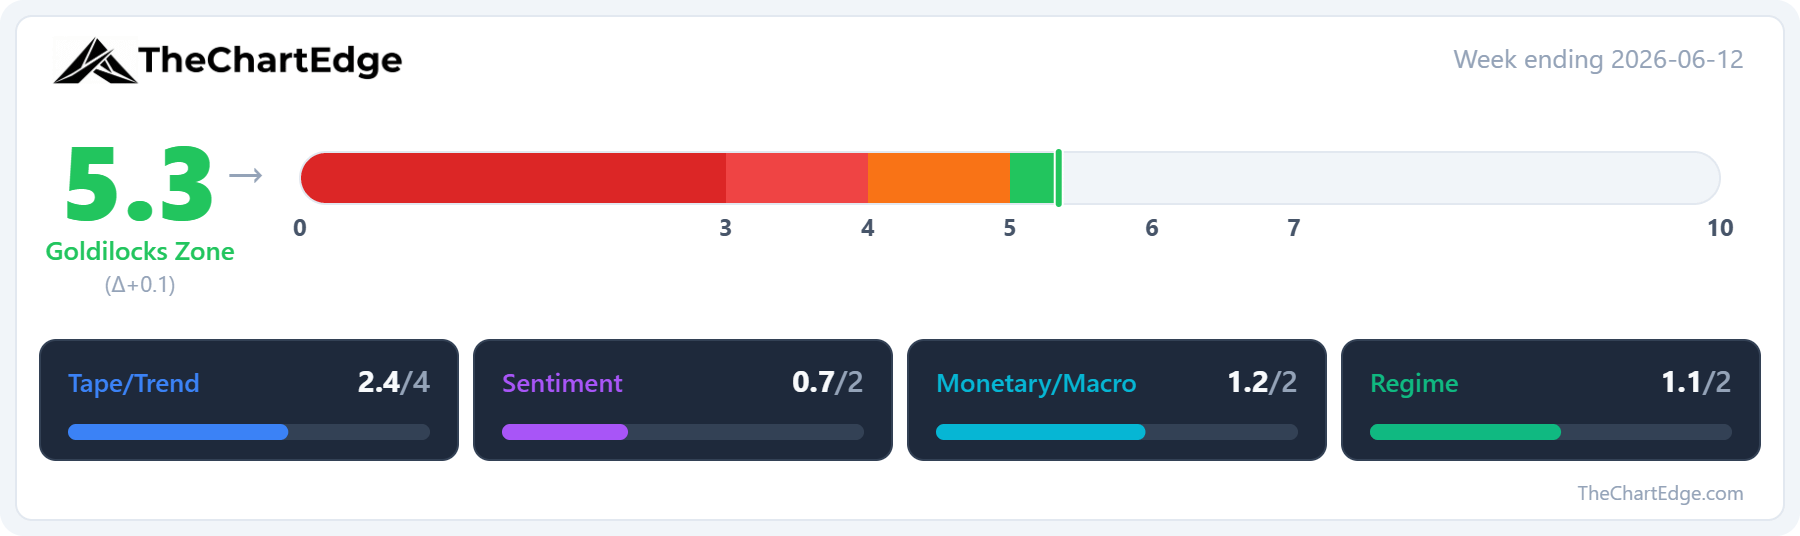
The Market Temperature came in at 5.3, a tick up from 5.2, and stayed in the Goldilocks Zone.
On the surface not much changed, but underneath, two pillars moved in opposite directions.
Sentiment was the biggest faller. The VIX dropped from 21.51 to 17.68. The model reads a falling VIX as a contrarian negative signal.
Monetary was the biggest gainer and offset the Sentiment drop exactly. Bond volatility (the MOVE index) came in from 75.20 to 69.36, and the US Dollar Index eased back below 100 to 99.80.
The Tape pillar firmed up a little. Breadth recovered on the week - the percentage of US stocks above their 50-day moving average rose from 49.55 to 56.58, and the percentage above their 200-day from 52.48 to 55.38. The SPY and QQQ trend states held at Uptrend and the SPY weekly RSI edged up from 64.04 to 65.06.
Regime barely moved. High beta (SPHB) outperformed low volatility (SPLV). Growth (IWF) underperformed value (IWD) again - discretionary (XLY) also underperformed versus staples (XLP).
GICS Sector Relative Strength
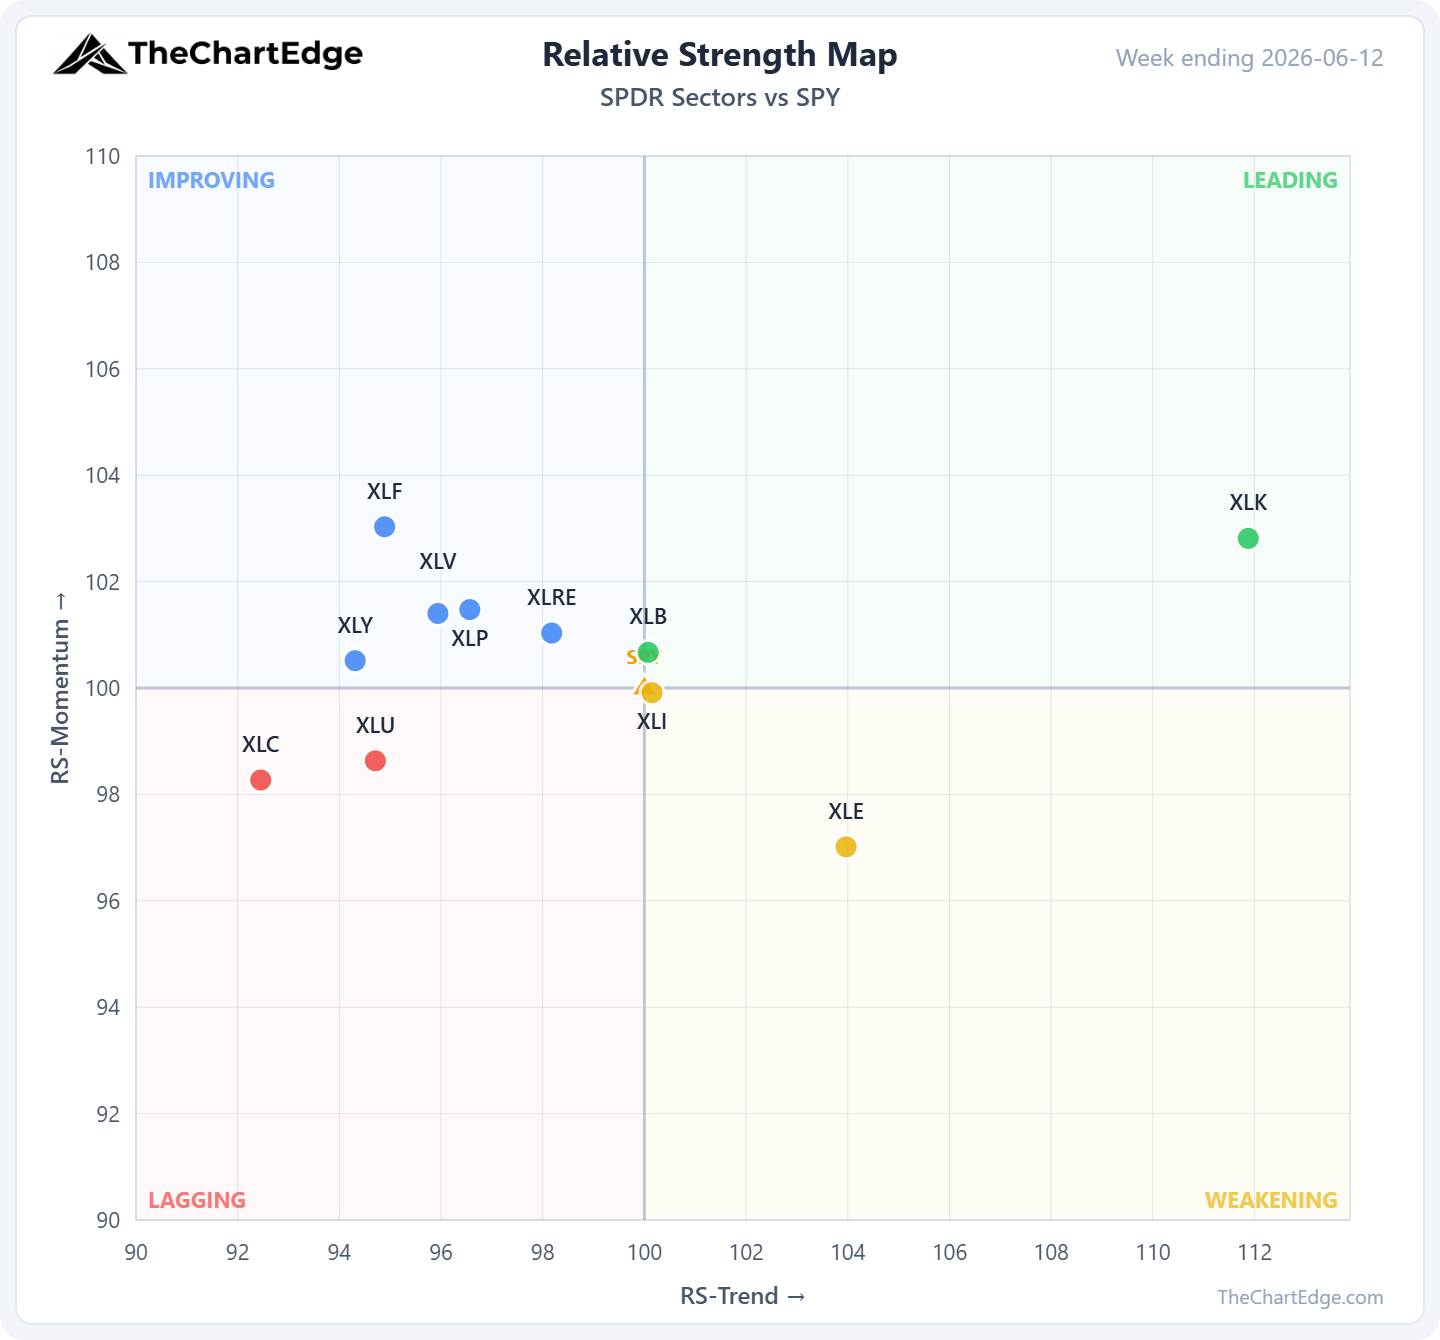
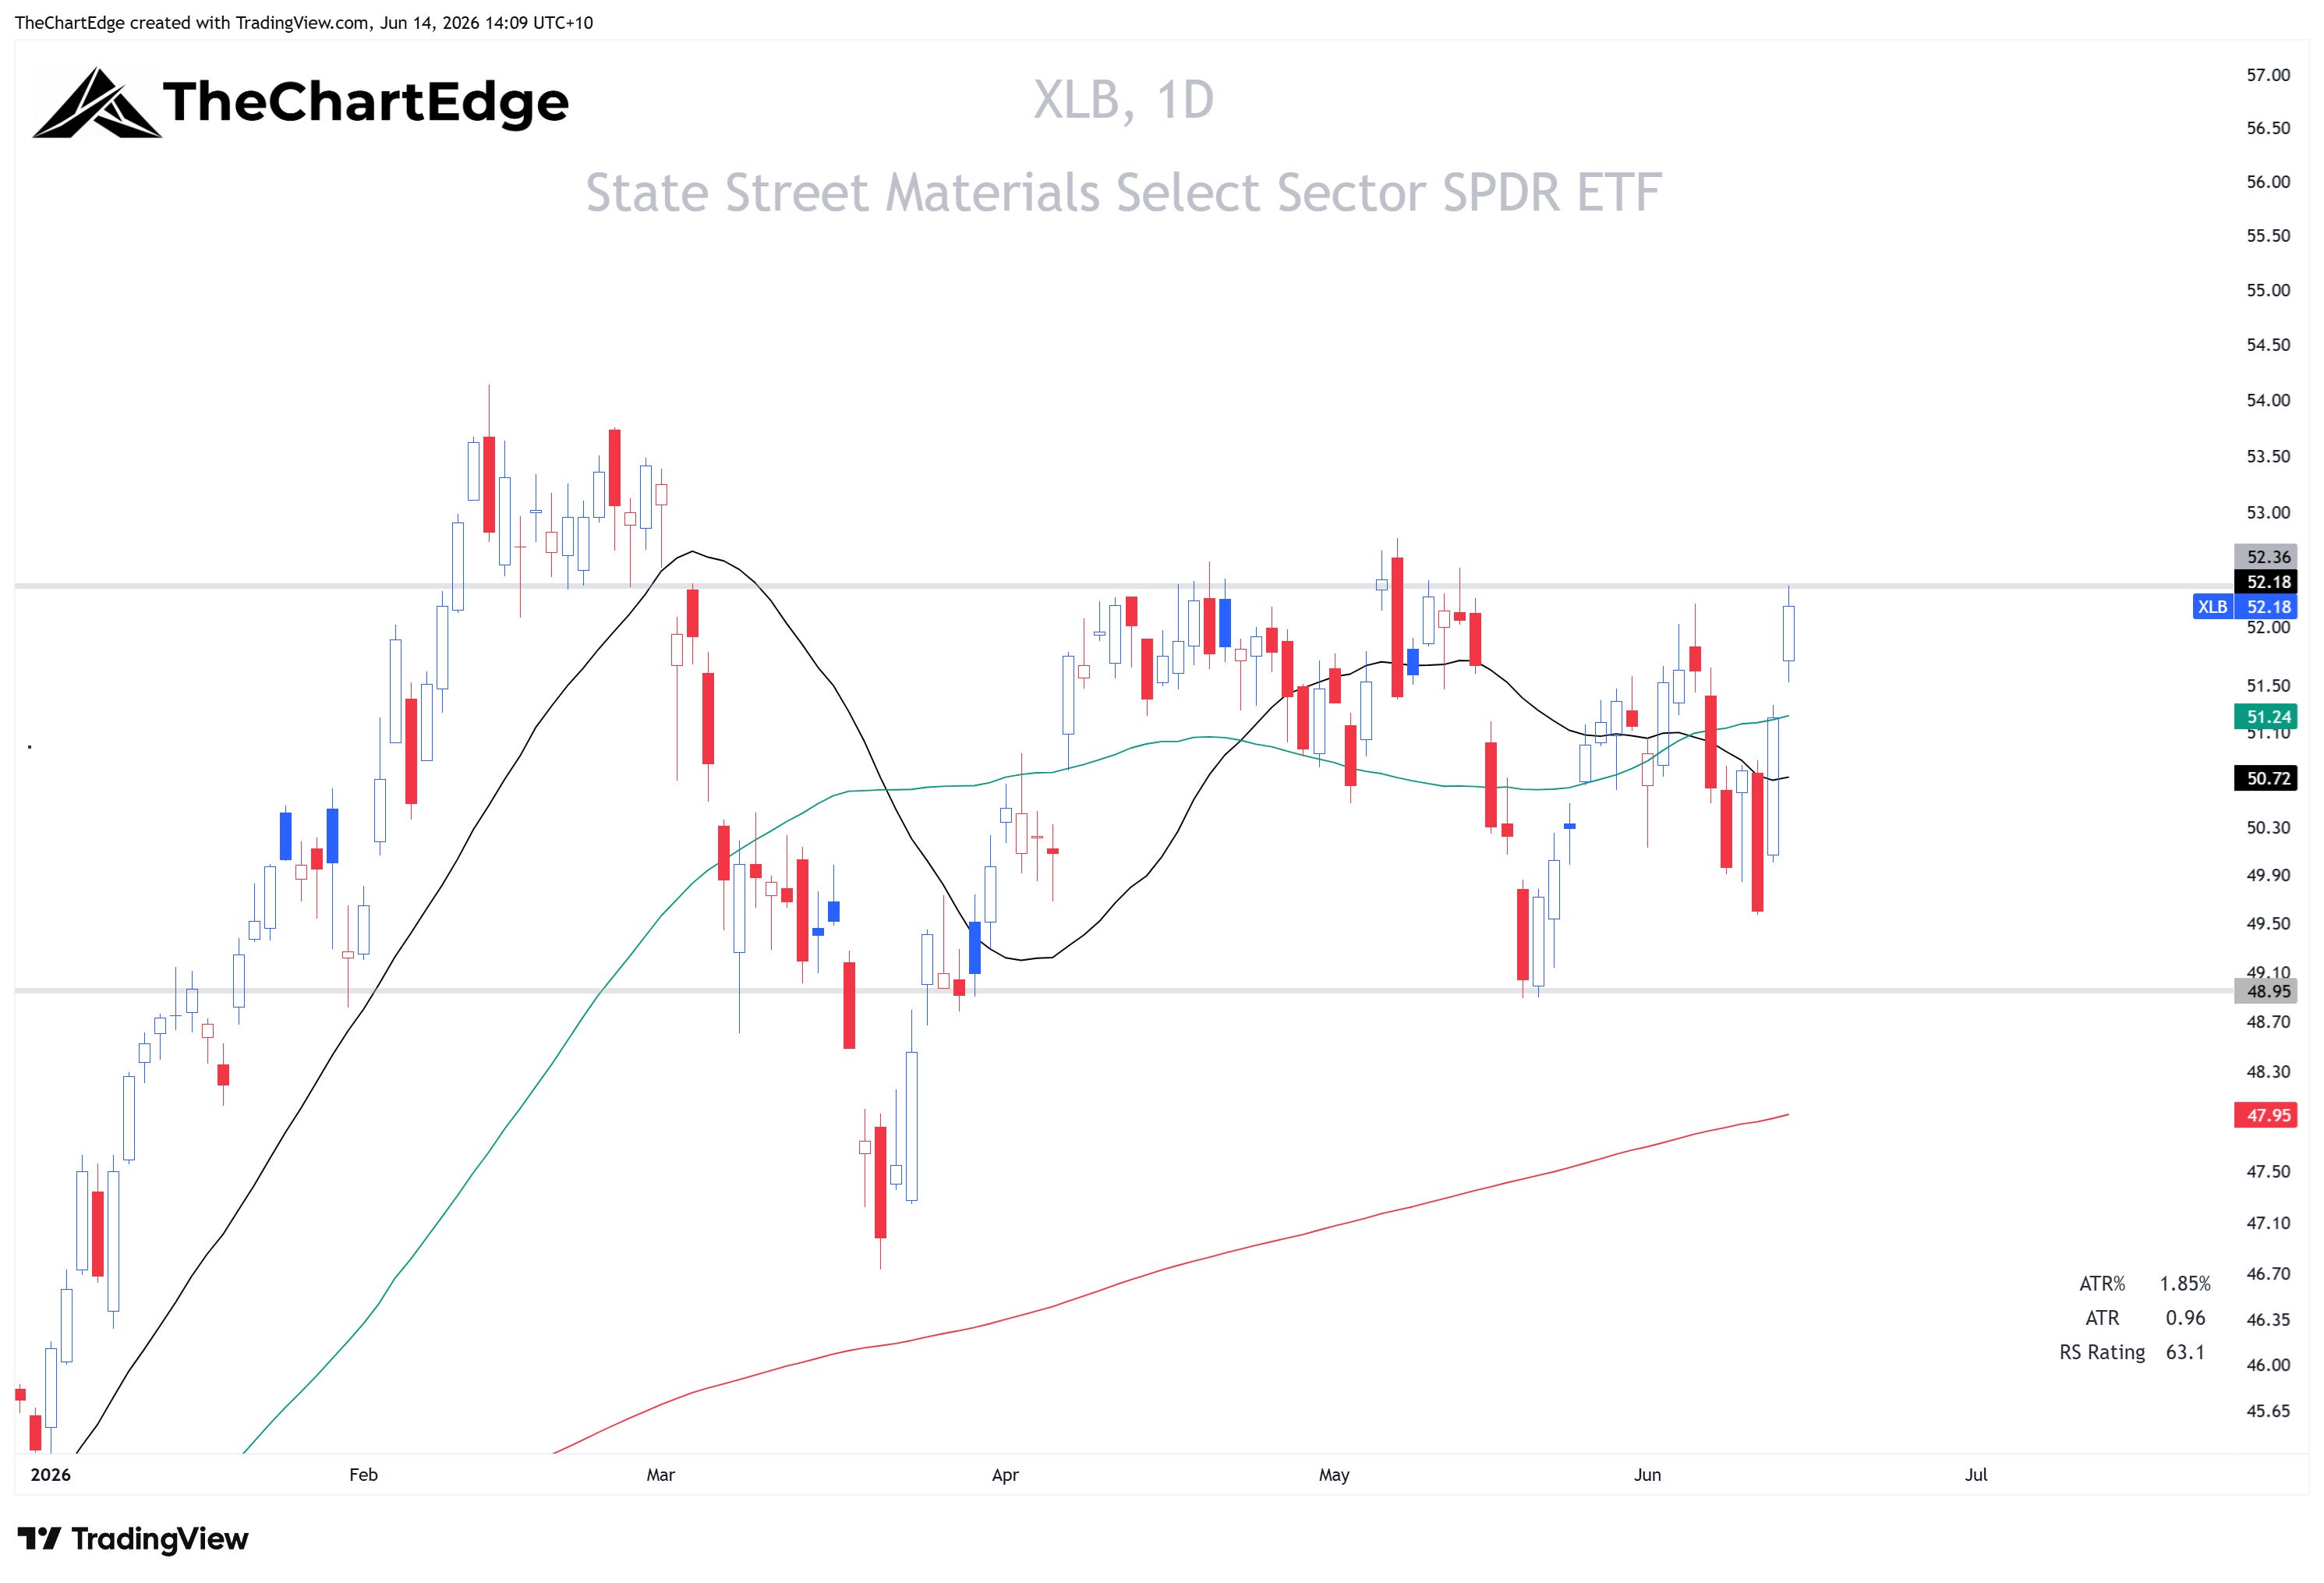
Only two of the eleven GICS sectors are in Leading: Technology (XLK), up 2.5% and still the strongest sector on a relative basis, and Materials (XLB), which crossed in from Lagging after a strong 3% week.
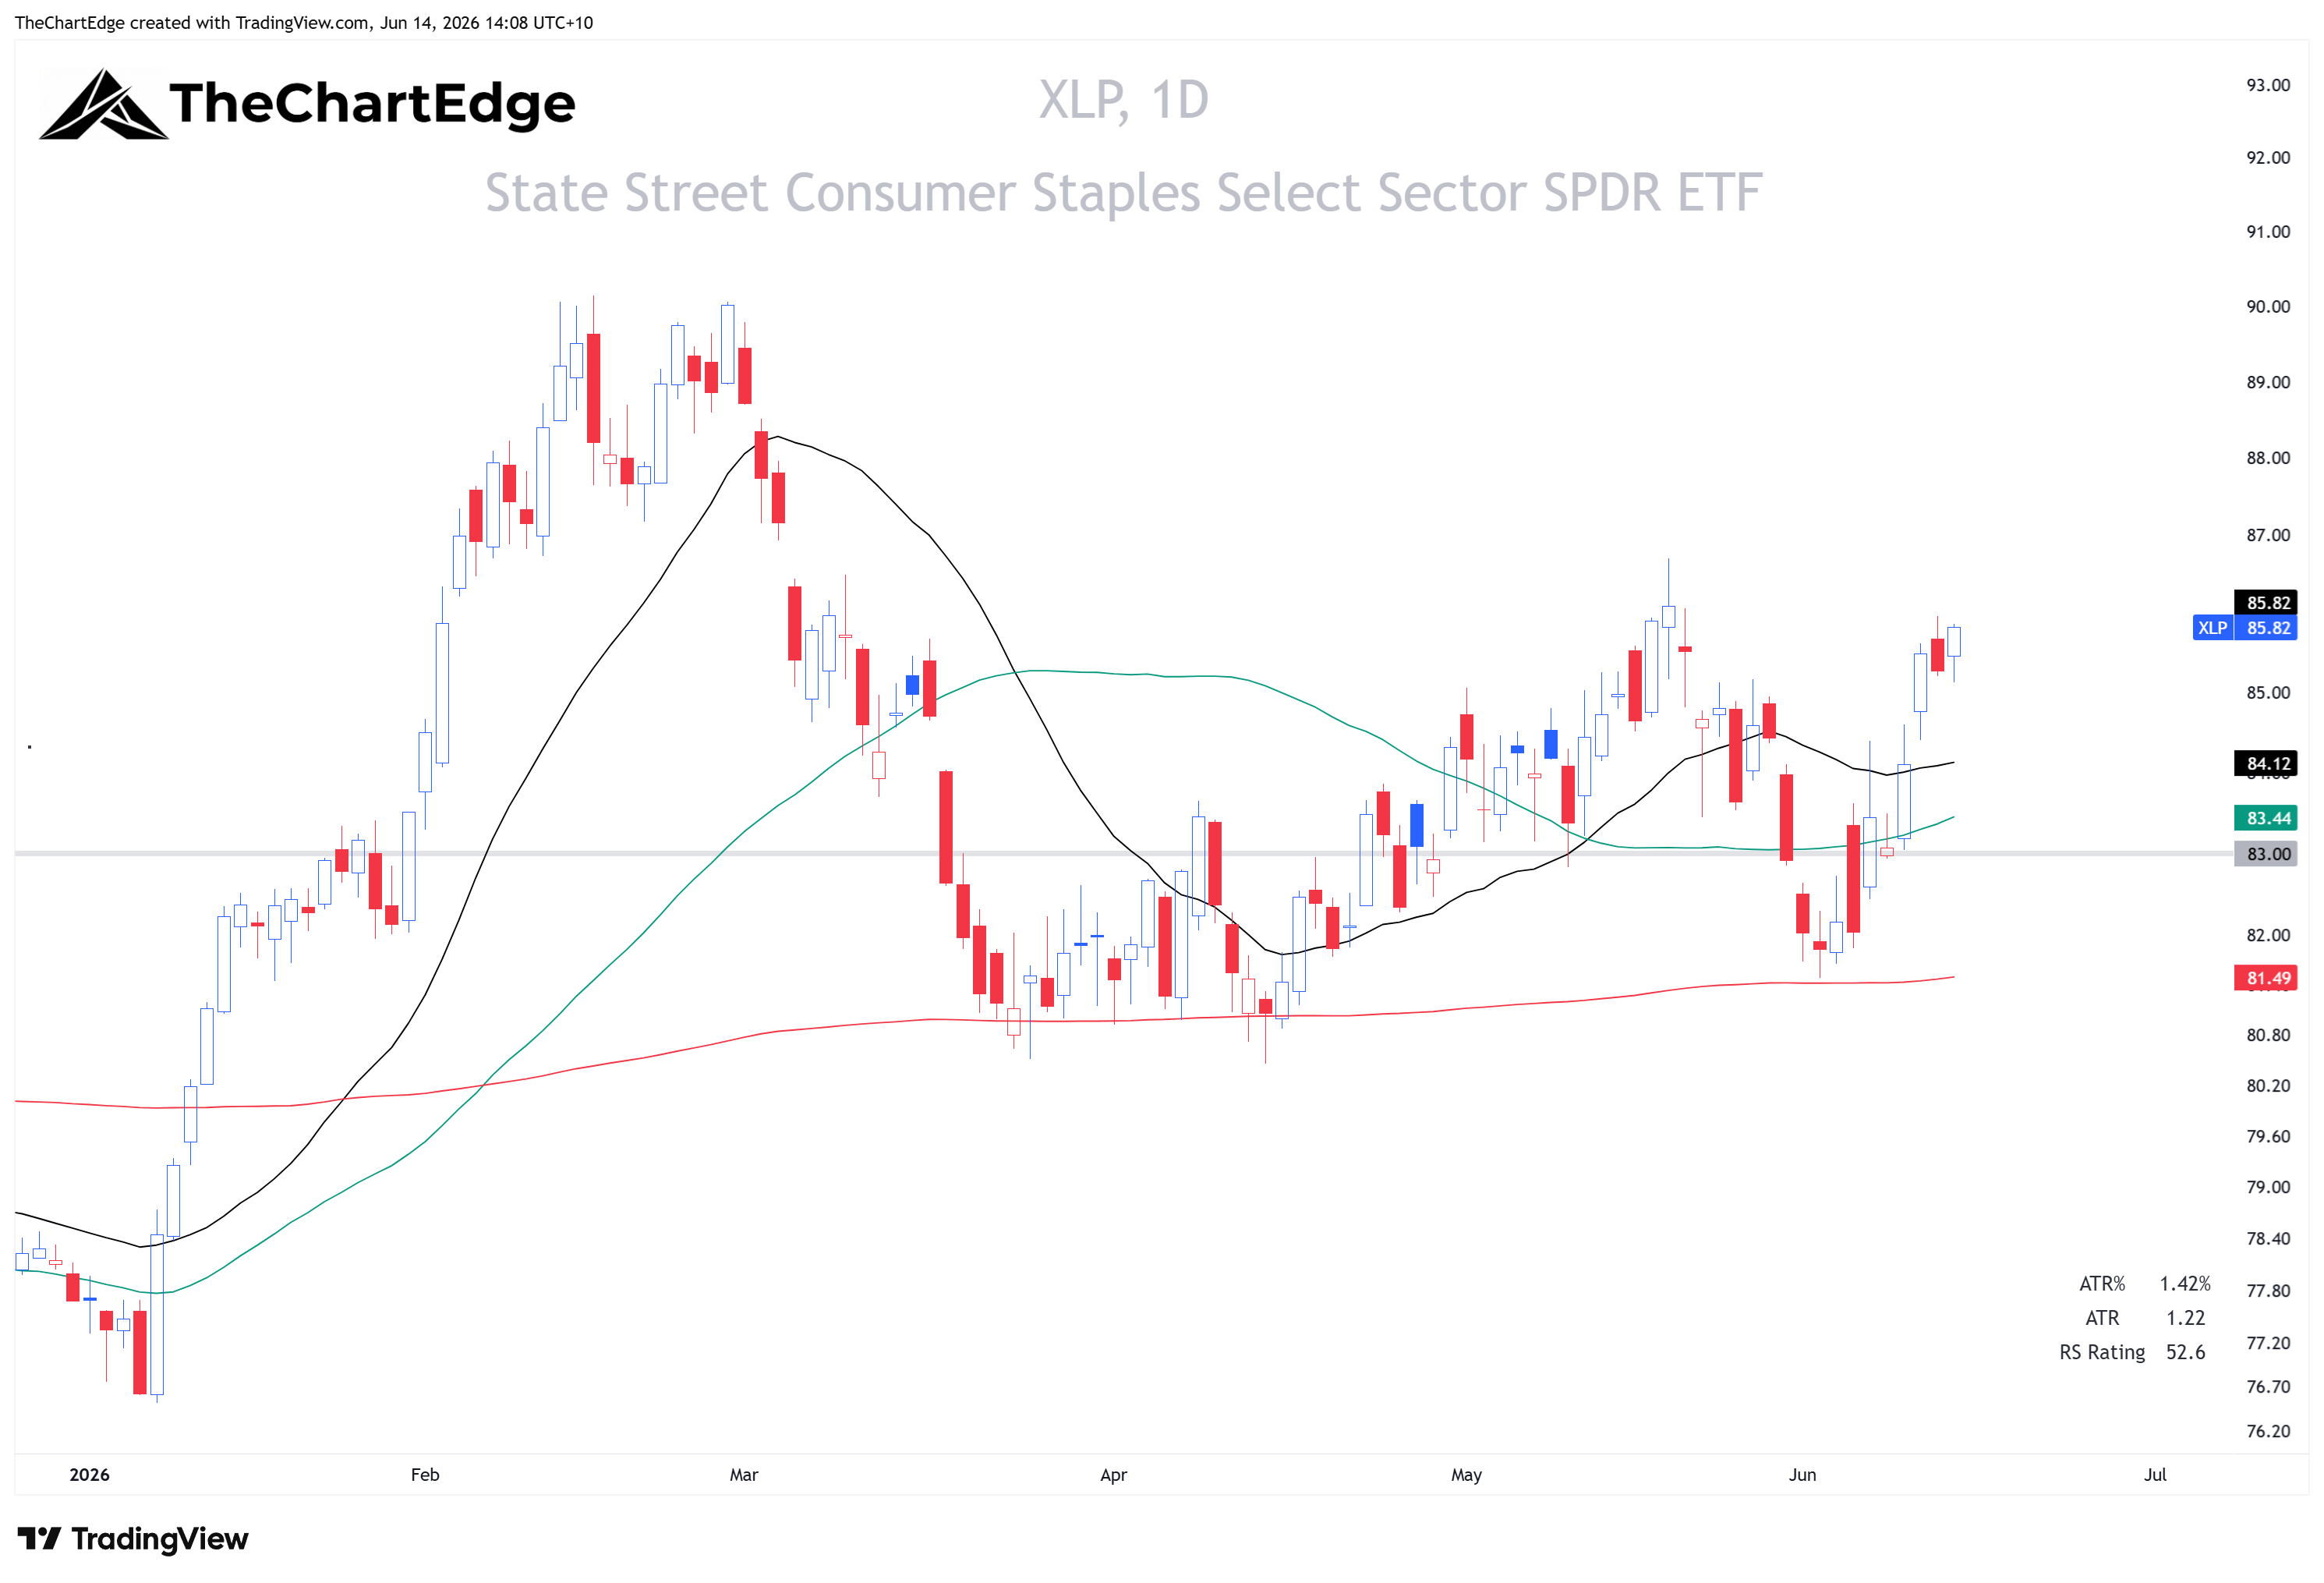
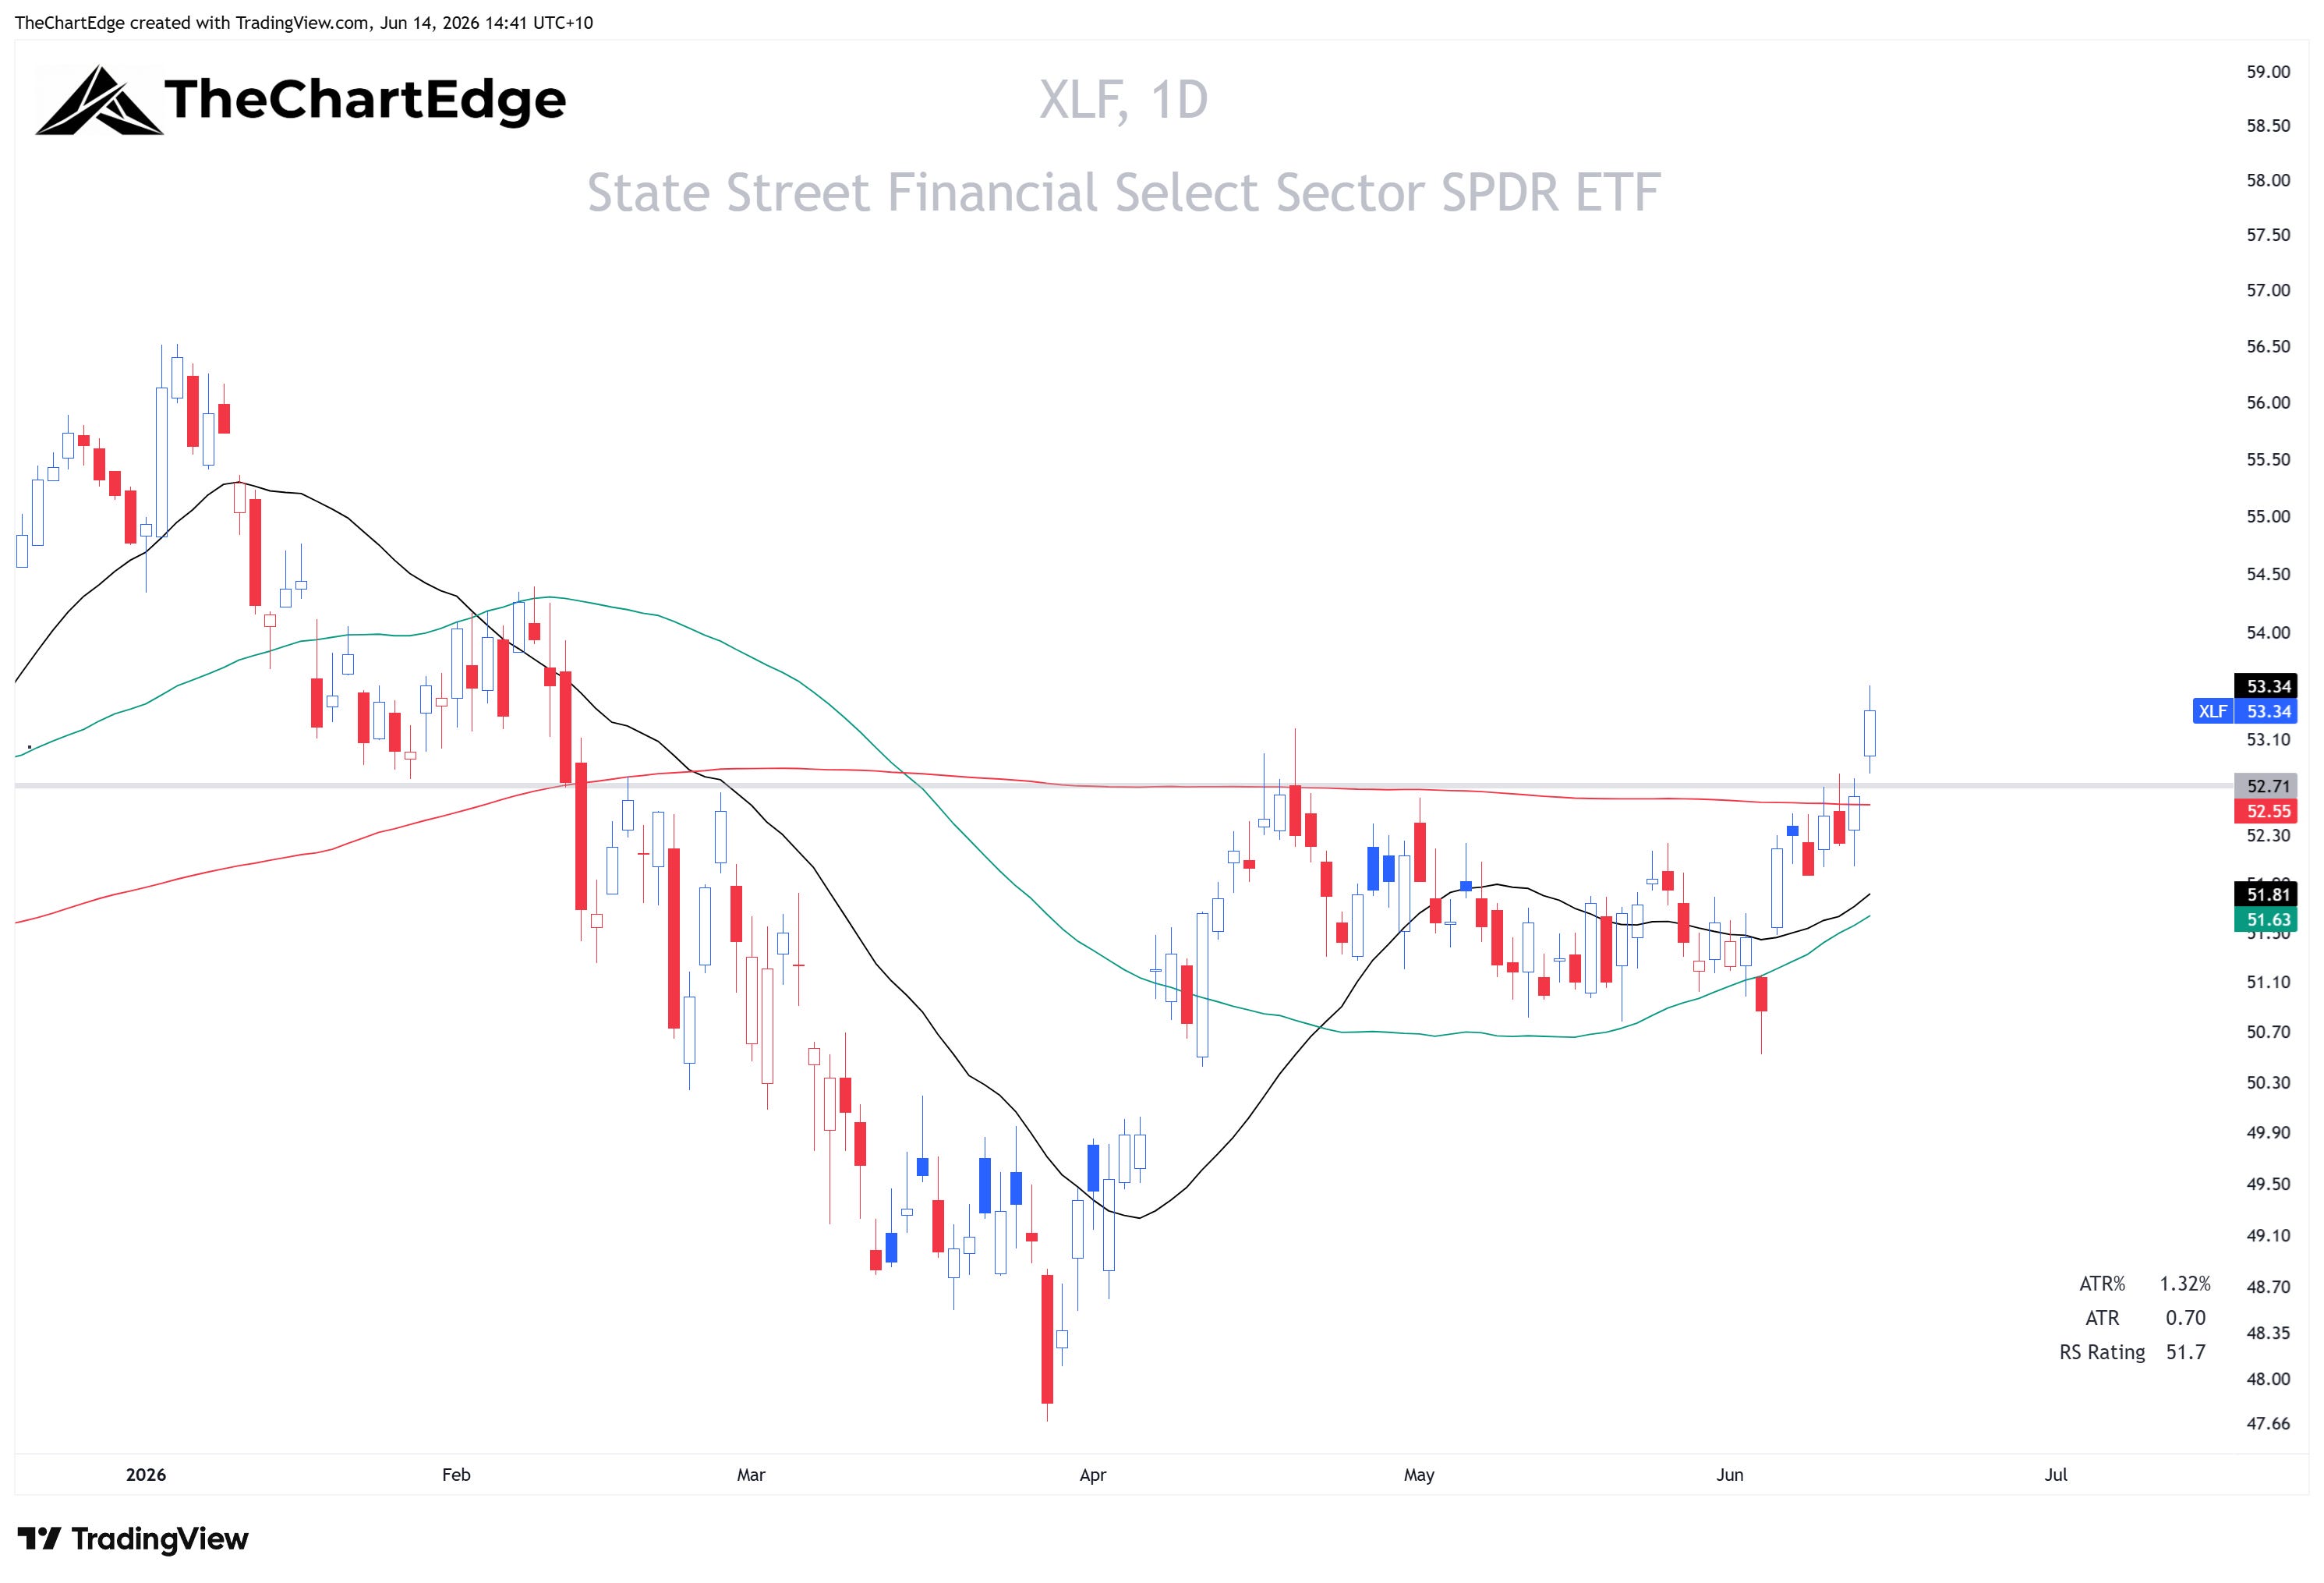
Five sectors sit in Improving: Staples (XLP) 2.9%, Financials (XLF) up 2%, Real Estate (XLRE) 1.5%, Discretionary (XLY) 1.5% and Healthcare (XLV) 0.5%. Discretionary moved up from Lagging, the other four held their place from the prior week.
Two sectors entered into Weakening. Energy (XLE) dropped out of Leading, down 0.2% and the softest sector on the week - crude (USO) fell nearly 6% - energy equities held up far better than the commodity itself. Industrials (XLI) slipped out of Improving despite a 1.2% week but sits right on the border.
That leaves Utilities (XLU) and Communications (XLC) in Lagging, with XLC the weakest sector on the board.
Leadership is thin at the top, but the Improving group is broad - a spread of cyclical, rate-sensitive and defensive sectors all carrying positive momentum.
XLB Chart
XLP Chart
XLF Chart
A Broadening at the Top
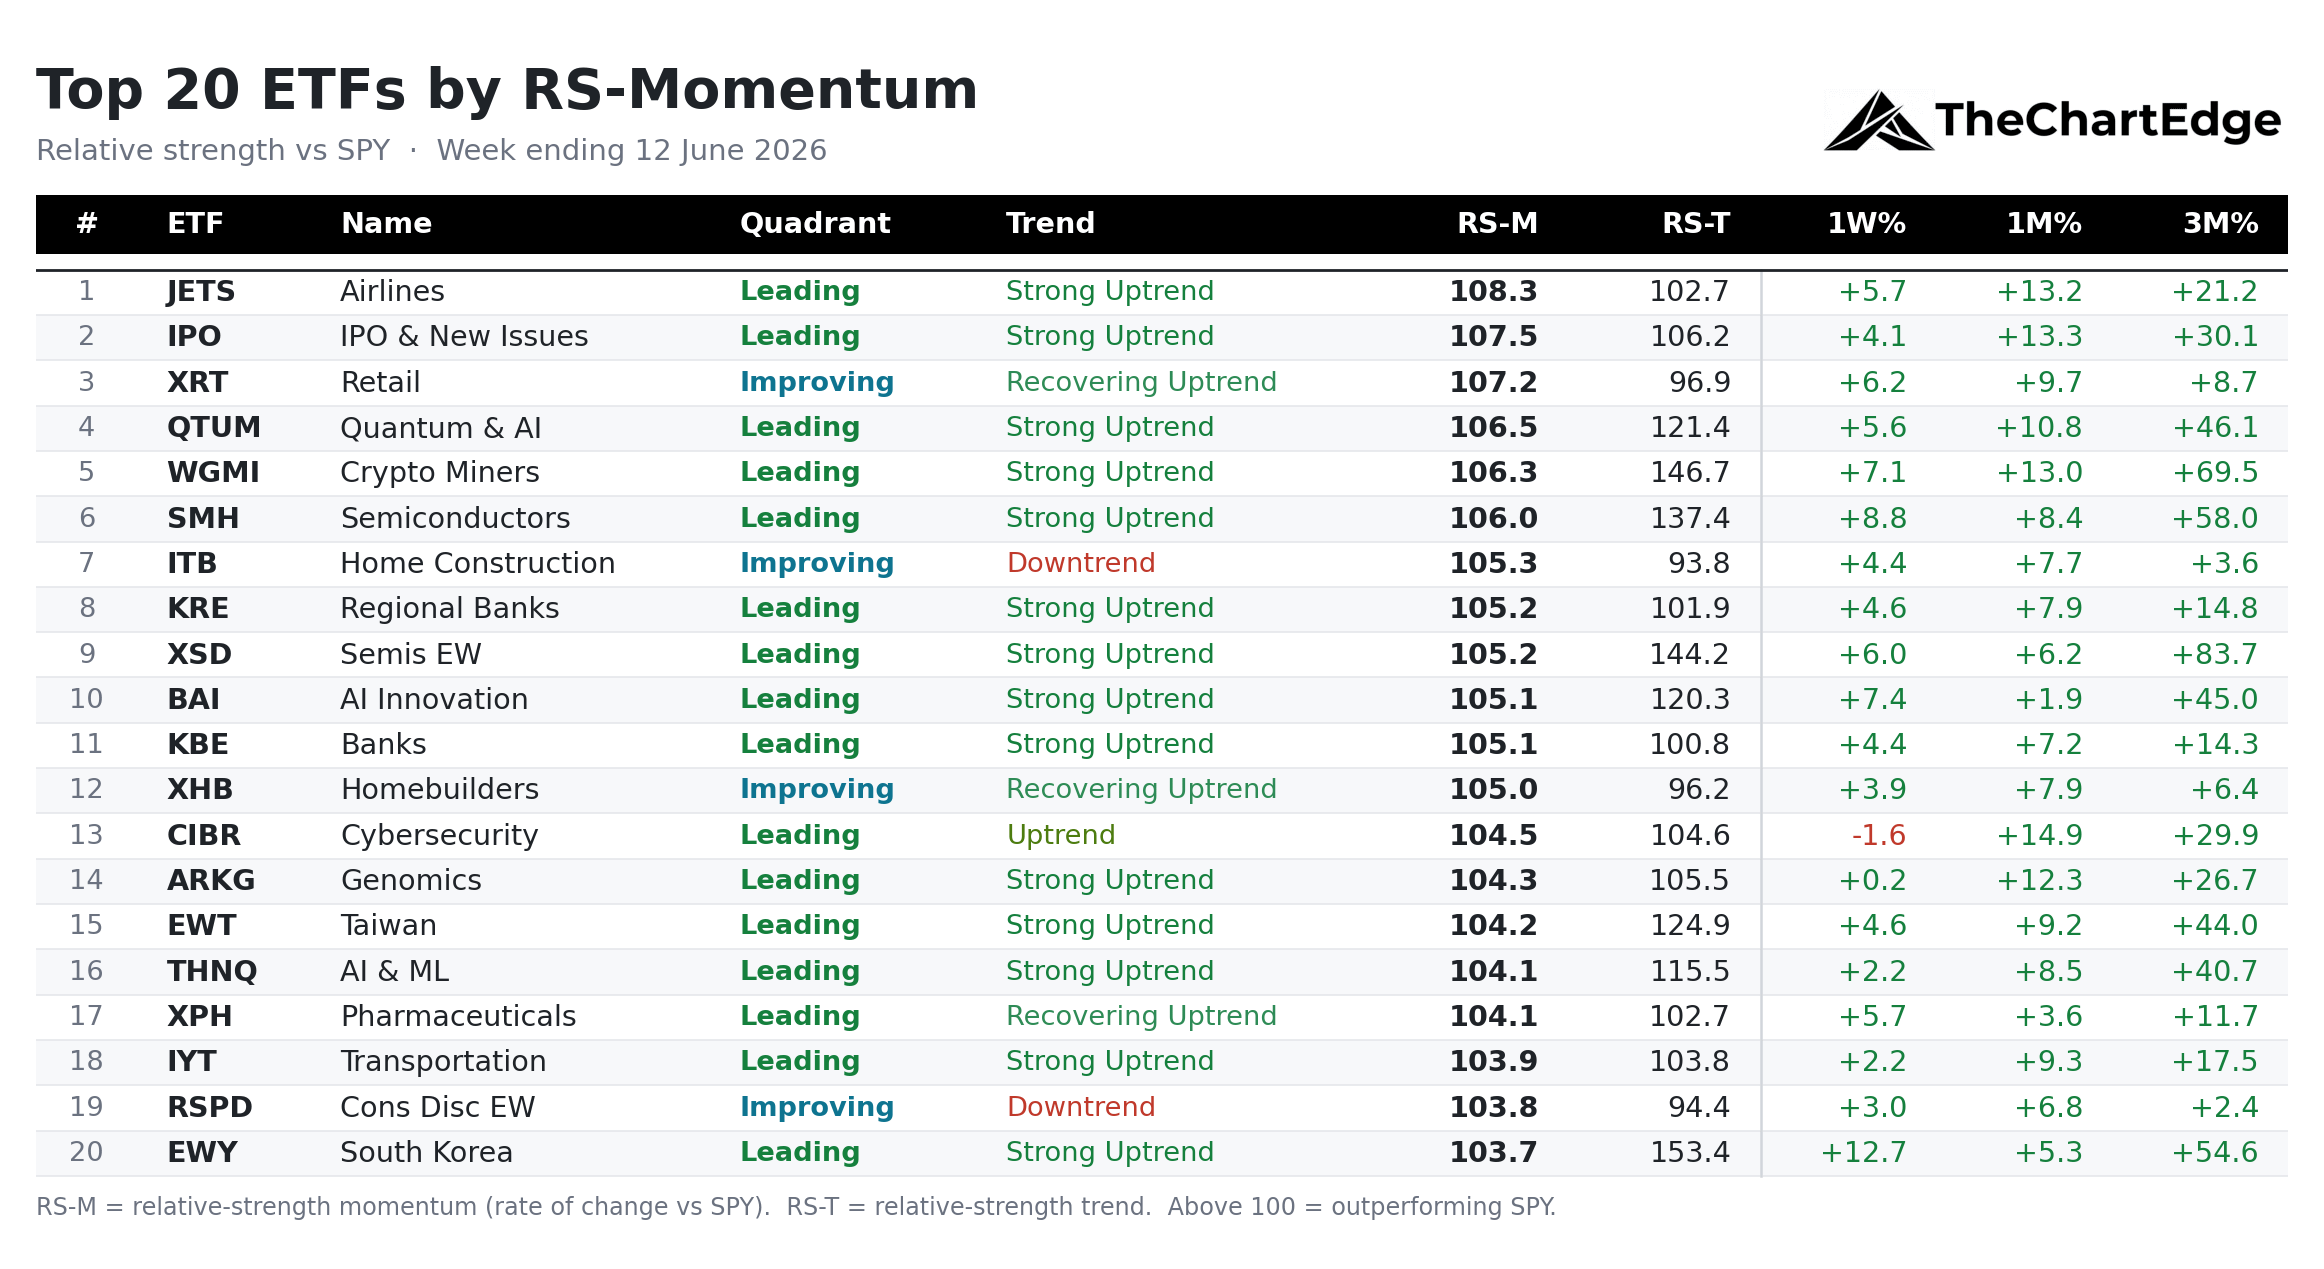
Fifteen of the top twenty names on my momentum leaderboard are new compared to the prior week.
Last weekend, after the Friday June 5 selloff, half of the usual growth leaders that have been dominating the board in recent times - crypto, cloud, software, AI, semis, solar - dropped off, replaced by healthcare, financials, insurance, real estate, the USD (UUP) and anti-beta. The defensive names are now gone, and the board is led by Airlines (JETS), then IPOs (IPO) and retail (XRT), with home construction (ITB), homebuilders (XHB) and the regional banks (KRE) and banks (KBE) all inside the top dozen. Semiconductors (SMH), equal-weight semis (XSD) and the AI names (QTUM, BAI), crypto miners (WGMI), along with Taiwan (EWT) and South Korea (EWY), have made a return to the top 20.
Airlines and retail at the top of the momentum board is not something I have seen in a long time. And most of these names are in uptrends, not just oversold bounces. A couple, home construction (ITB) and EW consumer discretionary (RSPD), are bouncing within a downtrend, but the remainder are in one of the three uptrend states.
This suggests things are risk-on and broadening. But it isn’t clear-cut. Staples (XLP) was the second-strongest GICS sector on the week, behind materials (XLB), and outperformed both the S&P 500 and discretionary (XLY). Growth (IWF) also lagged relative to value (IWD) for a second week running. We are getting conflicting signs regarding risk appetite.
Semis Bounce, Software Breaks Down
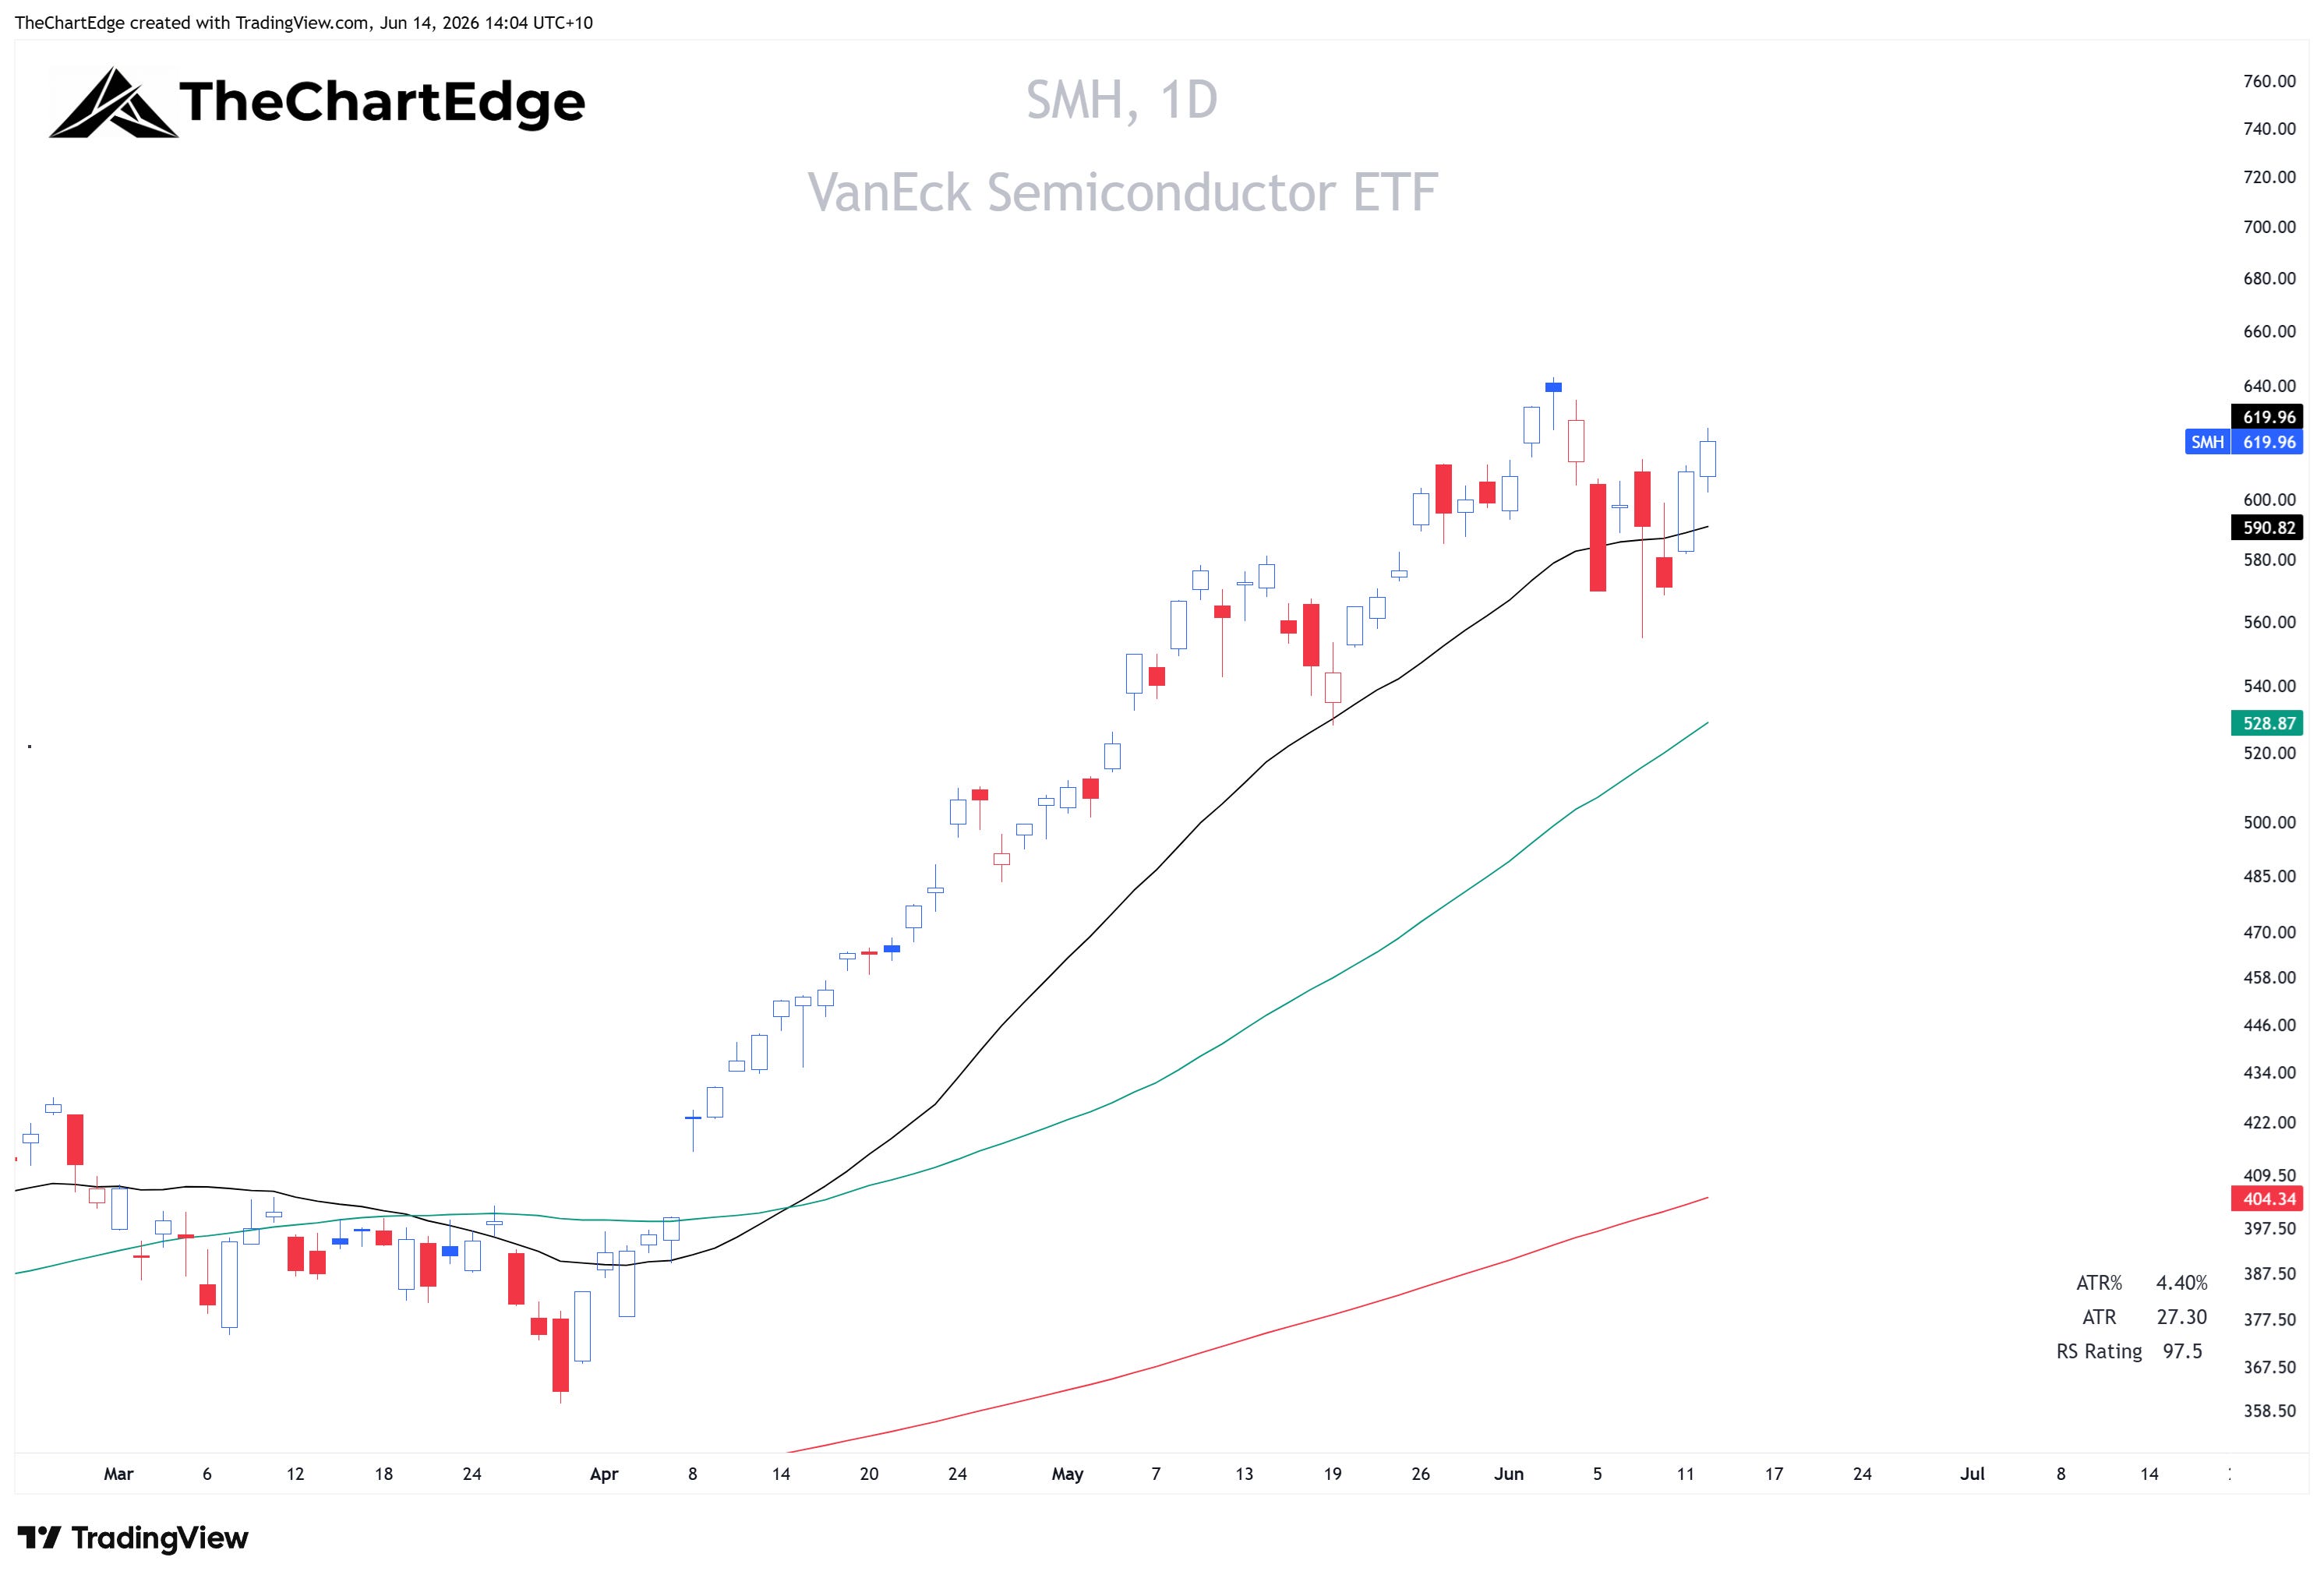
Inside tech, semis and software diverged massively last week. Semiconductors (SMH) rose 8.8%, one of the biggest weekly gains on the board, and is back in Leading. Equal-weight semis (XSD) added 6%. Both are in Strong Uptrends, sitting well above their 50-day moving averages, with three-month gains of 58% and 84%. The selloff barely dented their trend - over the past two weeks SMH is up 3.5% and XSD is about flat.
SMH Chart
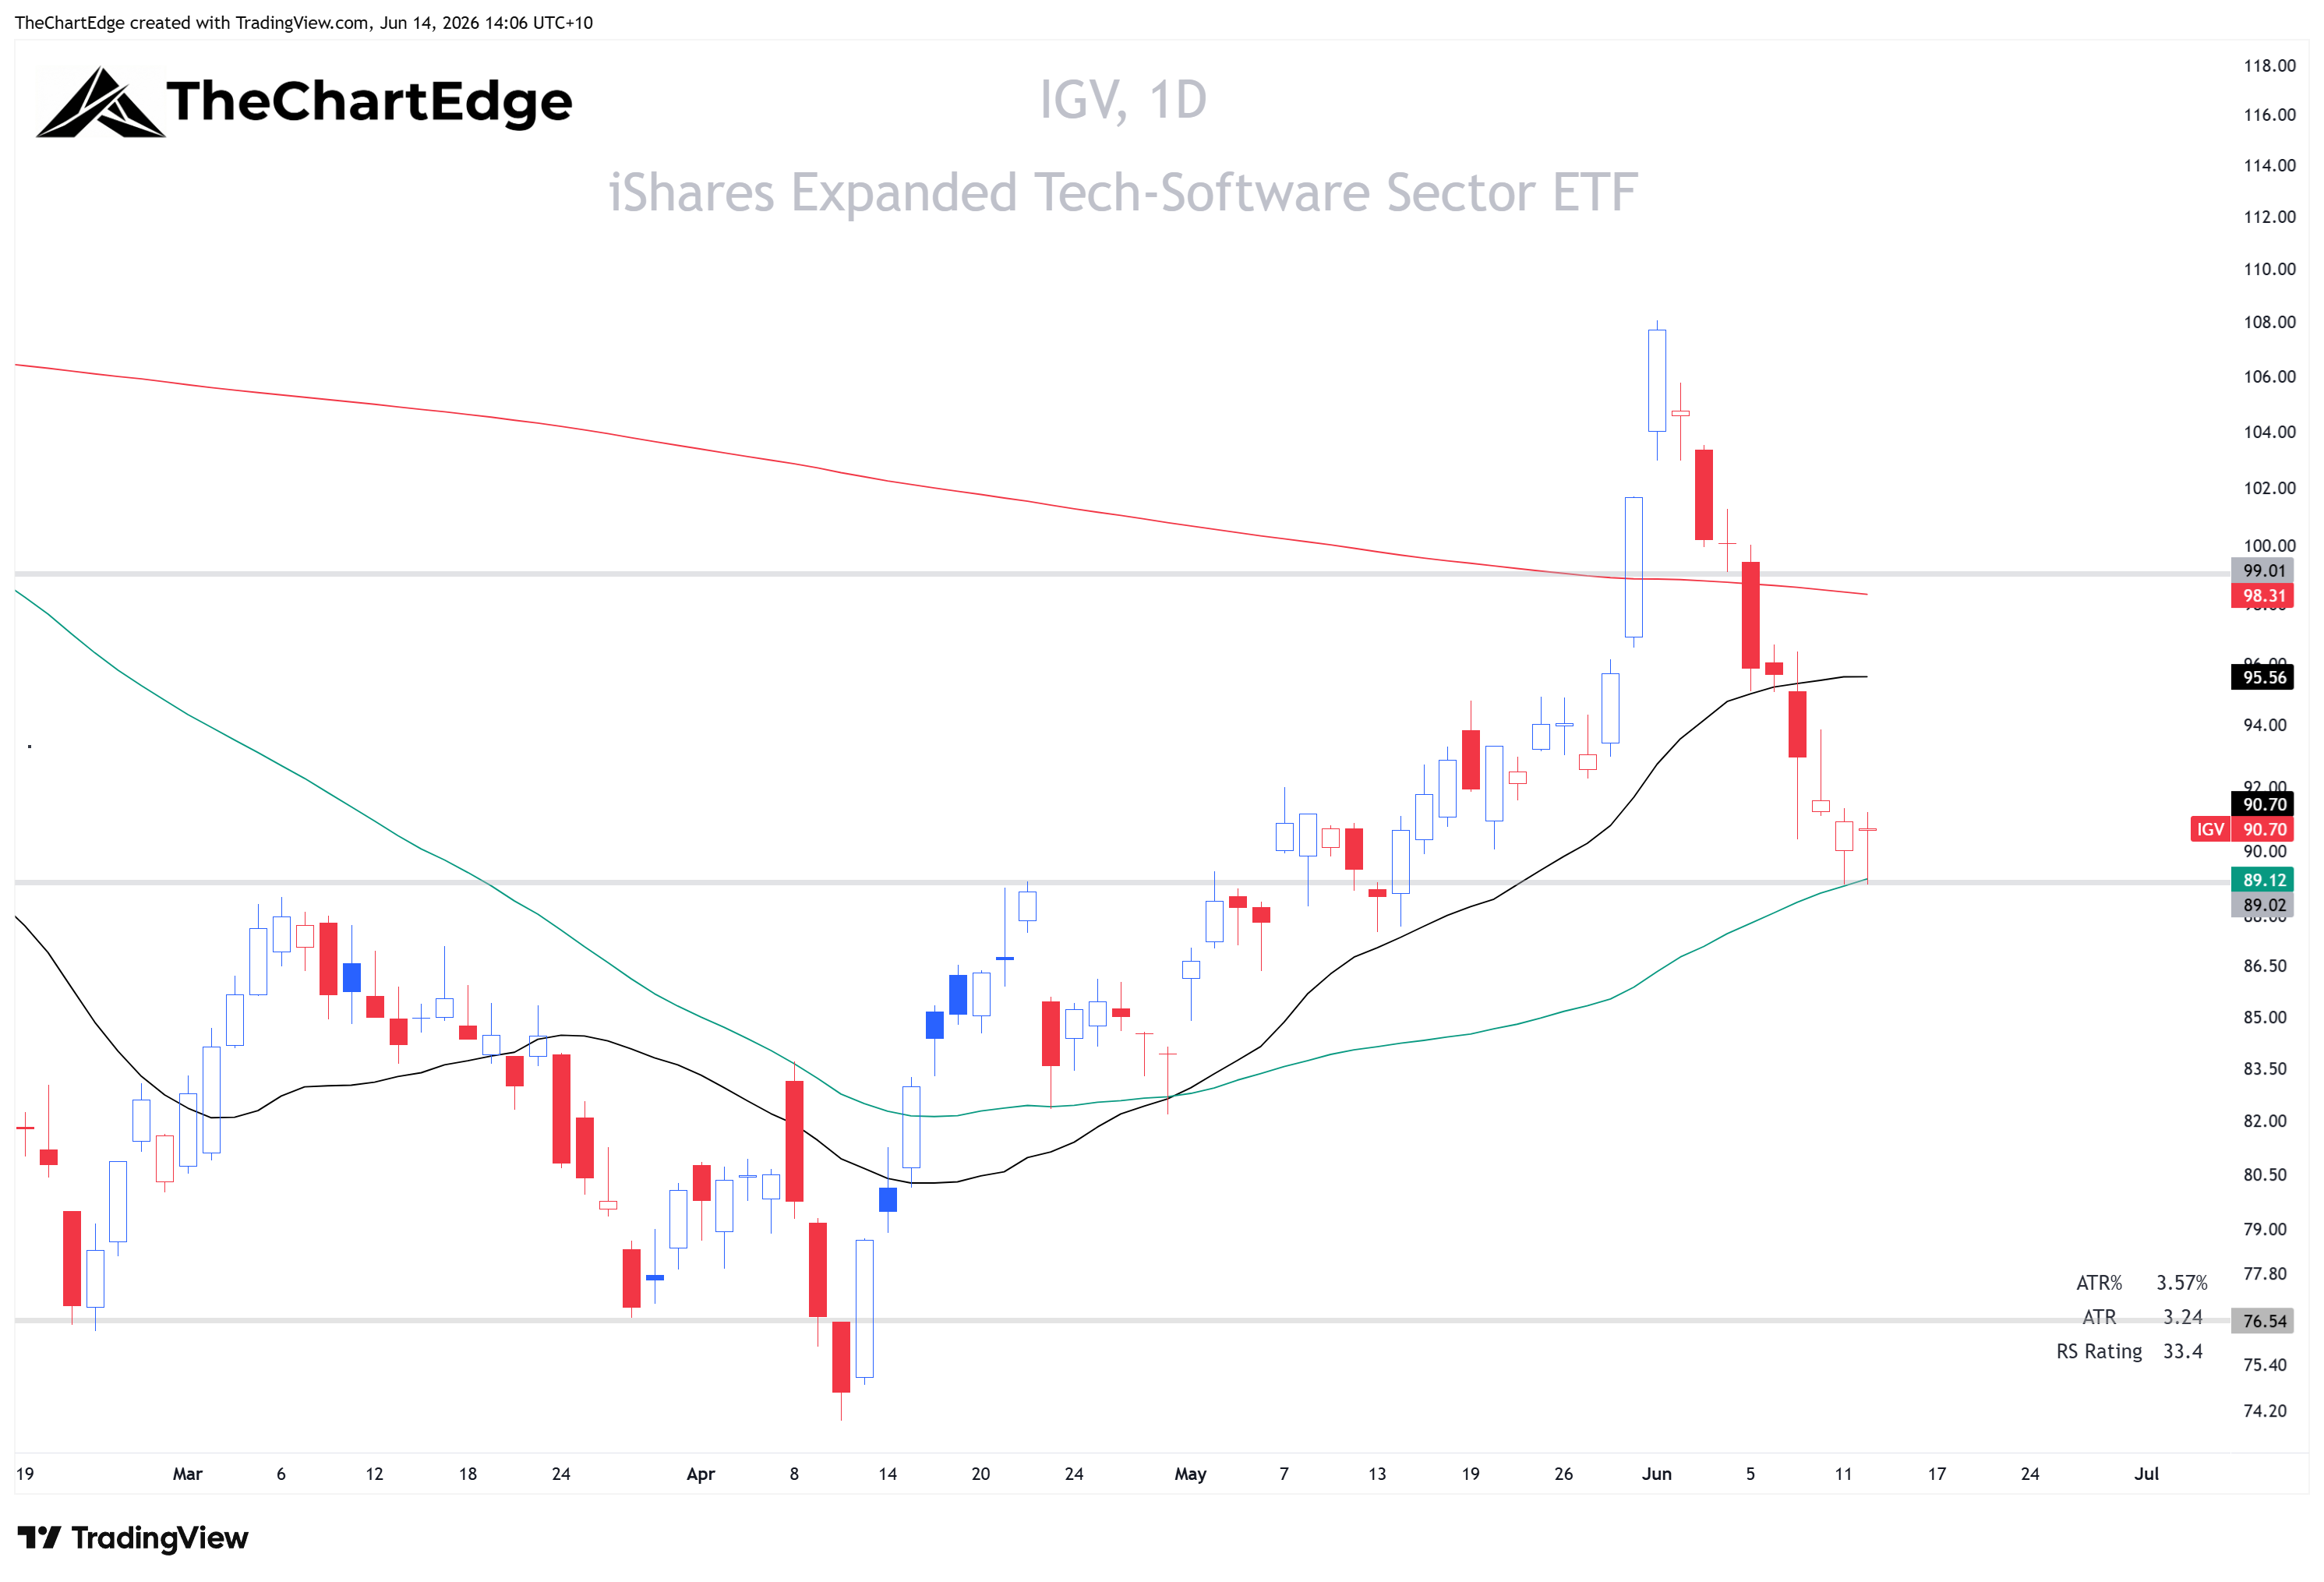
Software (IGV) fell 5.4% last week, on top of a 5.7% drop the prior week - down nearly 11% over the fortnight. It dropped from Improving to Lagging and into a Downtrend, again below its 200-day SMA, after briefly getting above it in late May and early June. Equal-weight software (XSW) and internet (FDN) tell the same story, both down 6 to 7% over the two weeks and back in downtrend states.
The extreme weakness lies in the large SaaS names, which have lagged all year. Cyber and crypto miners continue to perform well, but not enough to hold up the IGV.
IGV Chart
International - Highs Abroad, China Left Behind
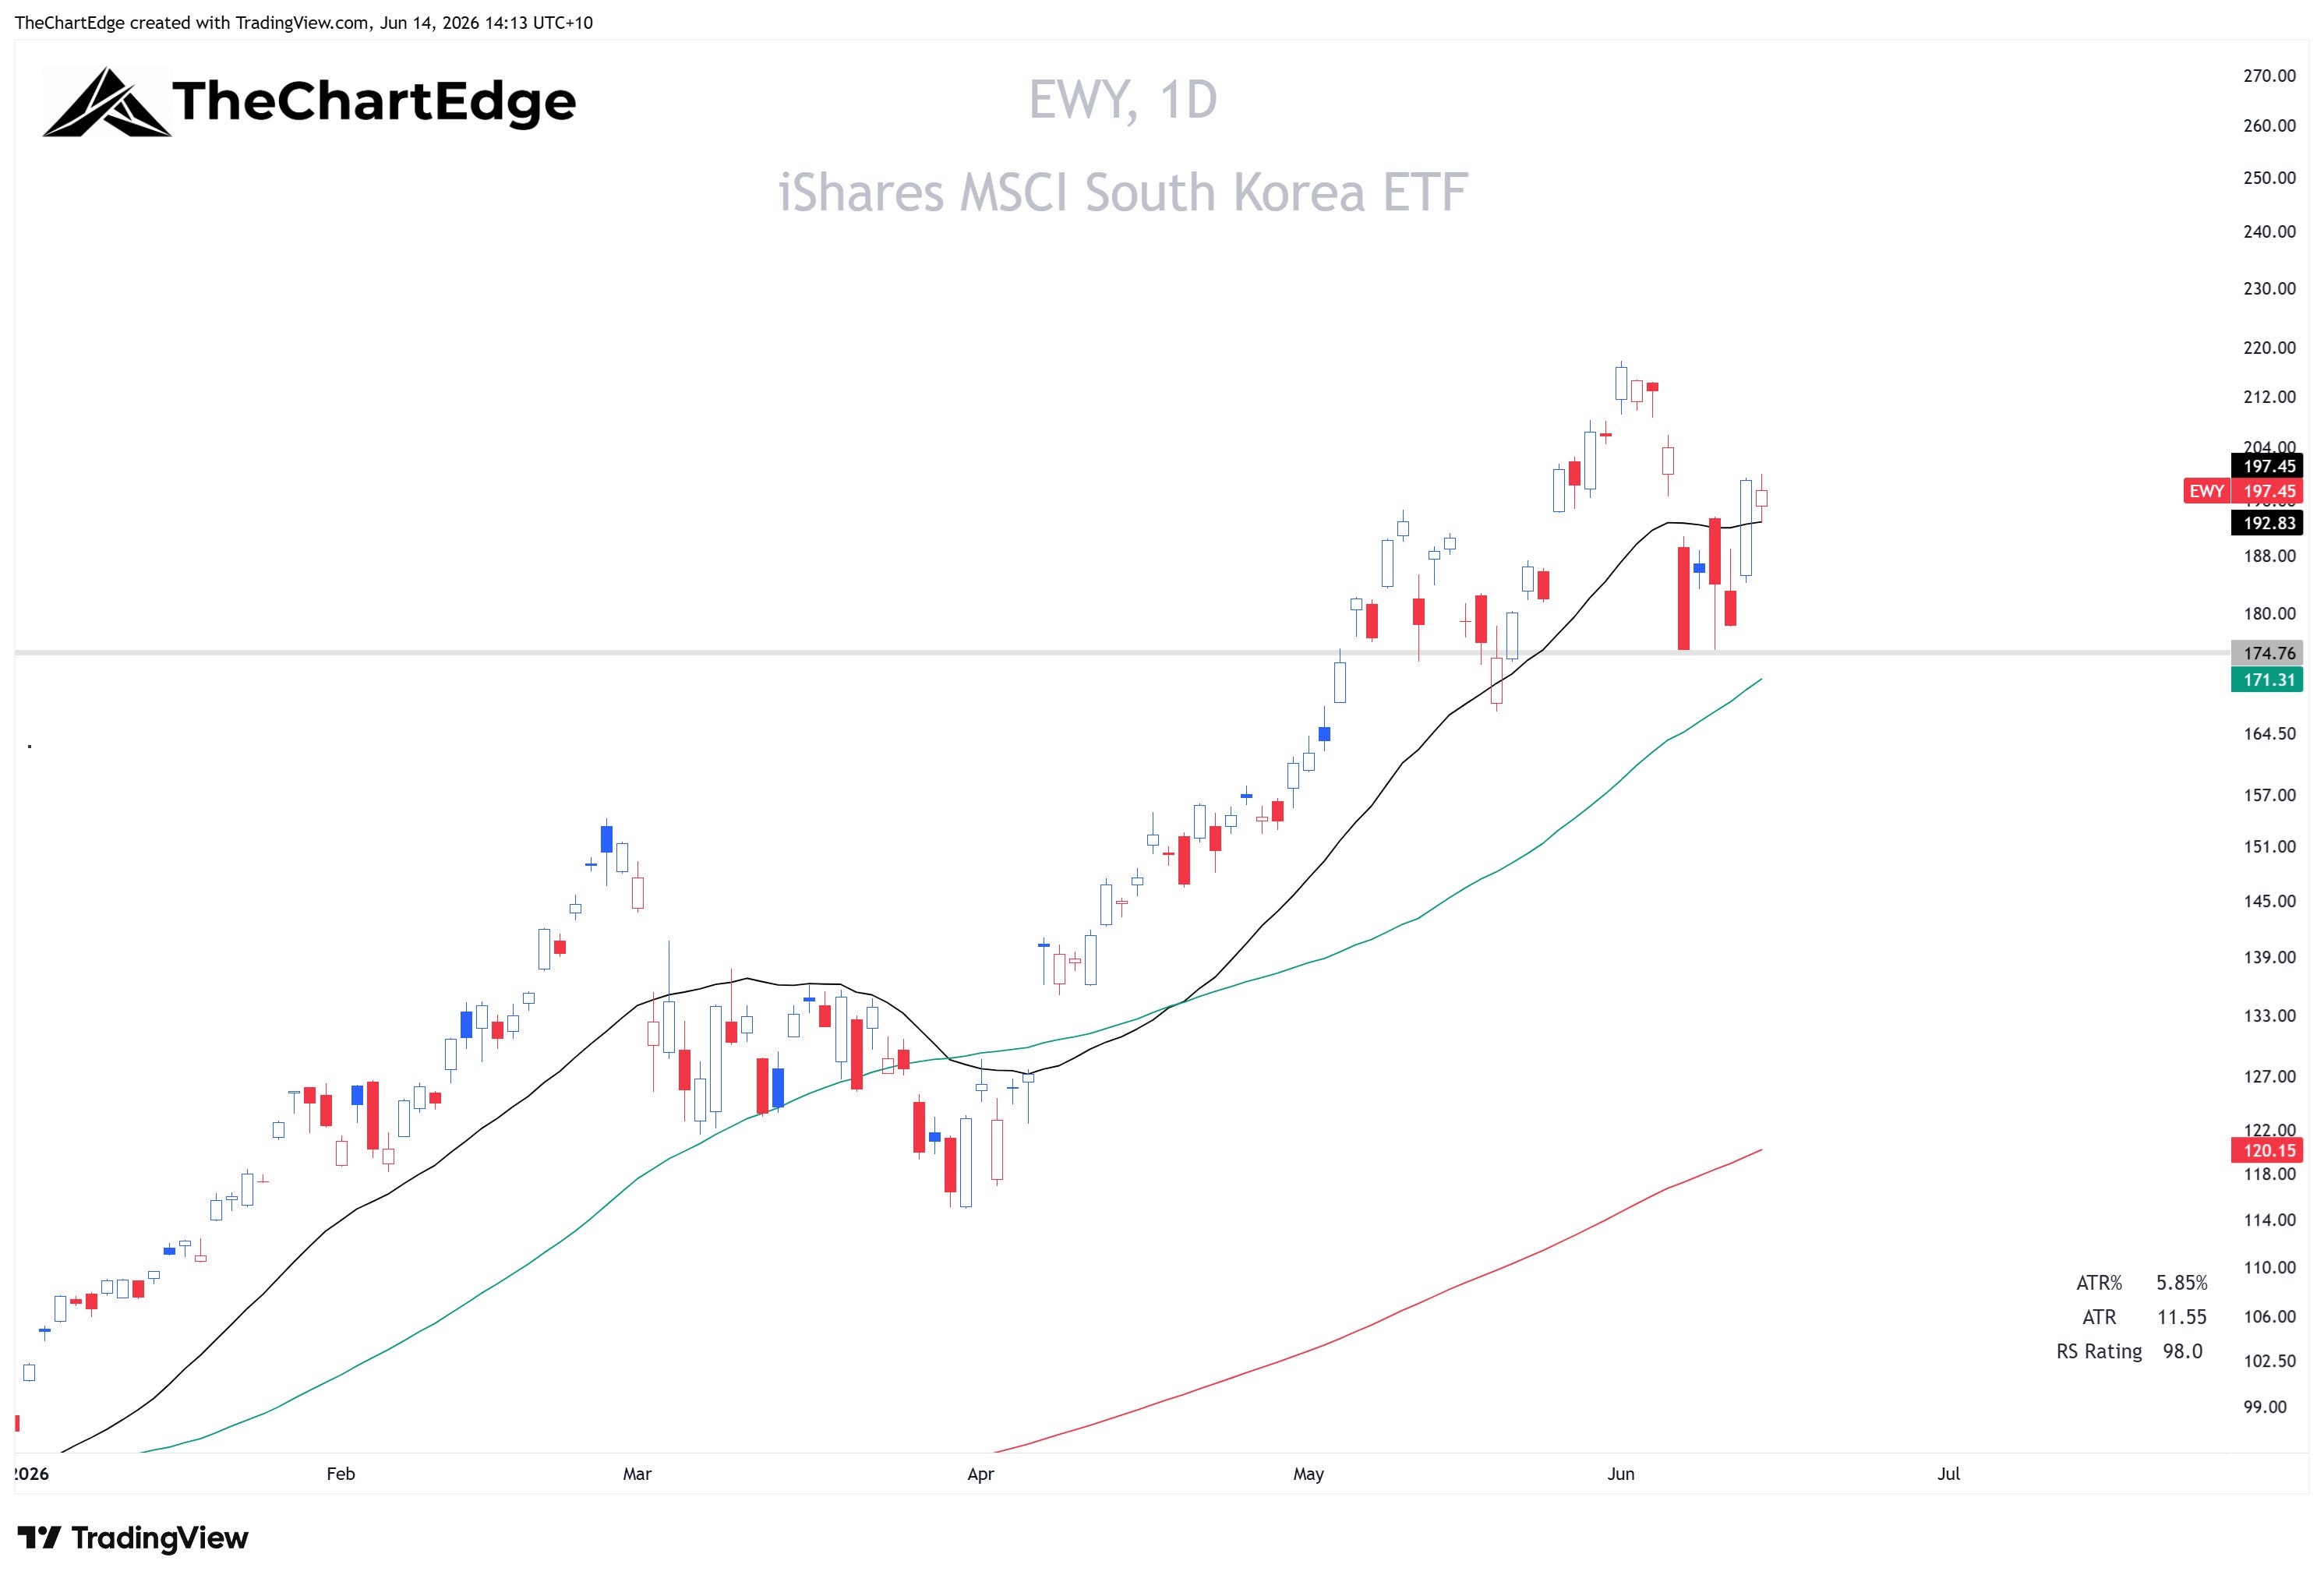
South Korea (EWY) and Taiwan (EWT) are the strongest names on the international board, up nearly 13% and over 4.5% respectively. Both dropped into Weakening during the selloff two weeks ago and both are now back in Leading, in Strong Uptrends. South Korea’s relative-strength trend is the highest of any international market I track, by some margin.
EWY Chart
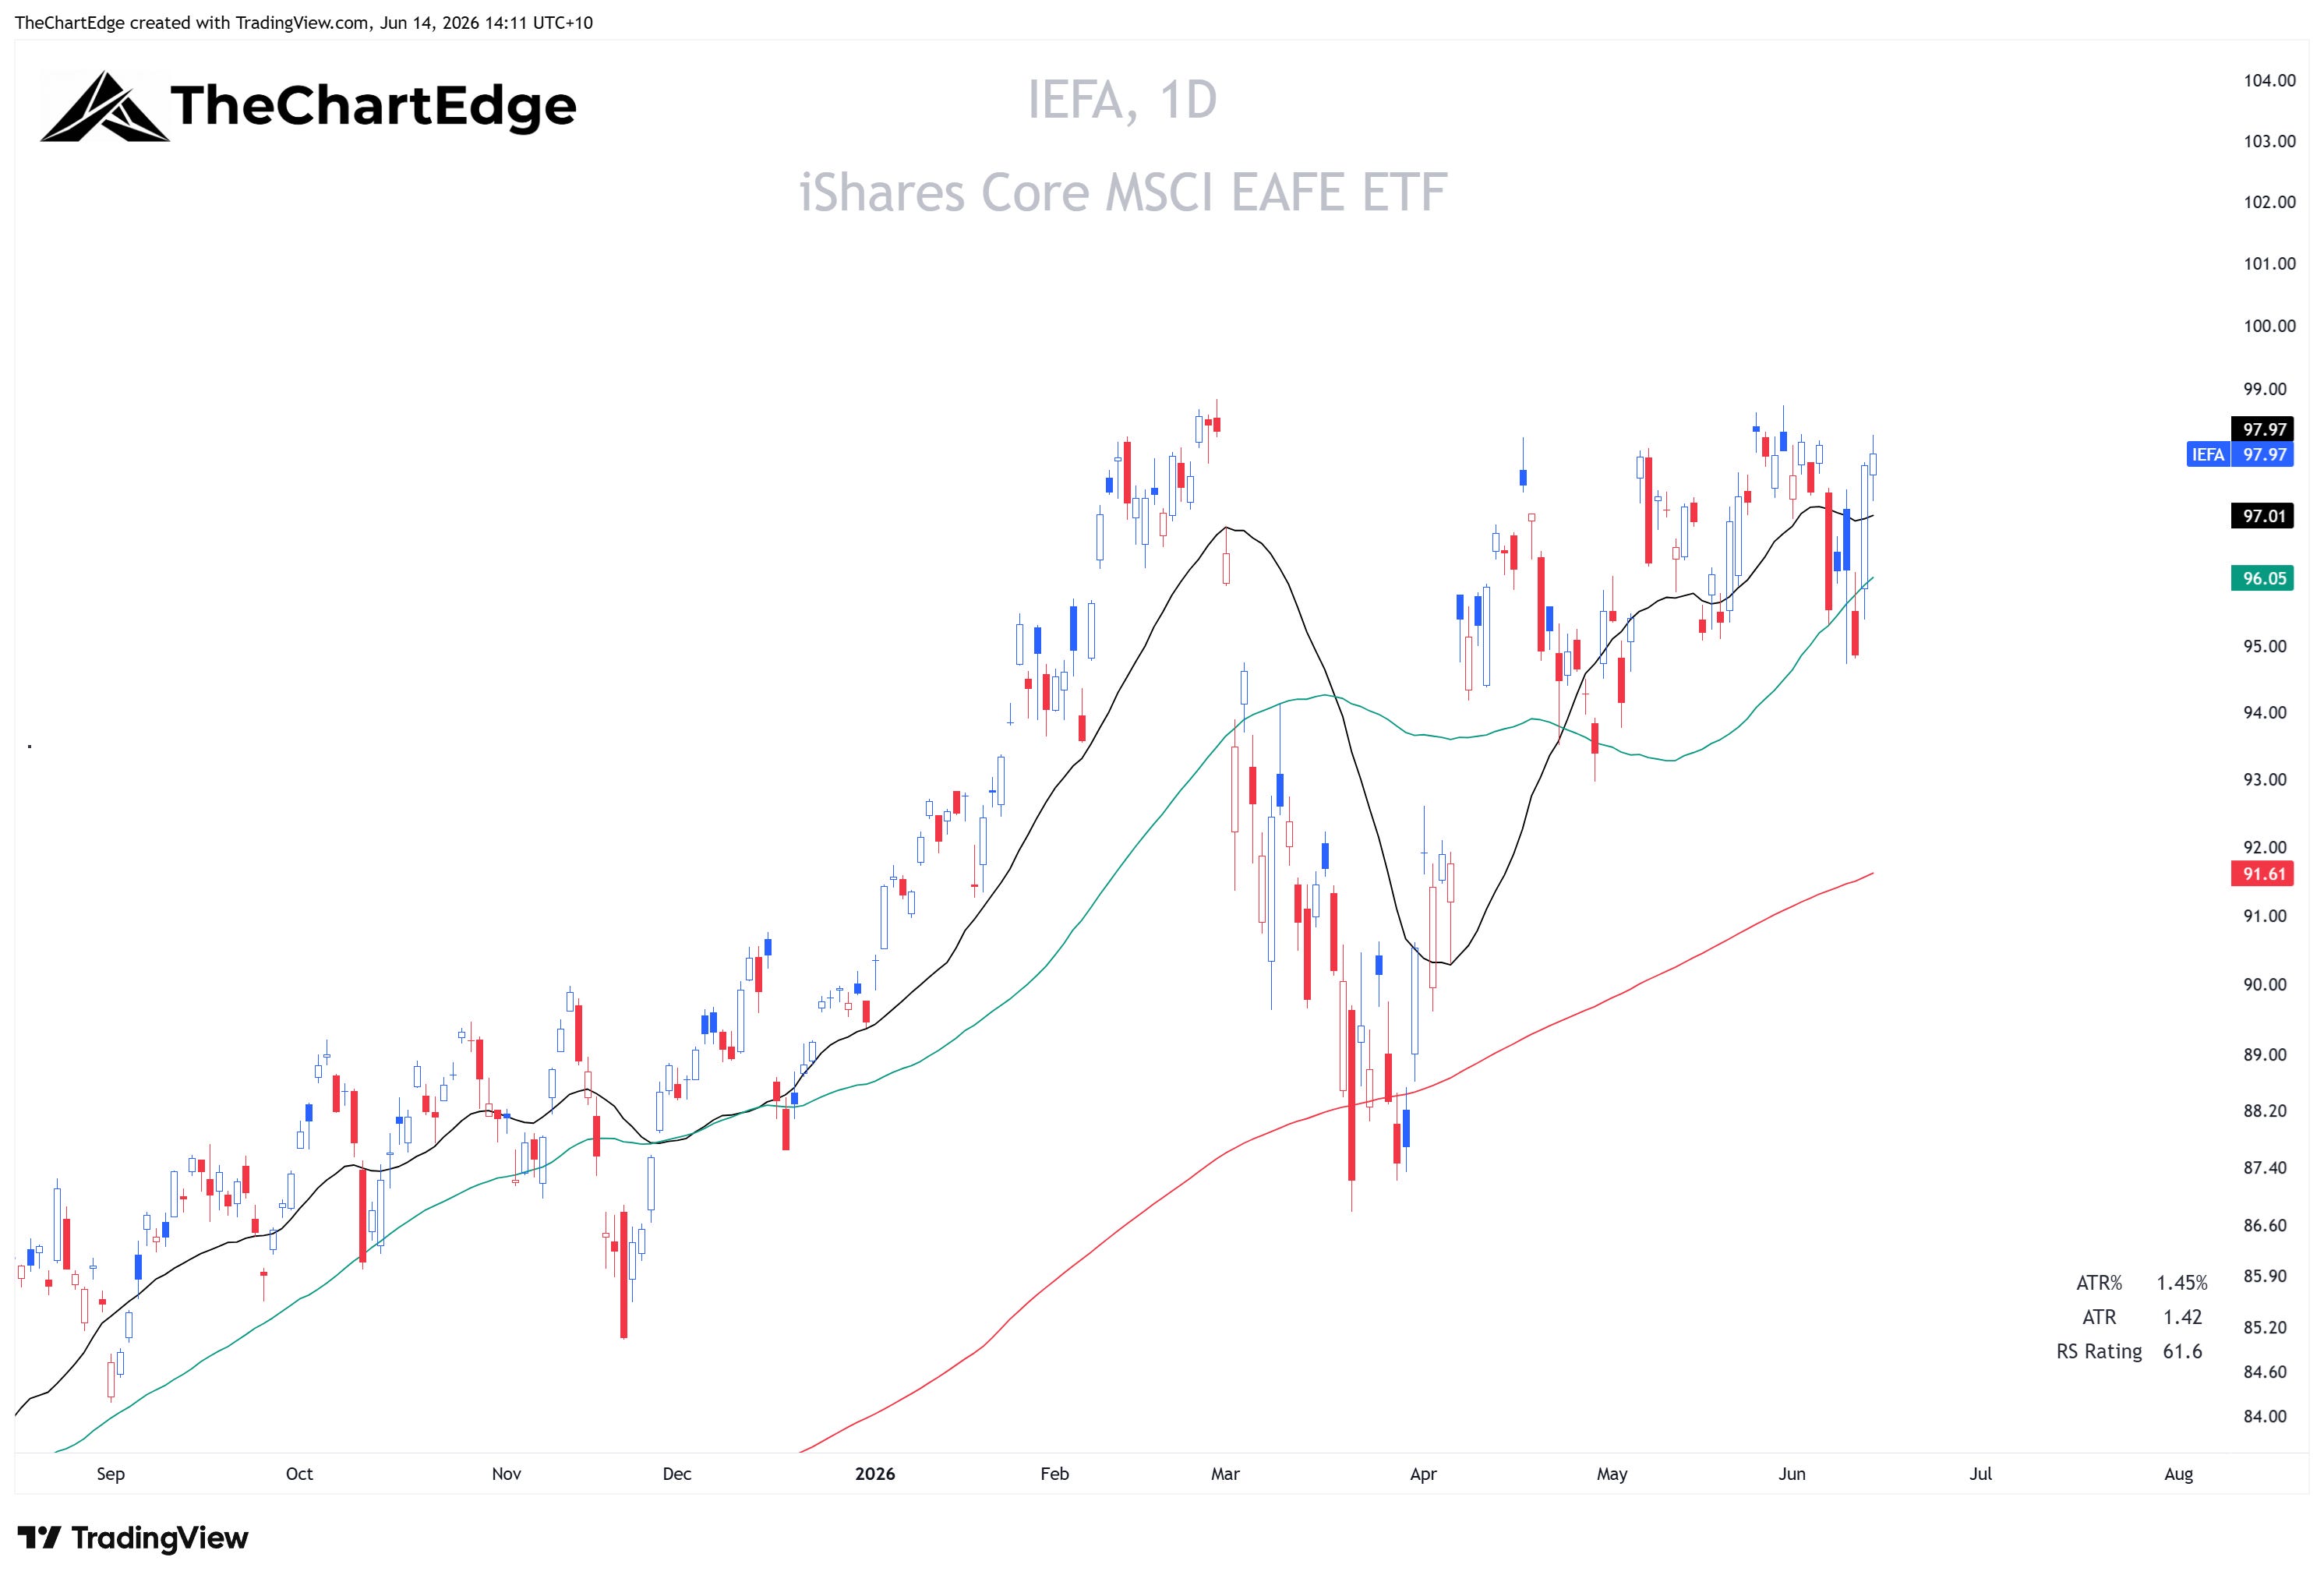
International Developed (IEFA) and Japan (EWJ) are the quiet standouts. IEFA rose 2.5% on the week and Japan 2.2%, leaving IEFA within 1% of its all-time high and Japan within 2%, both in Strong Uptrends. Japan has moved up into Leading and IEFA into Improving.
IEFA Chart
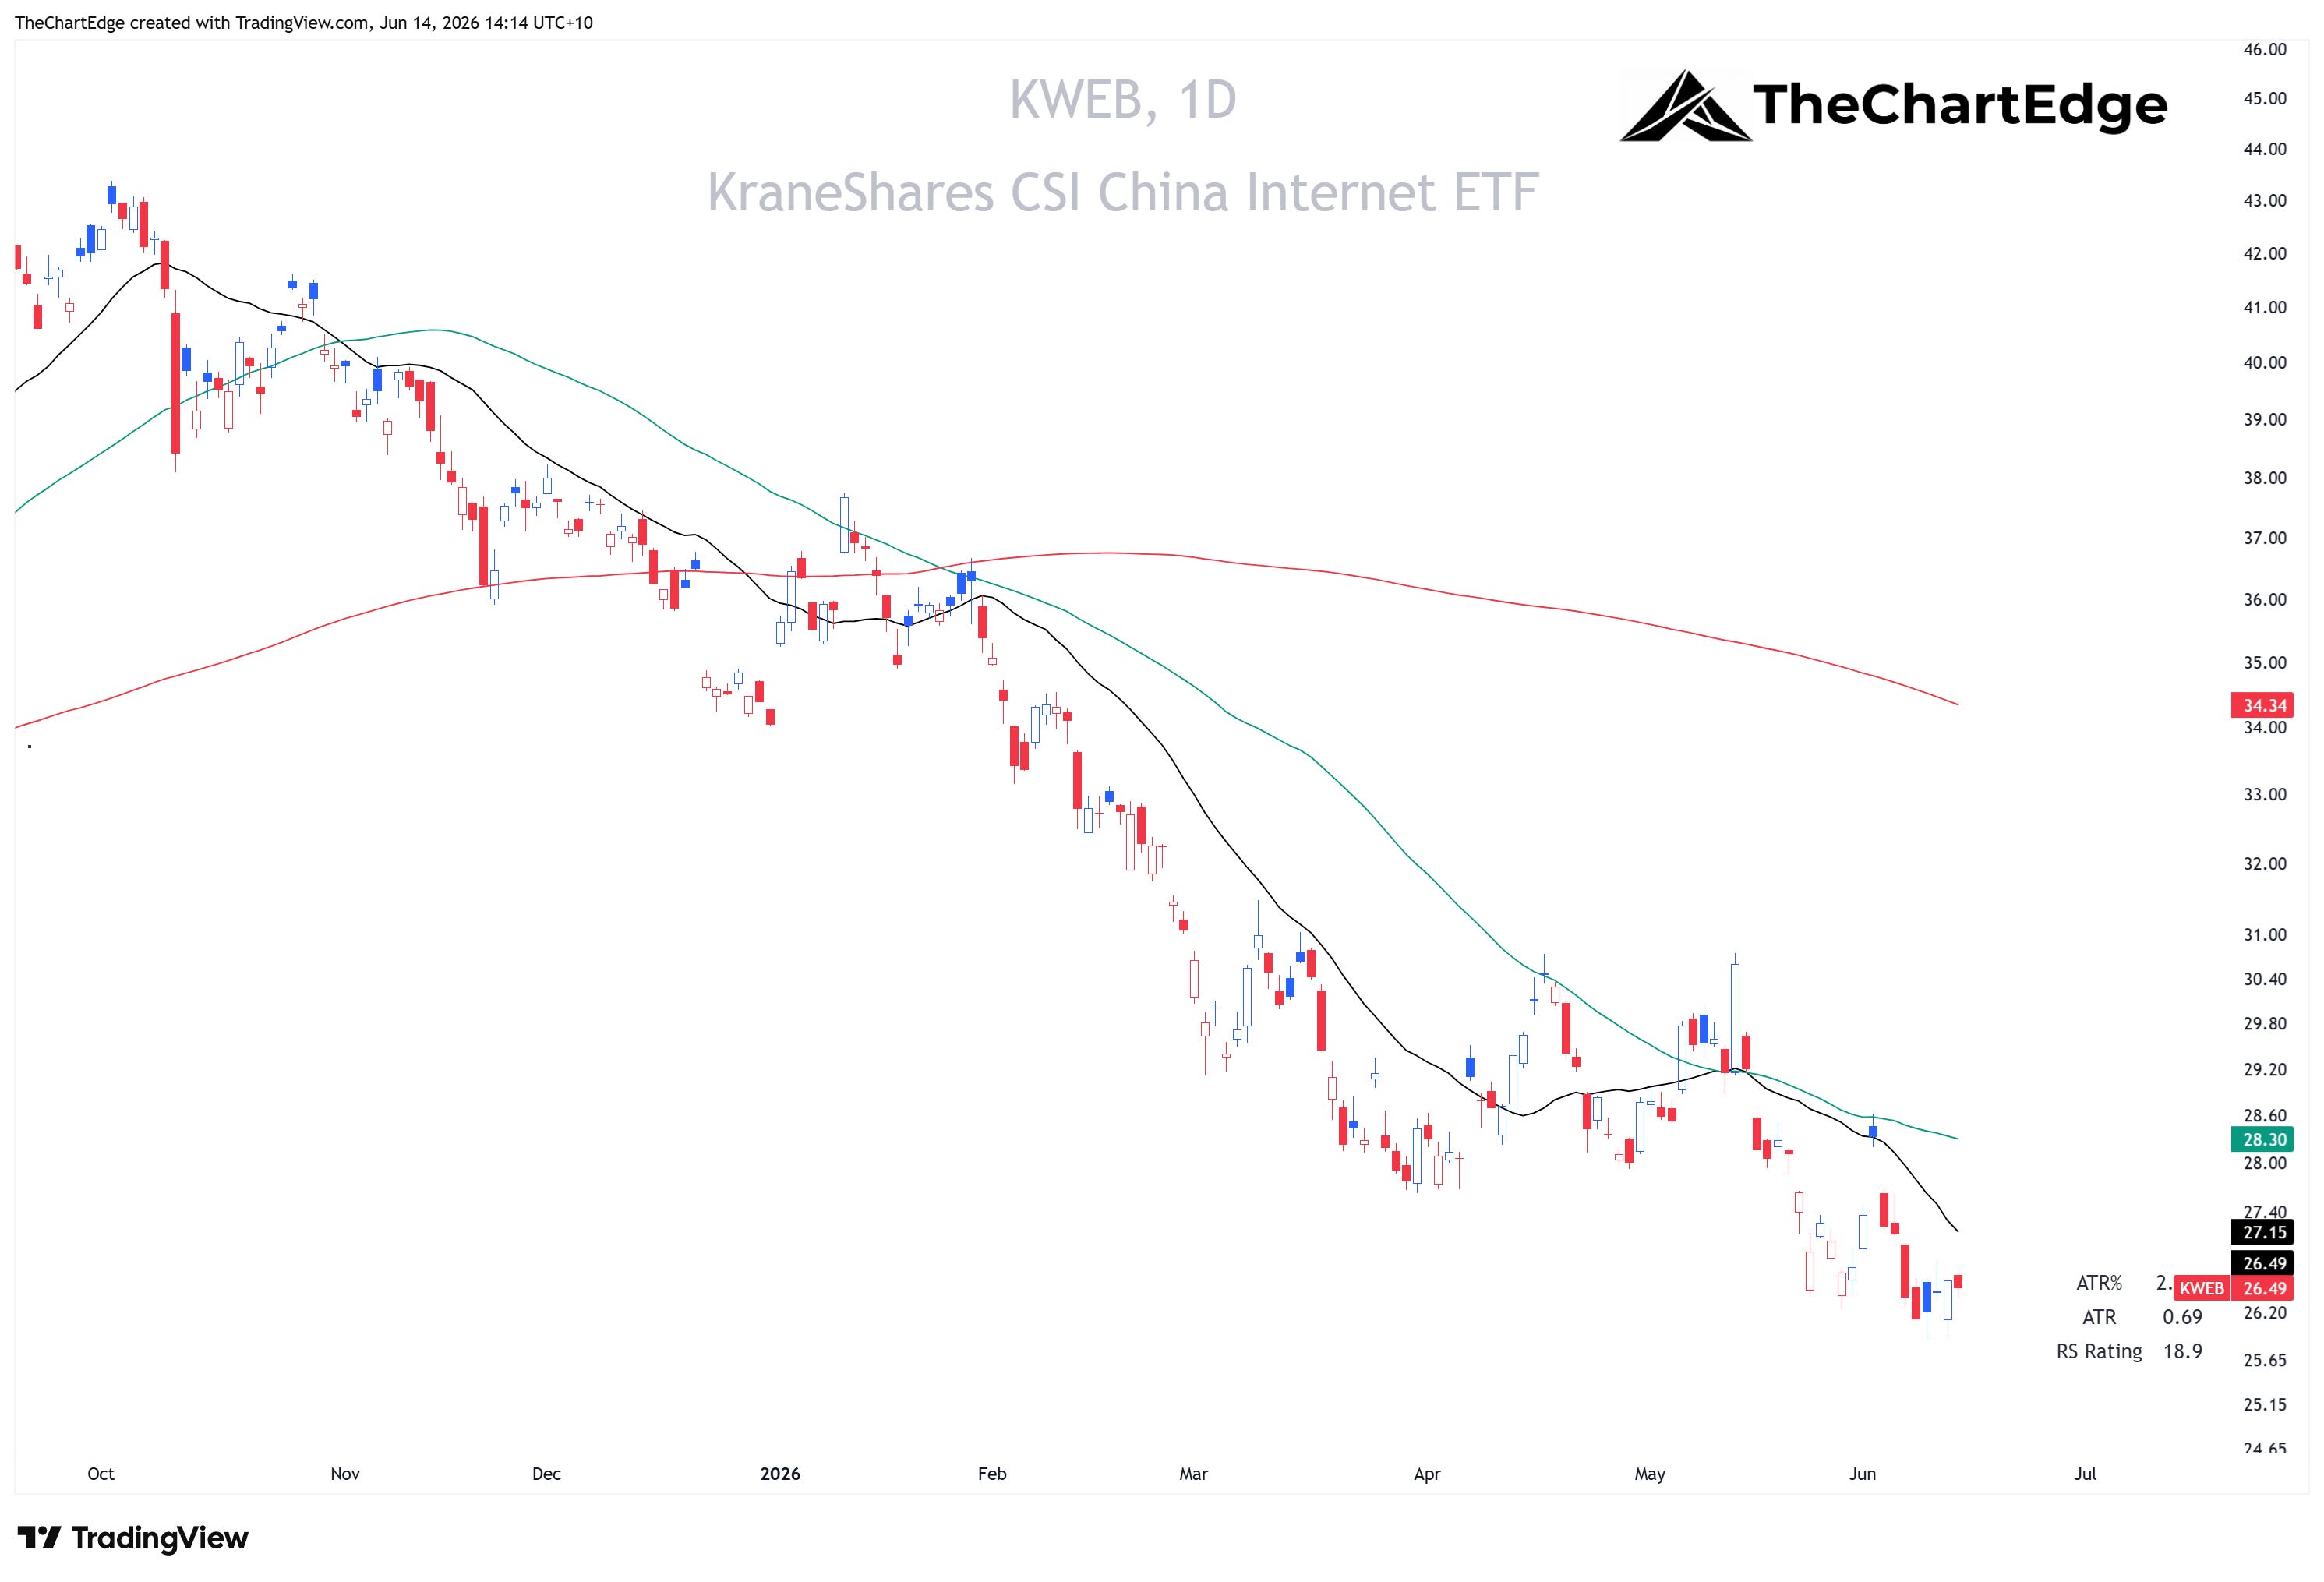
On the flip side, China Large-Cap (FXI) and China Internet (KWEB) were up 1.6% and 0.4% on the week but are both in Strong Downtrends and Lagging - down 10% and 25% year-to-date and sitting 52% and 75% below their all-time highs. Hong Kong (EWH) was up less than 1% on the week and has held up better over longer time frames - up just over 1% year-to-date - but it is still Lagging and in a Downtrend.
KWEB Chart
Mixed Messages
Strength returned broadly across parts of AI, semiconductors, small caps, cyclicals and international markets. Internals expanded; Leading quadrant names went from 15 to 35, Weakening dropped from 31 to 20.
However, staples and value both outperformed, while mega-caps lagged. The SPY and QQQ are yet to reclaim their 20-day SMAs. I will be watching the futures when they open and want to see these indices reclaim this moving average before entering too many new positions. Later today I will put out a post with my trading plan for the week ahead, featuring some of the top stocks on my watchlist. They all held up well during the pullback and are consolidating near or already making new all-time highs.
Stay open-minded and manage risk carefully.
Cheers,
Marcus Grant, CFTe
Disclaimer: The content provided in this newsletter is for informational and educational purposes only and should not be considered as financial, investment, or legal advice. The information shared is based on our research and analysis, but we are not a licensed financial advisor, nor can we guarantee its accuracy, completeness, or timeliness. Market conditions and financial instruments can change rapidly, and any opinions expressed may not be suitable for all investors. Any opinions expressed and or securities mentioned do not constitute a recommendation to buy, sell, or hold that or any other security. You should conduct your own due diligence and consult with a licensed financial advisor or other professional before making any investment decisions. Past performance is not indicative of future results, and all investments carry the risk of loss. The authors and publishers of this newsletter are not responsible for any financial decisions made based on the content provided herein. By reading and or subscribing to this newsletter, you acknowledge and agree that you are using the information at your own risk.