


Everything below is as of Friday August 14 close.
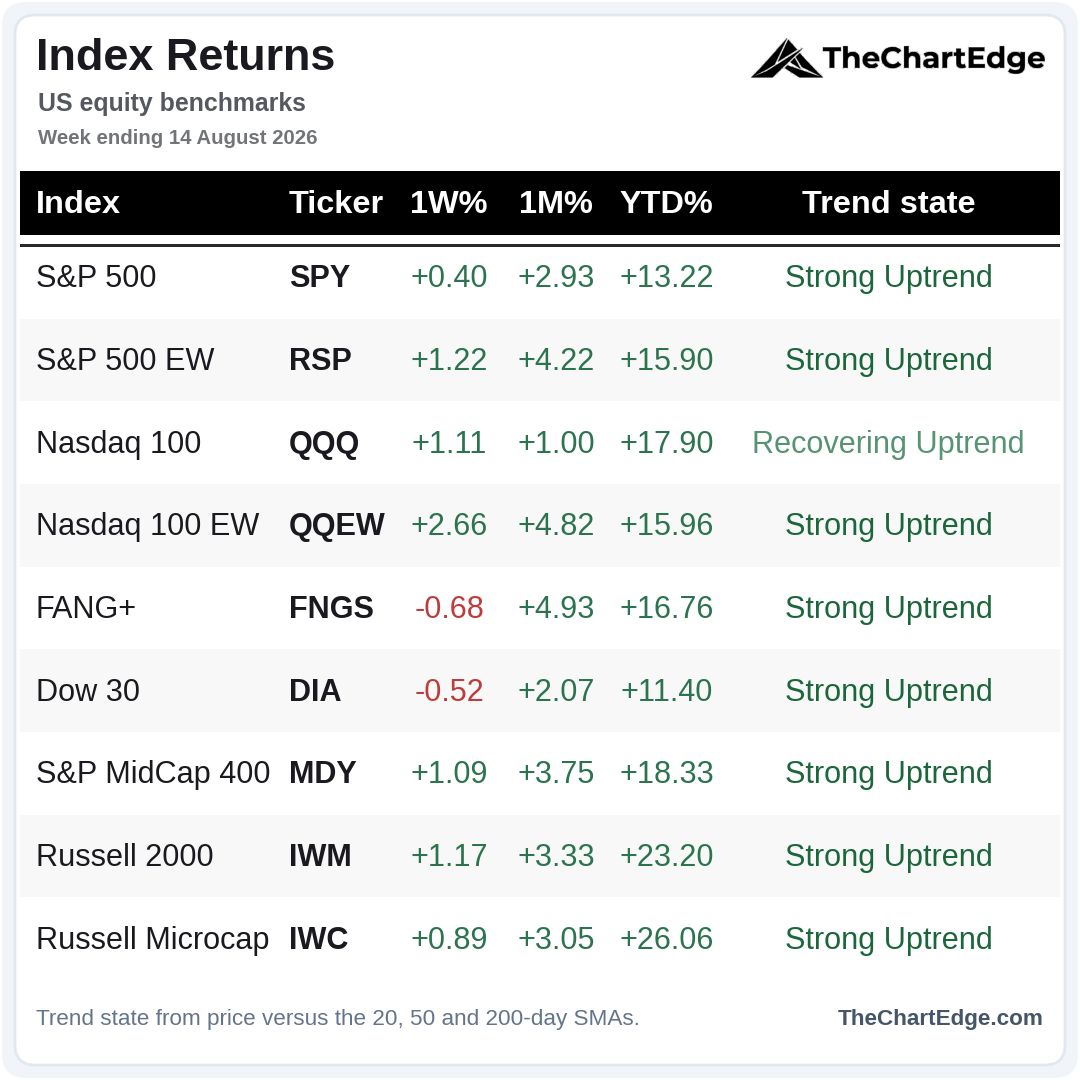
Of the major indices I track, only FANG+ and the Dow finished the week lower. 6 of the 9 made their highest weekly closes ever - SPY, both equal-weights (RSP & QQEW), mid caps (MDY), small caps (IWM) and micro caps (IWC). The outperformance of the equal-weight indices, along with the small and mid caps, is one of several data points showing a broadening out in participation.
SPY Chart
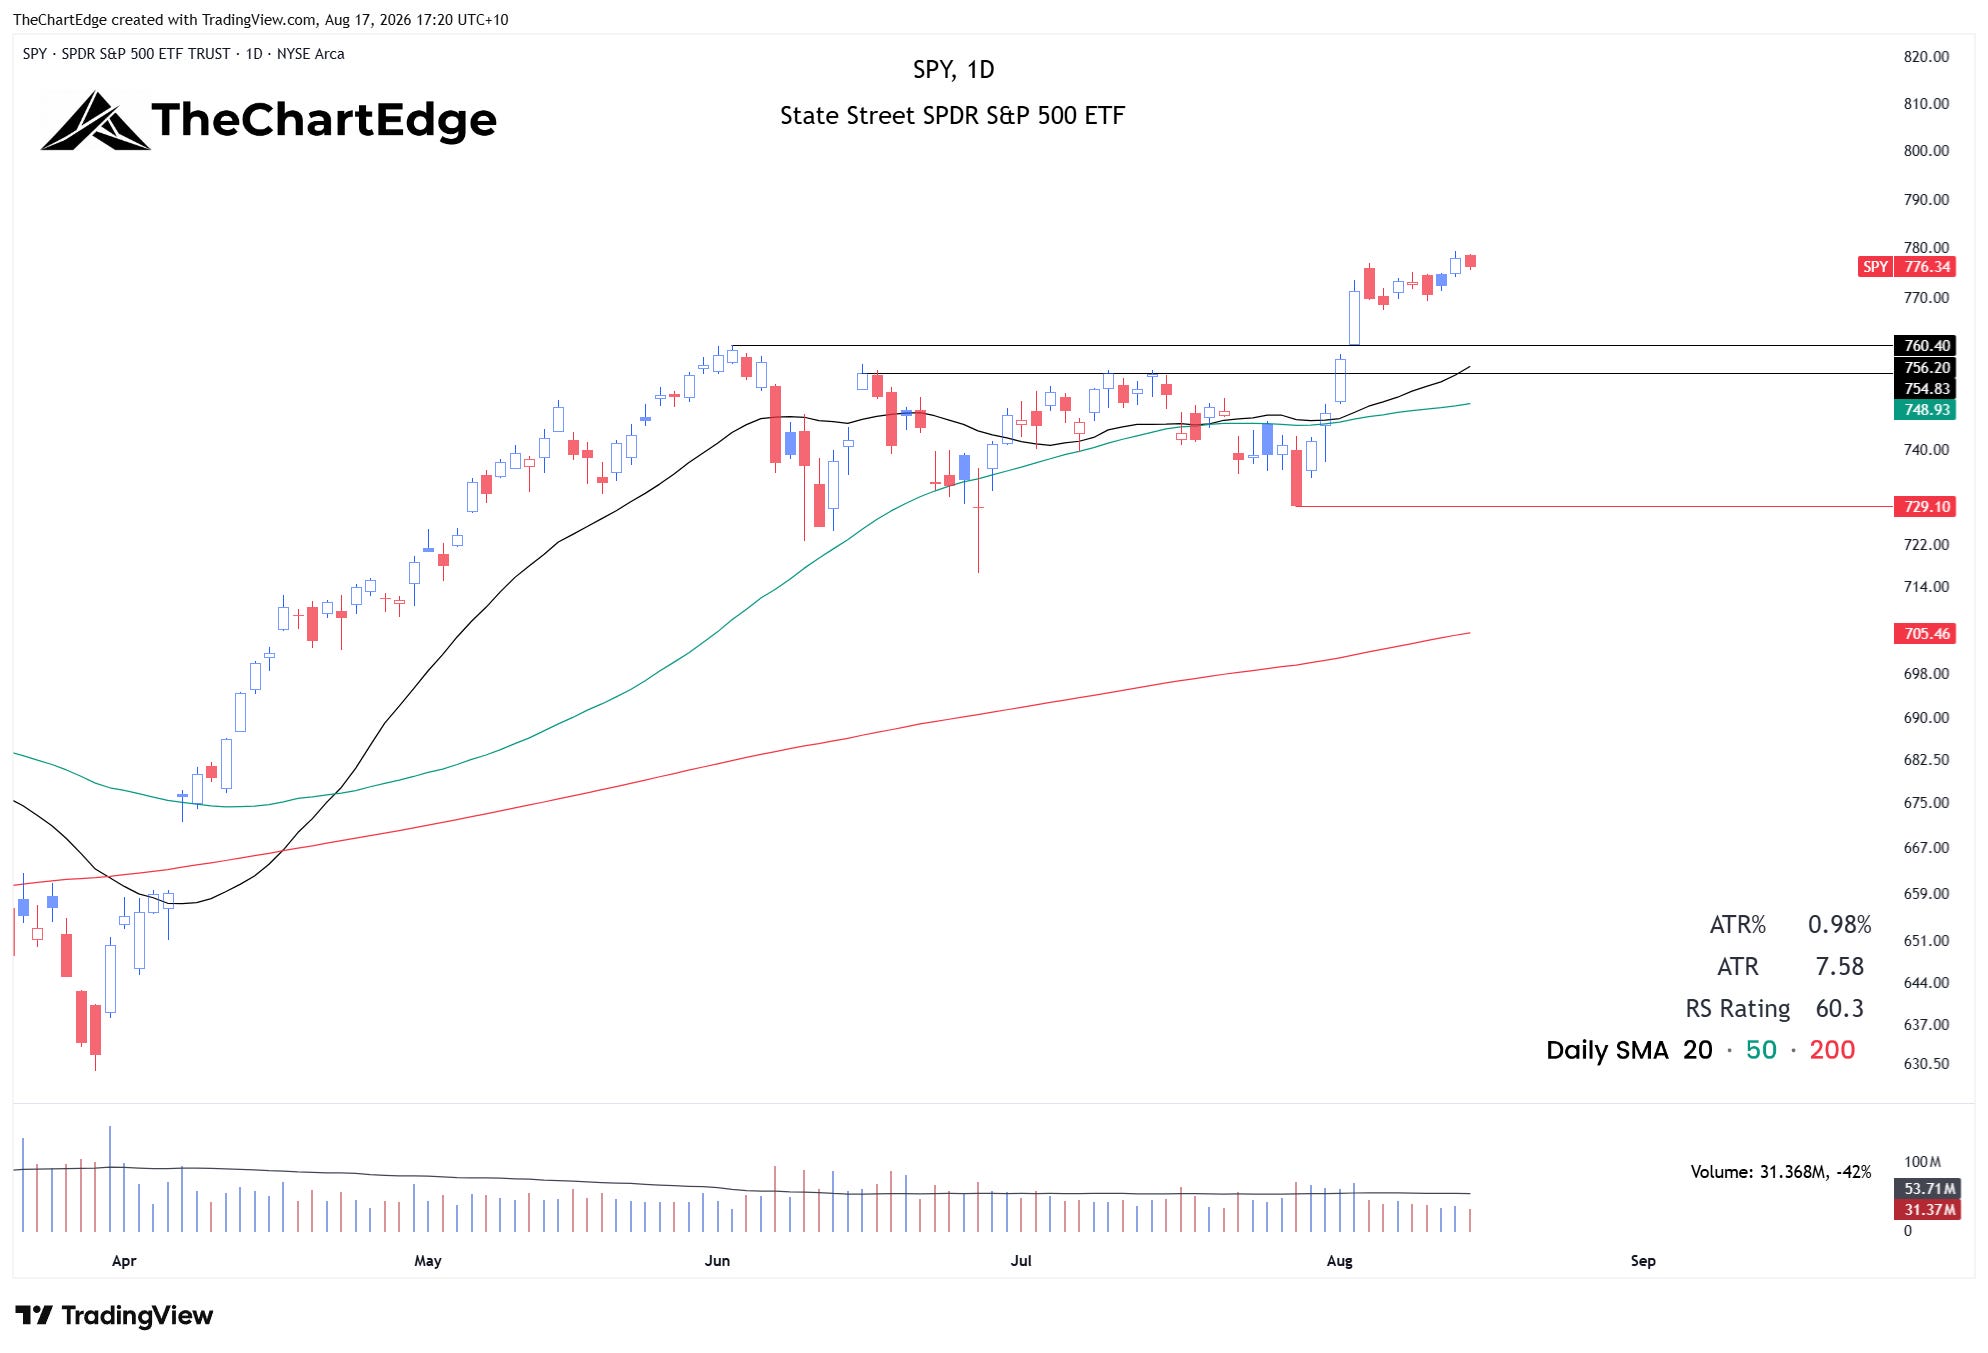
SPY grinded higher throughout the week, despite the underperformance of mega-caps generally. We didn’t get the pullback I was hoping for, but I will remain patient, looking for a lower risk entry. An orderly pullback to 755-760 that finds support and bounces remains the ideal scenario for new longs in my opinion.
QQQ Chart
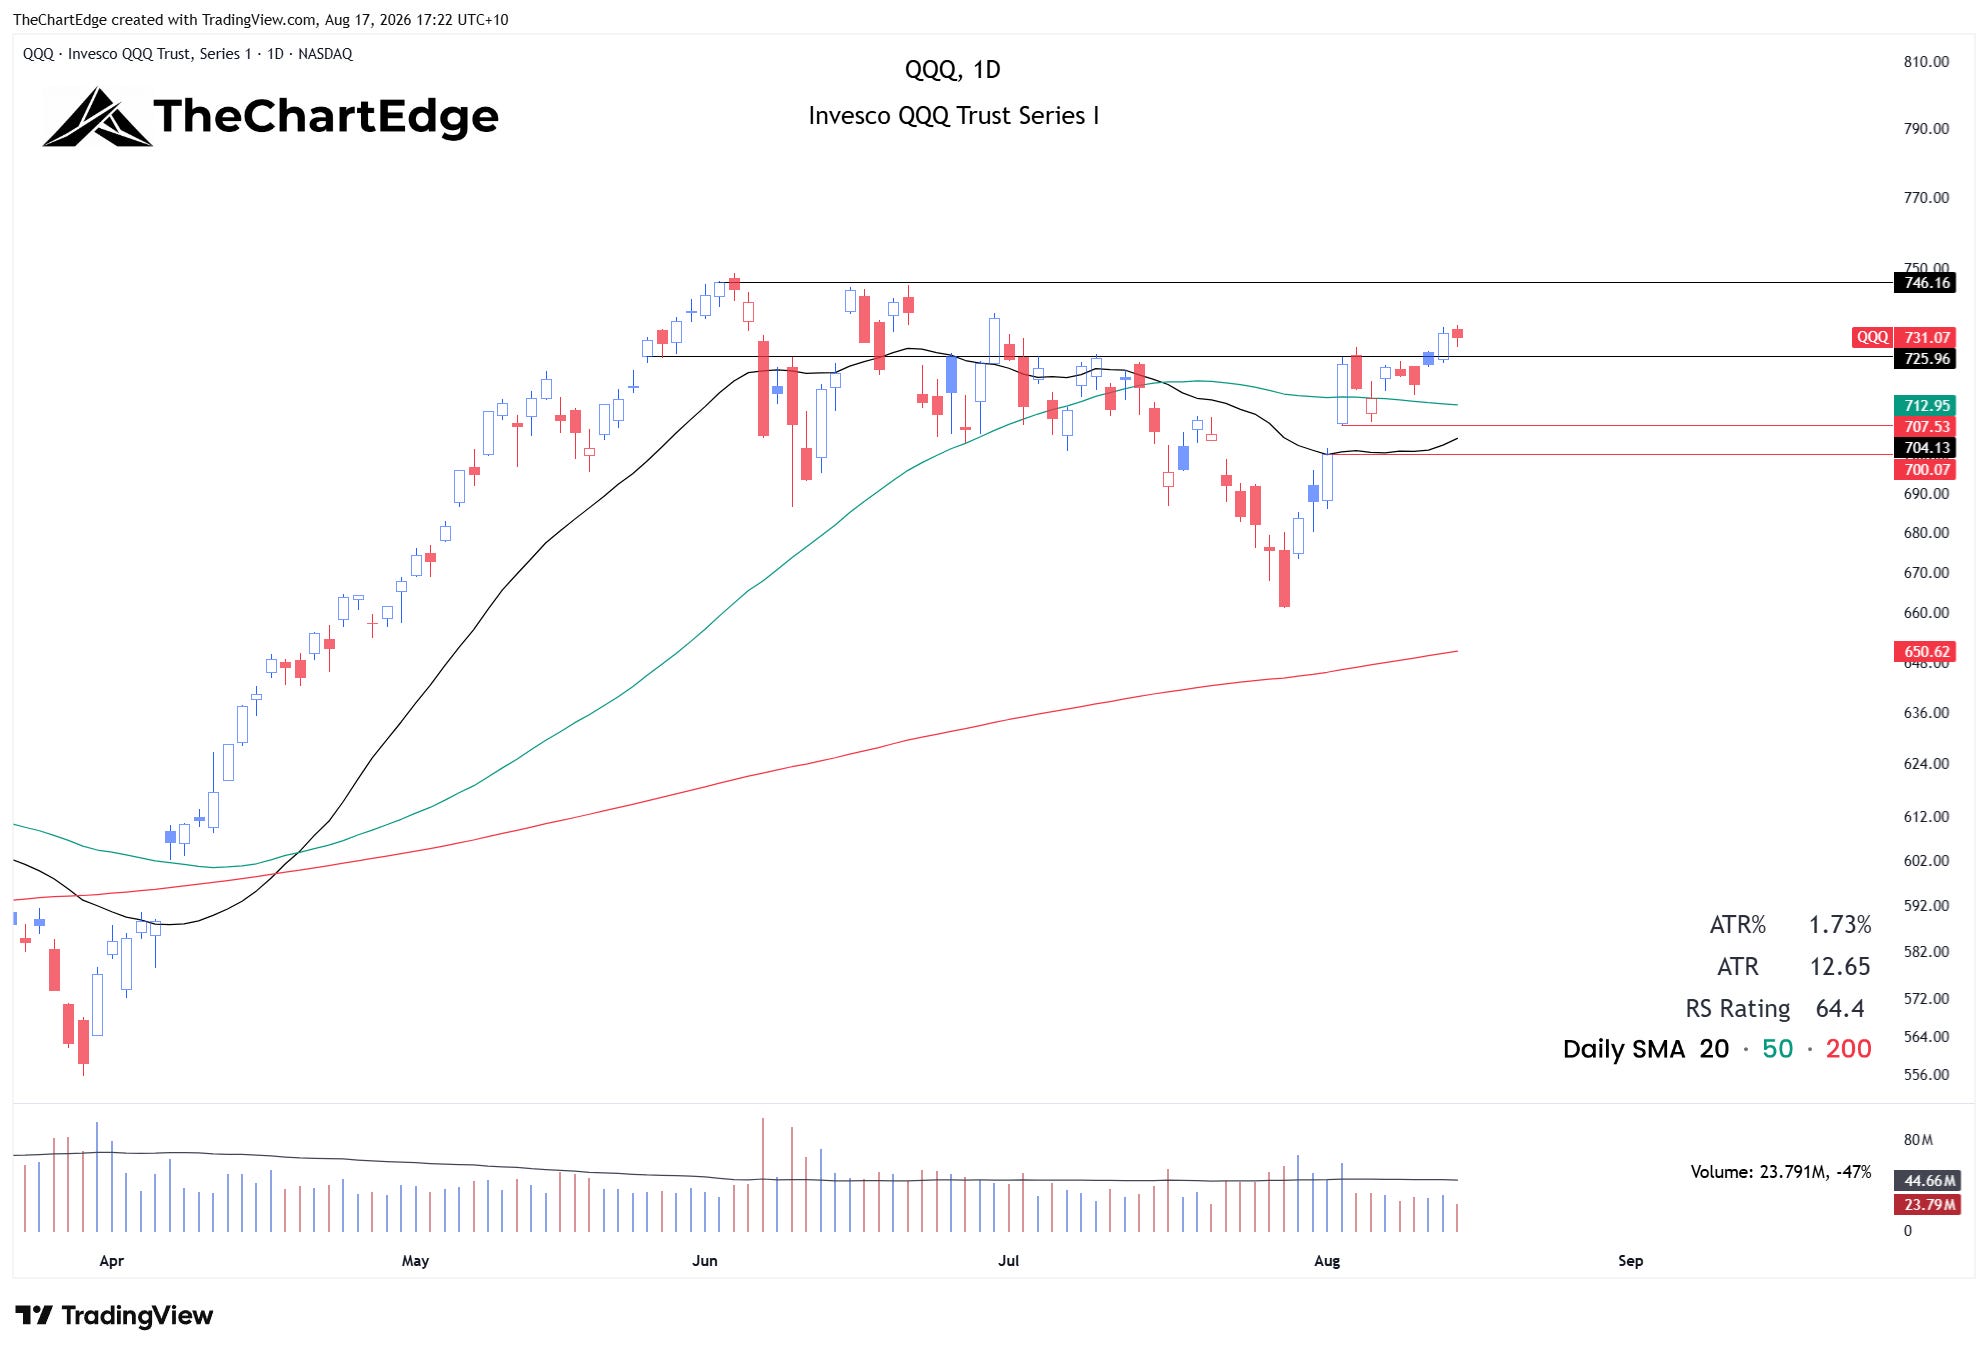
QQQ cleared the 726 level I was watching and closed at 731, which is about 2.0% below the June high around 746. I would be less inclined to buy a pullback in QQQ, with its 20 and 50-day SMAs not yet bullishly aligned. Further strength towards 746 and a consolidation that forms a handle, or a tight area under the ATHs - letting the SMAs catch up to price and the 20-day to cross above the 50-day, would provide an excellent new low risk entry, if it were to then break out to new highs.
Market Temperature
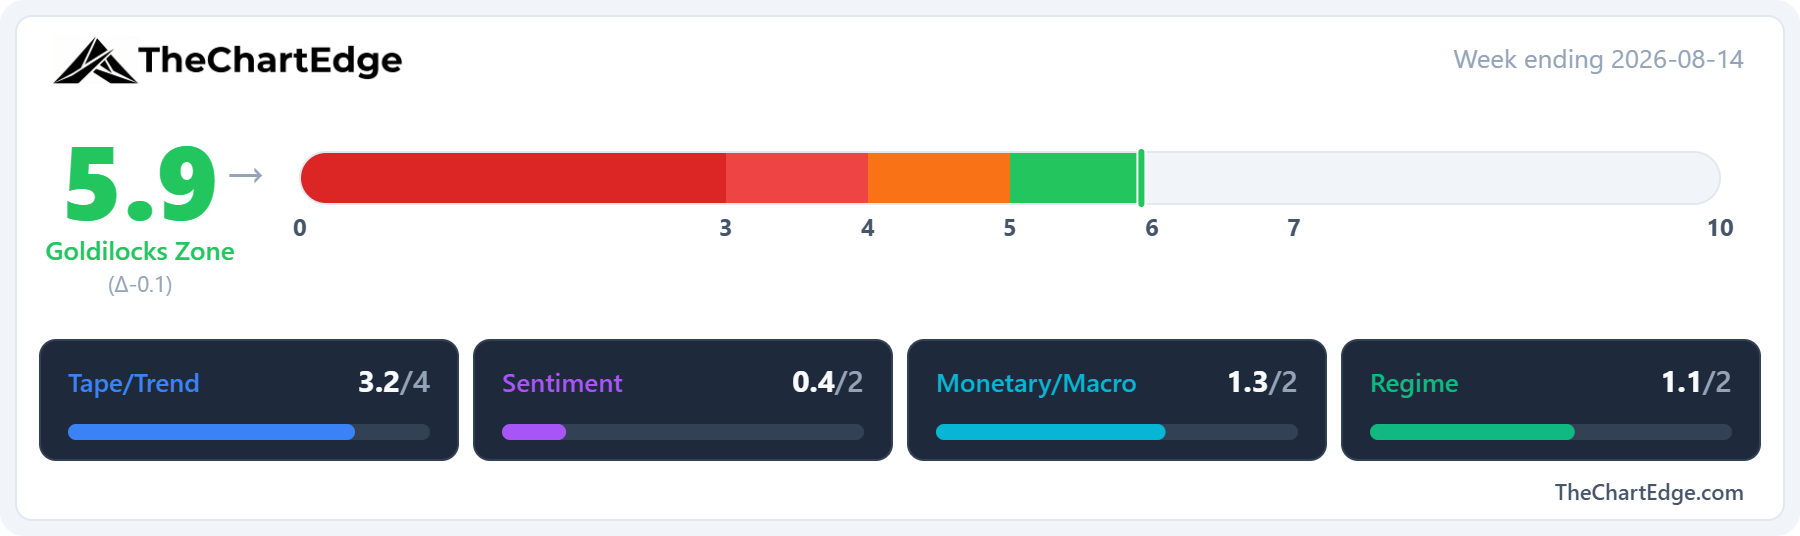
The Market Temperature came in at 5.9, down from 6.0, a second straight week in the Goldilocks Zone. Last week’s 6.0 was rounded up from 5.96 and the 5.9 was rounded down from 5.92, so the actual move was just four hundredths.
The Tape/Trend pillar was identical to last week. Breadth improved a touch - 62.6% of US stocks are above their 50-day moving average, from 61.4% - offset by a slightly lower RSI score - the RSI itself rose week-on-week but scored lower due to the model’s two-week lookback window.
The Monetary/Macro pillar firmed slightly, with the MOVE index easing further and the dollar drifting sideways in a range.
Regime was unchanged, with growth vs value still scoring in value’s favour.
The VIX fell again, to 14.3 from 14.9, which the model reads as a contrarian negative, so Sentiment was again the only pillar to fall (to one decimal place in the graphic it was steady at 0.4, but the raw score went from 0.42 to 0.35).
GICS Sector Relative Strength
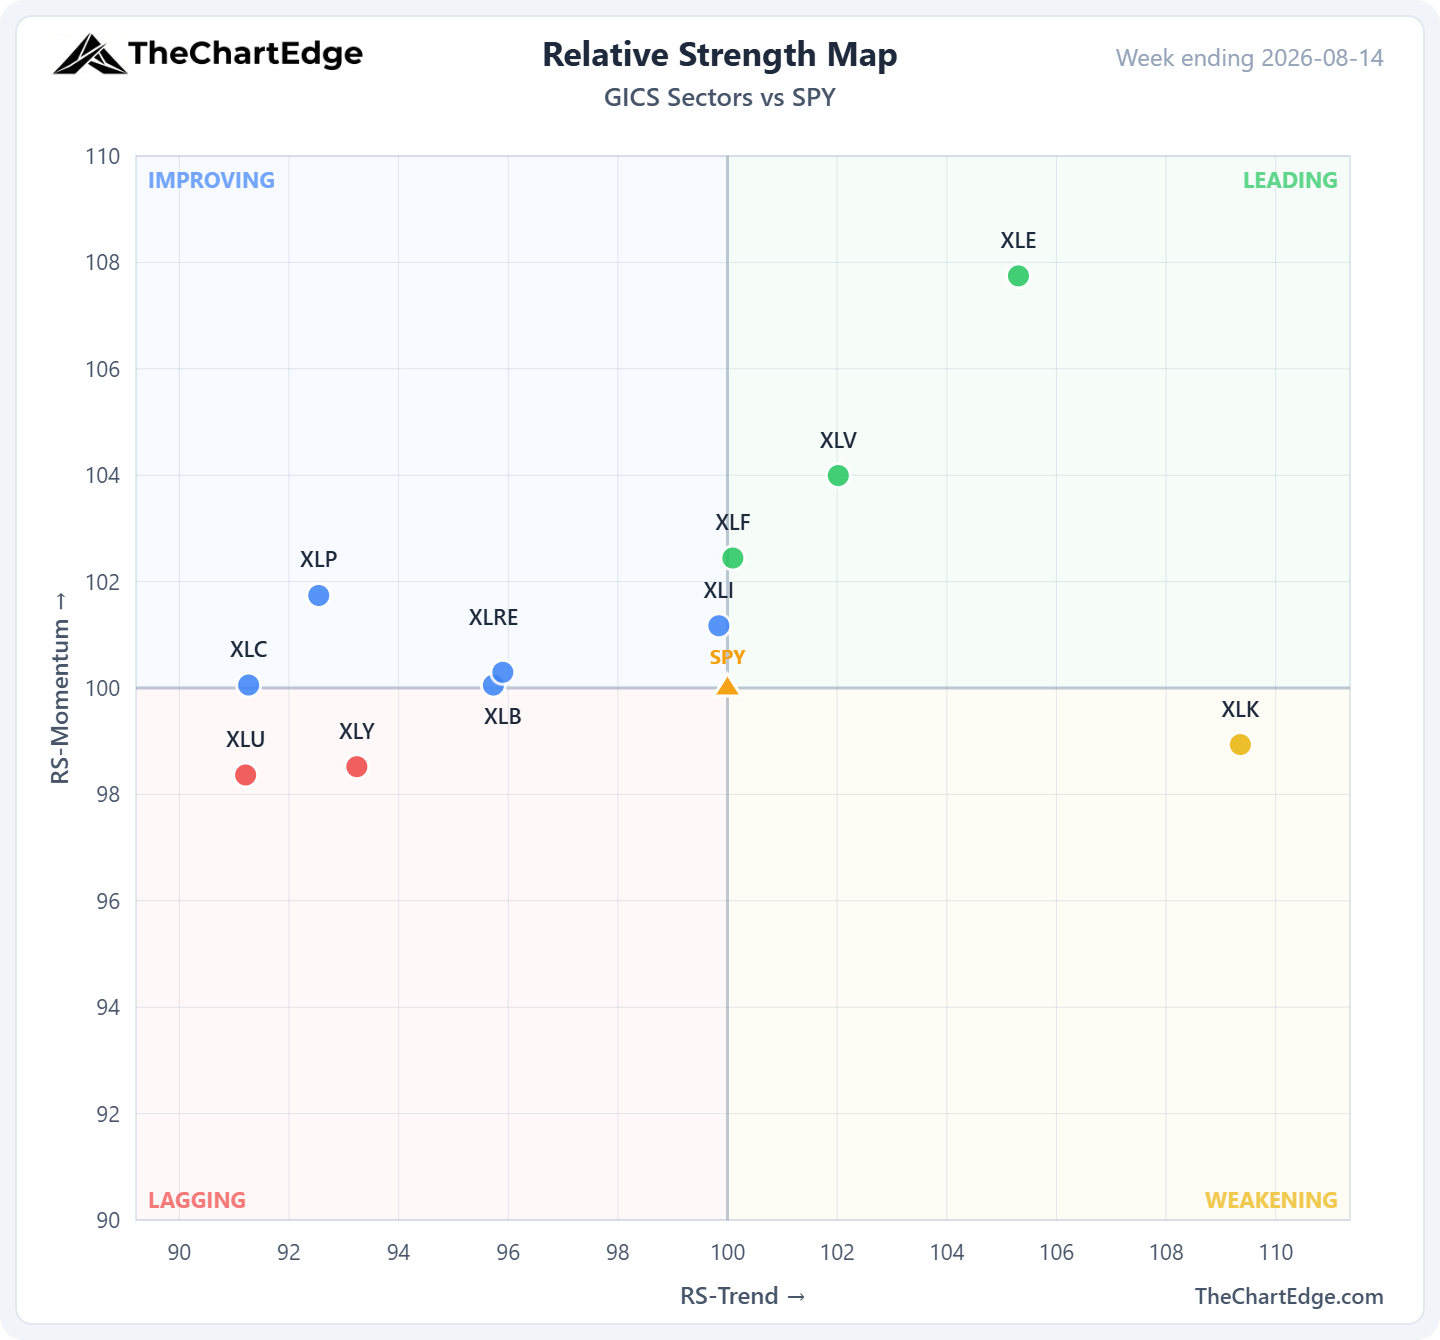
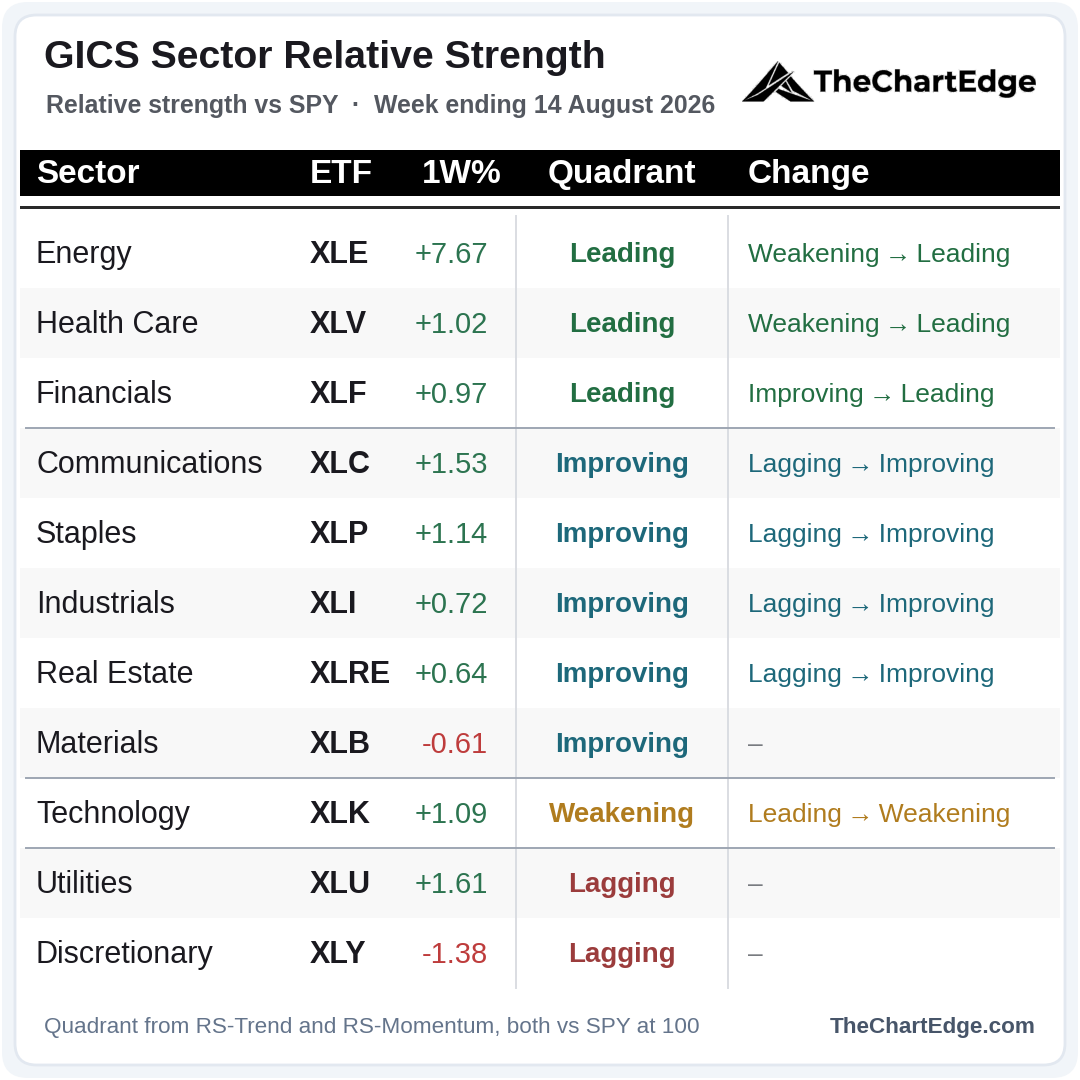
Energy and healthcare moved back into Leading after just one week in Weakening, and financials joined them. Technology fell out of Leading into Weakening after one week.
As I wrote last week, a lot of sectors are bunched around the boundary lines, so I wouldn’t read too much into any single crossing - particularly for XLC and XLRE which both sit very close to the RS-Momentum borderline and XLF which sits right on the RS-Trend borderline.
9 of the 11 sectors beat SPY, on a week the index finished higher - a first in the 18 weeks I’ve been tracking this data.
Momentum Leaderboard
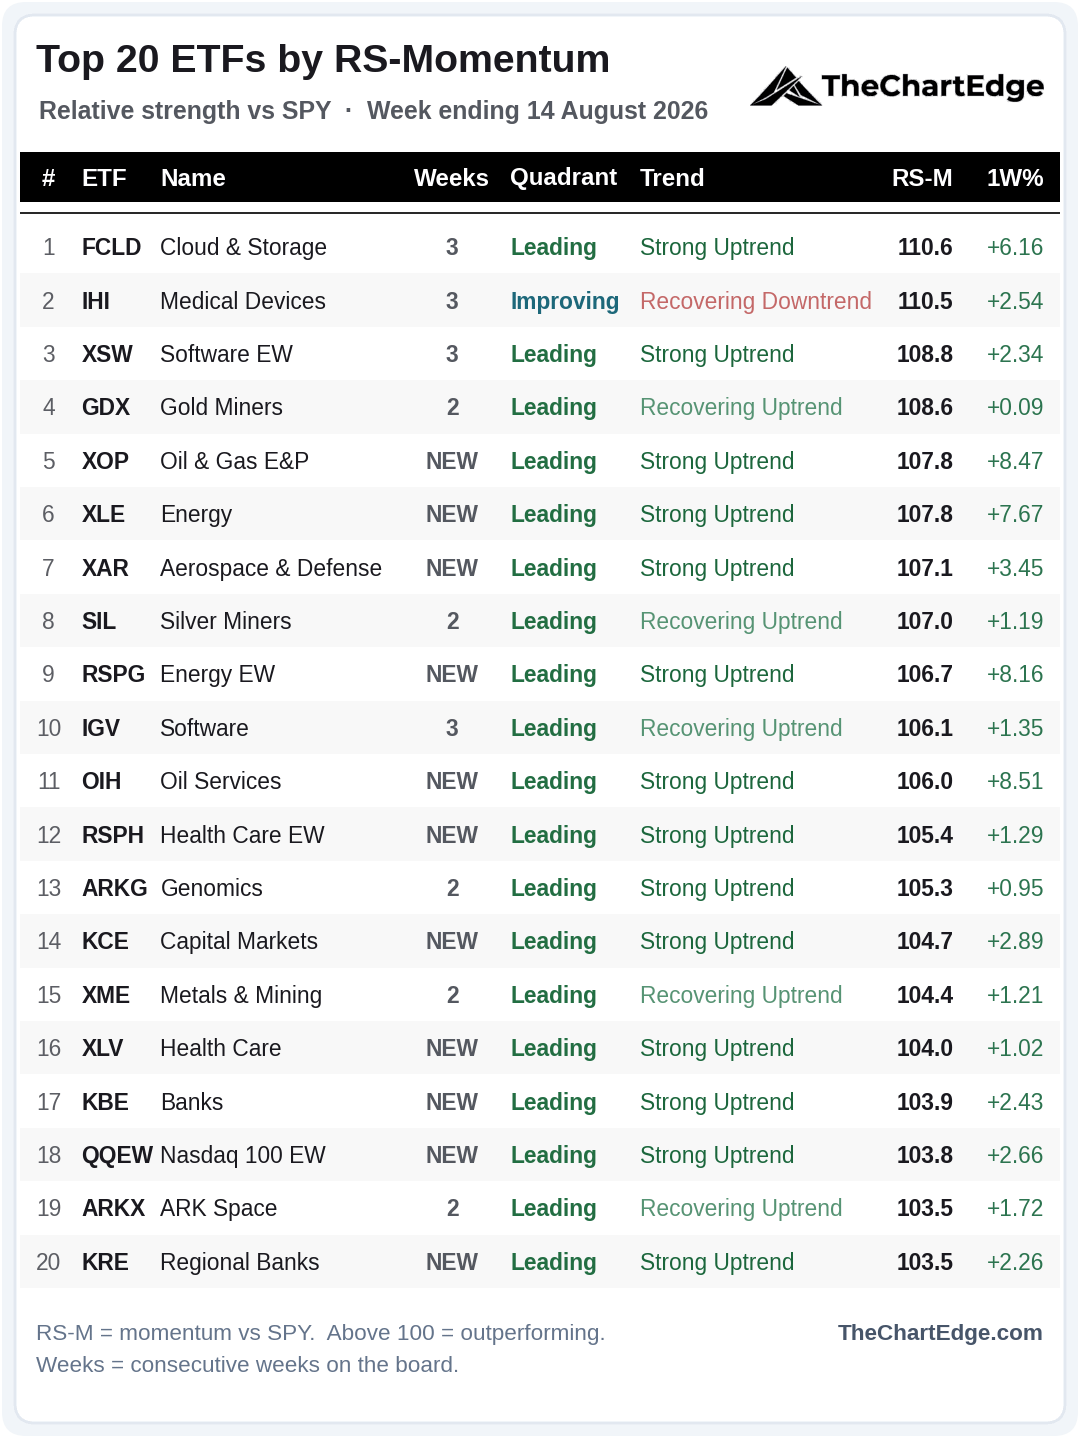
11 of the 20 are new. Energy returned after two weekends off - Oil & Gas E&P (XOP), Energy (XLE), equal-weight energy (RSPG) and Oil Services (OIH) are all back on the board. As are the financials (KBE, KRE and KCE), along with healthcare (XLV and RSPH).
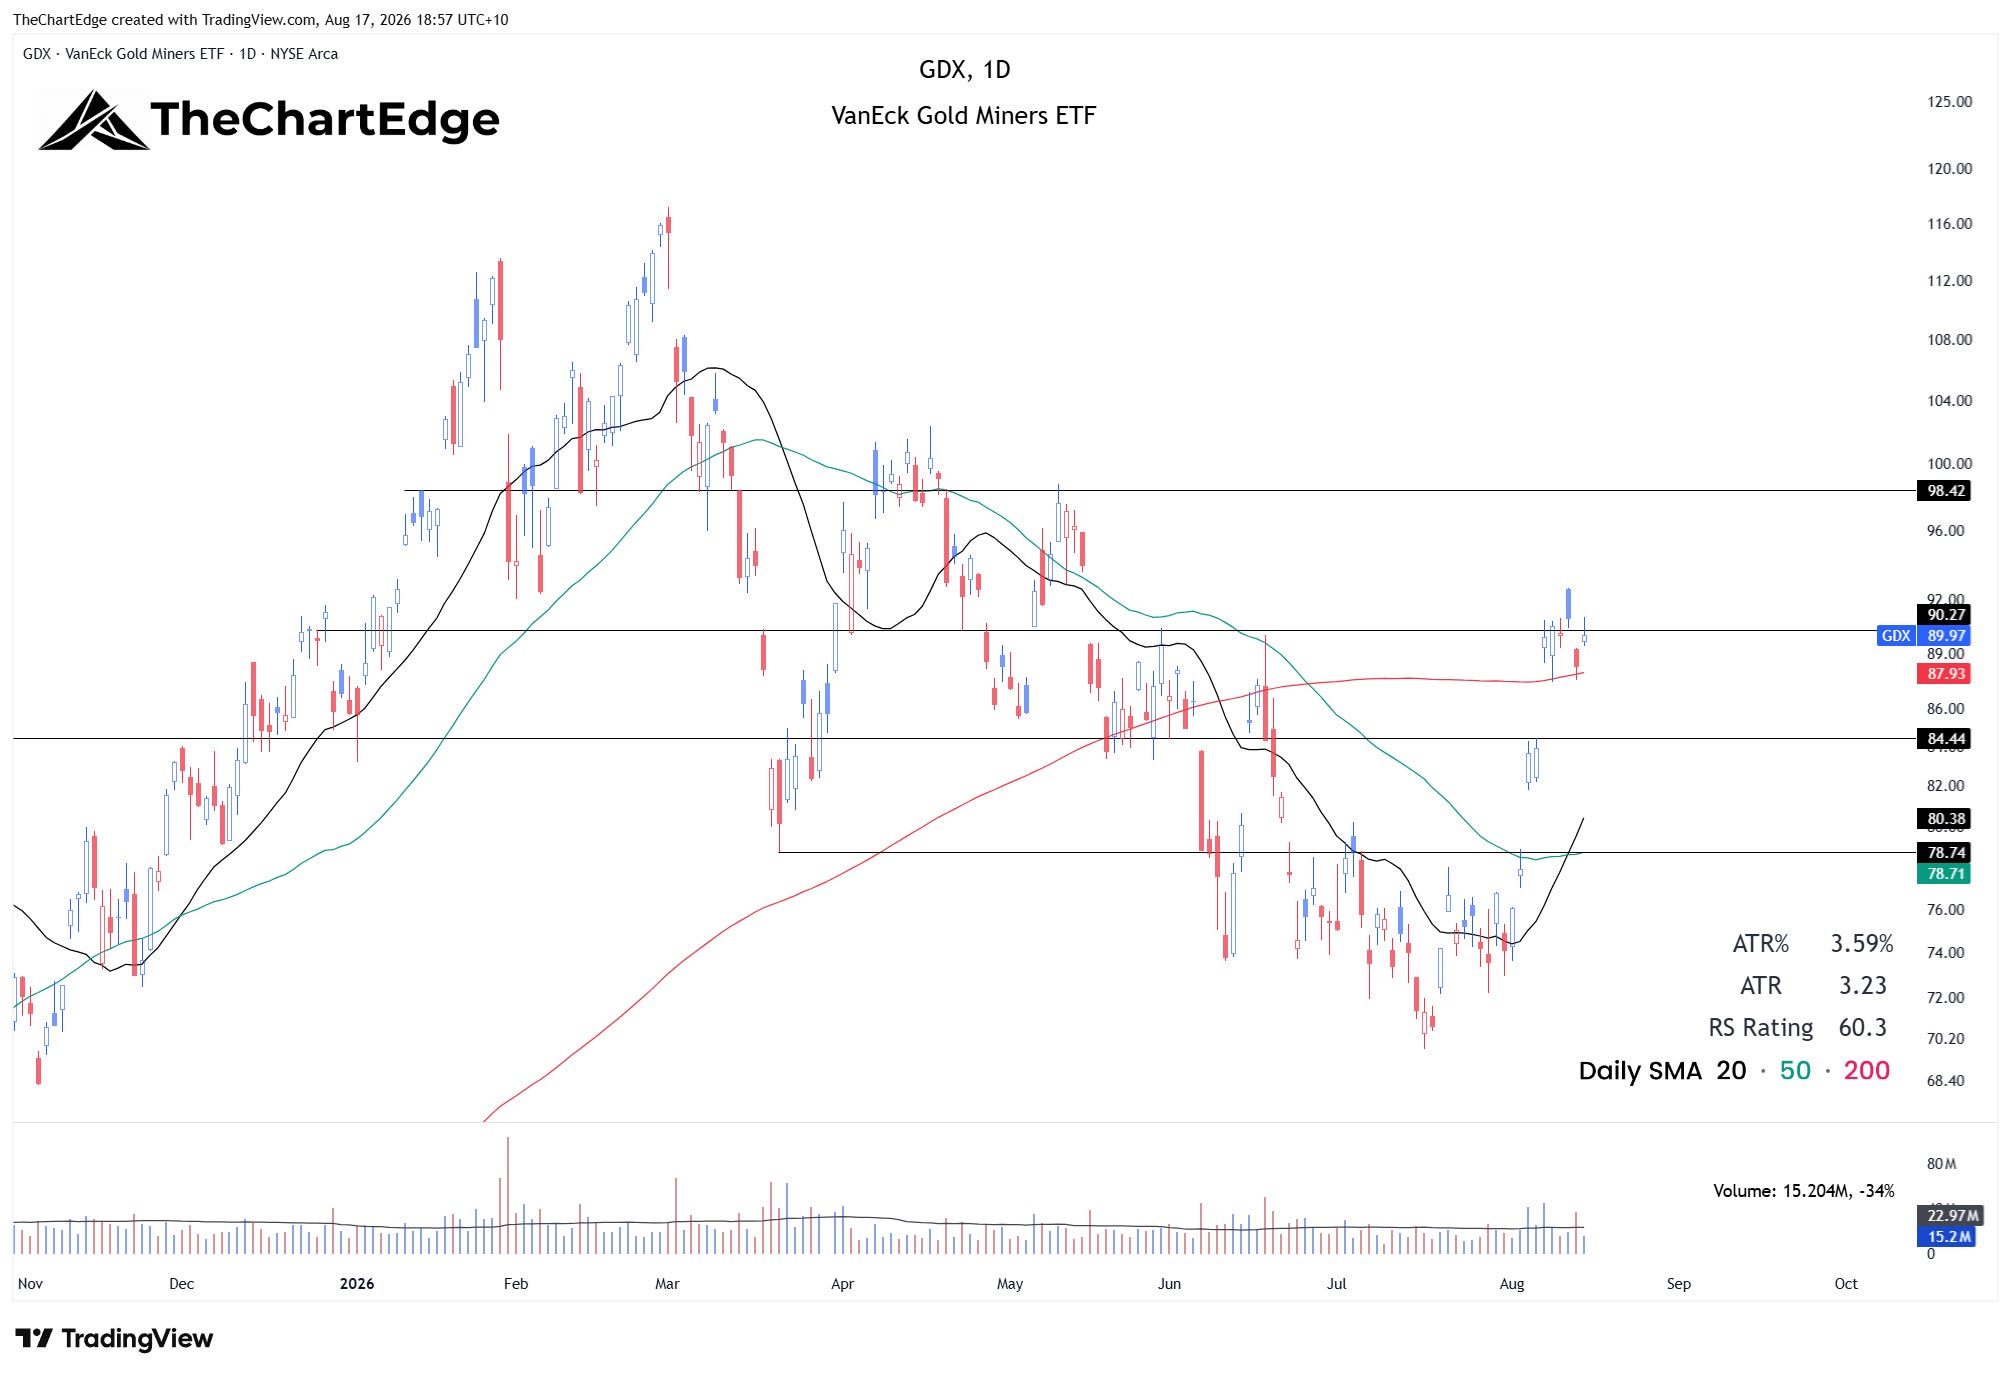
Ethereum (ETHA) dropped off after six straight weekends - it had the longest streak on the board. Gold Miners (GDX) slipped from first to fourth as the miners consolidated their big gains from the prior week.
Medical Devices (IHI) at number two is the only name on the board not in an uptrend state, and 14 of the 20 are in Strong Uptrends. Last weekend only 6 were in Strong Uptrends, with 4 names still in downtrend states.
Trend States Across the Universe
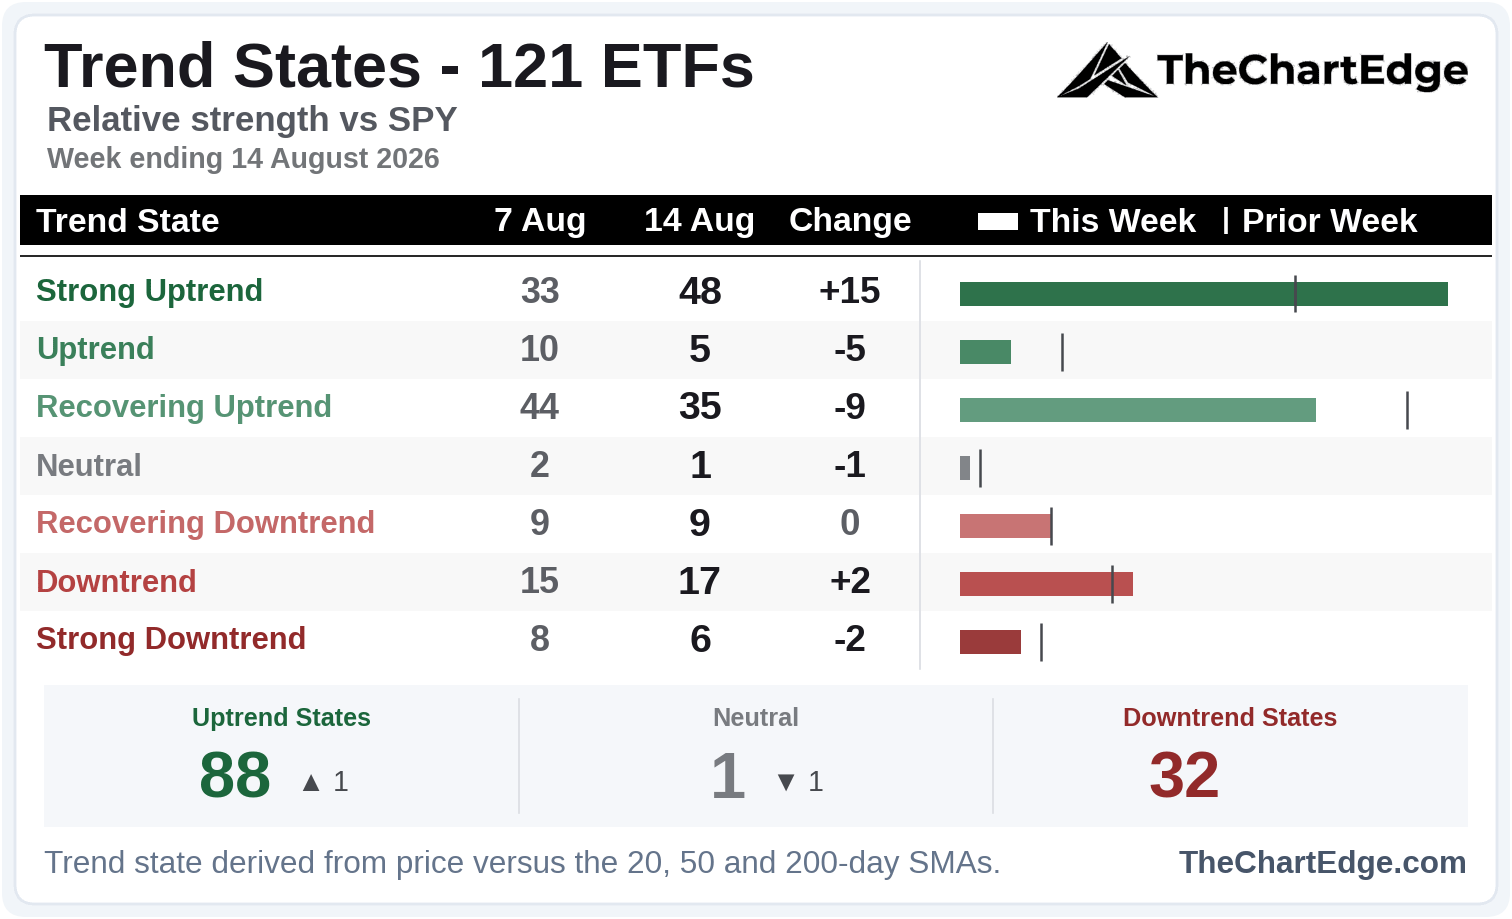
Despite little change at the aggregate level, 17 names moved into Strong Uptrend and only 2 dropped out - with the net effect being 15 more names now in the Strong Uptrend state. It wasn’t just energy names either - the equal-weight Nasdaq, the Nasdaq Next Gen 100, staples, real estate, regional banks, transports and Japan all moved into Strong Uptrend states too. Nearly 40% of the 121 ETF universe are now in the Strong Uptrend state.
Industry Breadth
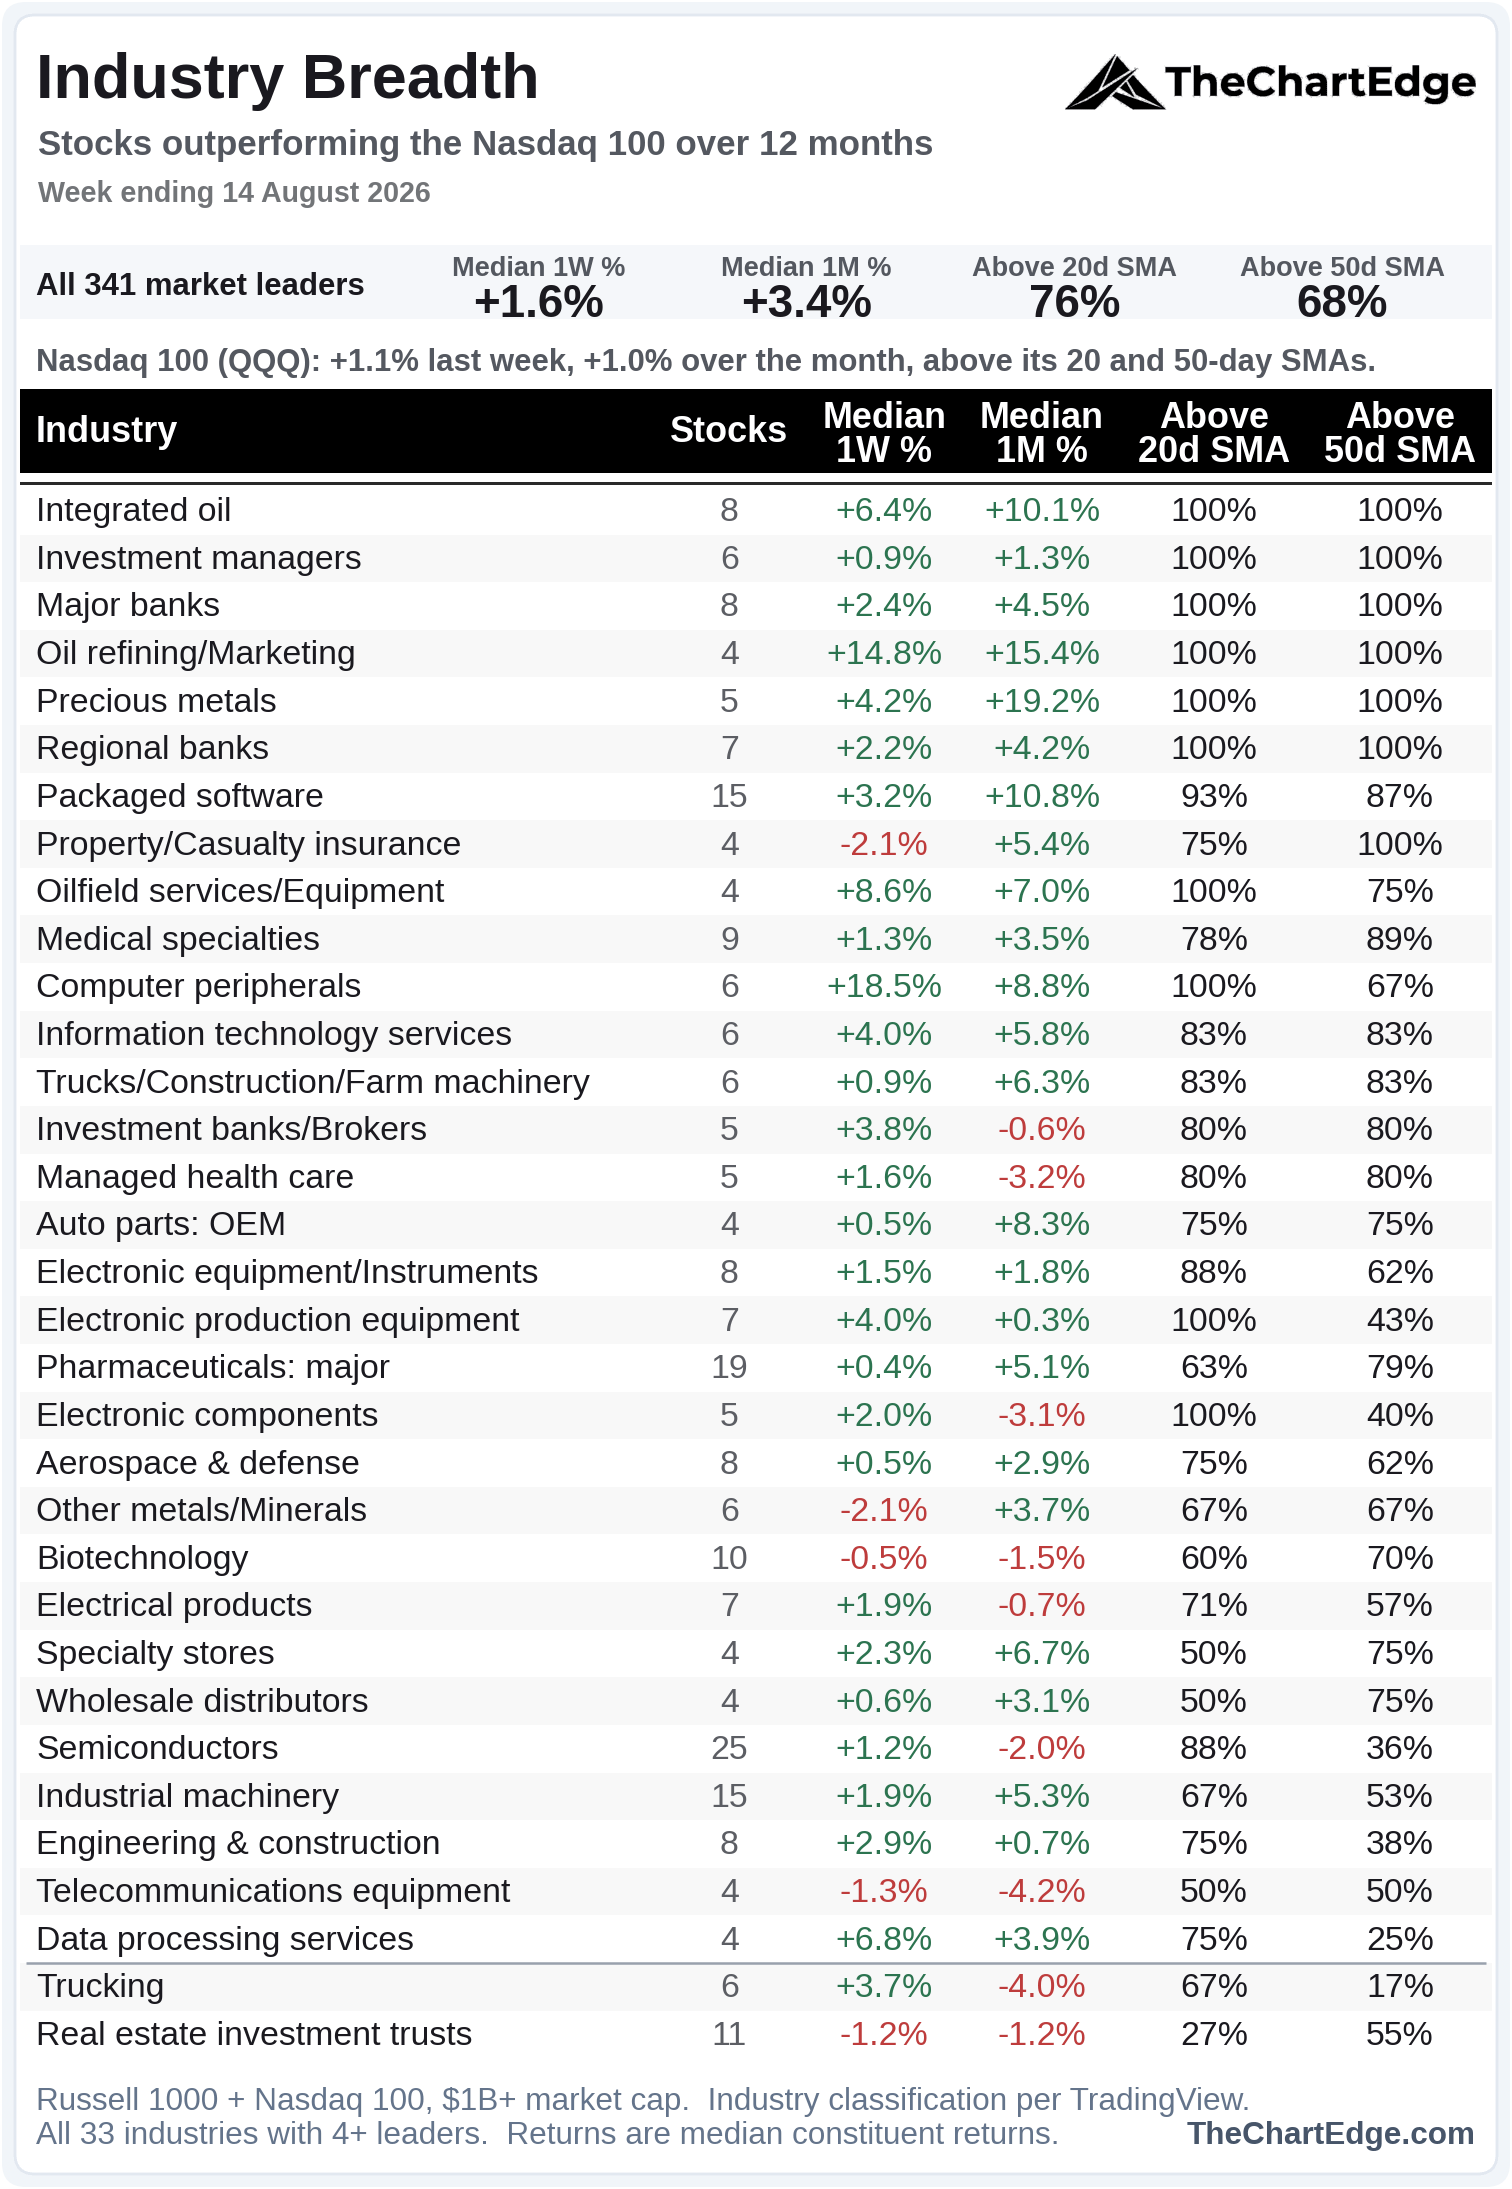
The broadening shows here too. 6 industries have every name above both SMAs - oil and the banks dominate the top of the board, with precious metals there for a second week.
Only 2 of the 33 industries on the board this weekend, trucking and REITs, sit below the line, which marks where fewer than half an industry’s names, on average, are above their 20 and 50-day SMAs. Two weekends ago, 19 of the 39 industries were below it. Last weekend, 8 of 37 were. If you’re wondering why the number of industries each week is different, it is because this universe contains only stocks in the Russell 1000 and Nasdaq 100 that have outperformed the Nasdaq 100 in the trailing 12 months - a floating universe.
The technology industries are improving as well. Two weekends ago, 7 of the 9 tech industries were below the line. Last weekend it was down to 2 - semiconductors and data processing services. This weekend there are none.
Semiconductors continued to improve - 88% of names are now back above their 20-day SMA, from 73%. However, only 36% are above the 50-day, up from 19% - better, but more work to be done for many of these names to repair the damage sustained in the big July selloff.
Packaged software keeps climbing up the board, placing at number 7. The industry group has 15 names this weekend, nearly all are above both SMAs, and it has the best one-month median return of any technology industry, at 10.8%.
The Return of Oil
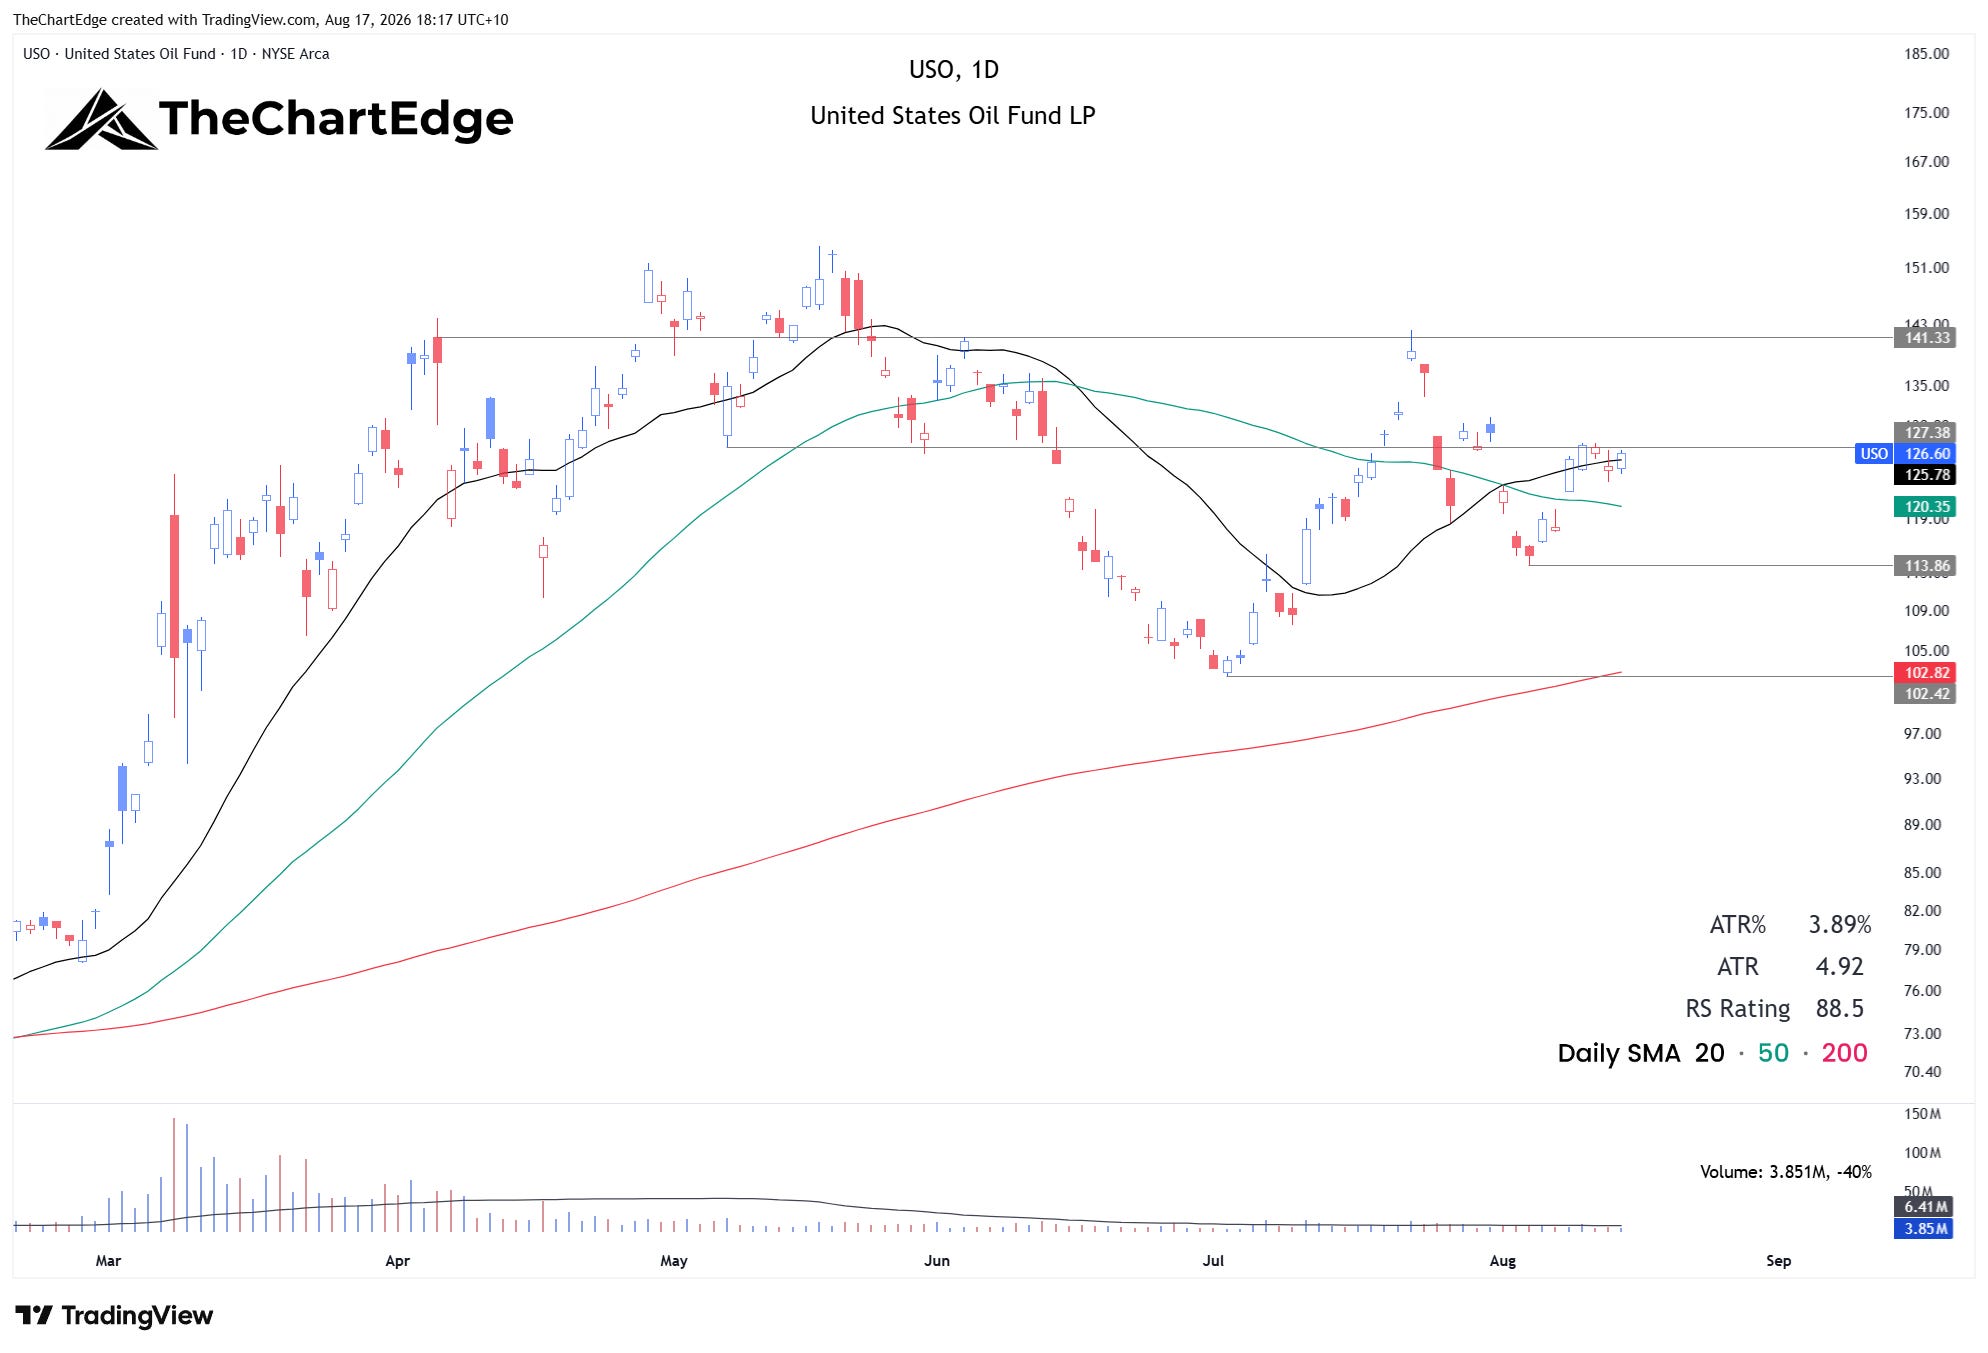
Crude (USO) rose 7.3% and jumped from Neutral to a Strong Uptrend. Now all the energy ETFs I track are back in Strong Uptrends. The last time energy led the momentum board, in late July, it was a defensive story - Anti-Beta was at number four, Low Volatility and Utilities were on the board, and only 2 of the 9 major indices finished that week higher. This time those risk-off proxies are not on the board, 7 of the 9 indices were up - led by the equal-weight and smaller cap indices - and 88 of the 121 ETFs are in uptrend states.
USO Chart
Semis Still Below Their 50-Day
SMH Chart
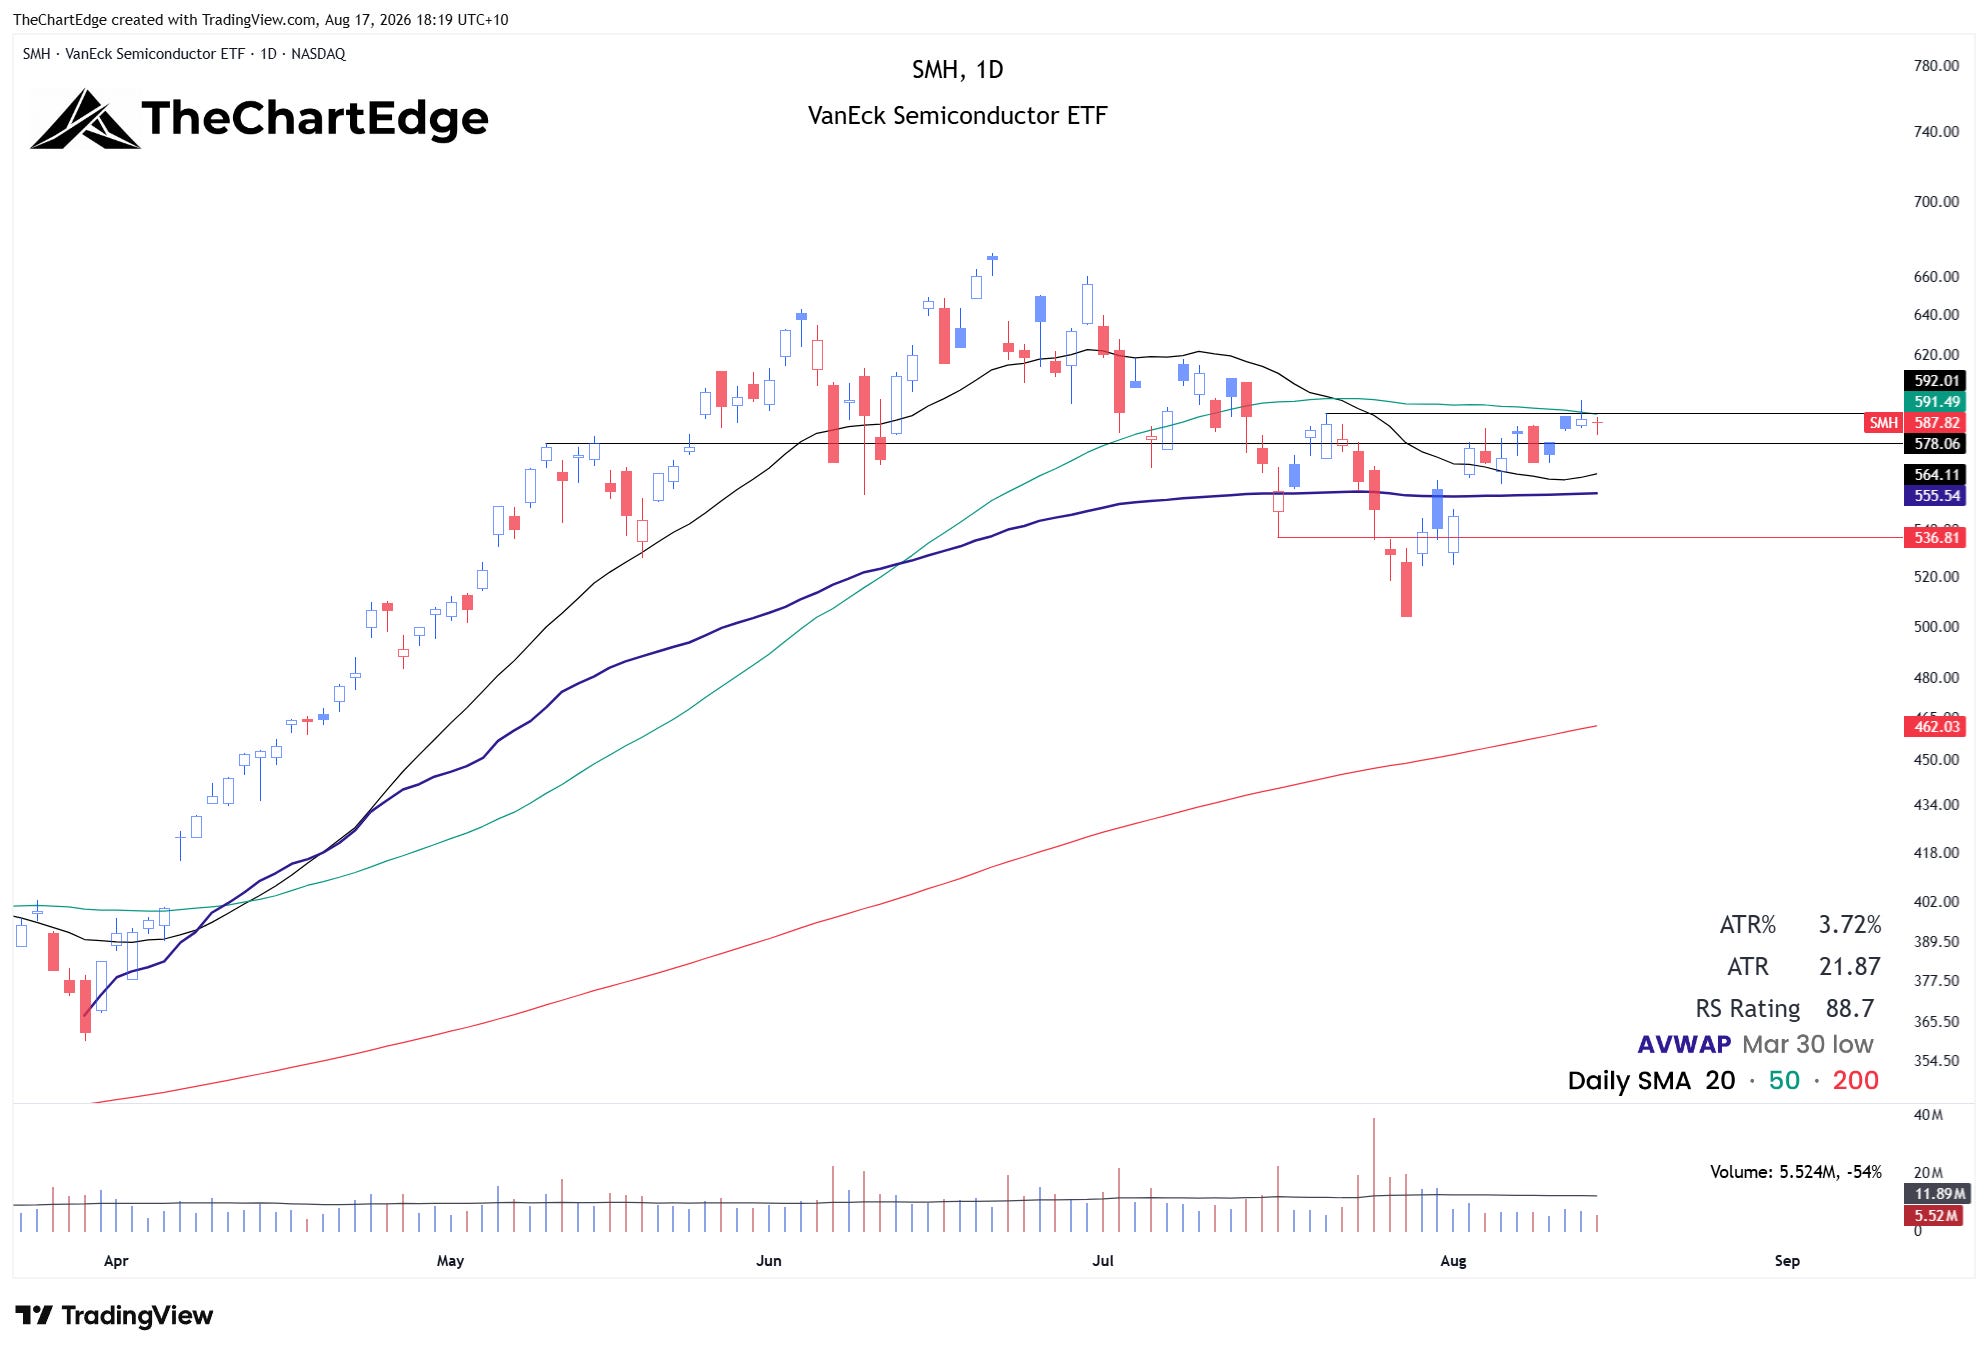
SMH added 0.9% and closed at 587.8 - still below the 592 level I’ve been watching, and 0.6% under its 50-day SMA. It seems there is a bit of a battle going on at this level. I’m waiting for SMH to clear 592 before getting more bullish.
XSD Chart
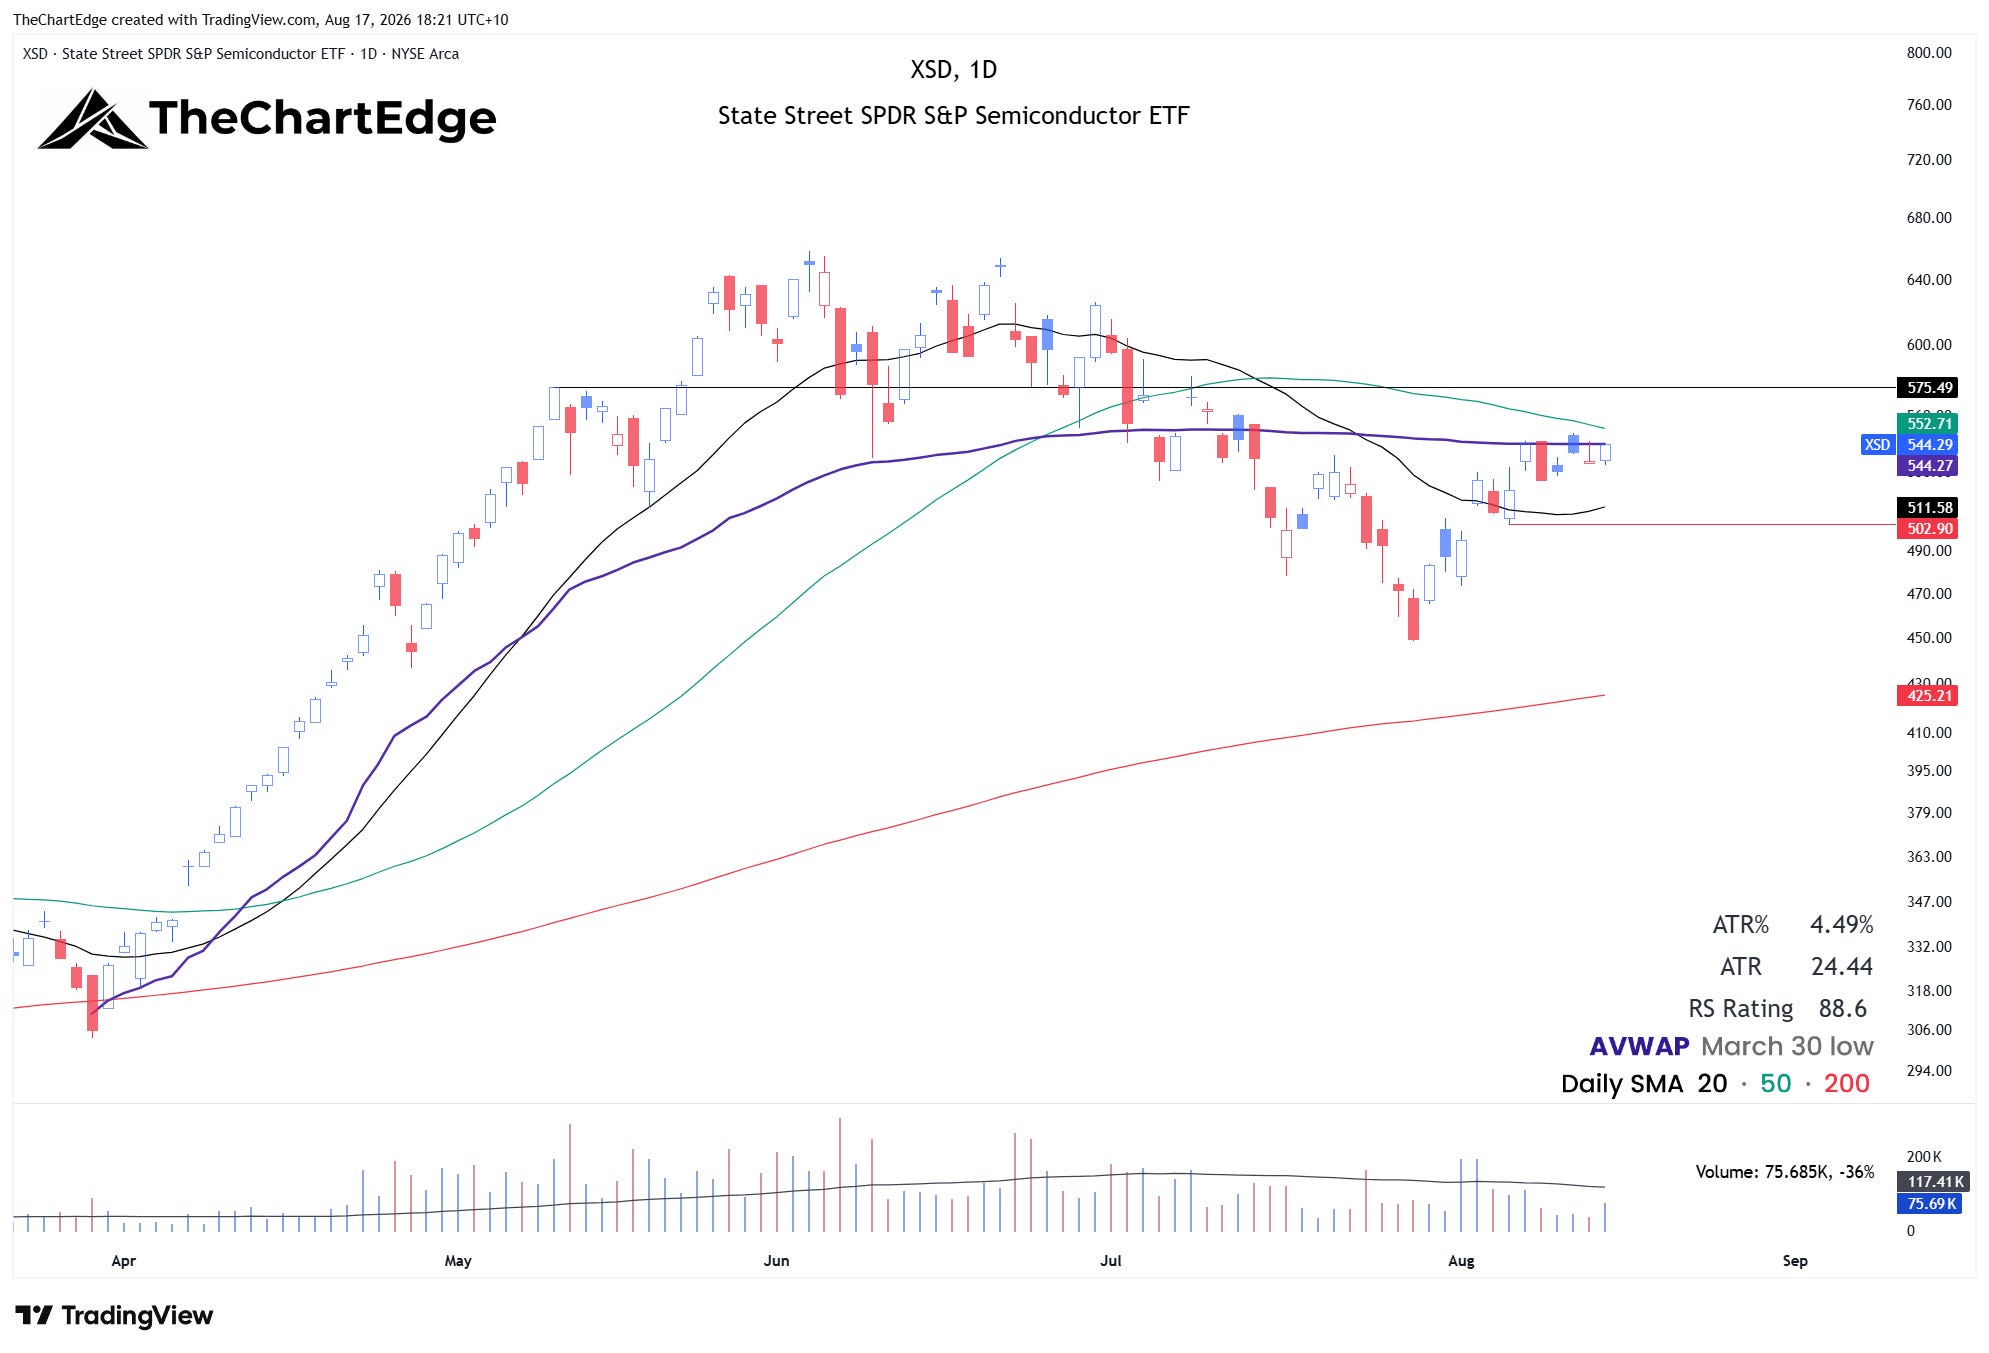
Equal-weight semis (XSD) finished flat, below its 50-day SMA and right on the AVWAP from the March 30 low for a second week running. I want to see it clear those levels and potential resistance at 575.
Gold, Silver and the Miners
GDX finished flat and SIL added 1.2%, both still above their 200-day SMAs. A nice digestion after huge moves the prior week. A breakout after some more sideways action could provide an entry opportunity. However, the fact that both spot gold and silver are yet to reclaim their 200-day SMAs reduces my conviction at this stage. Although both spot contracts also had constructive looking consolidations last week.
GDX Chart
Follow-Up on the Ethereum Trade
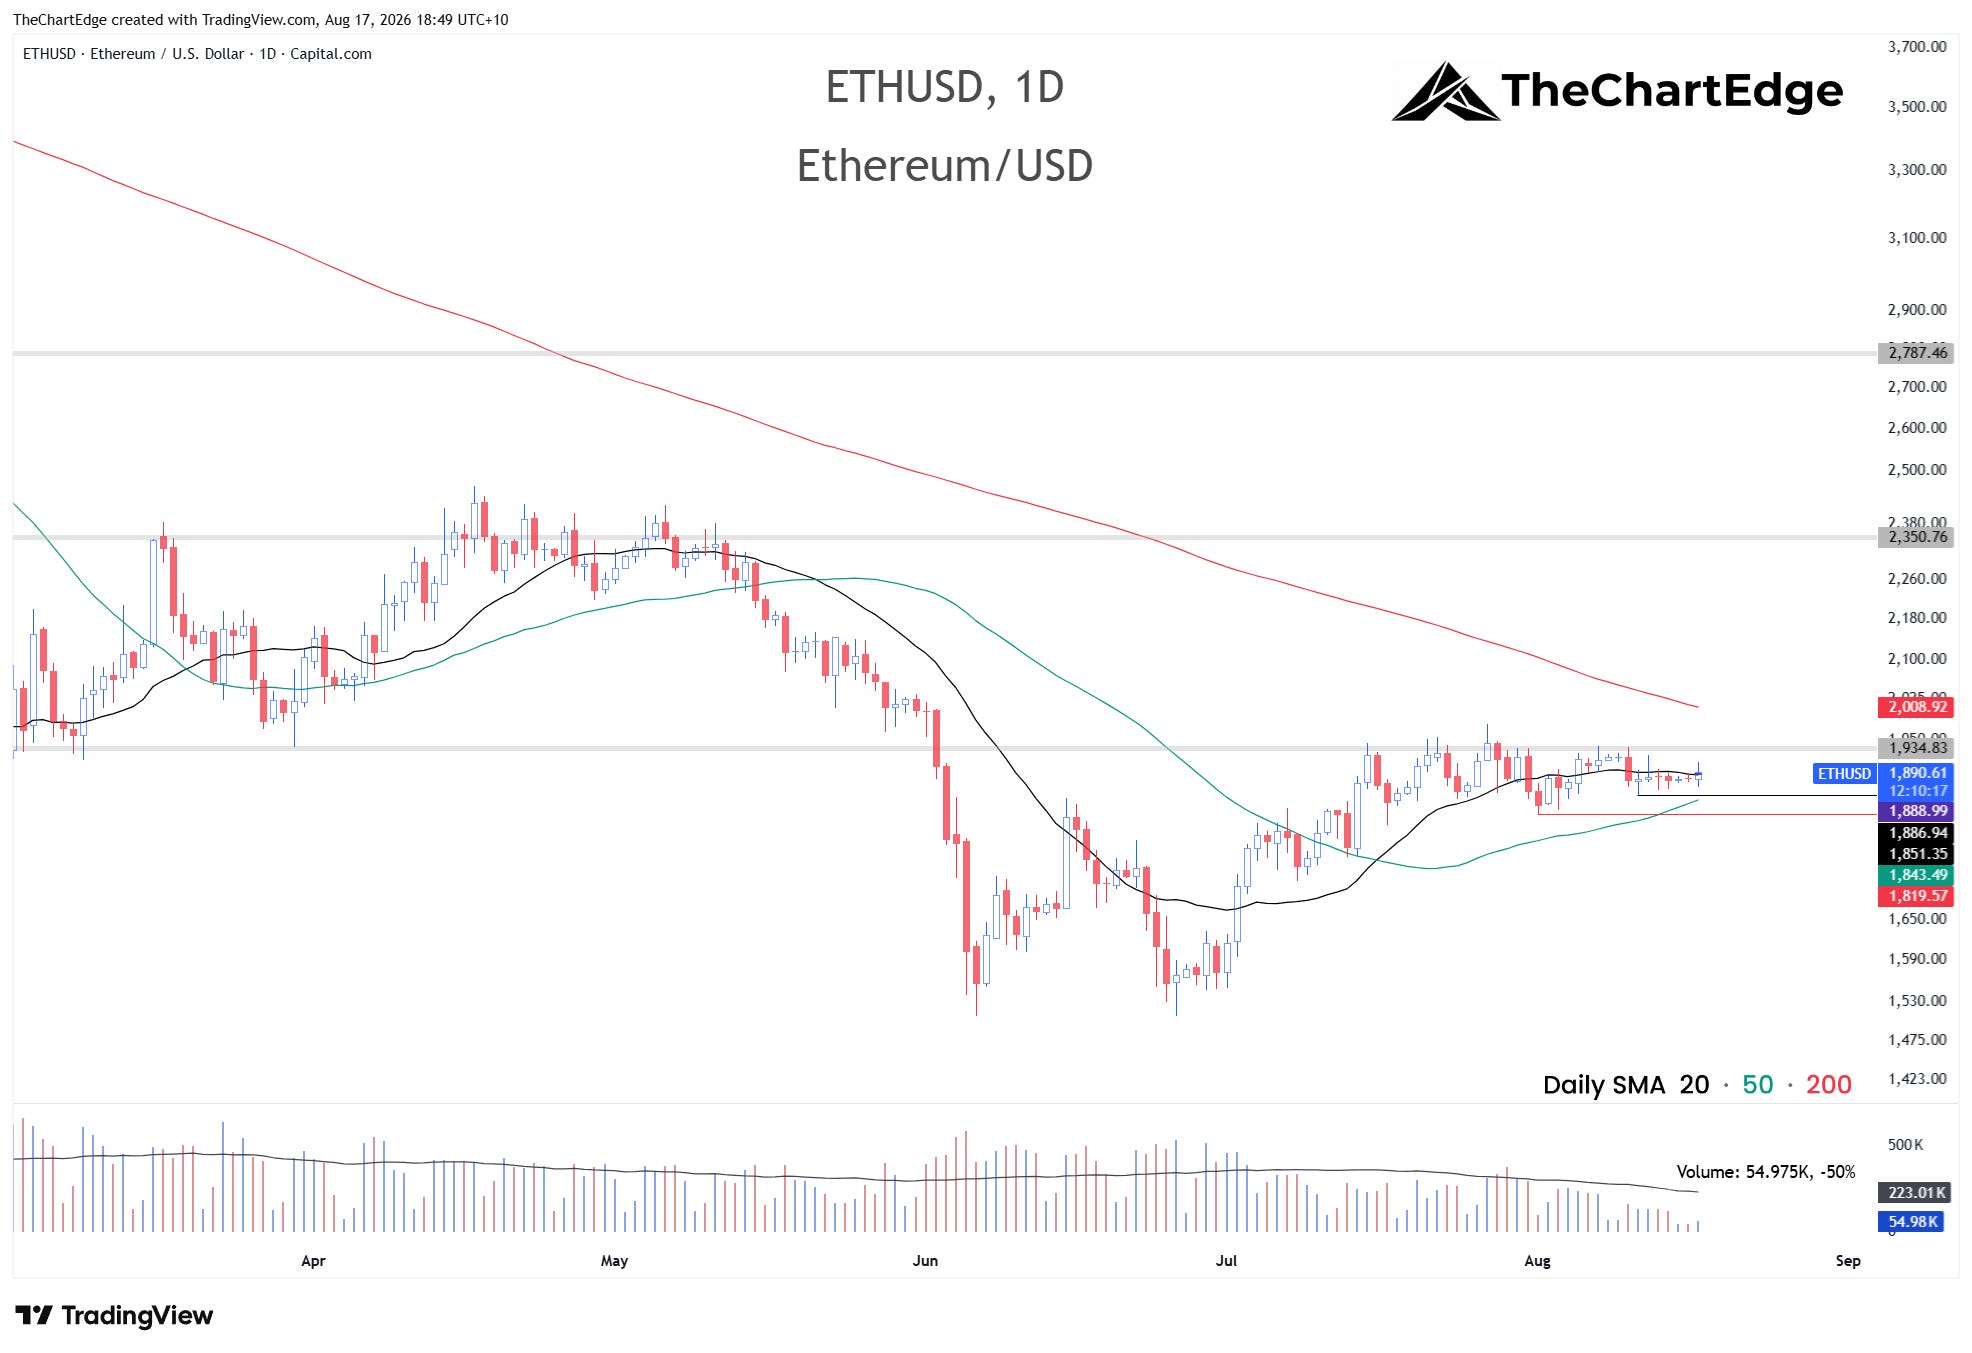
I entered the first leg of the Ethereum position I outlined last weekend, buying around 1915, and used the tighter stop-loss under the 20-day SMA at 1875 rather than the wider one under the August 1 low, around 1820. I was stopped out on Monday overnight (Melbourne time) for a relatively small loss. The low of the week was around 1850, so the wider stop would have kept me in the trade, but I didn’t want to sit through chop on a larger decline. It also allowed me to take a bigger position for the dollar risk I allocated to that half of the position. I still have the second leg as a resting buy stop order at 1950, in case it does push higher.
Ethereum Chart
Follow-Up on XBI
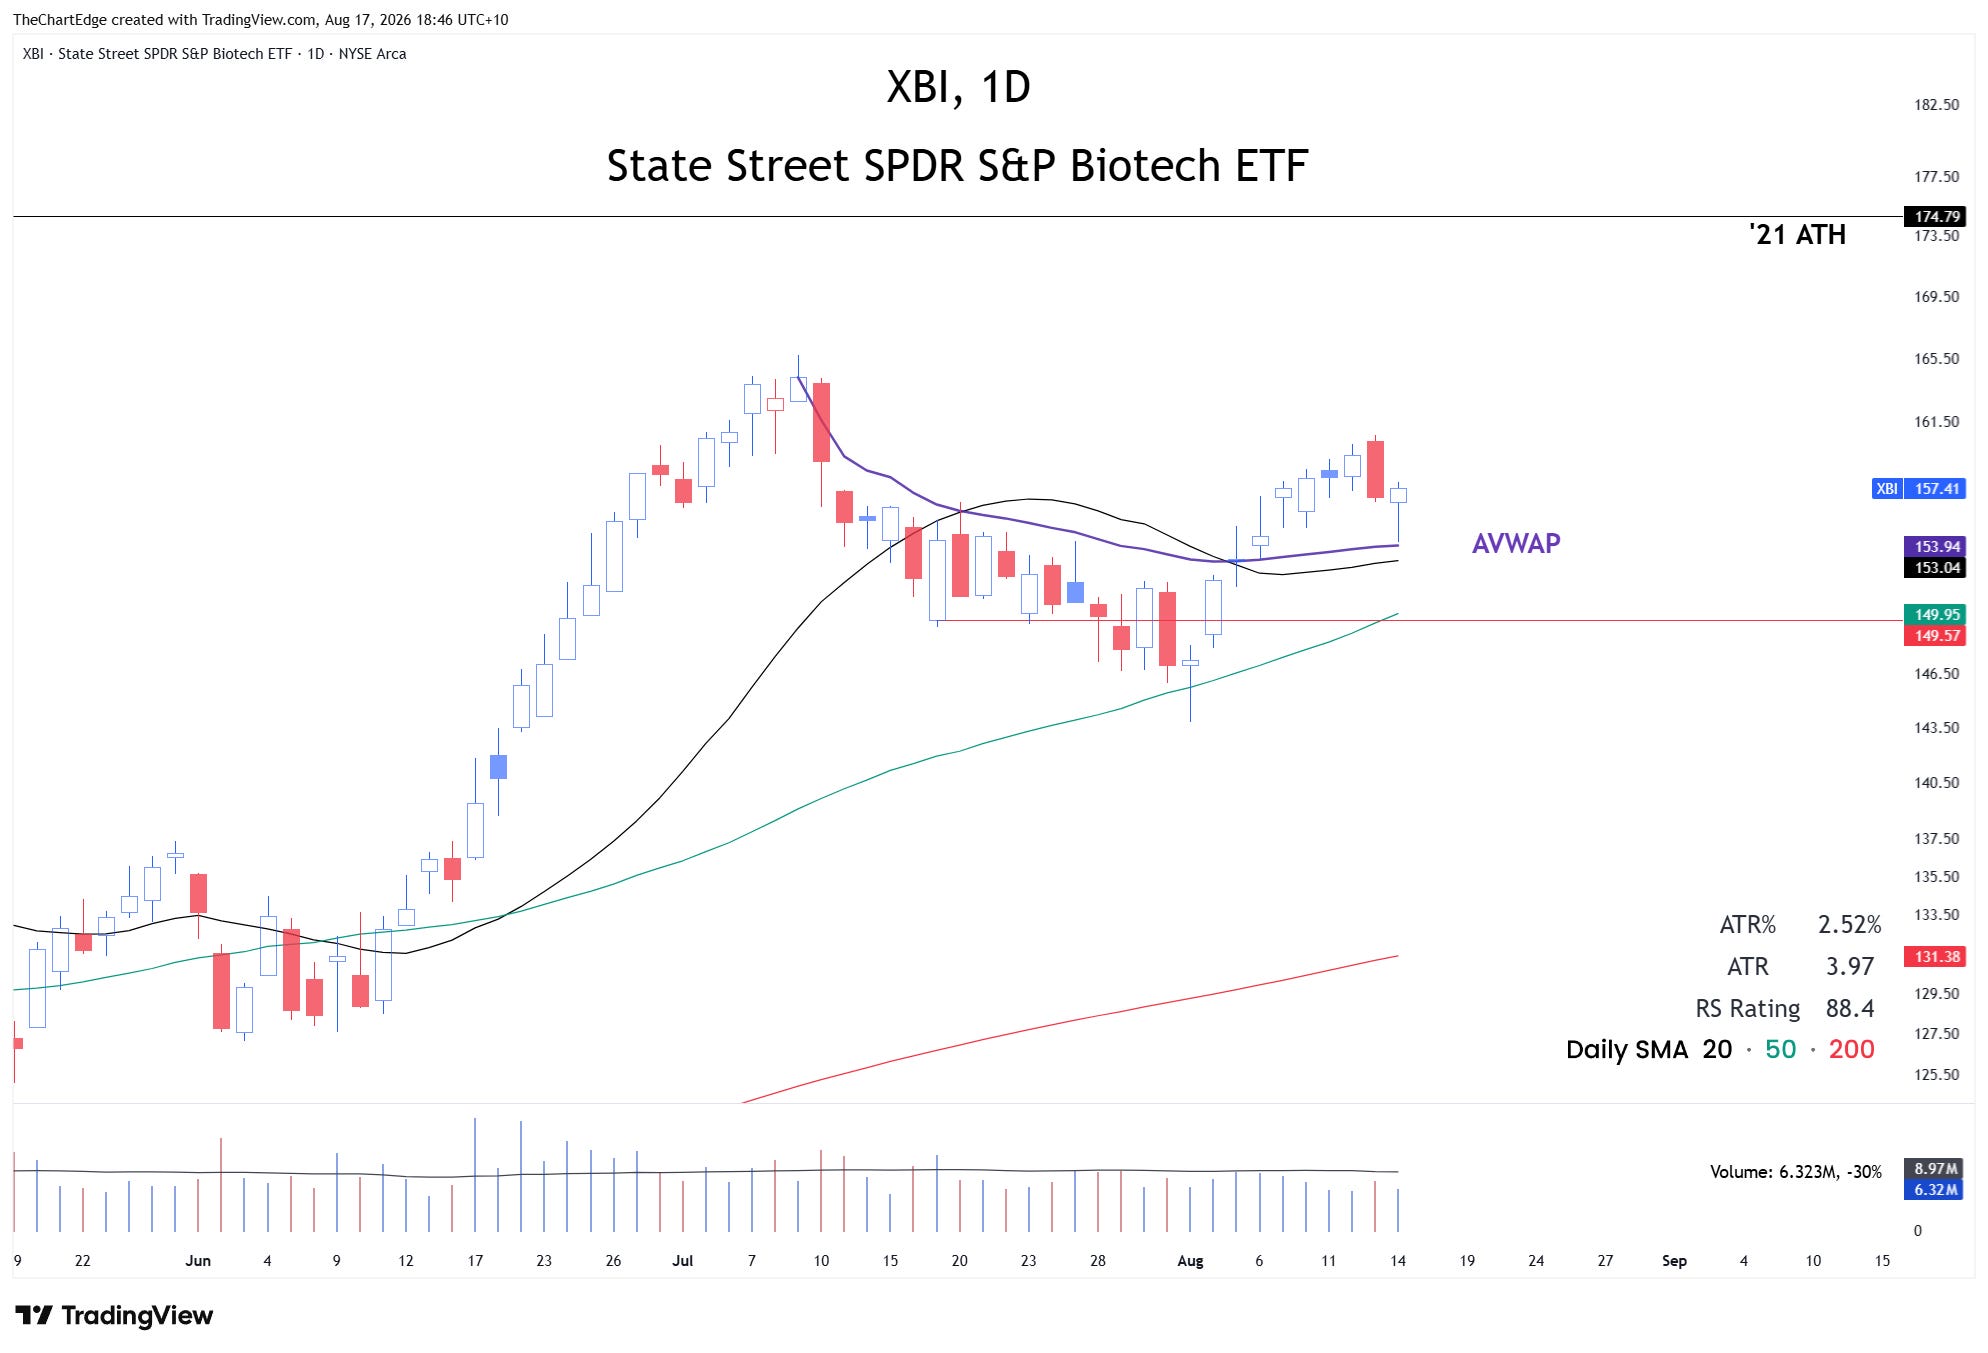
A quick follow-up on XBI. I had a buy limit order at 154.50 which should have filled on Friday, but there was an execution issue which my broker is looking into. My stop-loss on this is at 149.50, with an initial target around 174, as outlined last week.
XBI Chart
The Dollar and TLT
The DXY spent another week below 100 in a tight range. As I finish writing this on Monday evening Melbourne time, DXY is down and has undercut the recent lows of the range from the last couple of weeks.
TLT closed last week at 82.04, under the 82.77 low from May I’ve been watching. The 10-year yield finished at 4.70% and the 30-year at 5.26%, both a touch higher, but they have been going sideways during August and are both yet to take out their July 31 highs, which were 4.74% for the 10-year and 5.27% for the 30-year. These are the levels I will be watching now.
The Week Ahead
The temperature held in the Goldilocks Zone and participation broadened on multiple measures. It’s even more impressive that all of this came in the face of higher oil prices and continued uncertainty in the Middle East. On the negative side, SMH still hasn’t reclaimed the 592 level - it’s been several weeks now - and there are plenty of individual AI names that still don’t look very healthy. Even among the better charts, there’s not a lot in buyable positions. I’m watching yields as outlined above, a significant break higher above their respective July 31 highs would lessen my conviction to get aggressively long. Although I always place more emphasis on the individual chart I am trading.
In terms of new trades, I am looking at SPY or CFD equivalent to retest the breakout area and buy strength on a bounce from there if it occurs. For QQQ, I would like to see a handle or tight consolidation a bit closer to the ATHs and buy a breakout. For individual stock names I am watching Seagate (STX), Teradyne (TER), Lumentum (LITE) and Tower Semiconductor (TSEM) for possible entries. All four have shown relative strength, are within about two ATRs of their all-time highs, are above their moving averages, are not extended, and have reported earnings. The only thing missing is the 20-day crossing back above the 50-day - and all four are close. I will also have a resting buy stop order for Ethereum at 1950.
Stay open-minded and manage risk carefully.
Cheers,
Marcus Grant, CFTe
Disclaimer: The content provided in this newsletter is for informational and educational purposes only and should not be considered as financial, investment, or legal advice. The information shared is based on our research and analysis, but we are not a licensed financial advisor, nor can we guarantee its accuracy, completeness, or timeliness. Market conditions and financial instruments can change rapidly, and any opinions expressed may not be suitable for all investors. Any opinions expressed and or securities mentioned do not constitute a recommendation to buy, sell, or hold that or any other security. You should conduct your own due diligence and consult with a licensed financial advisor or other professional before making any investment decisions. Past performance is not indicative of future results, and all investments carry the risk of loss. The authors and publishers of this newsletter are not responsible for any financial decisions made based on the content provided herein. By reading and or subscribing to this newsletter, you acknowledge and agree that you are using the information at your own risk.