


Everything below is as of Friday August 28 close.
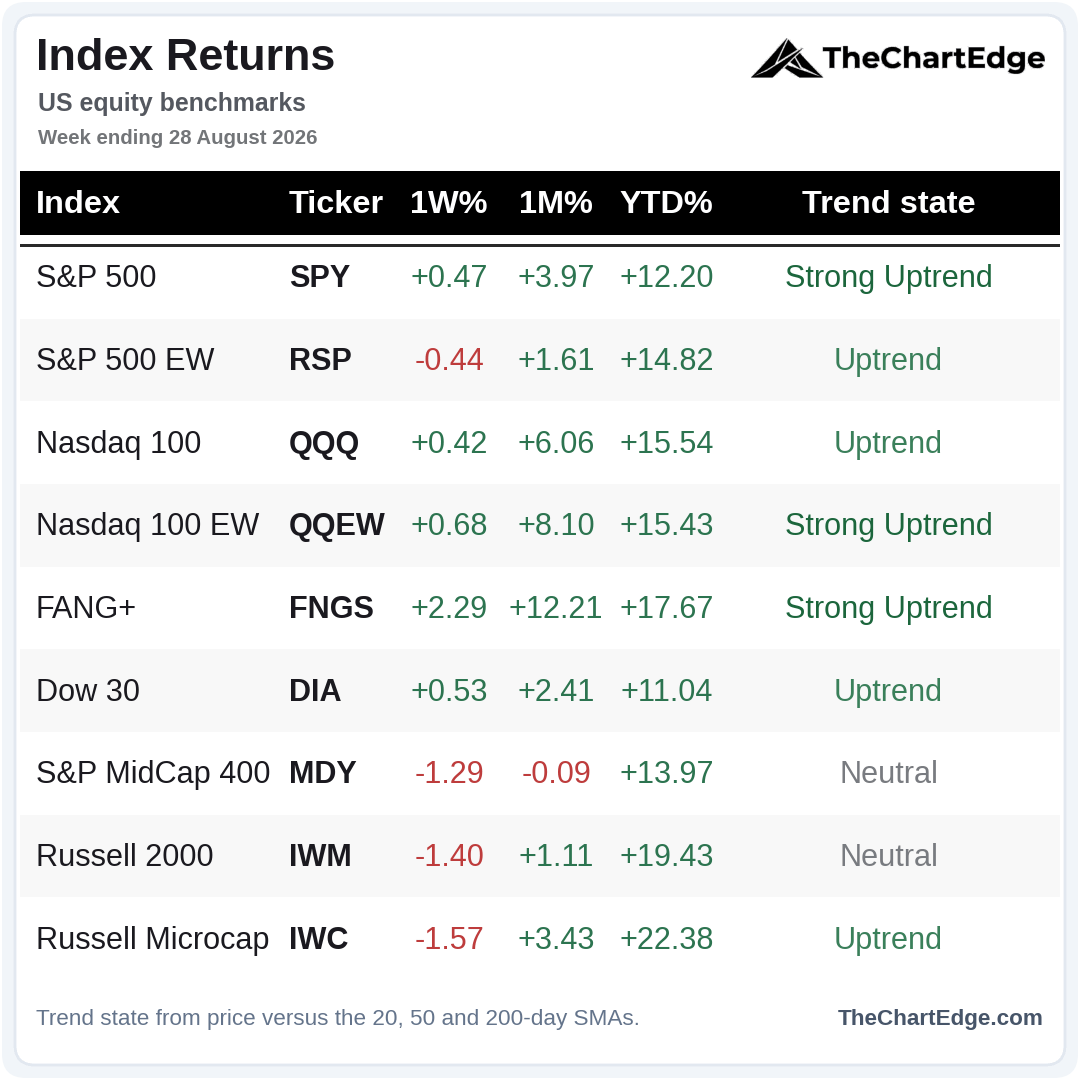
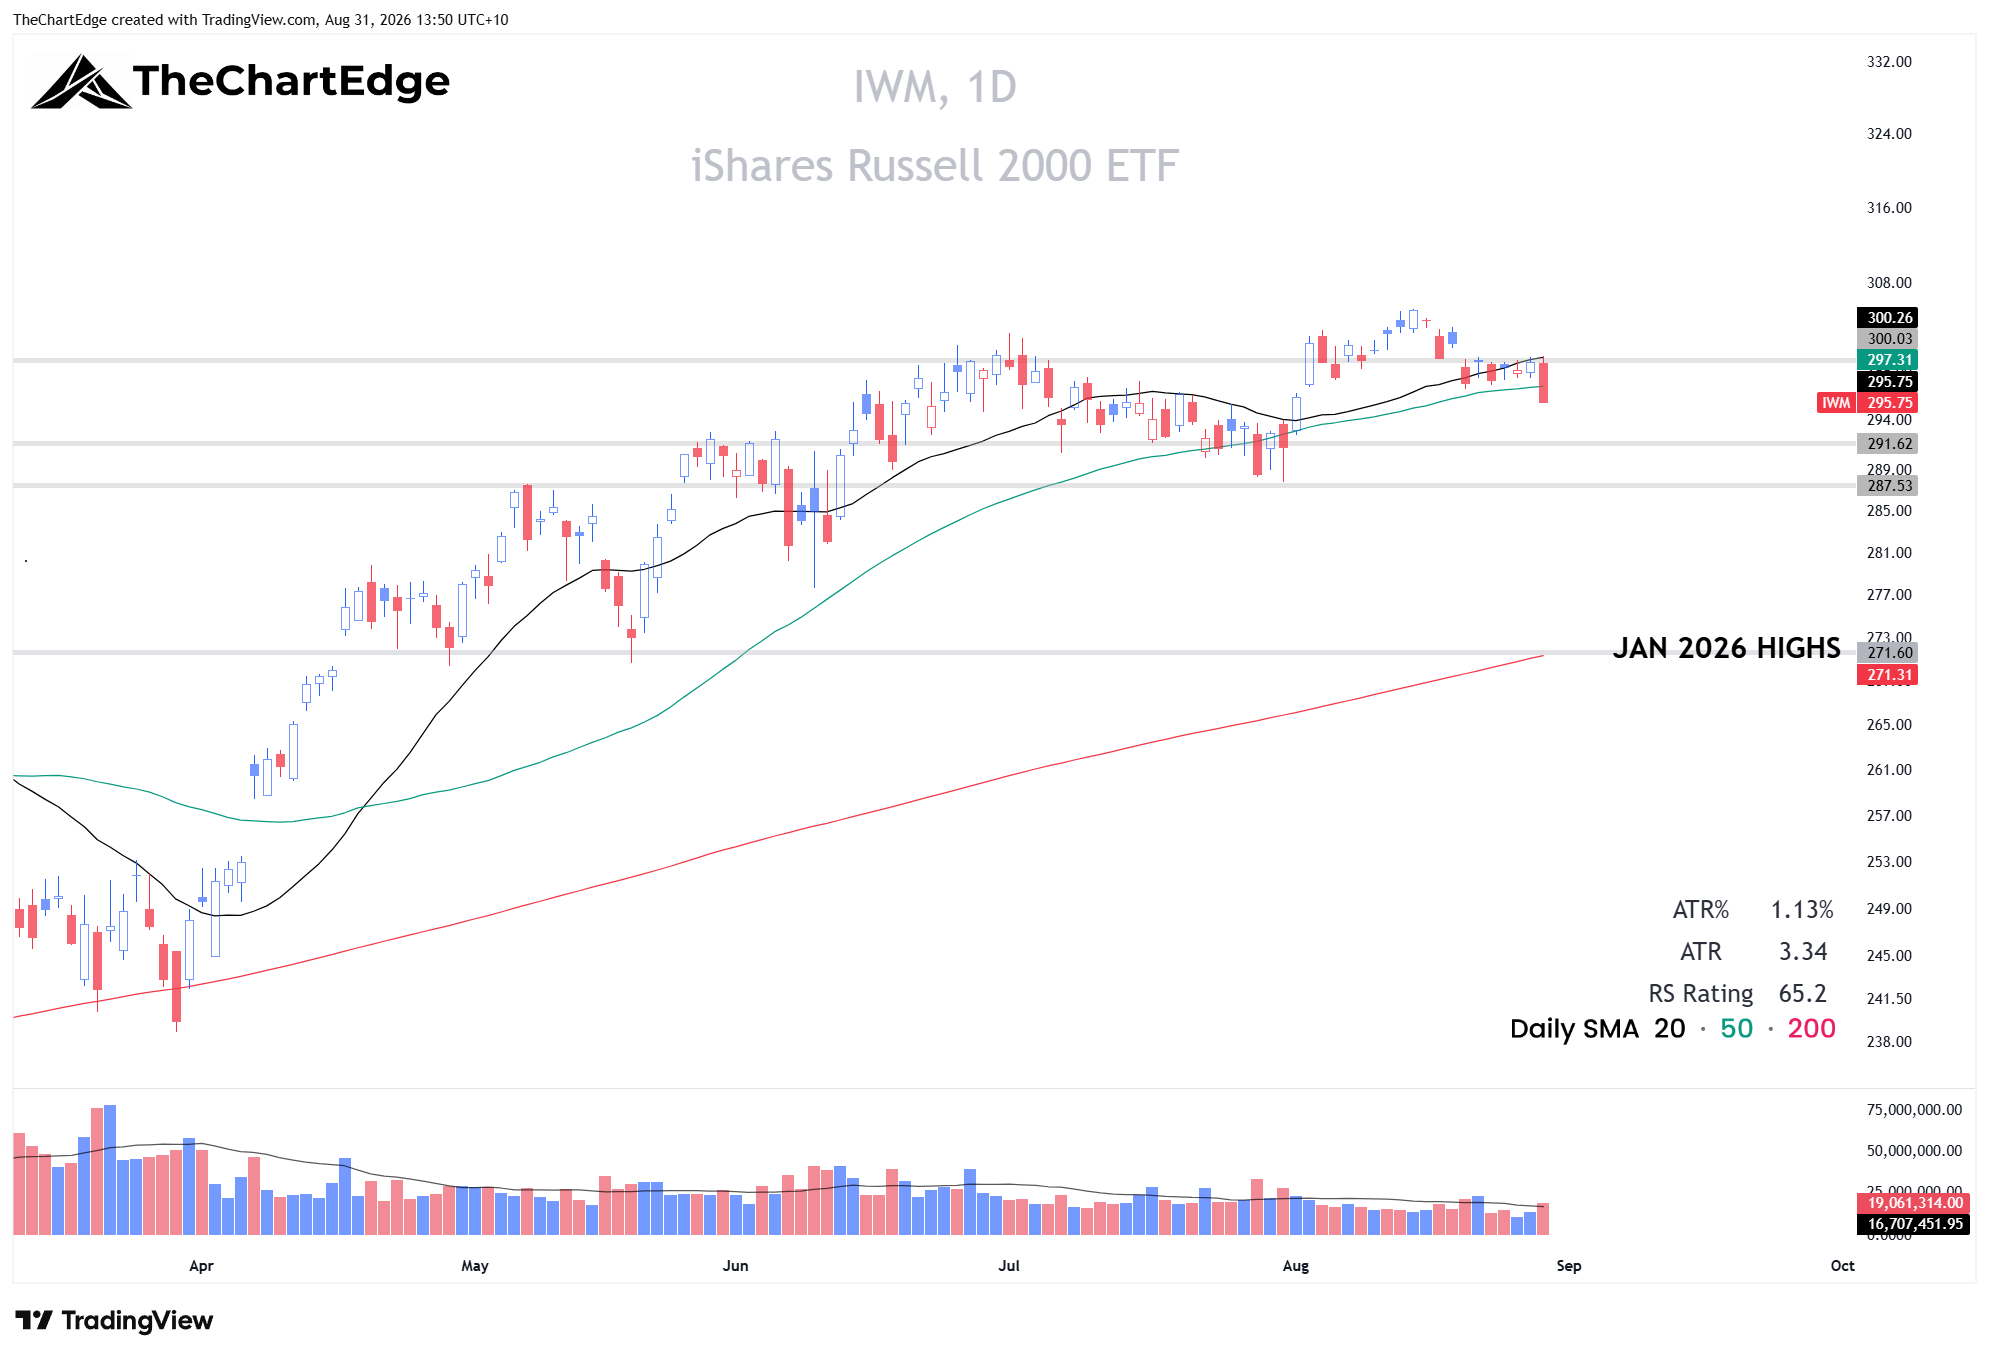
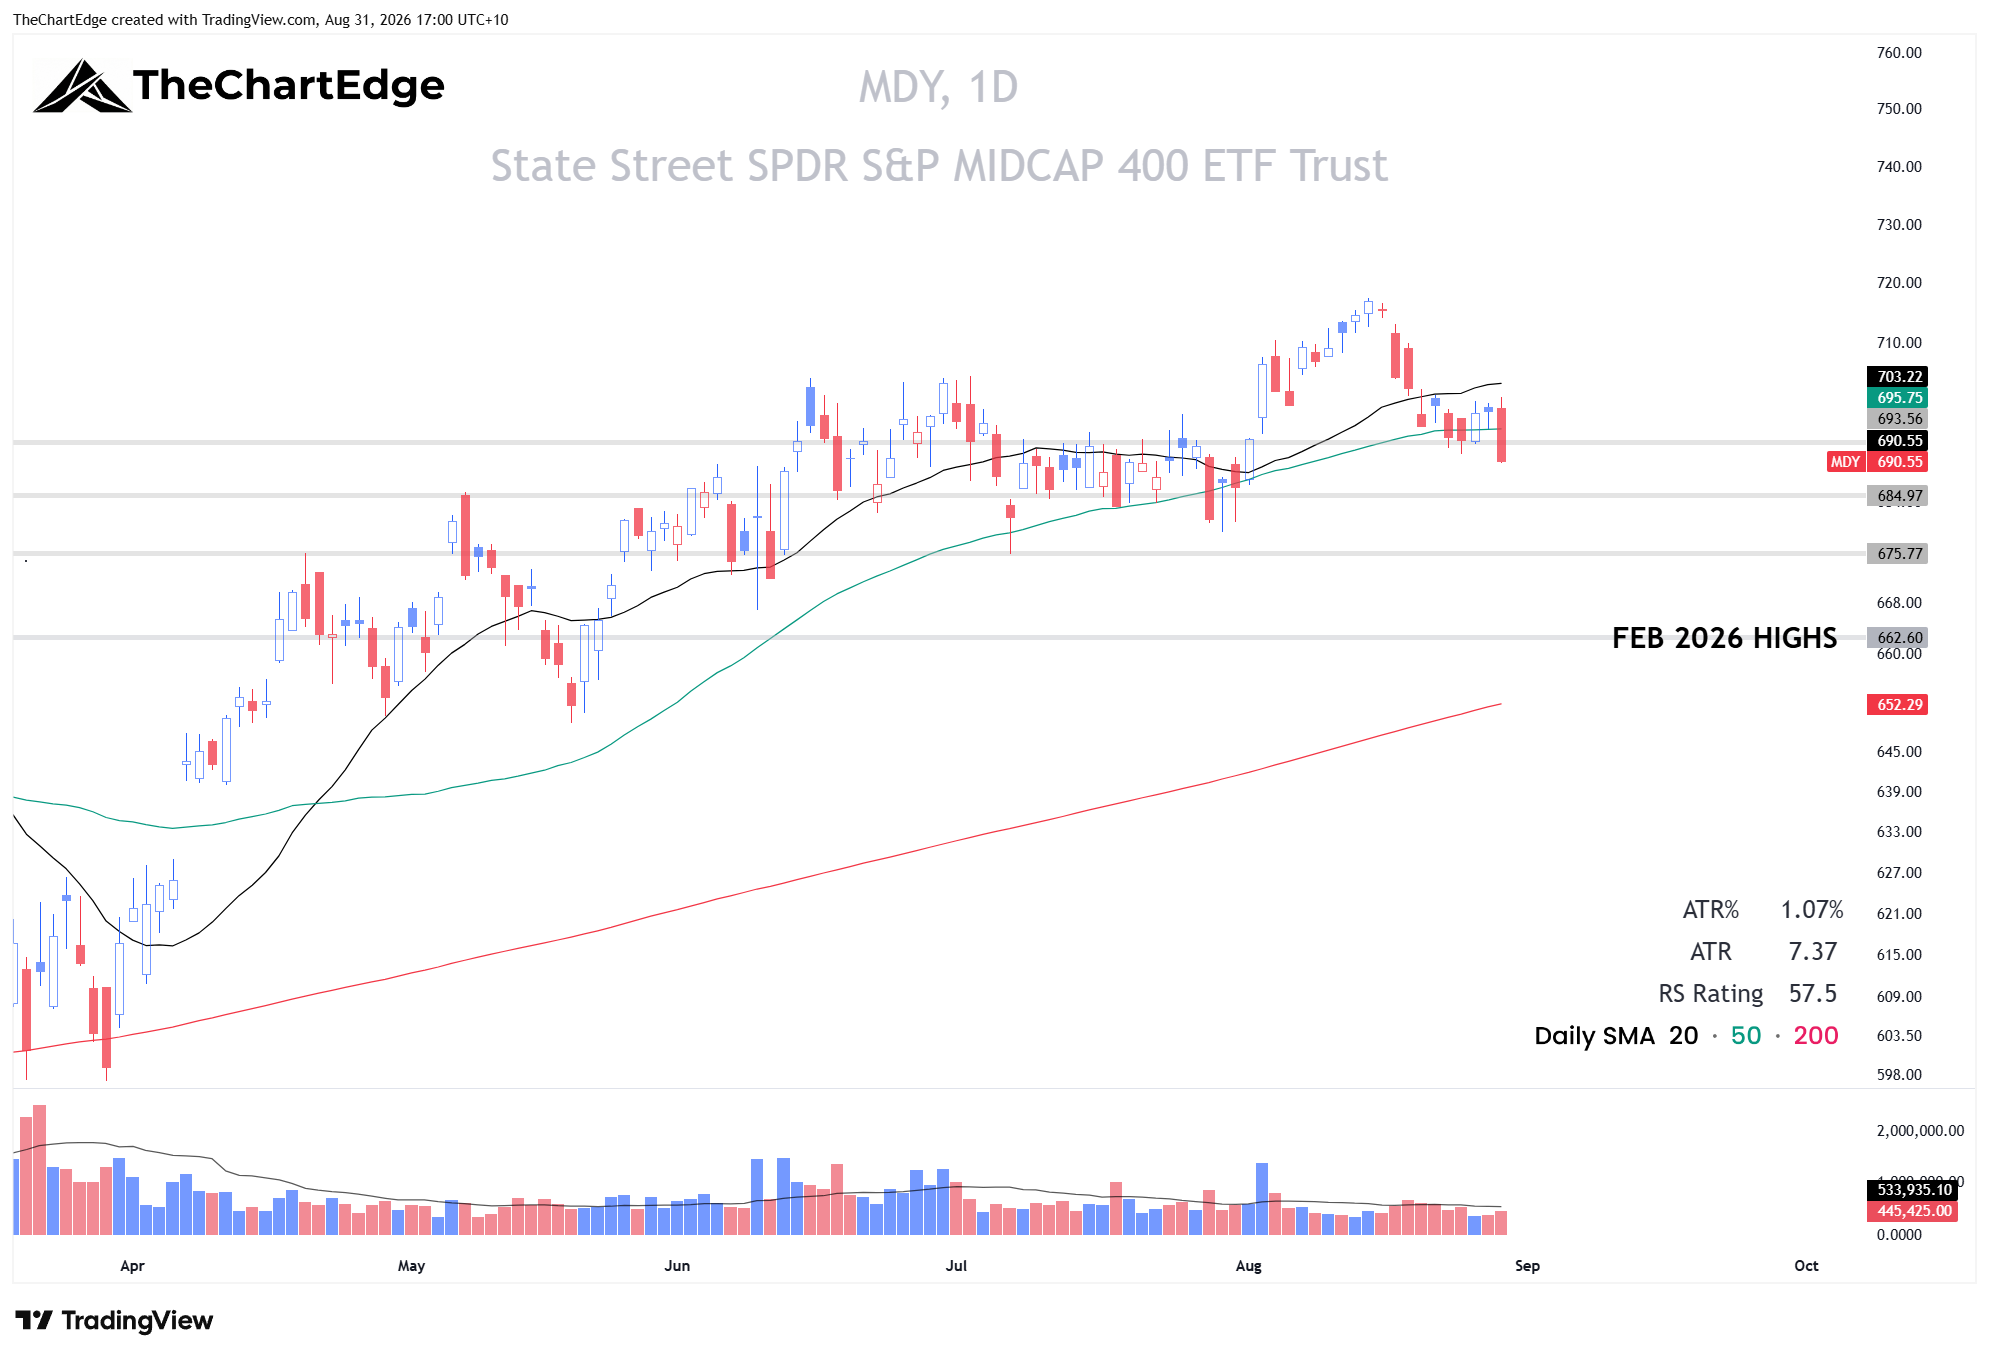
Of the major indices I track, 5 of the 9 finished the week higher. Friday’s red candles across the board don’t look great. The narrative after Warsh’s Jackson Hole speech was that he was more hawkish than expected. Odds of a September Fed rate hike increased significantly, and interest rate sensitives sold off. Small and mid caps were hit hardest, both closing on their lows and under their 50-day SMAs.
IWM Chart
MDY Chart
The SPY/RSP ratio peaked in mid-May and has been trending down since. After months of RSP outperforming SPY, some mega-cap leadership is not necessarily unhealthy in my opinion and might even be what is needed for the SPY and QQQ to go higher. Although I think semis will need to - at a minimum - stop going down as well.
SPY Chart
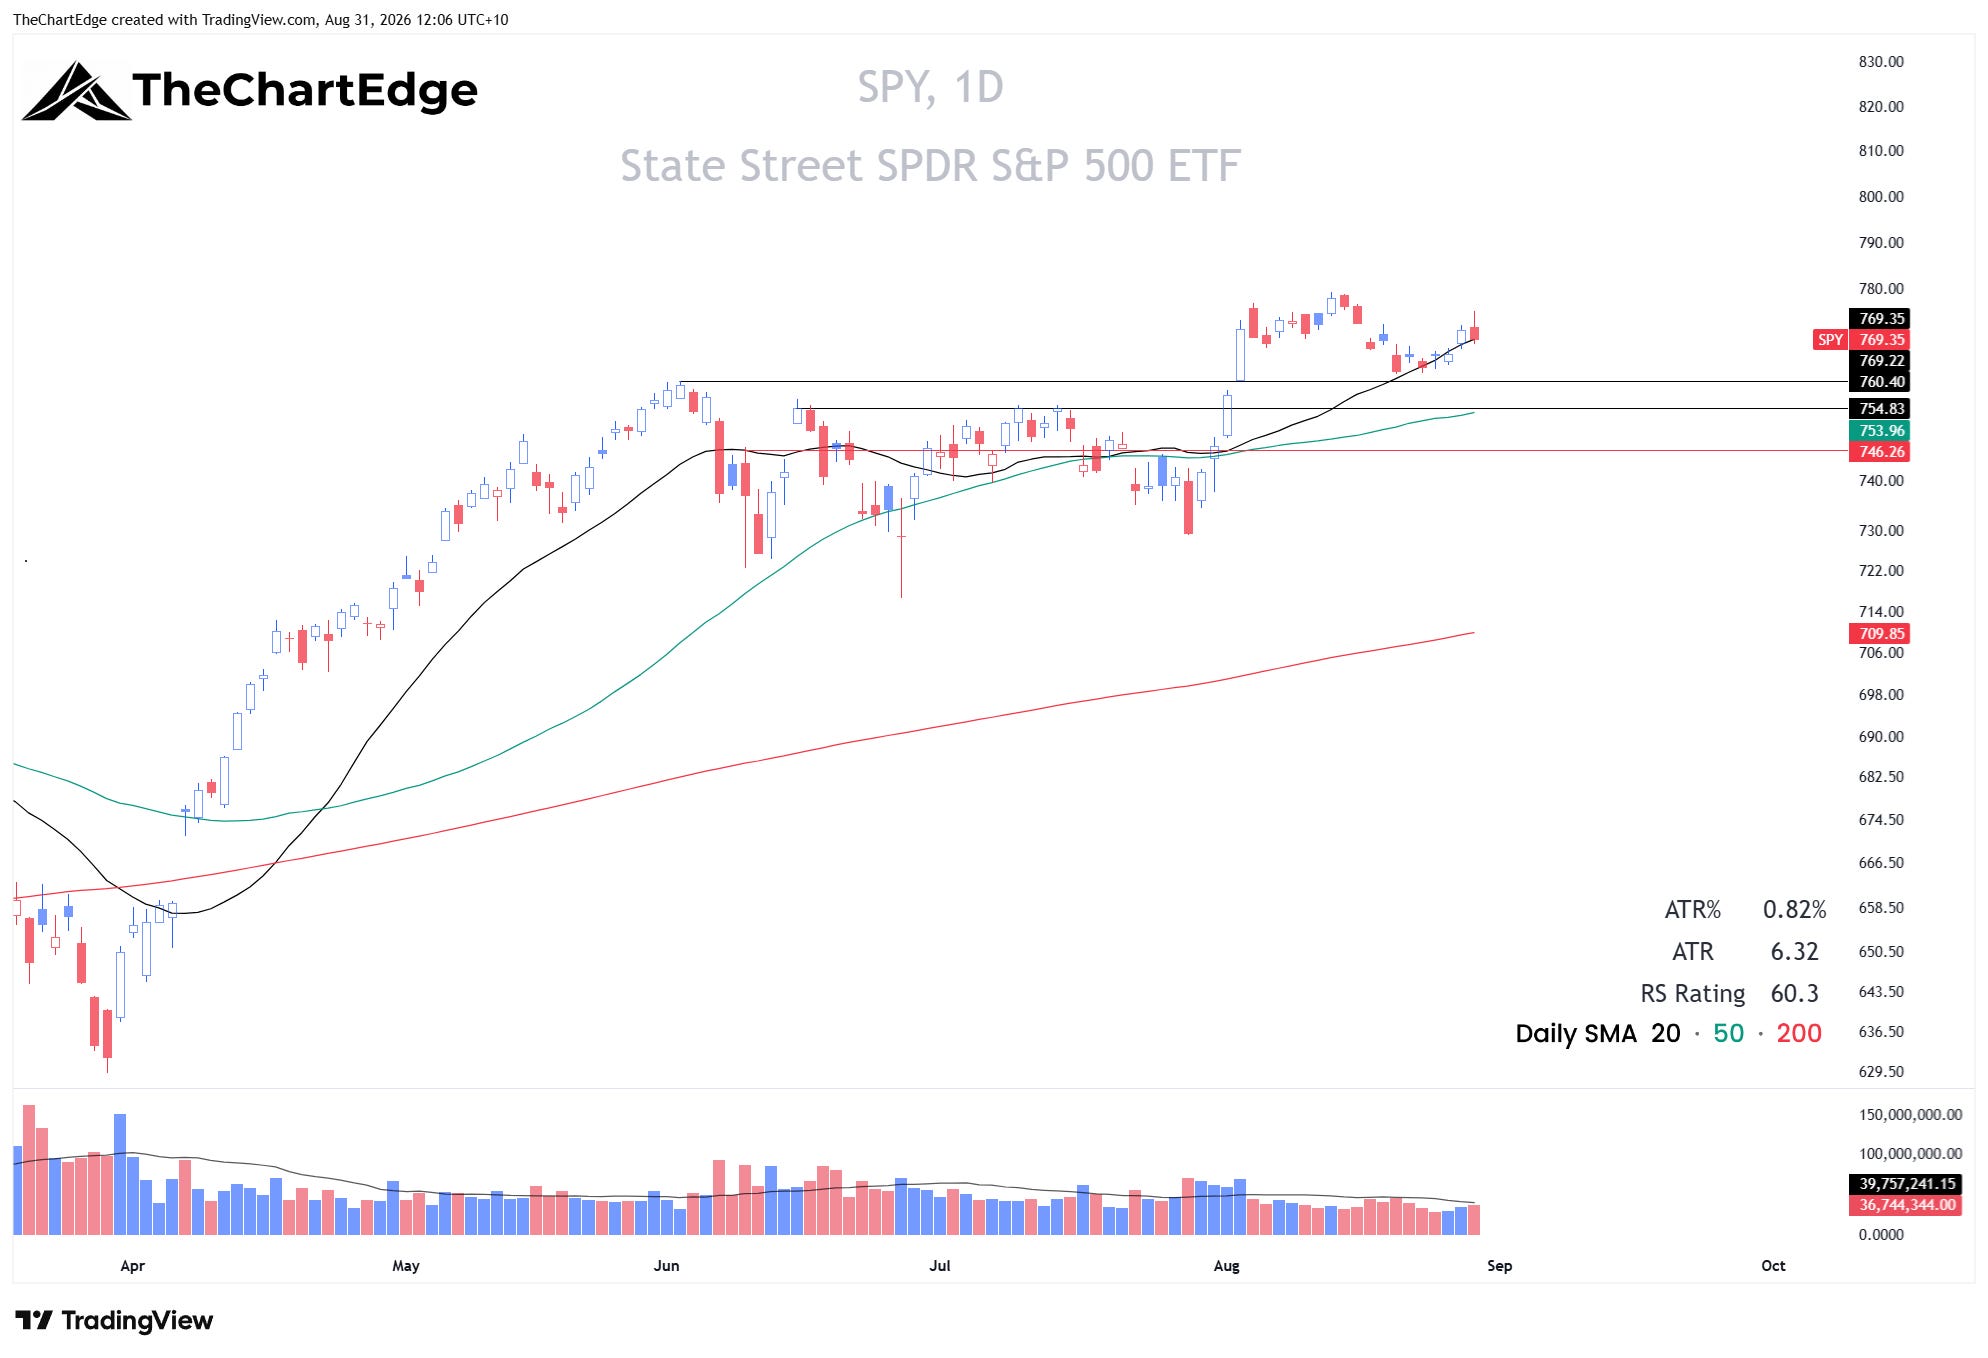
SPY closed at 769.35, right on its 20-day SMA and 1.3% below its all-time high, still in a Strong Uptrend. Friday’s reversal candle doesn’t look great, but SPY has held above the breakout level around 760 so far. My resting order for the S&P 500 CFD at 7580 (around 755 on SPY) never filled. I’m going to leave it for now, as the 50-day on SPY now sits at 754, just under that level. My stop-loss remains at 7495, or around 745 on SPY.
QQQ Chart
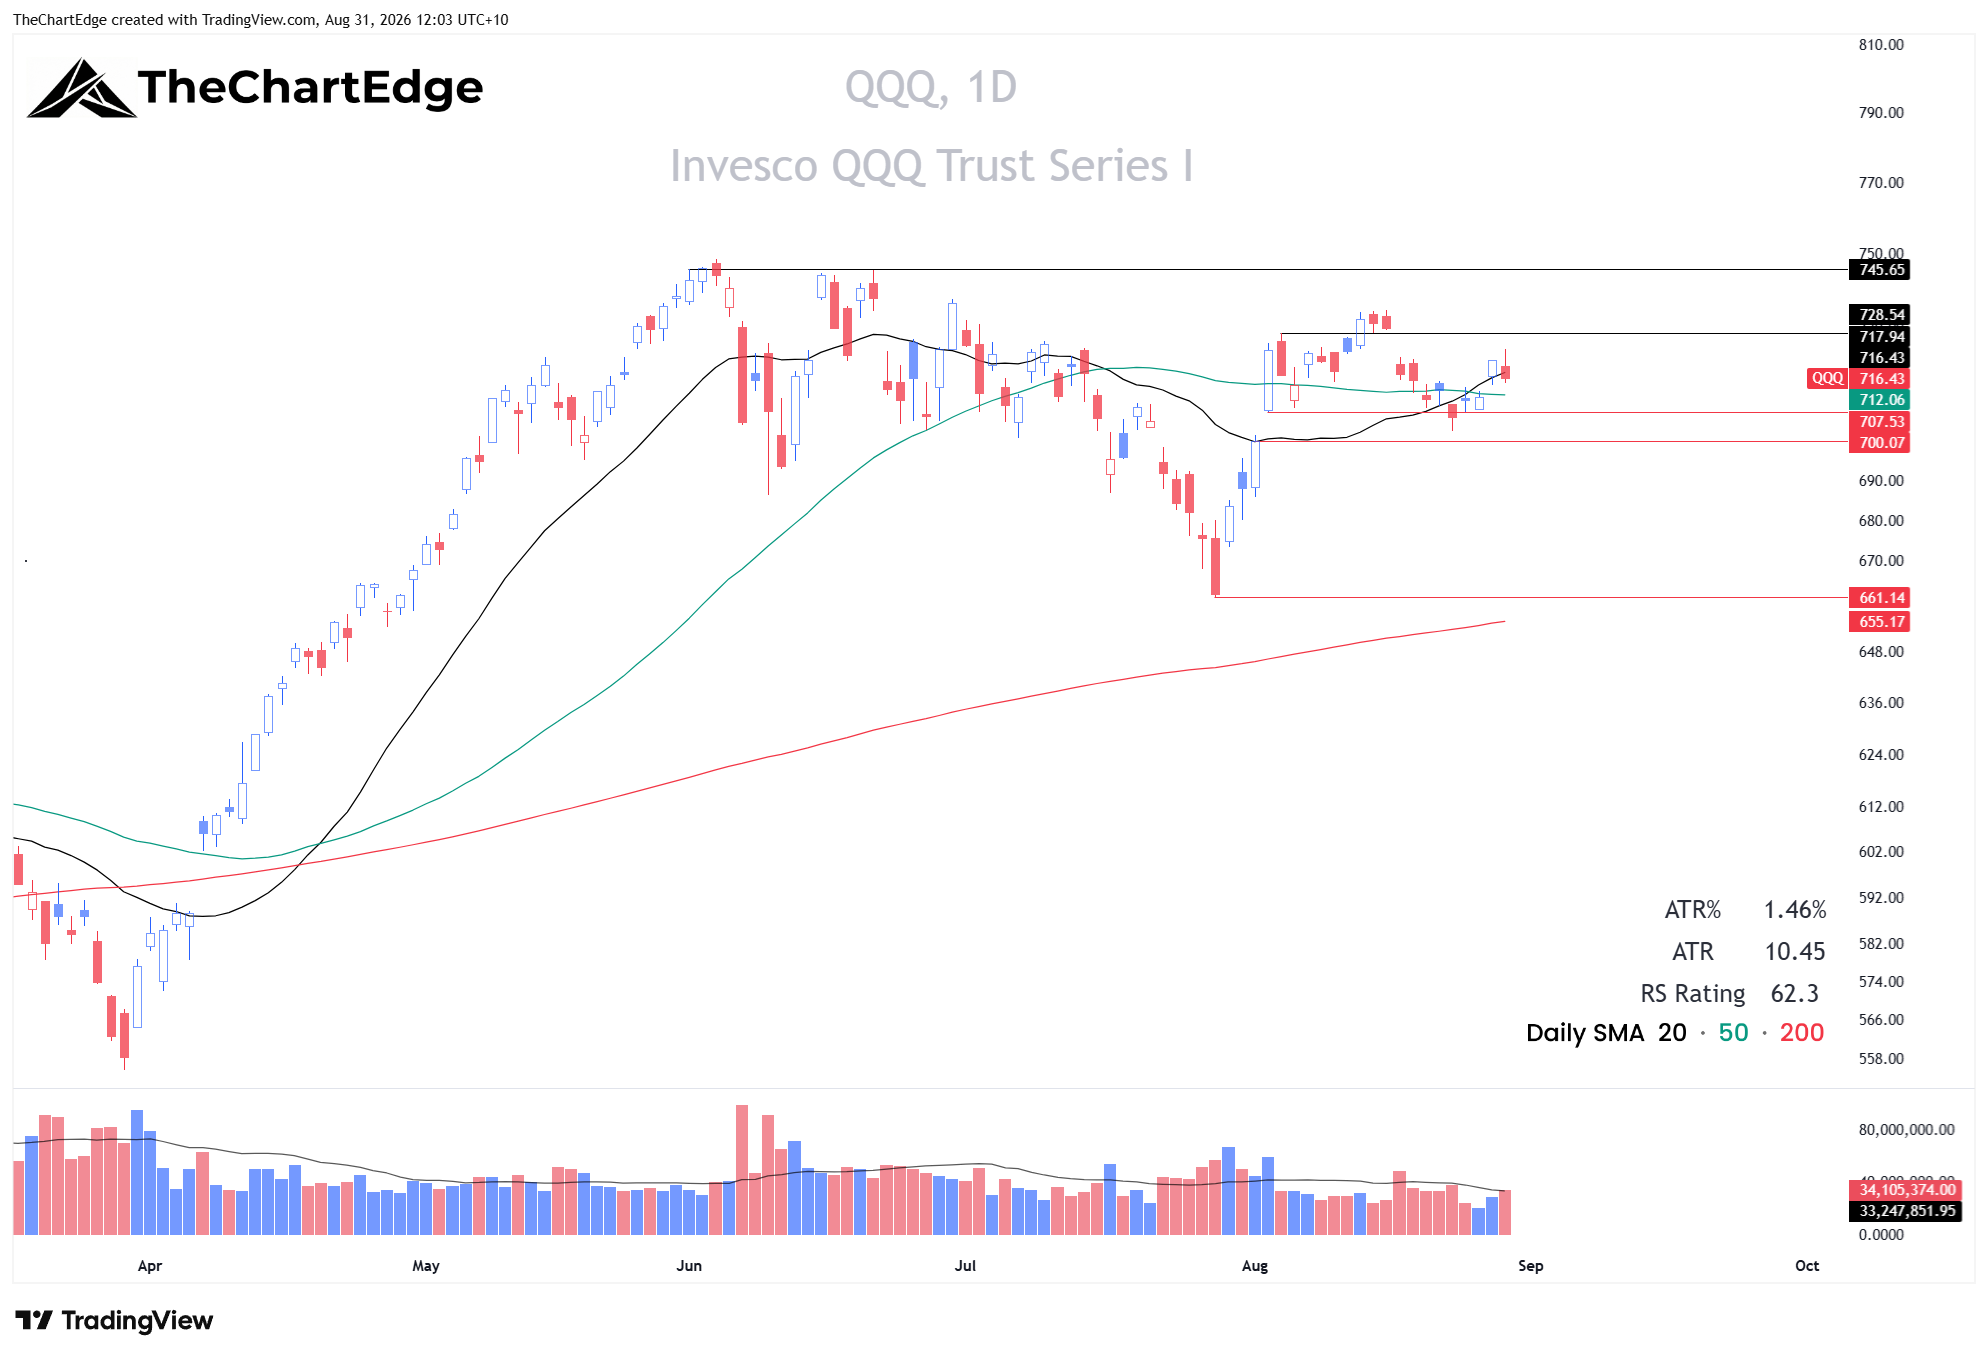
QQQ closed at 716.43, just below its 20-day SMA but above the 50-day and thus improved its trend state to Uptrend. On Monday it undercut 709 but reclaimed it on Tuesday and stayed above for the rest of the week. In fact, until Friday the chart was shaping up quite nicely. If it closed a point and a half higher (above the 20-day SMA), it would have been back in a Strong Uptrend - which is impressive given the recent underperformance of semiconductors and their high concentration in the Nasdaq 100 index, around 25 to 30%. 700 remains my line in the sand. I do not have a position as I didn’t want to buy on Friday going into the Jackson Hole event, despite the strength on Thursday. However, if I did have a position, I would exit if we got a close under 700. If we are materially under 700, the odds of a retest of 661 (the July 29 low) increase.
FNGS Chart
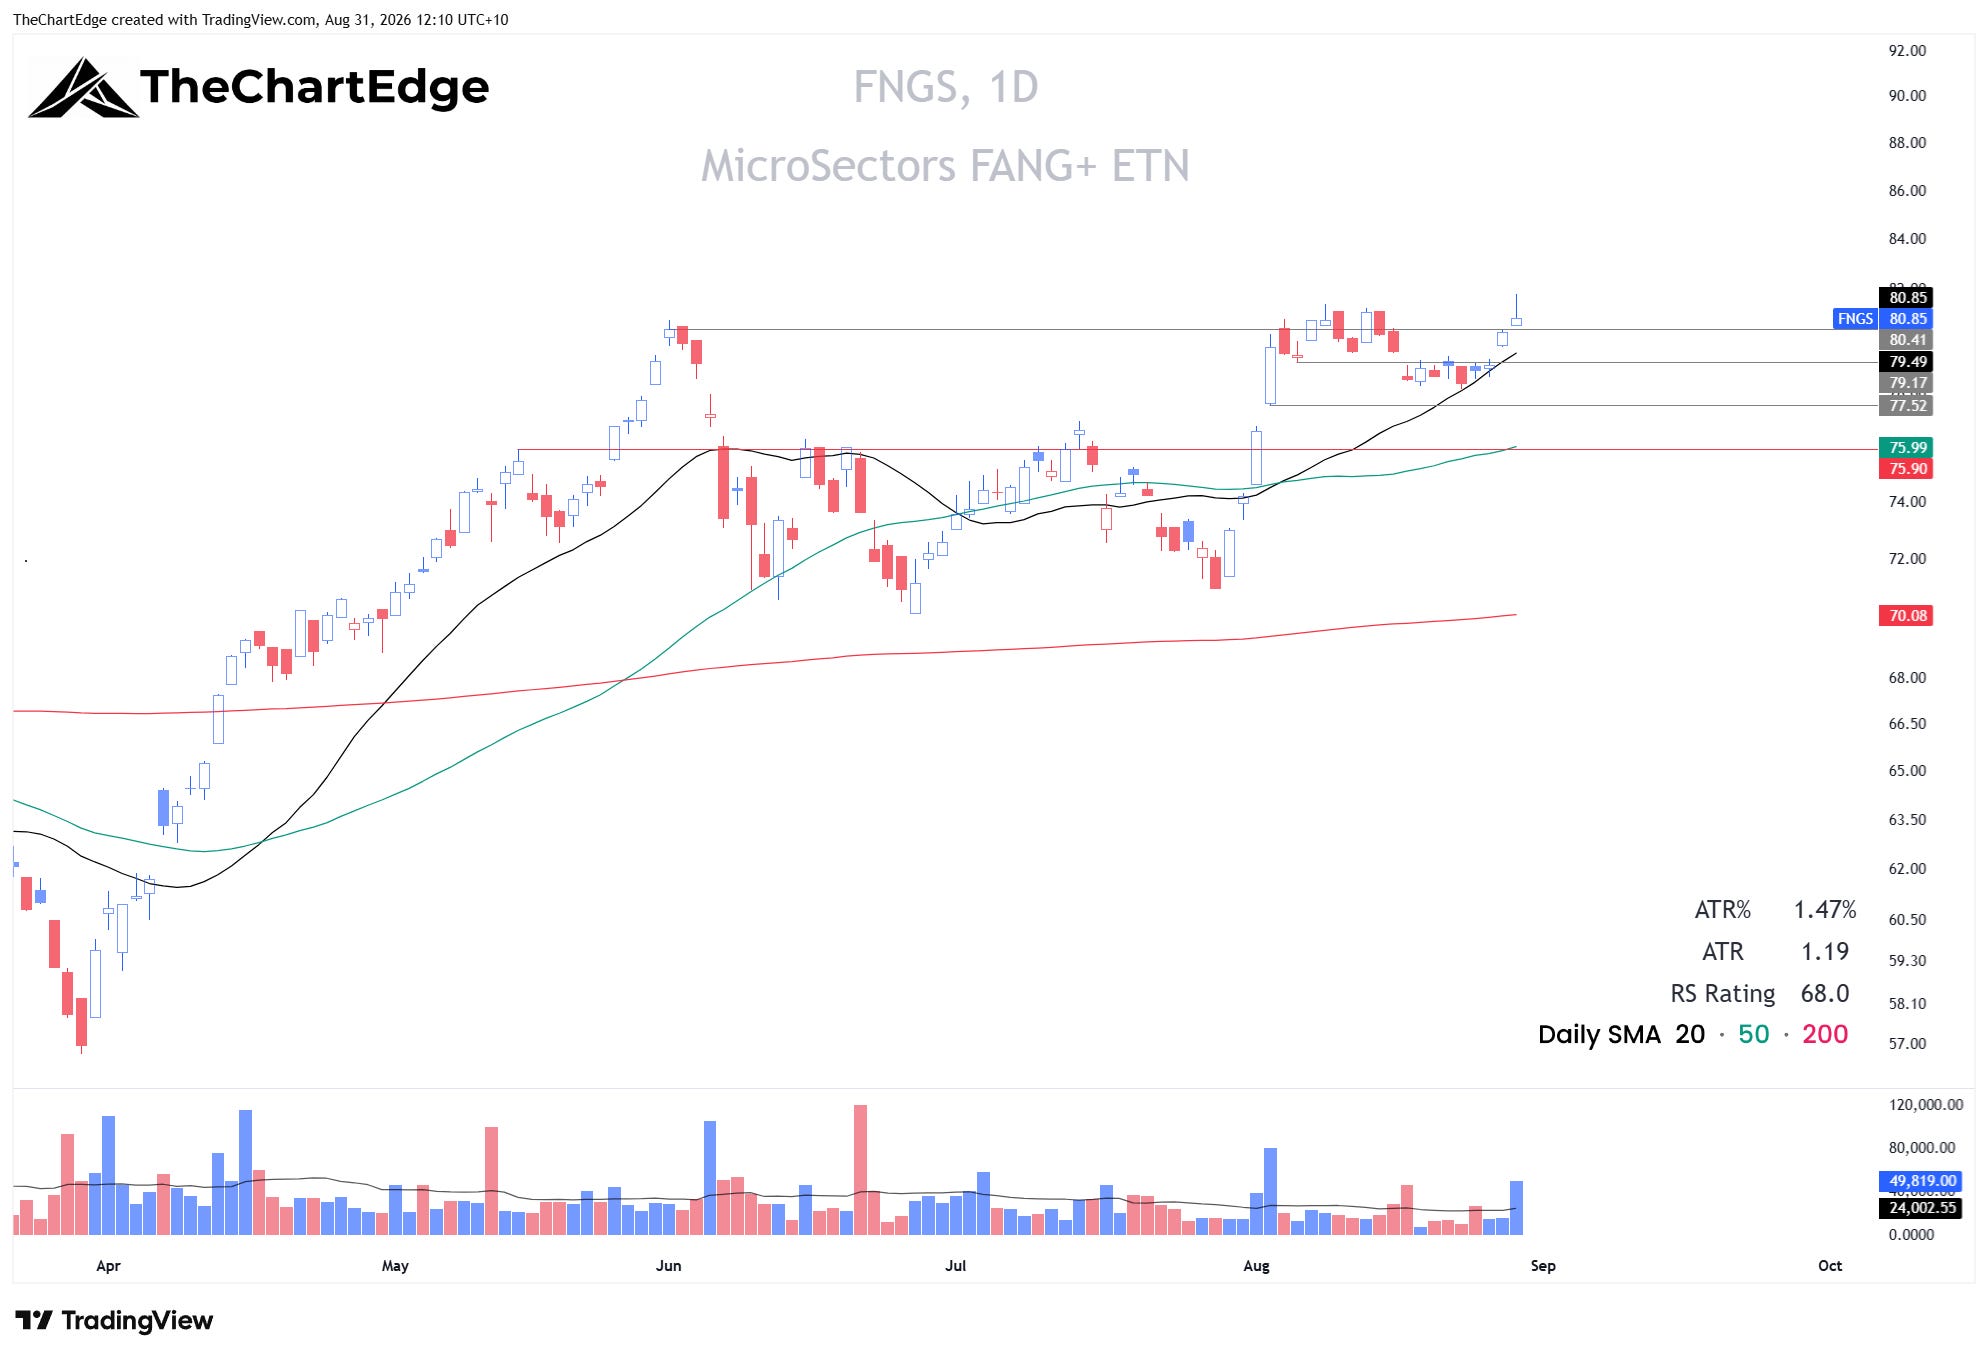
FANG+ (FNGS) closed at 80.85, just eking out a new weekly closing all-time high. I’m considering taking a position - ideally it can consolidate and tighten up around current levels. A small retracement back towards the 20-day SMA followed by some strength could also provide a good entry - with a stop-loss under 77.50. Although, if you wanted to give it a little more room, a stop-loss under the 50-day SMA, which is currently at 76, would be reasonable, despite being nearly 4.5% (almost 3 x ATR) below. If I do take a position, I’ll do it using the FANG+ Index CFD. The 20-day SMA currently sits at 18,475, and I would likely use the low from Monday August 24, which is 18,121.5 as my stop, since the 50-day SMA is all the way down at 17,662.
Market Temperature
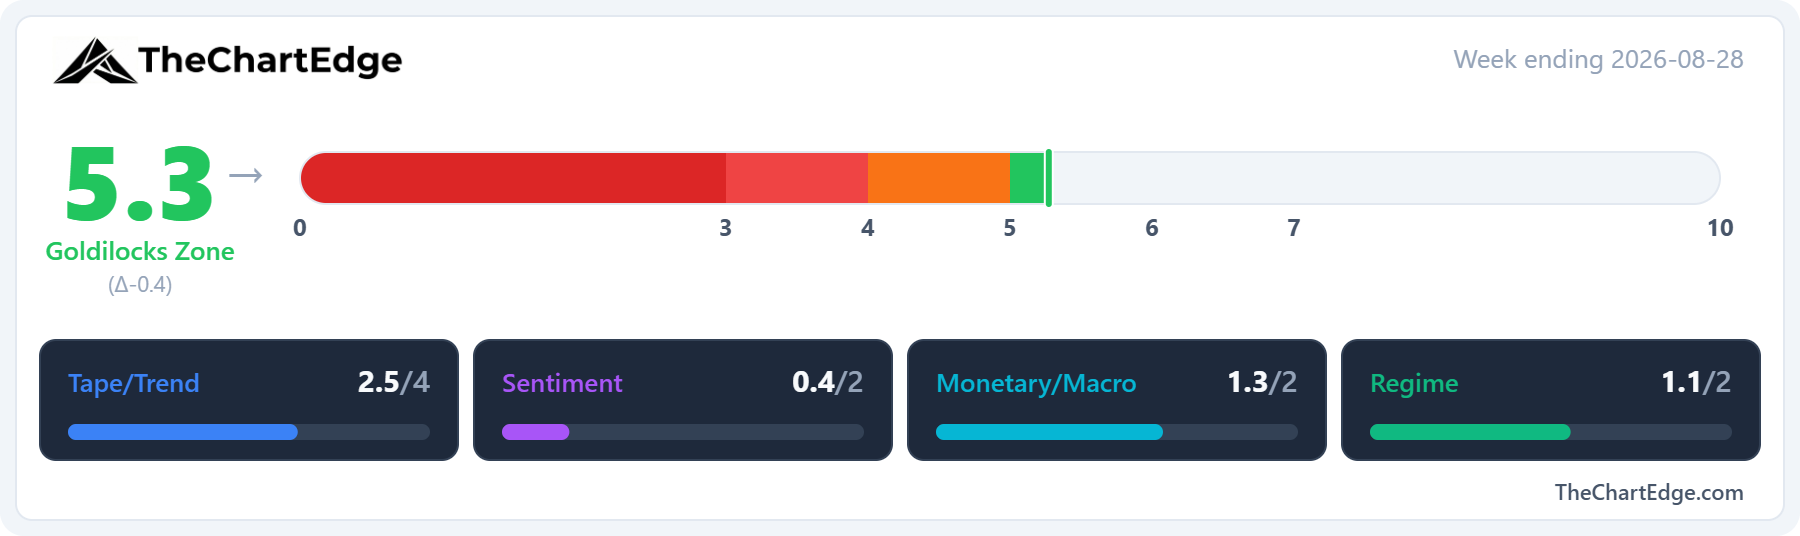
The Market Temperature came in at 5.3, down from 5.7, a fourth straight week in the Goldilocks Zone, although all four pillars were lower.
The Tape/Trend pillar was down slightly. Breadth declined again - 50.7% of US stocks are above their 50-day moving average, from 56.2% - but QQQ improving its trend state to an Uptrend offset the decrease from breadth.
The Monetary/Macro pillar declined the most, with the dollar bouncing 1% and now flat over the model’s four-week lookback.
The Regime pillar also fell, but the XLY/XLP ratio was flat on the week - it scored lower only because of the four-week lookback.
The VIX fell to 14.4 from 15.1, which the model reads as a contrarian negative, so Sentiment was slightly lower - although it was unchanged to one decimal place.
GICS Sector Relative Strength
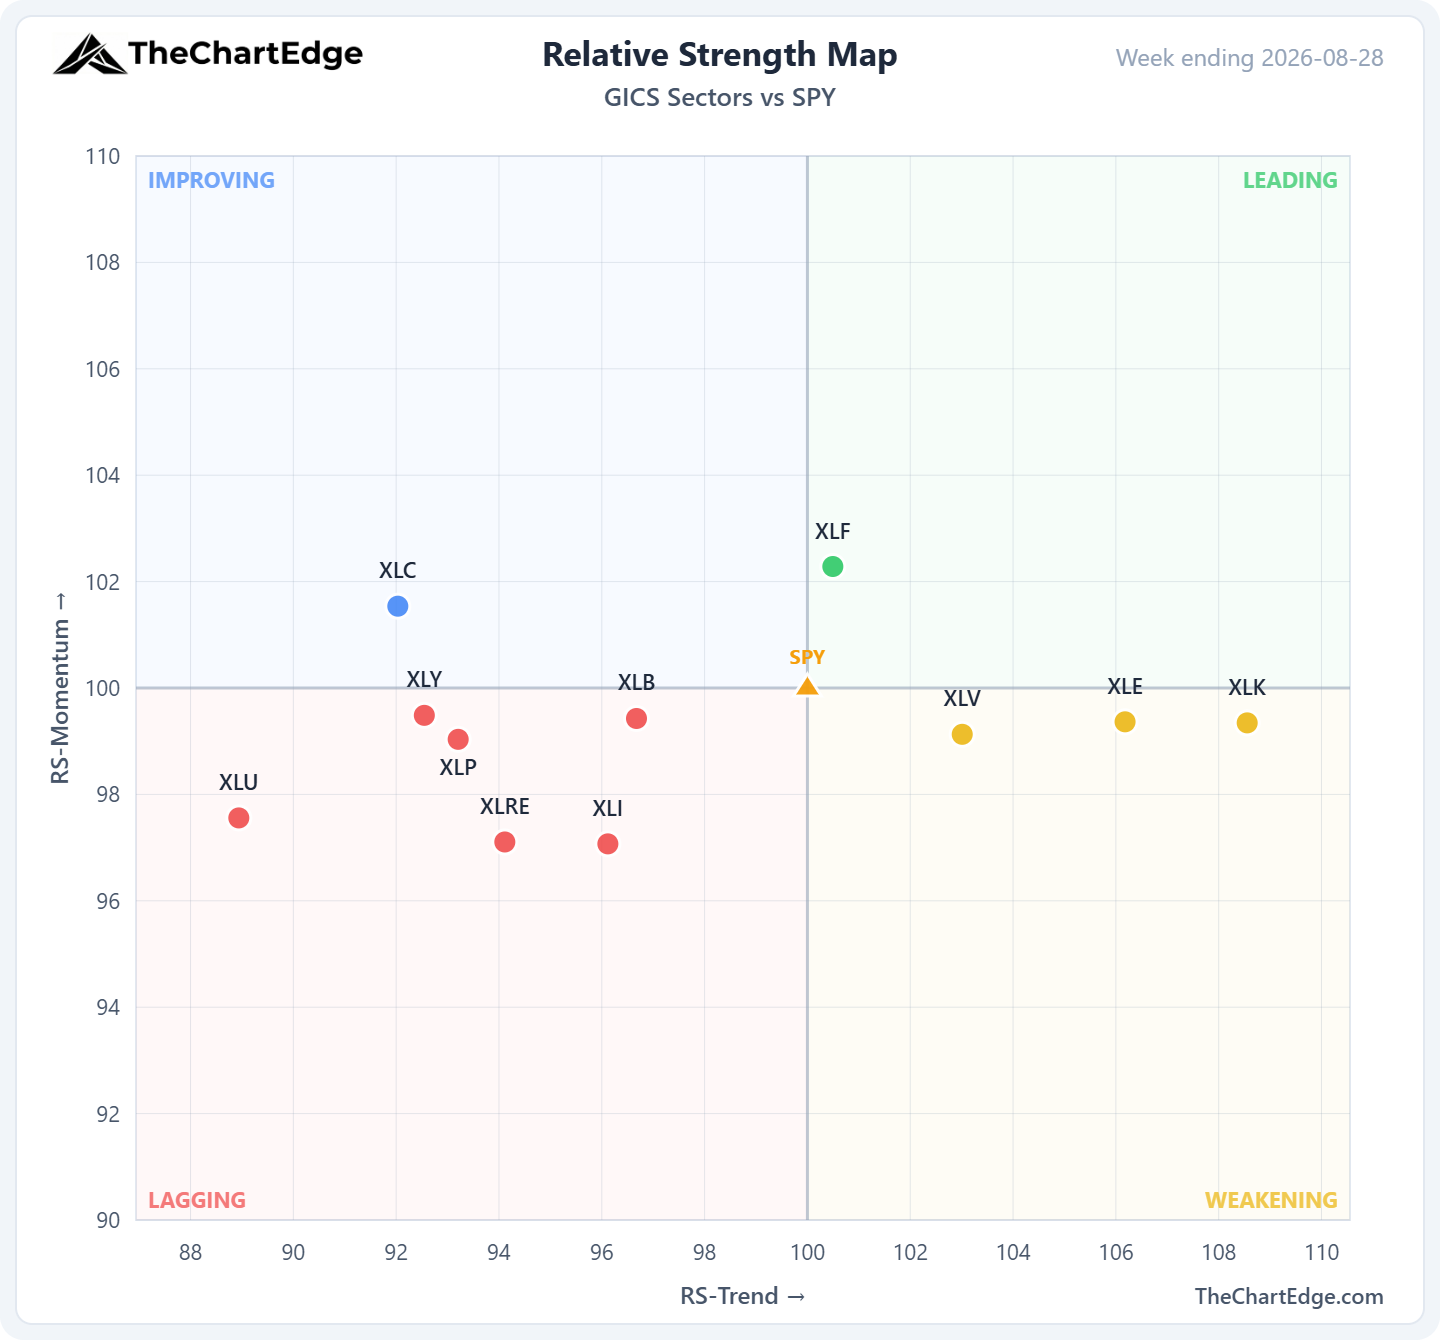
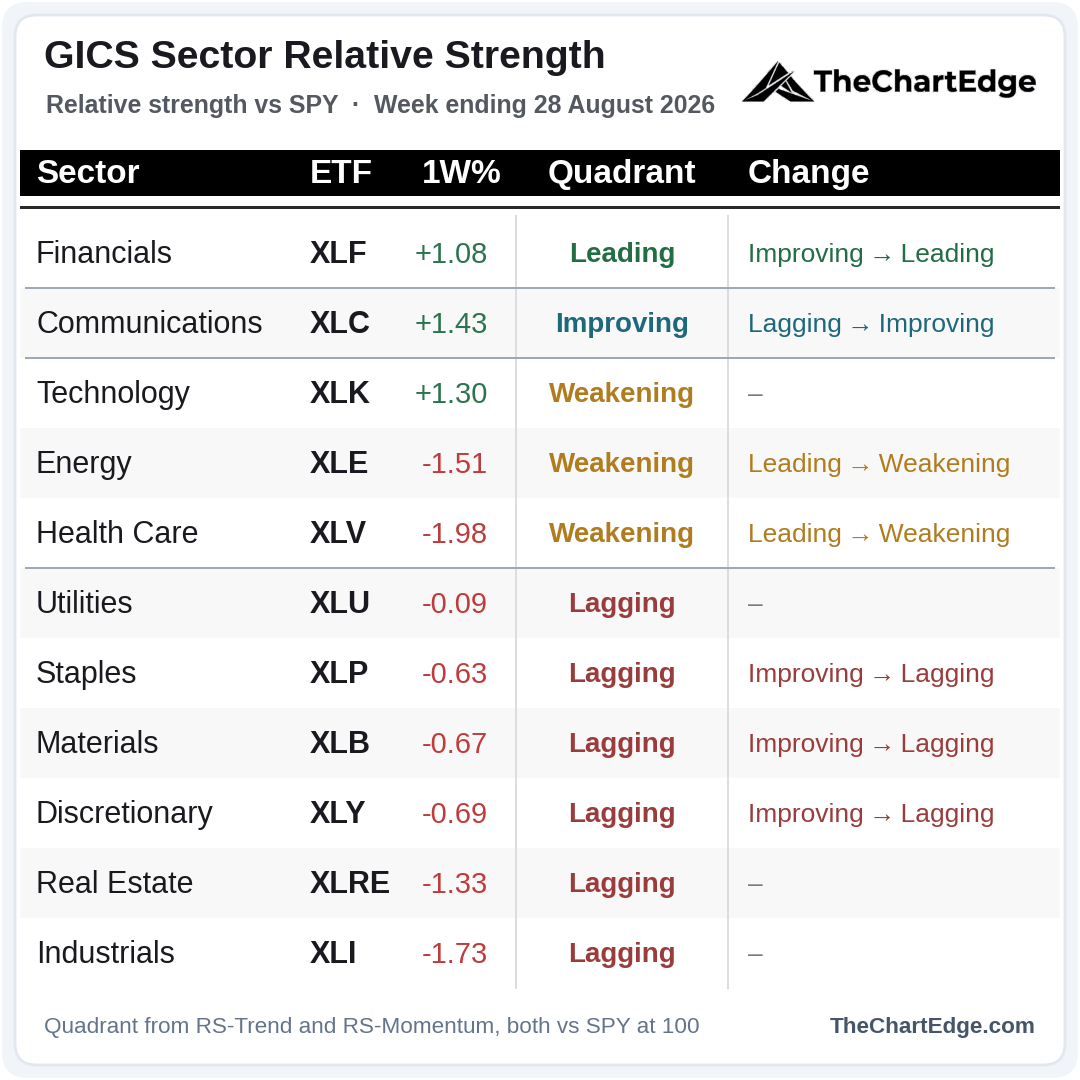
Technology, financials and communications were the only sectors to finish higher.
7 sectors changed quadrant. Financials moved into Leading and is now the only sector there - health care and energy slipped into Weakening, and materials, discretionary and staples fell back into Lagging. Technology is in Weakening for a third week. However, 7 of the 11 sit within a point of a boundary, so I’m not reading too much into any single crossing.
Momentum Leaderboard
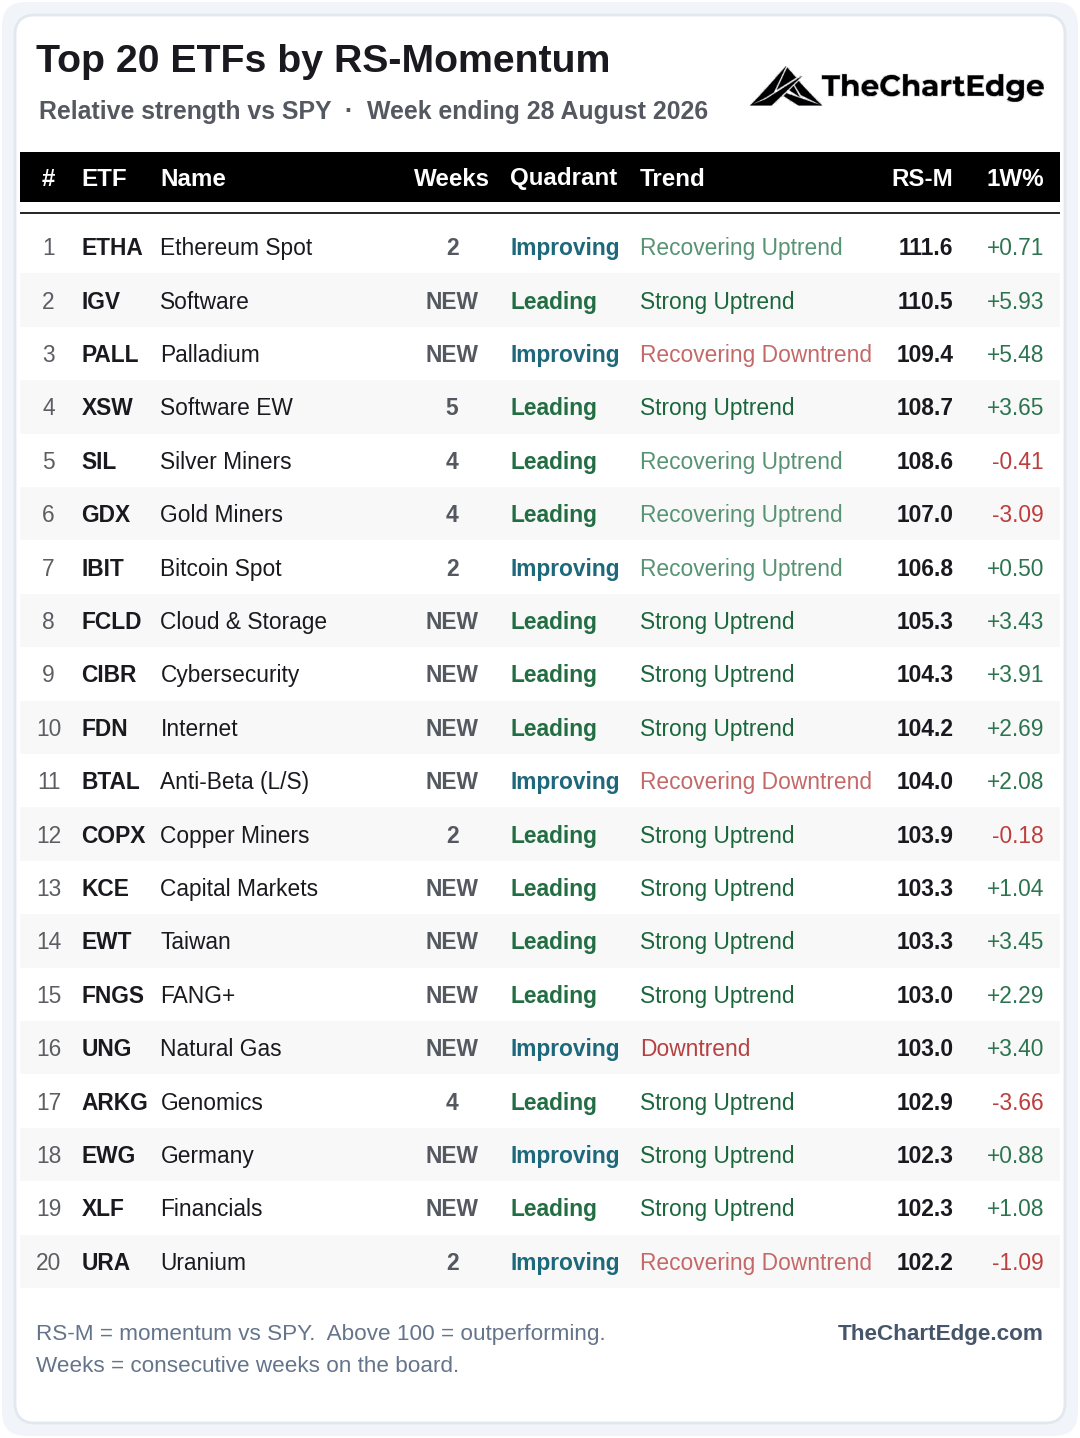
12 of the 20 are new again. Health care and biotech are gone - XPH, XBI, IBB, IHI, RSPH and XLV all dropped off, leaving only Genomics (ARKG). Gold (GLD), silver (SLV) and platinum (PPLT) dropped off as well.
New to the board this weekend are software and tech: Software (IGV) at number two, Cloud Computing (FCLD), Cybersecurity (CIBR), Internet (FDN) and FANG+ (FNGS), plus the financials (KCE & XLF), Taiwan (EWT) and Germany (EWG).
12 of the 20 are in Strong Uptrends, from 8. Equal-weight software (XSW) has the longest streak at five.
Trend States Across the Universe
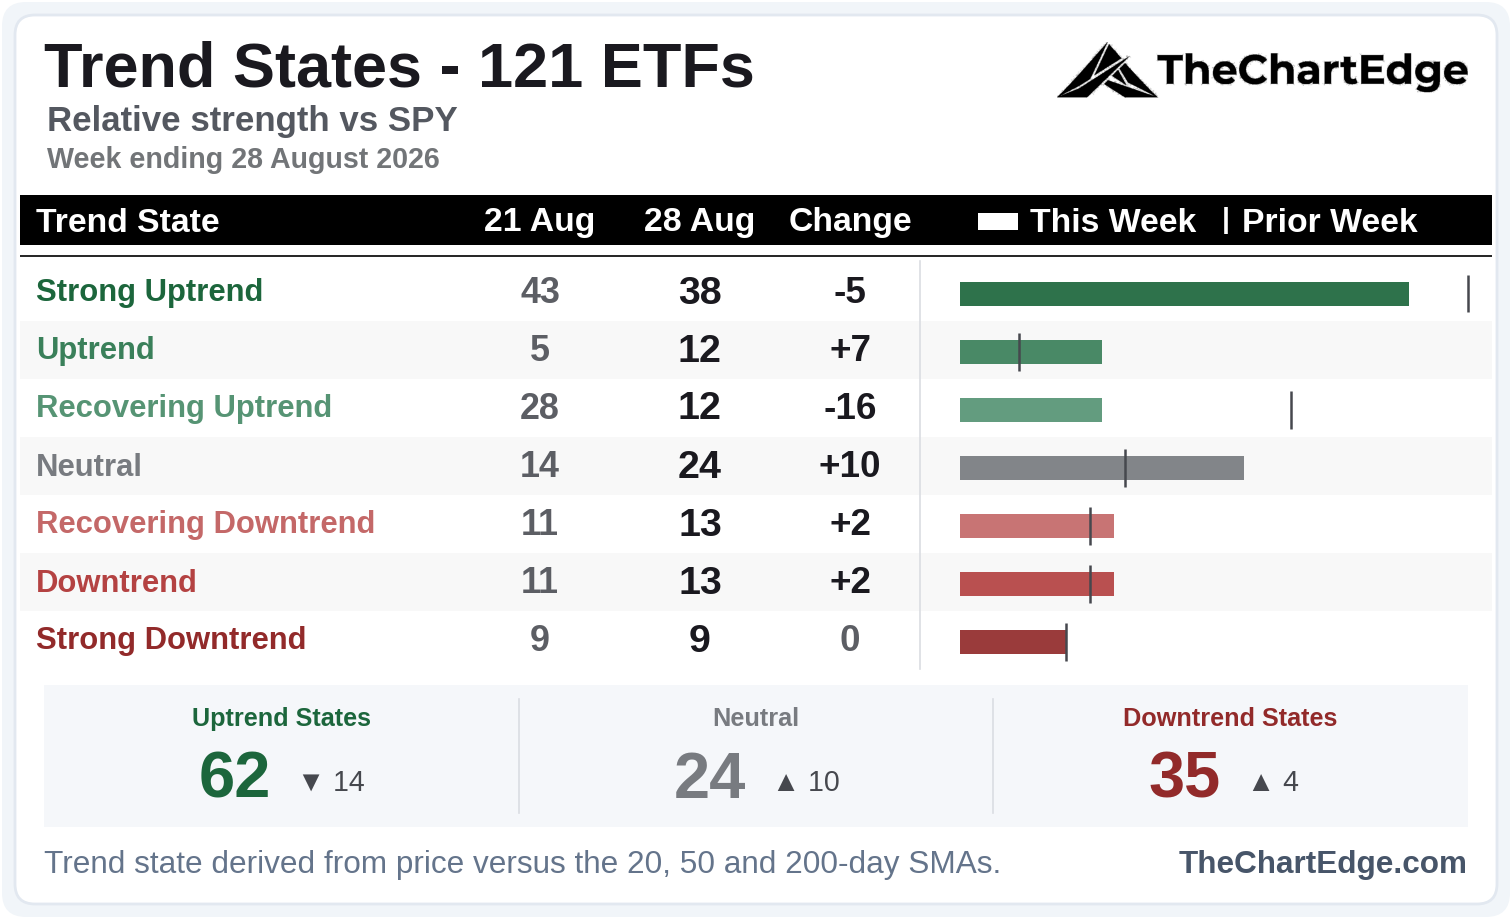
Uptrend states fell from 76 to 62 and Neutral rose from 14 to 24. Most of the downgrades were Recovering Uptrends stalling into Neutral - transports, high beta, quantum, AI, IPOs, space and data centres. Small caps (IWM) and real estate (XLRE) dropped straight into Neutral from Strong Uptrend.
Industry Breadth - Leading Stocks
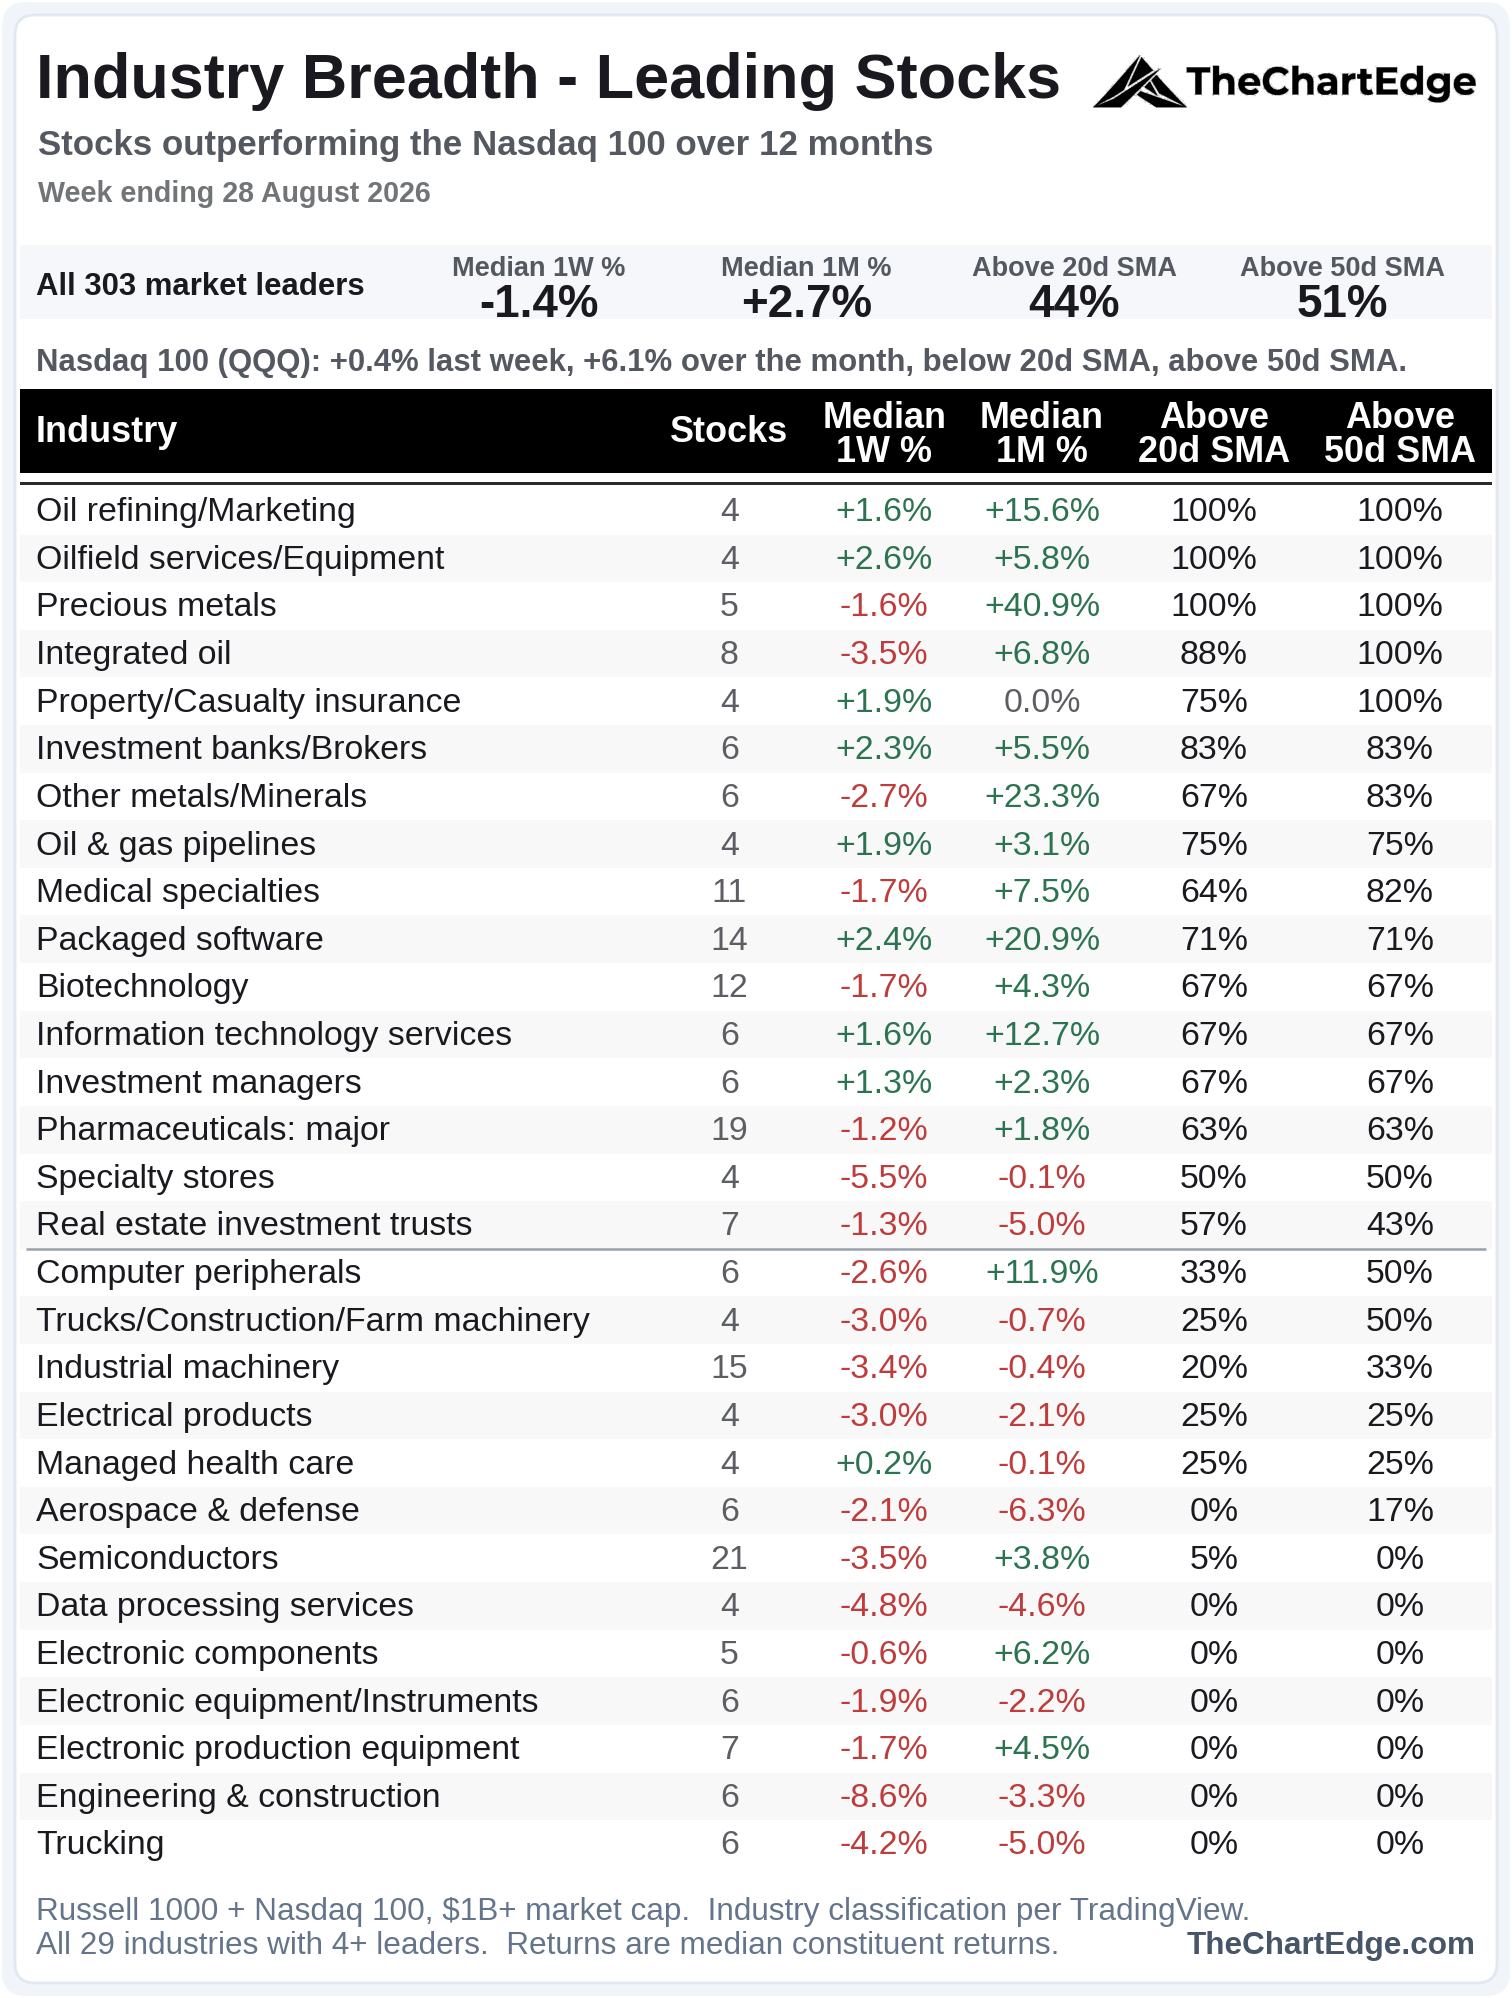
13 of 29 industries sit below the 50% line, from 16 of 33, but that’s mostly because the universe shrank - the number of leaders (stocks in the Nasdaq 100 and/or the Russell 1000 that have outperformed the Nasdaq 100 over the trailing 12 months) fell from 332 to 303. Both bank industries dropped off the board entirely as they have fewer than four qualifying names left (each industry must have at least four names to be included).
Oil and precious metals still hold the top of the board.
Of the 8 technology industries on the board, only packaged software and IT services are above the 50% line. 5 of the other 6 have no names above their 20-day SMA. Semiconductors has 1 of its 21 names (Micron) above the 20-day and none above the 50-day, despite a broadly strong Thursday following Nvidia’s earnings beat.
Semis Still Struggling
SMH Chart
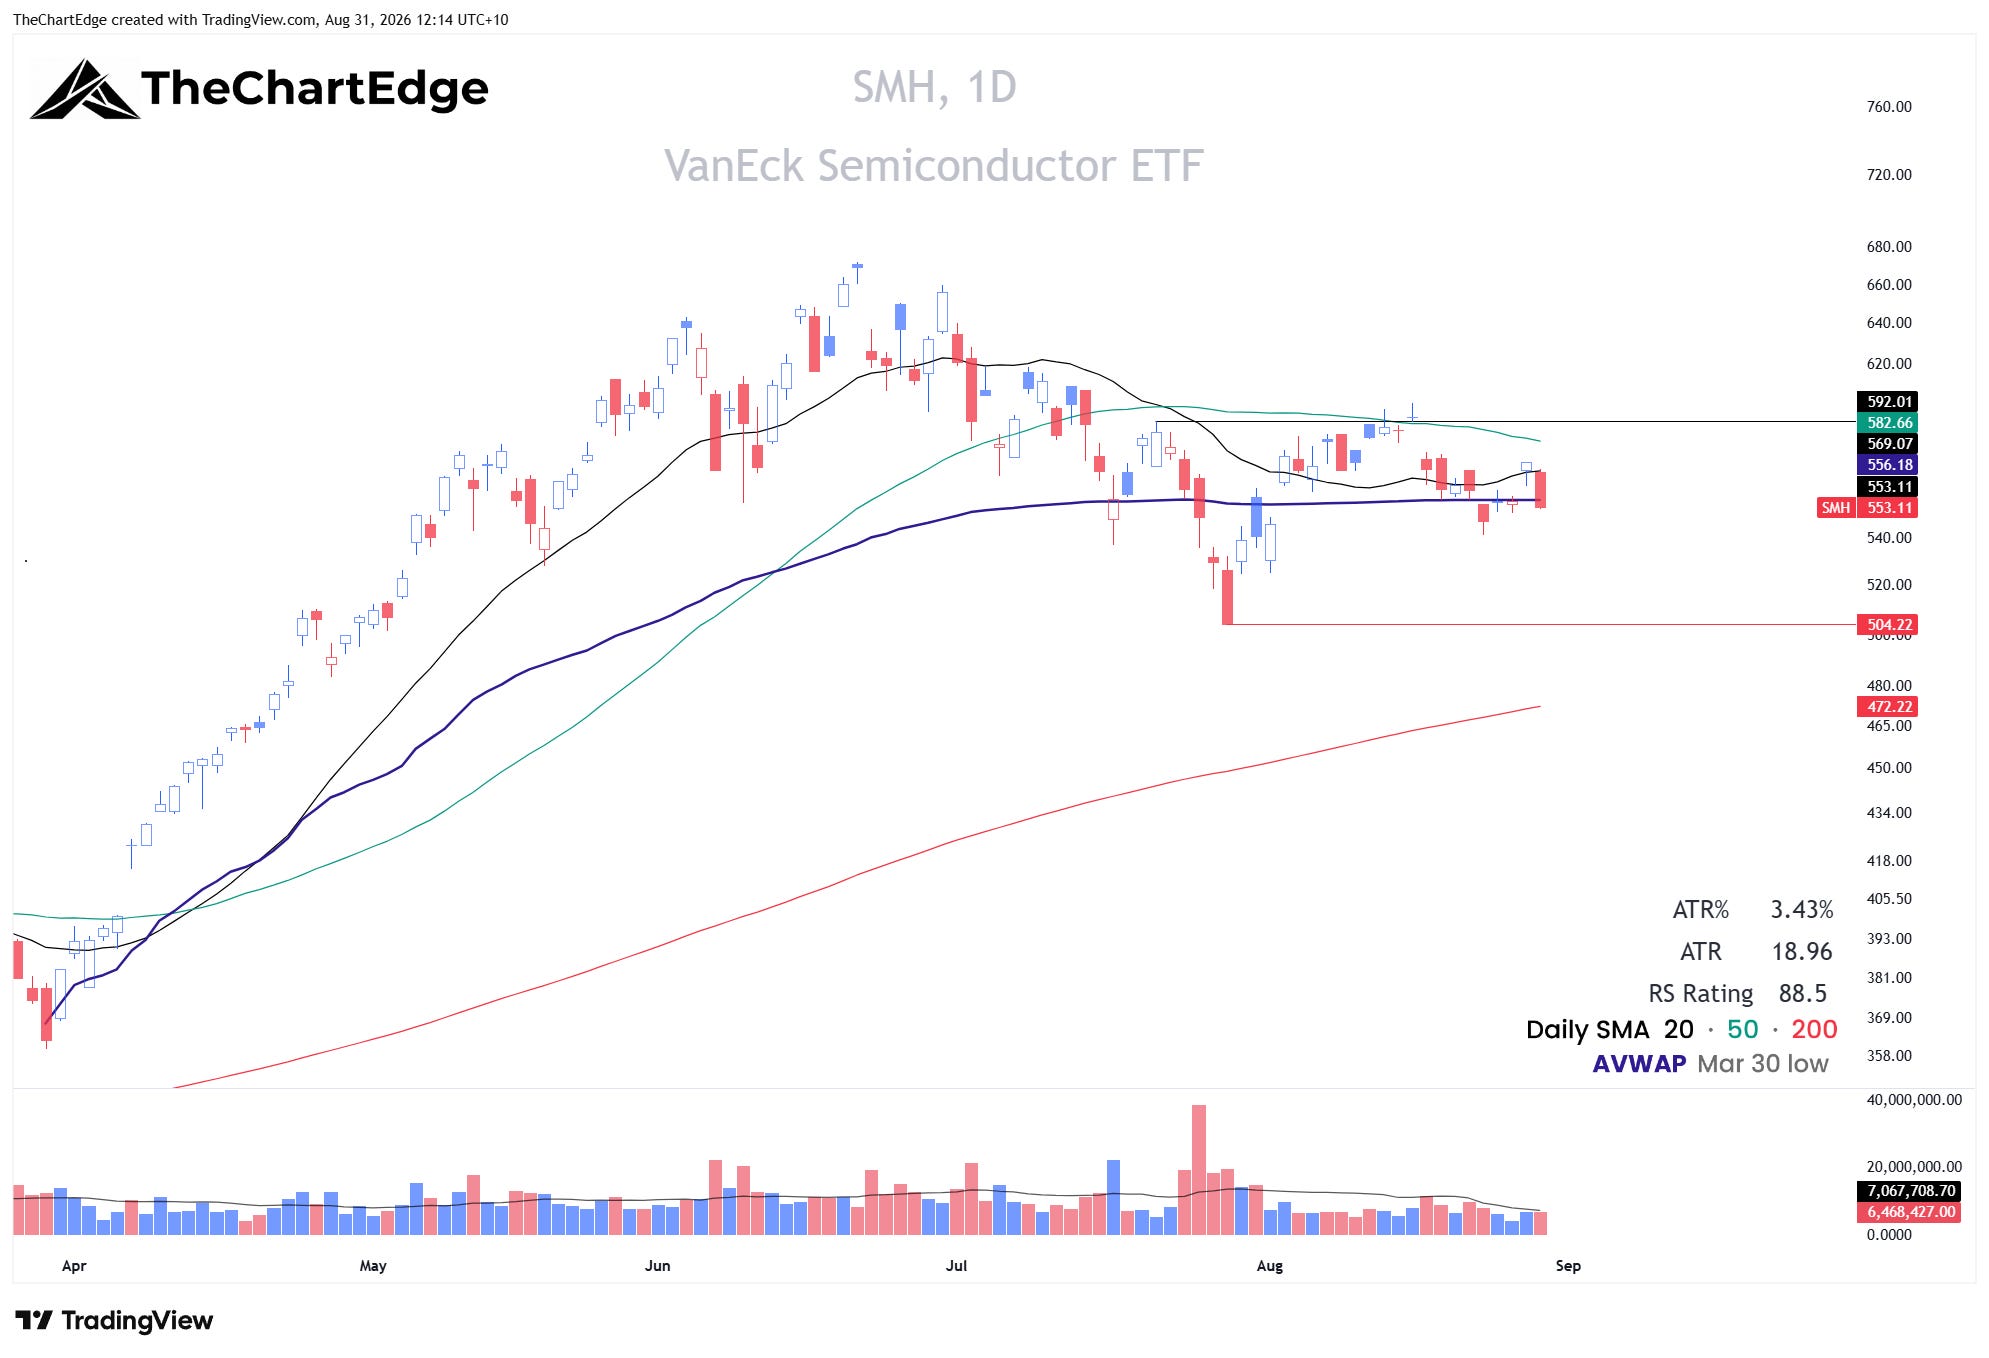
For consistency, I will continue to follow up on the semis. However, we’re still stuck in the range I have been discussing for a few weeks. SMH fell 1.3% and closed at 553.11, marginally below the AVWAP from the March 30 low and below its 20 and 50-day SMAs. Thursday’s gains were totally erased on Friday - not what the bulls wanted to see.
Software Breaks Out
XSW Chart
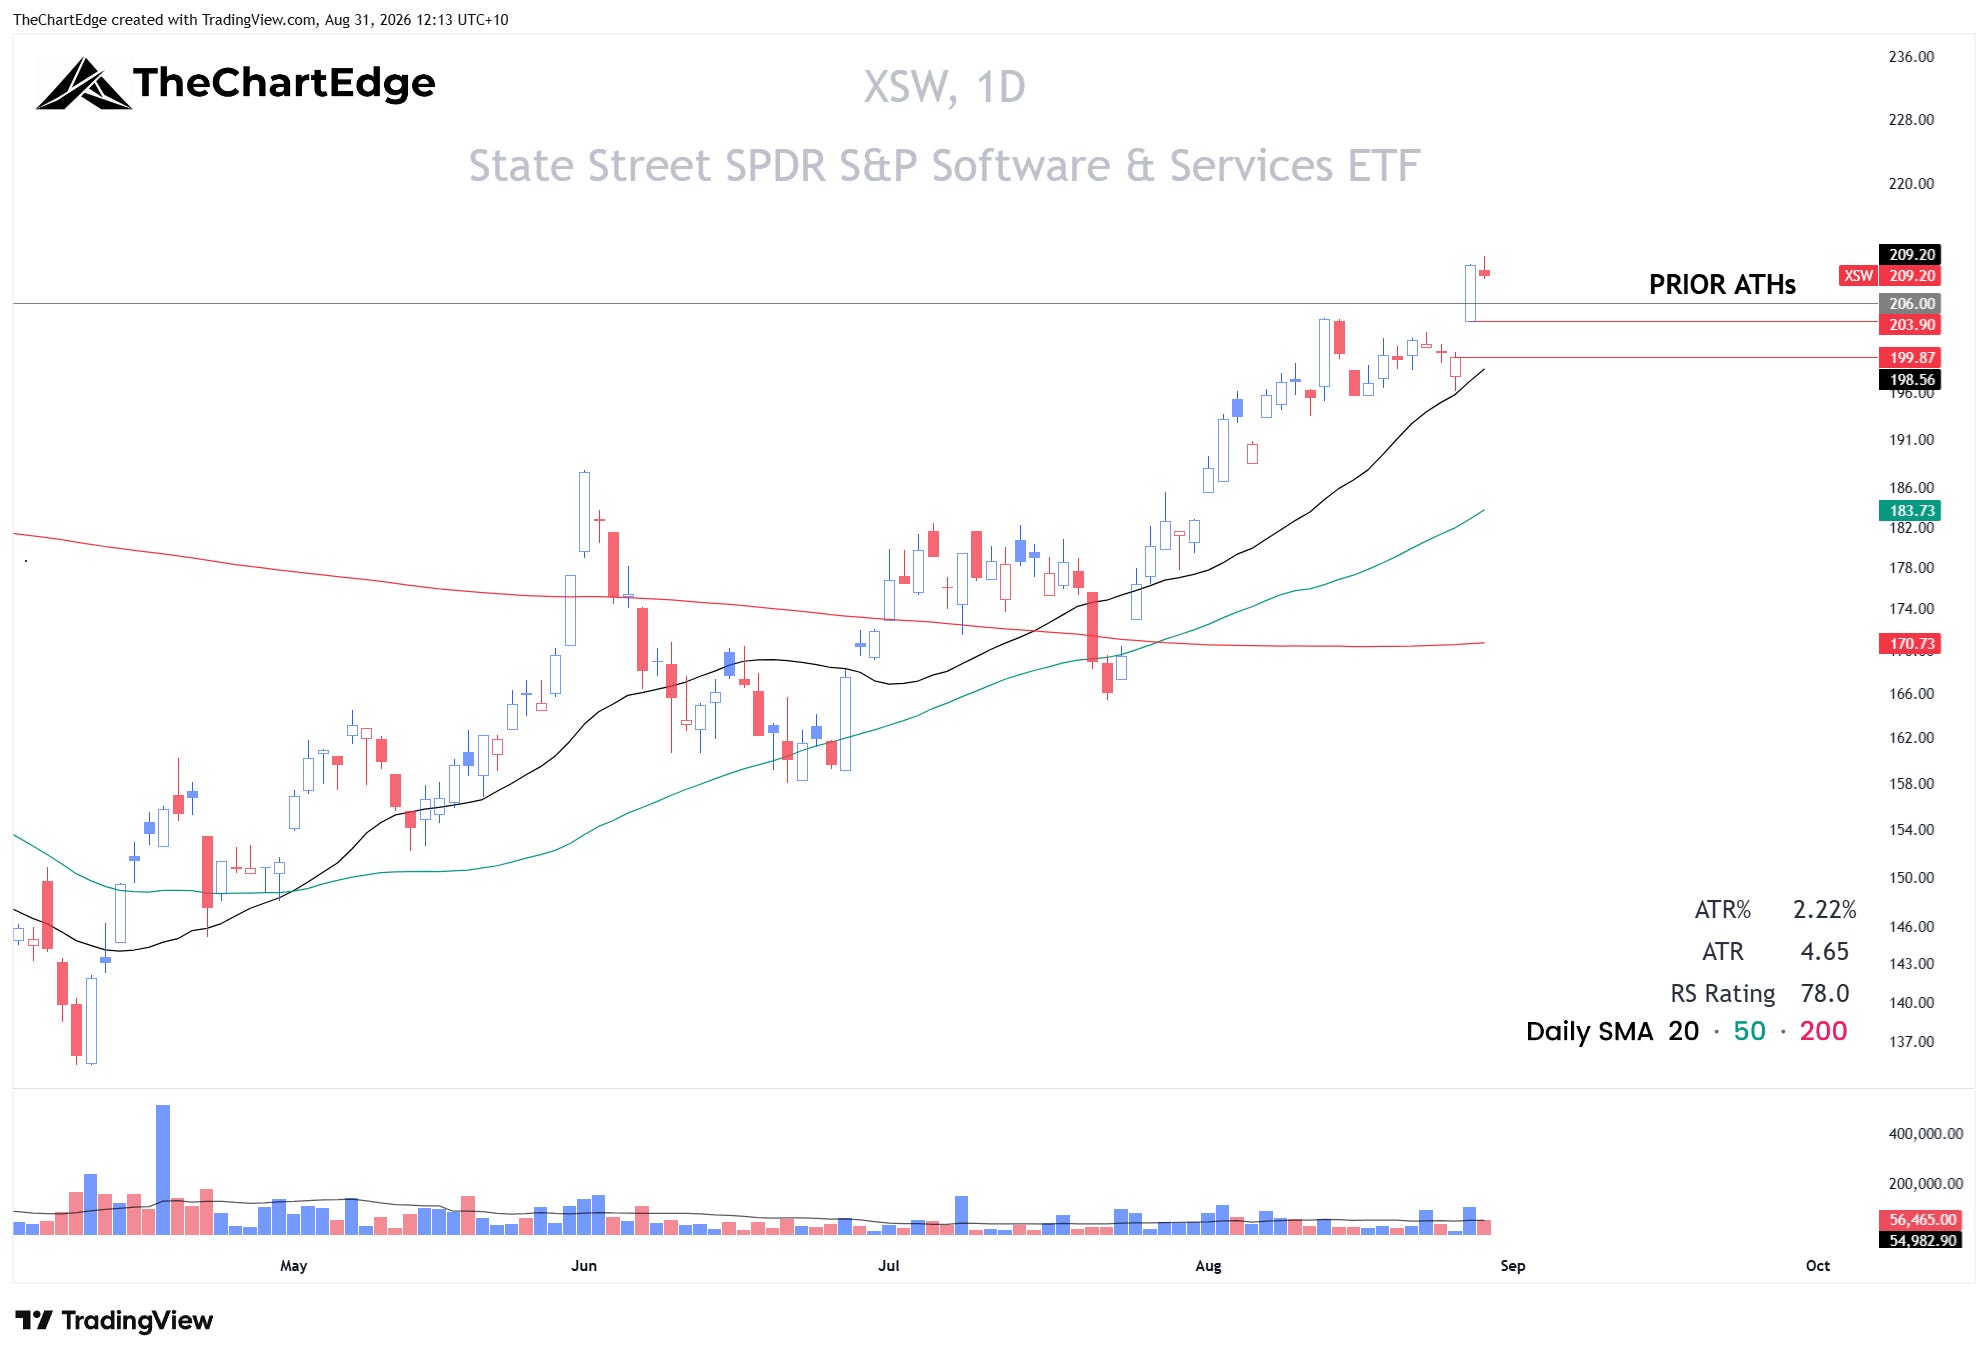
Equal-weight software (XSW) broke out to all-time highs on Thursday, clearing the December 2024 and September/October 2025 highs at 206, and closed the week at 209.20. Software (IGV) was the best ETF in the universe, up 5.9%.
I’m looking to take a position in XSW on a retracement back towards 205-206, with a stop under the 20-day SMA, around 197.50. Anyone more aggressive could use Thursday’s low at 203.90, but I’m going to give it a bit more room.
Gold and Silver Fail at the 200-Day
GLD Chart
SLV Chart
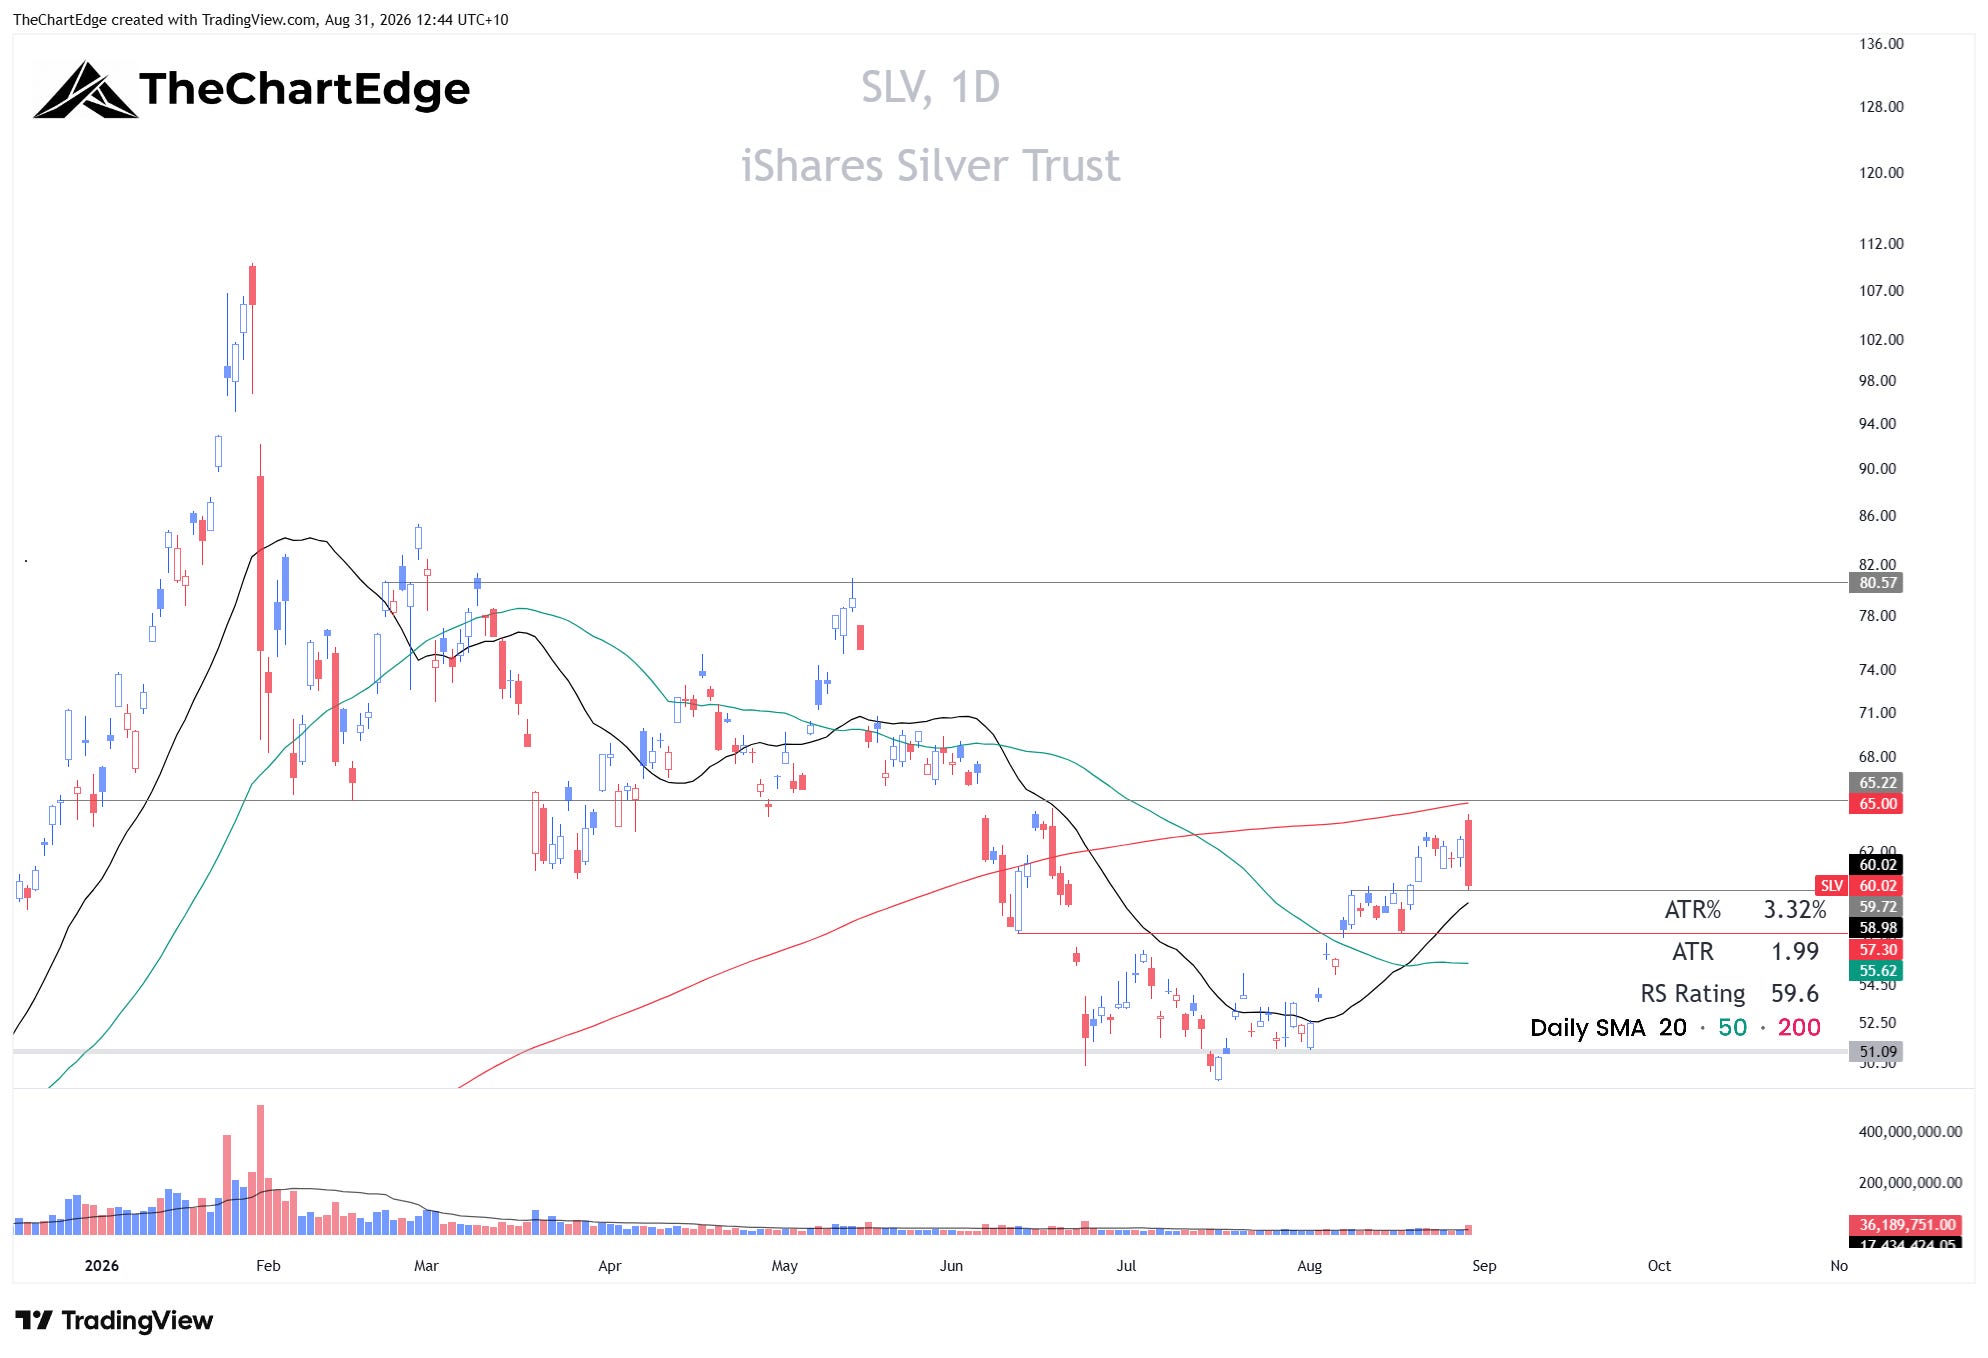
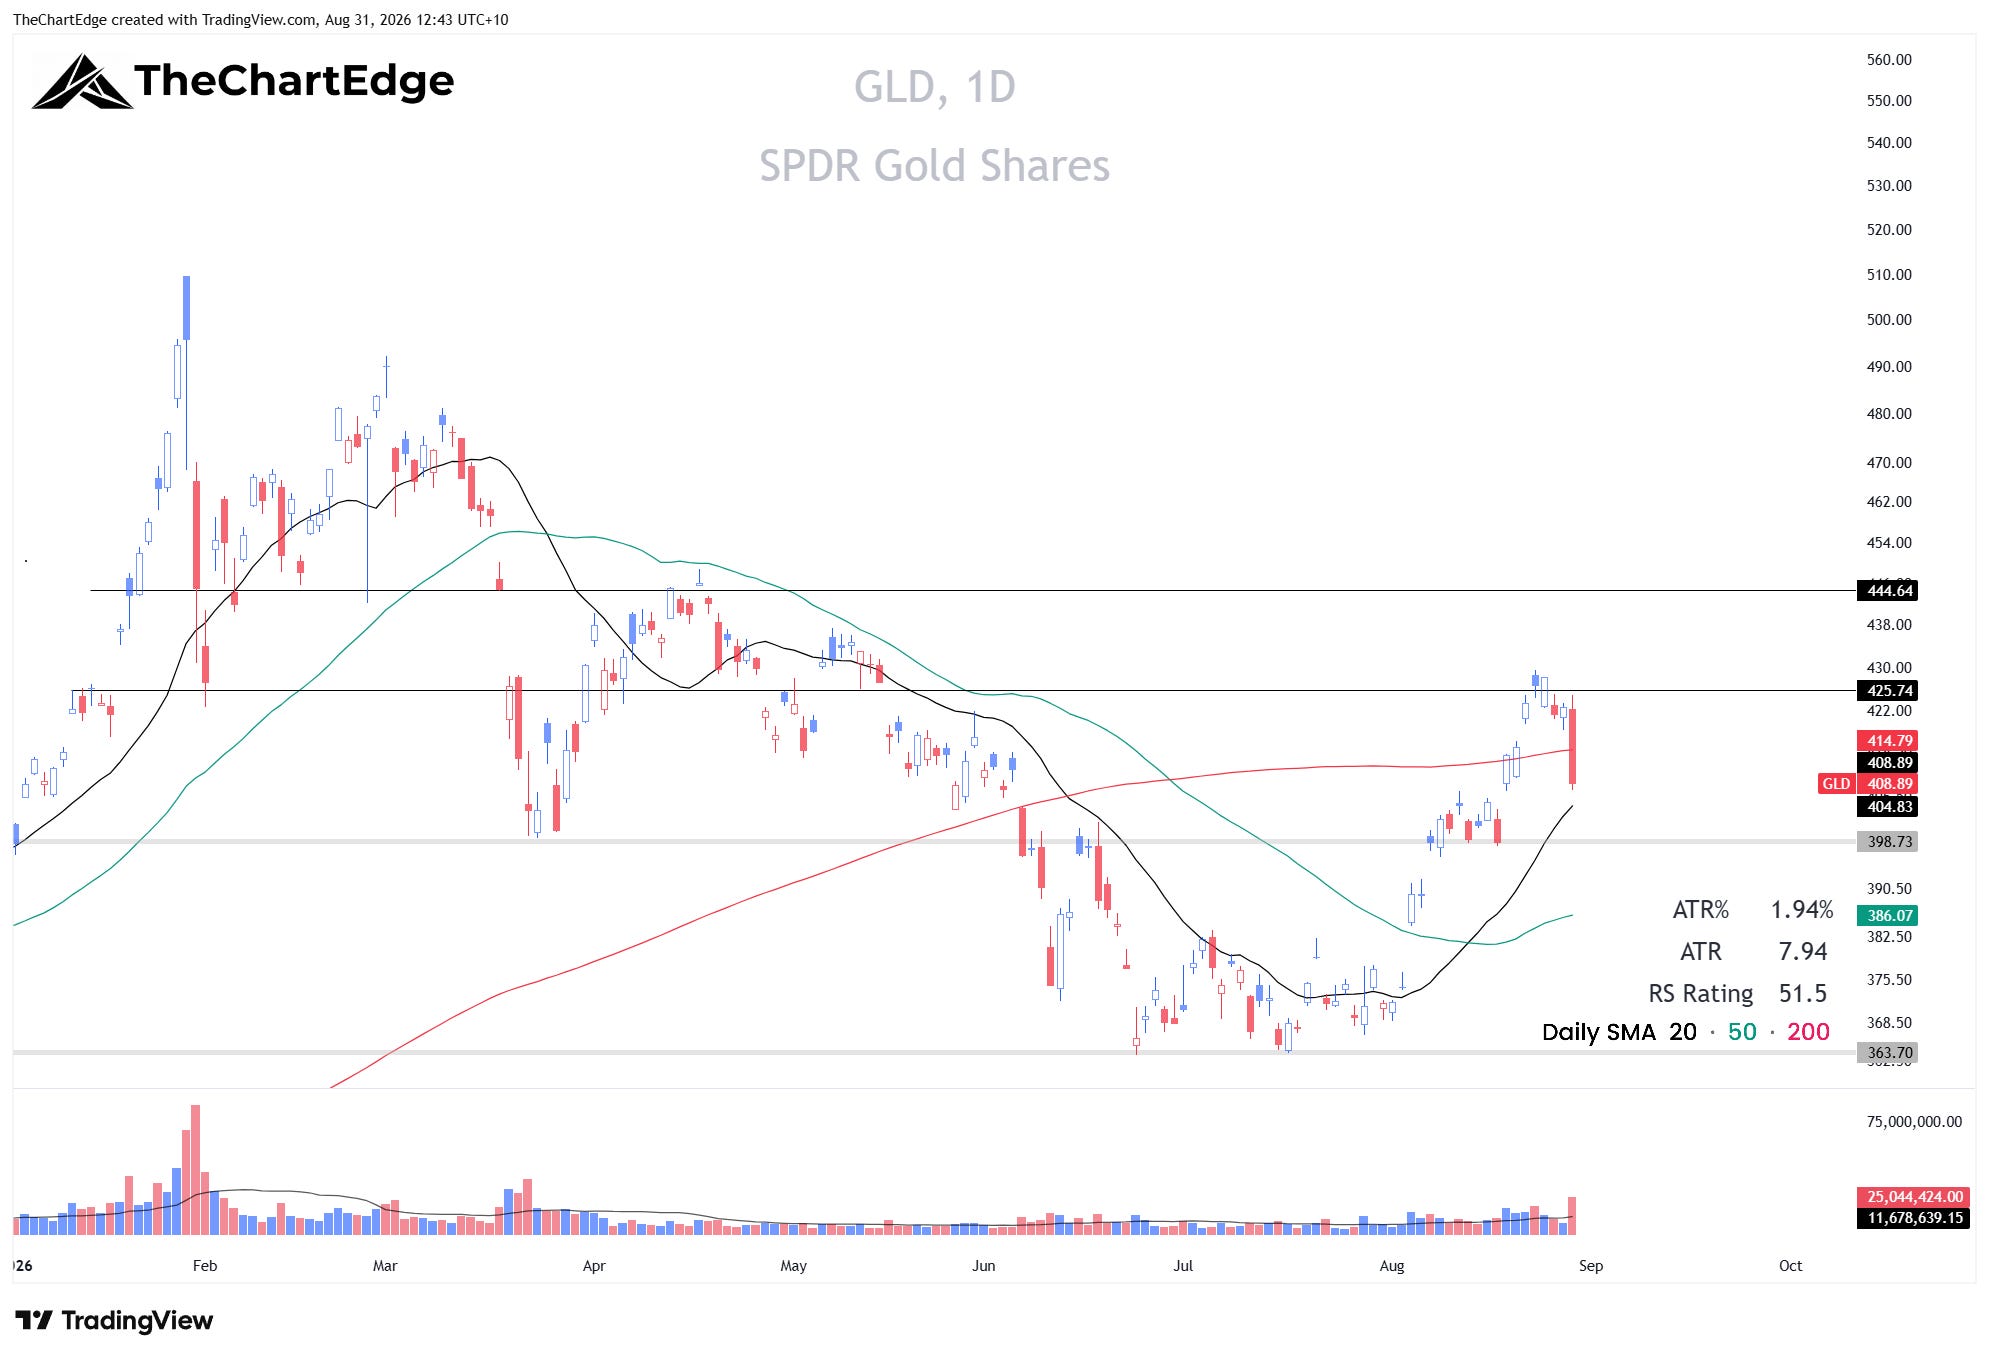
Last week I said I wouldn’t be surprised to see silver follow gold through its 200-day SMA. Instead, silver (SLV) was rejected just below its 200-day on Friday - reversing hard and printing a very ugly looking candle. It was down 4.3% for the week. Gold (GLD) closed at 408.89, back below its 200-day after clearing it the week before. Very nasty candles on both.
GDX Chart
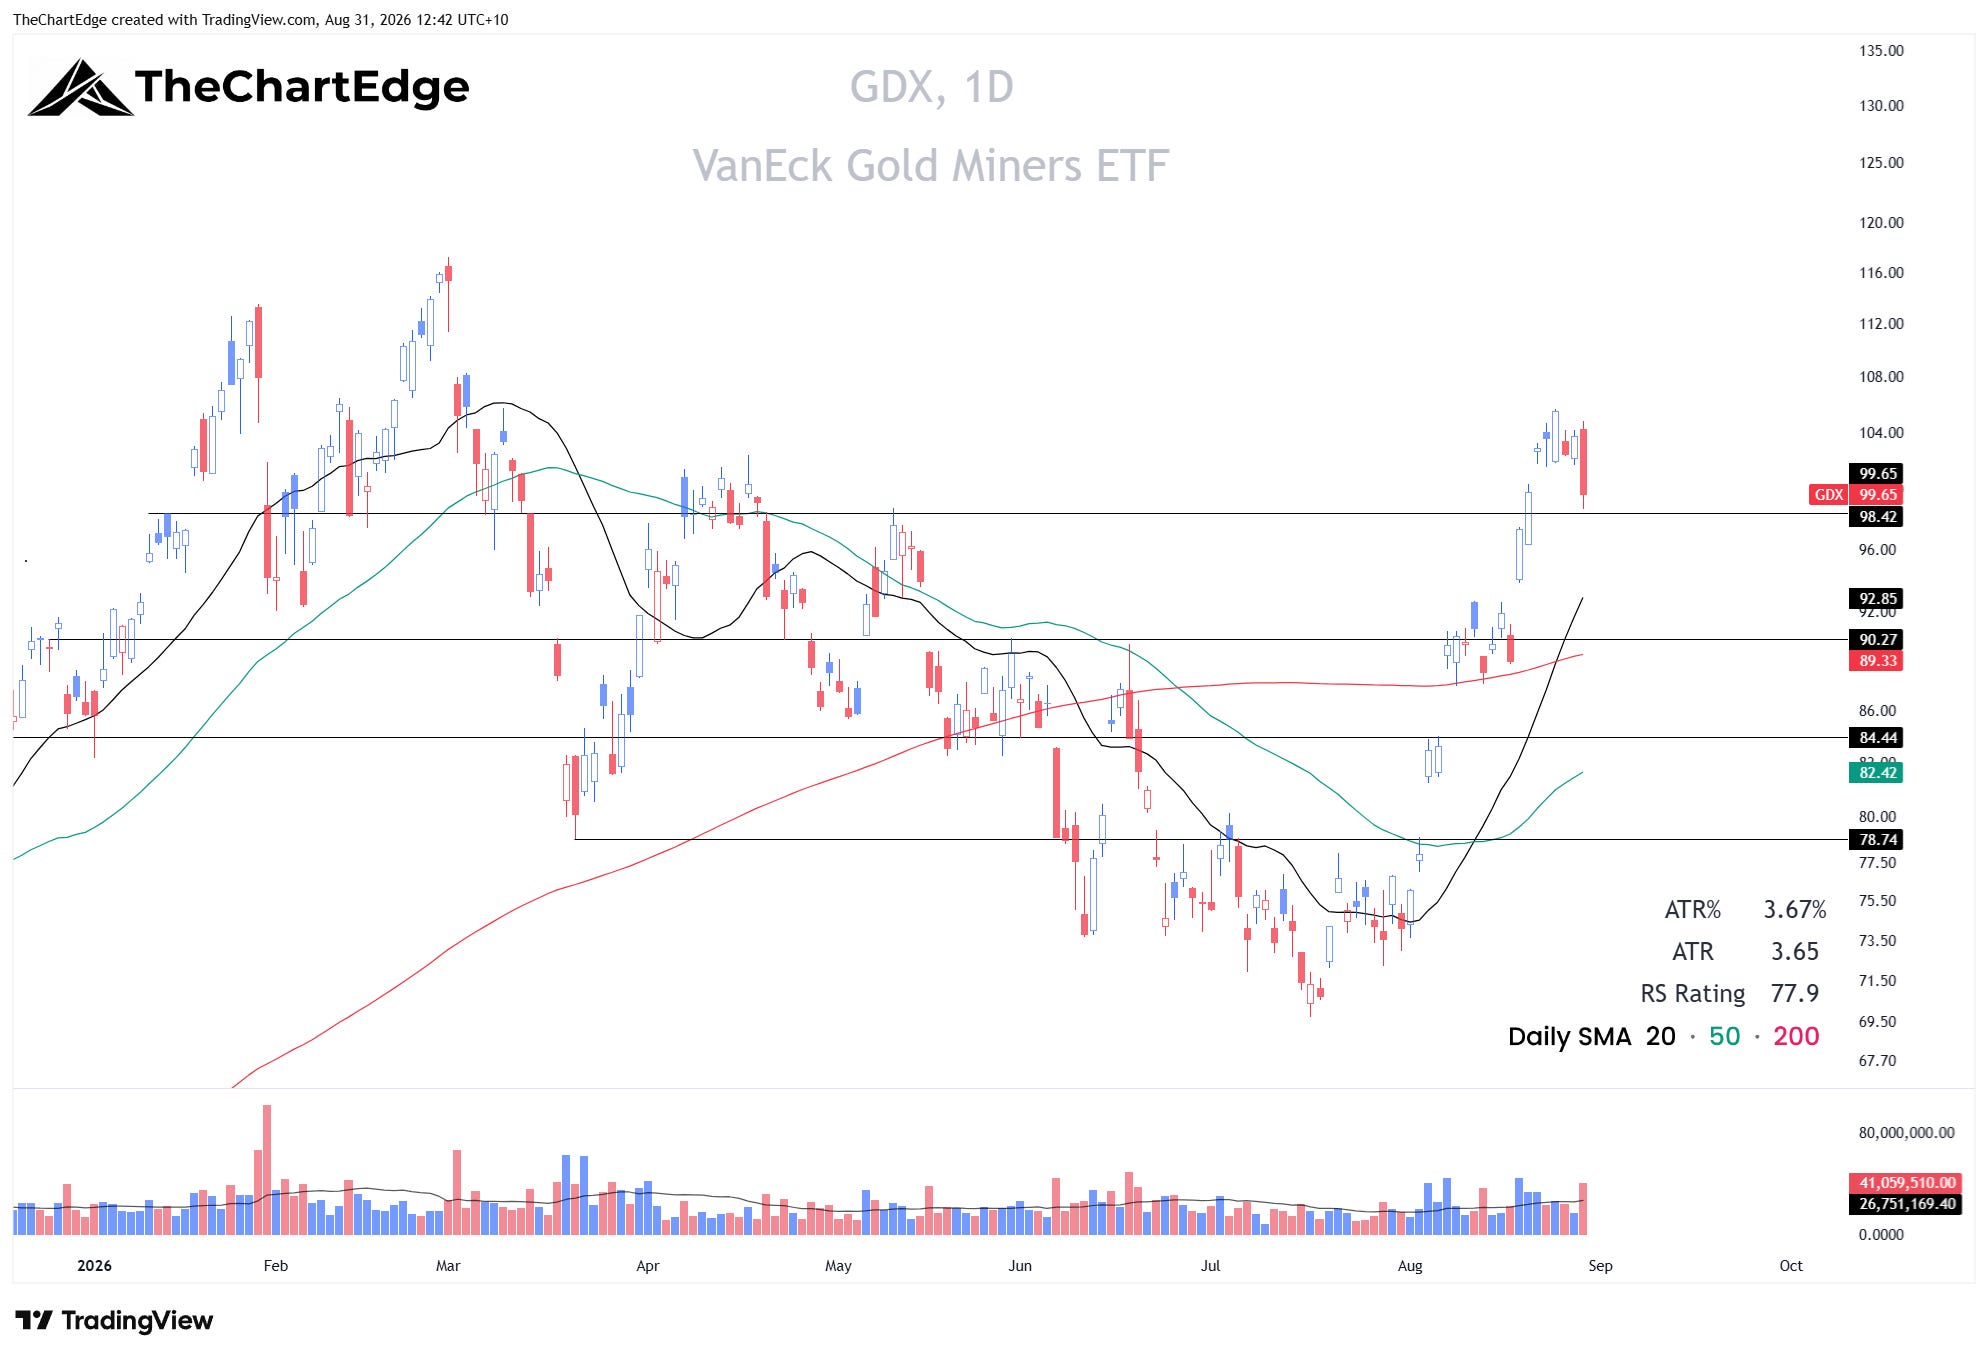
The miners (GDX & SIL) look better and are still above their 200-day SMAs, but they need some time to consolidate and set up in a tighter pattern before I’d consider taking a position.
Follow-Up on Ethereum
Ethereum Chart
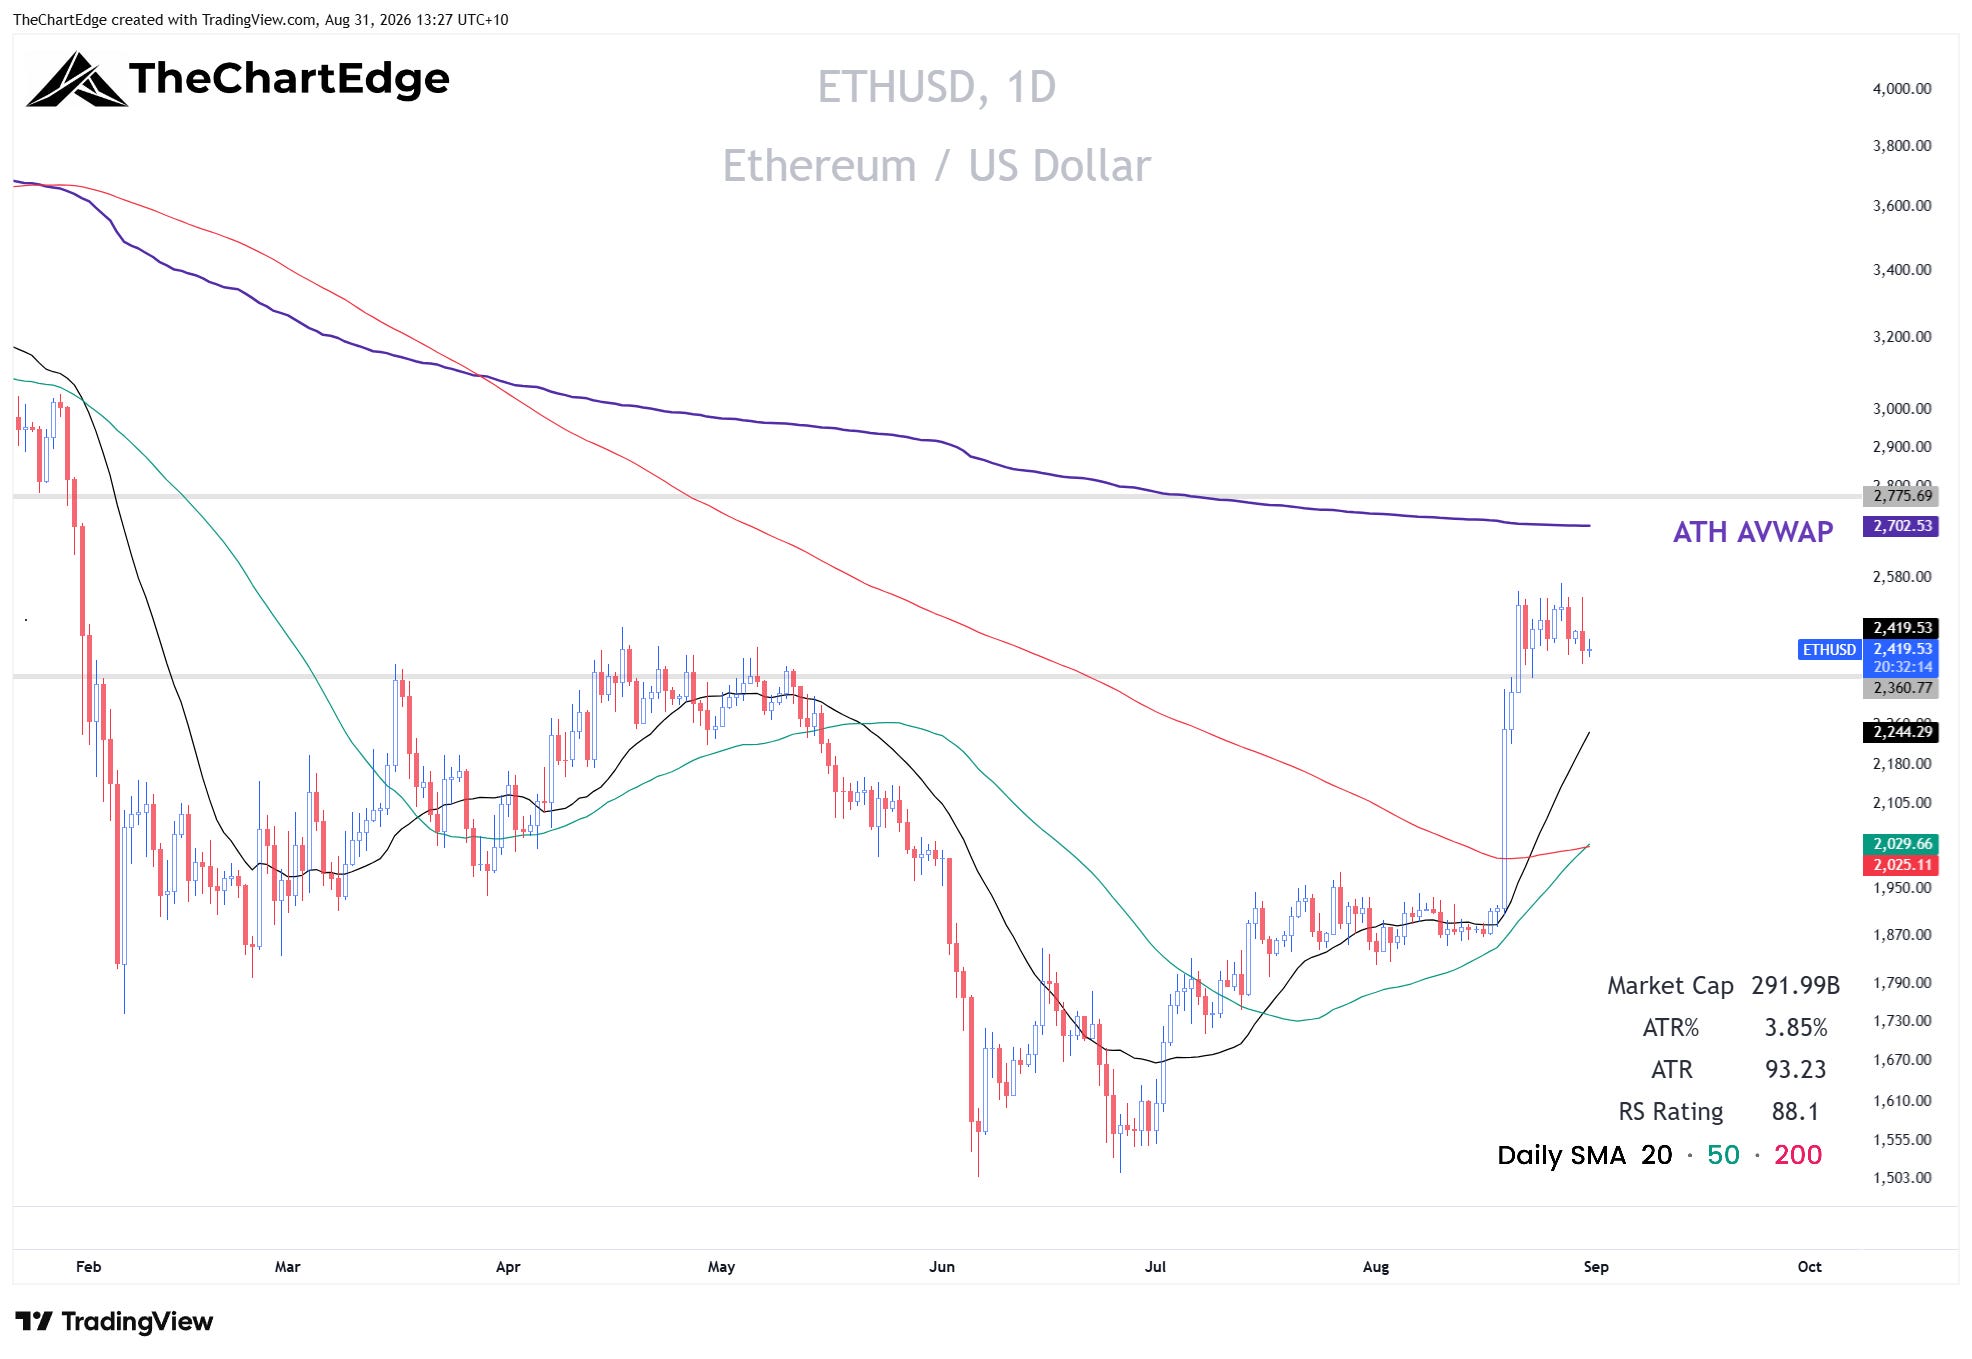
Ethereum consolidated above 2350 for a second week and is trading around 2420 as I write this on Monday. It held its gains on Friday despite the higher USD and broader pullback in rate sensitives, including gold and silver. I may take a small position here with a stop-loss under the recent lows - I’d use 2340 - but I wouldn’t be surprised to see a shakeout under 2350. If that happens, it would be a better entry in my opinion. If it moves higher, I’d be mindful of the AVWAP from the all-time high which currently sits around 2700, and 2775 just above that. First target would be in this 2700-2775 range. If we move up and clear this zone, my next target would be around 3250.
Trades & Follow-Ups
LLY Chart
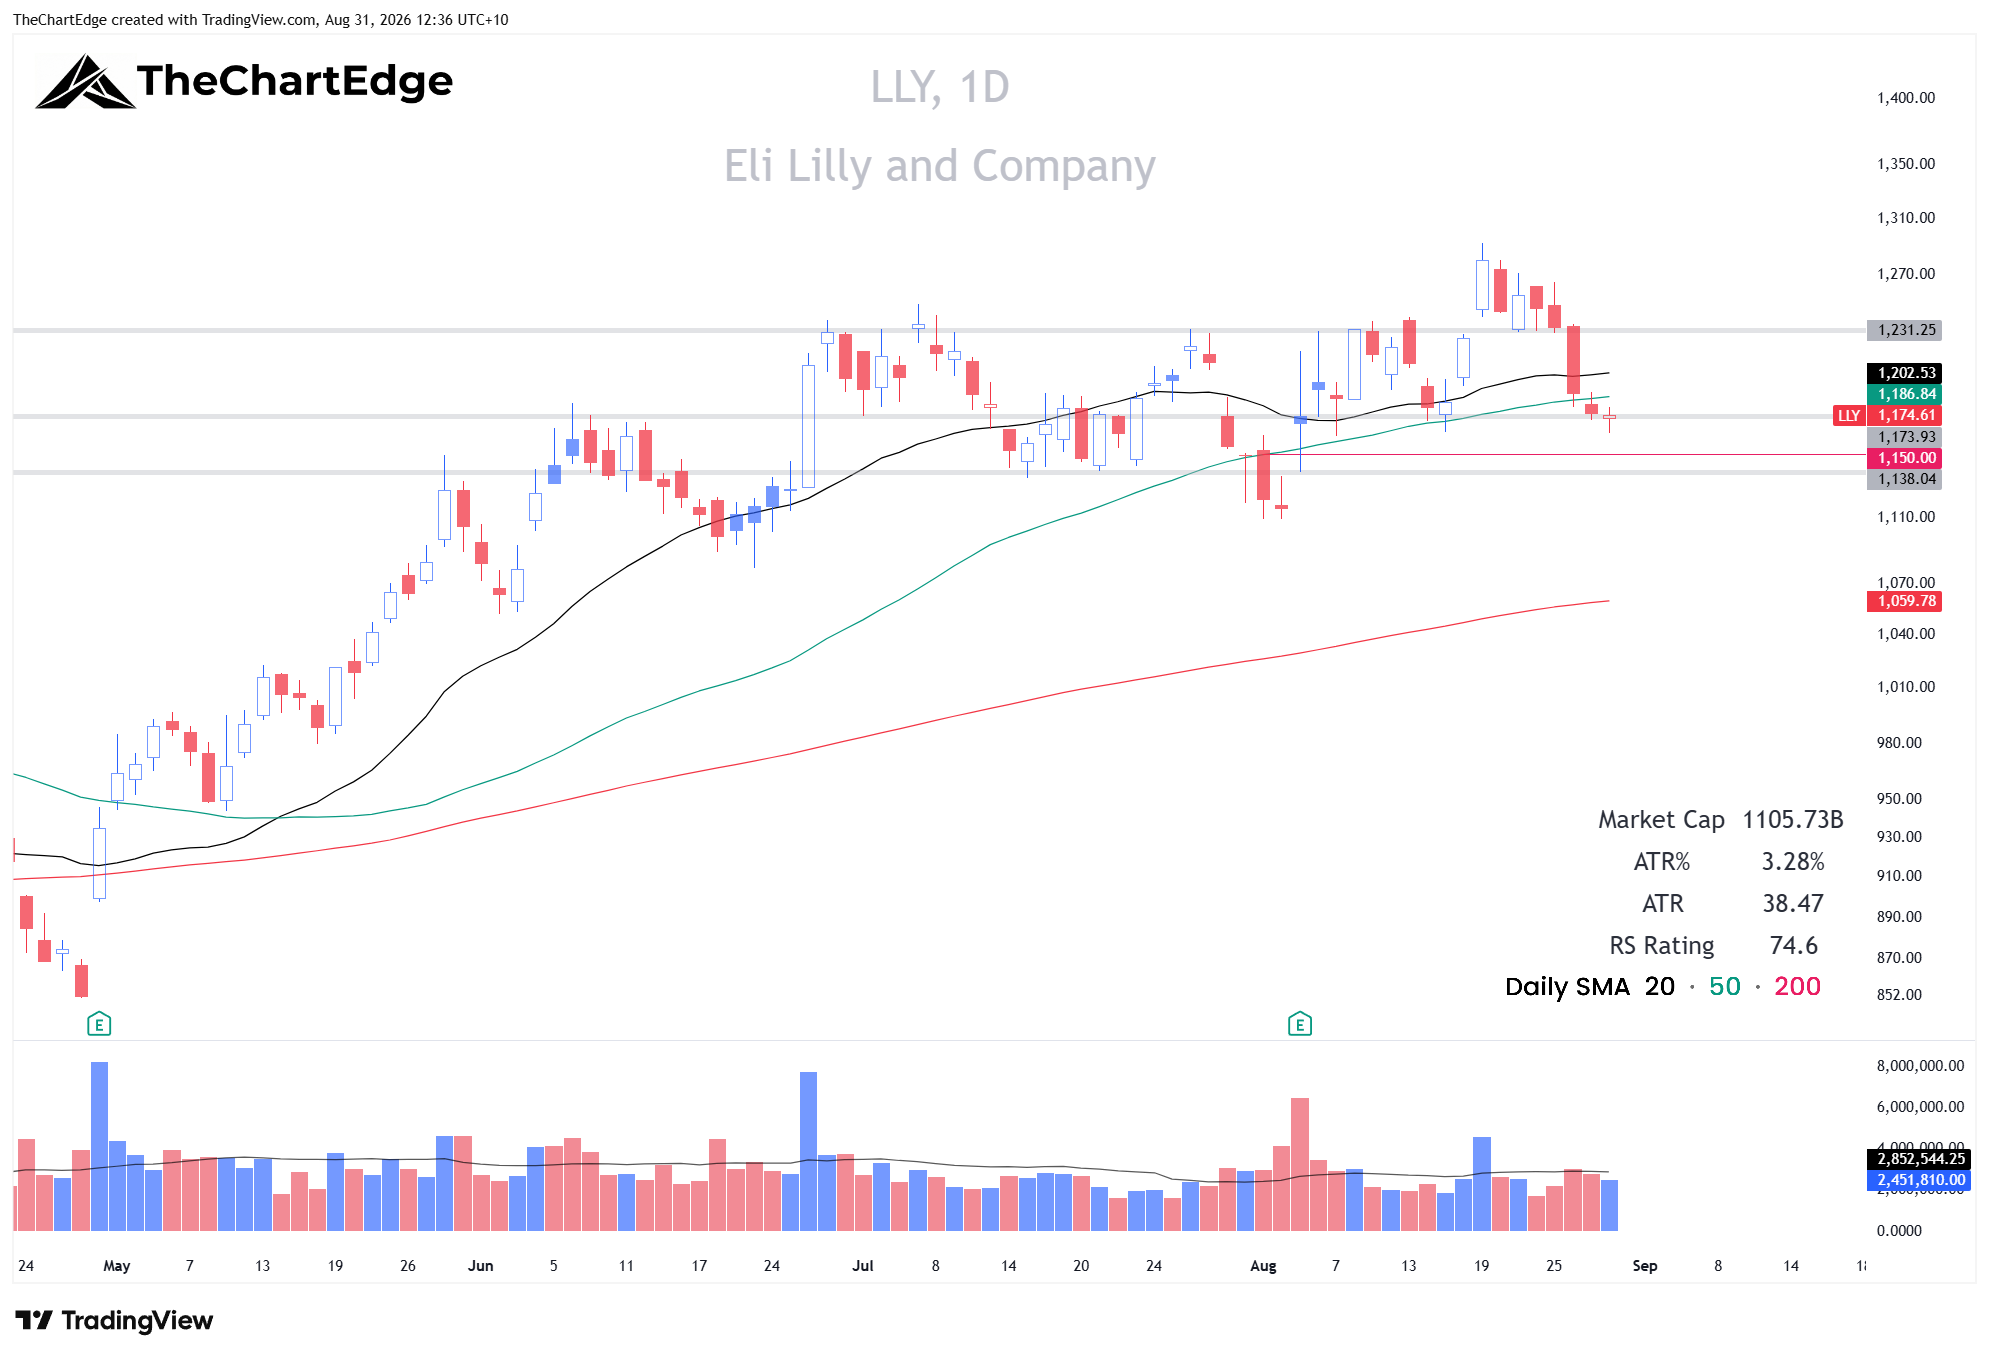
I didn’t write about Eli Lilly (LLY) last week but it’s been on my radar for a few months now. I took a position just under 1200 on Wednesday, with a stop at 1150. It closed at 1174.61, below both its 20 and 50-day SMAs. If it can’t reclaim its 50-day SMA soon, I may exit the position, assuming I’m not stopped out first. But I’ll give it at least a few days here to see if it can recover.
XPH Chart
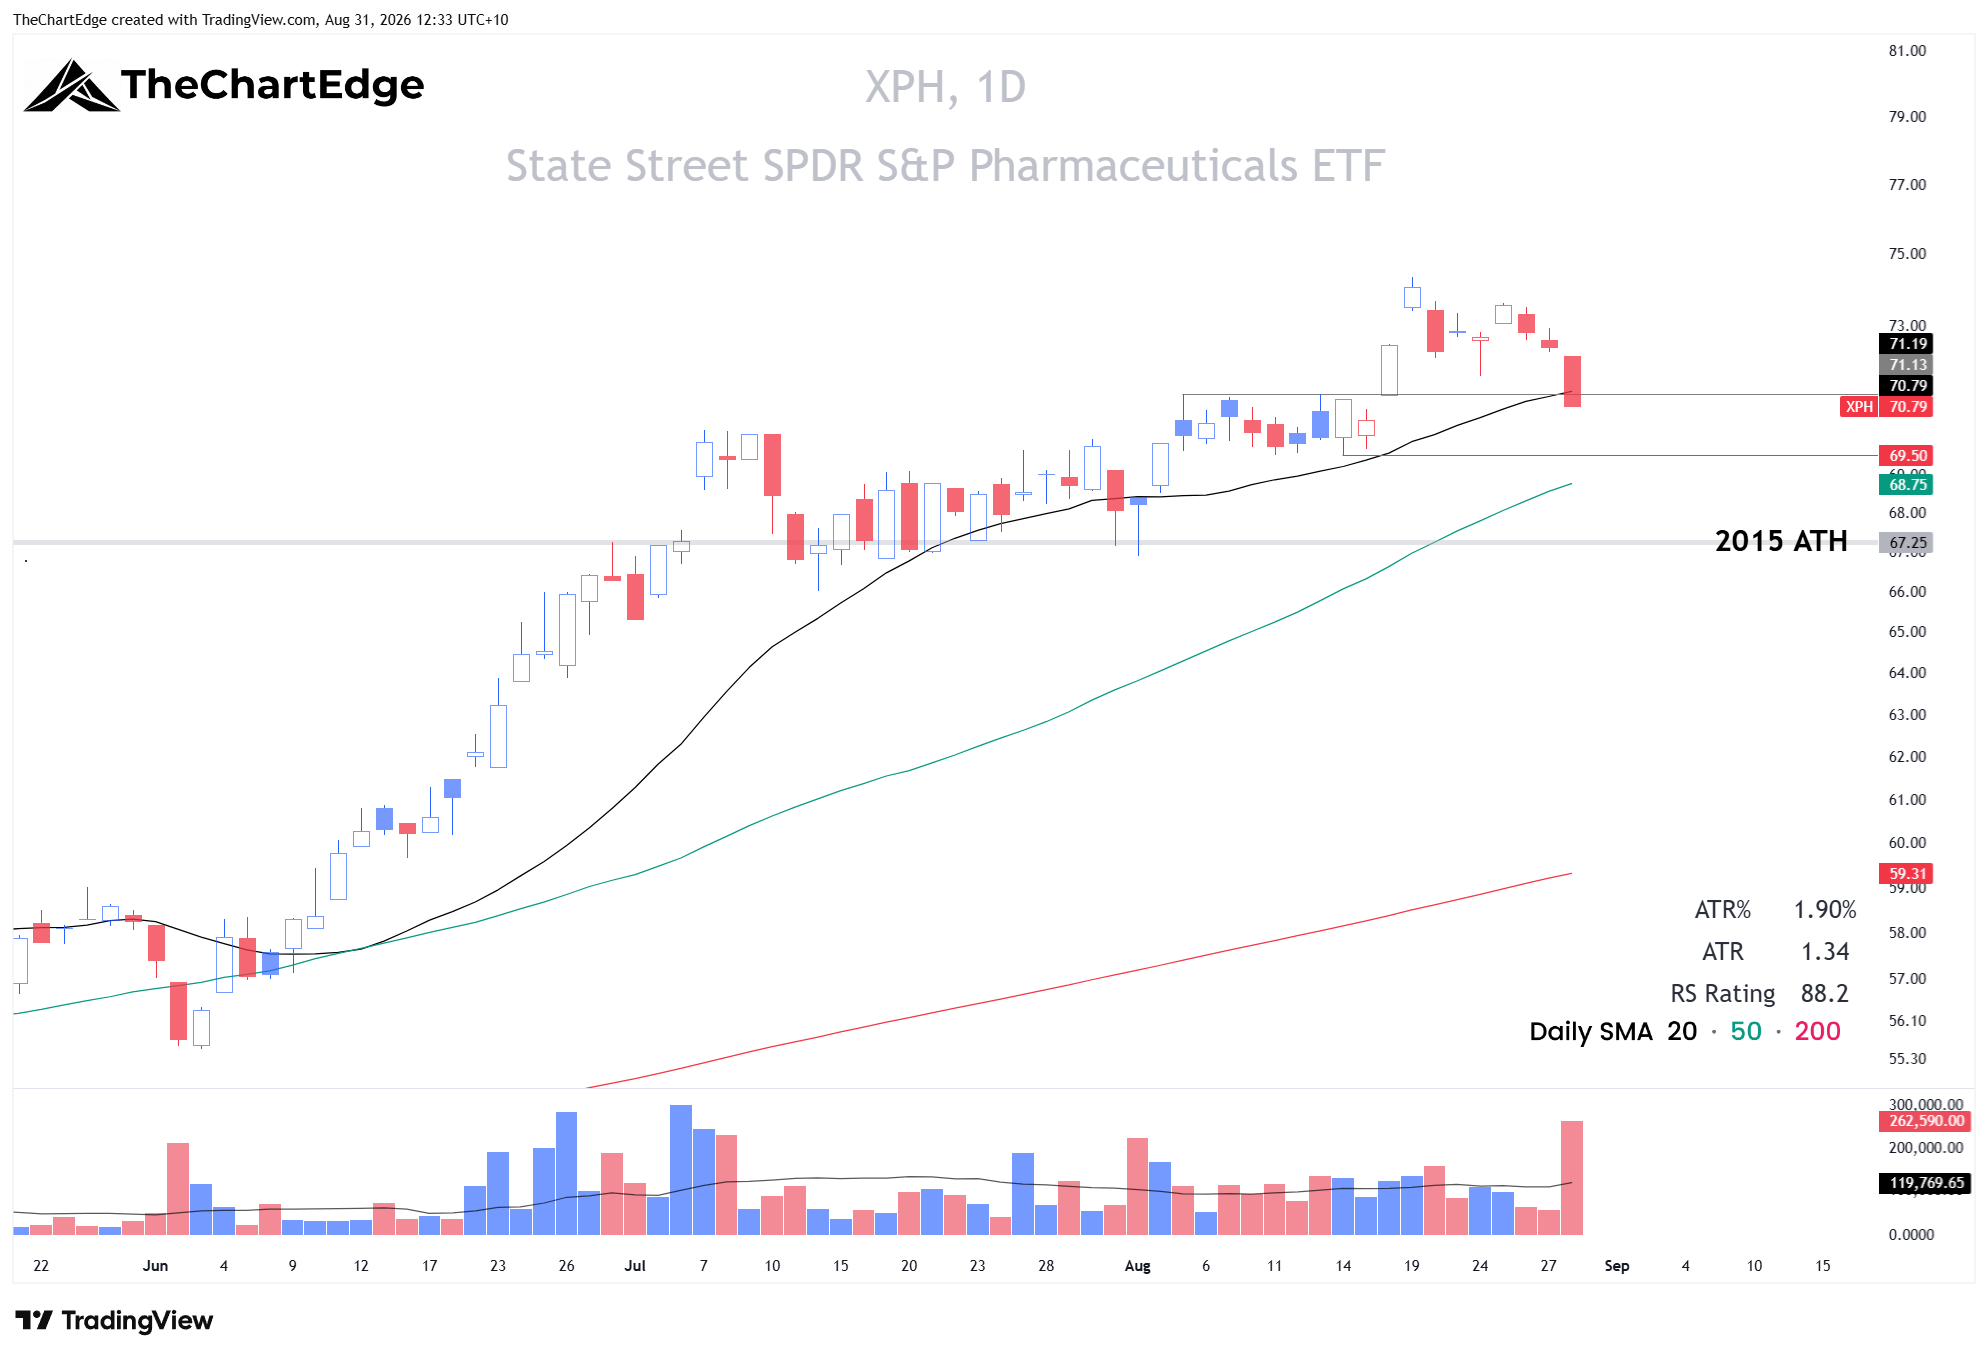
On Friday my buy limit order on Pharmaceuticals (XPH) triggered at just under 71. It closed at 70.79, just under the 20-day SMA. Friday’s action doesn’t look good - a more than 2% down day on well above average volume. My stop is at 68.90, just under the 50-day SMA.
XBI Chart
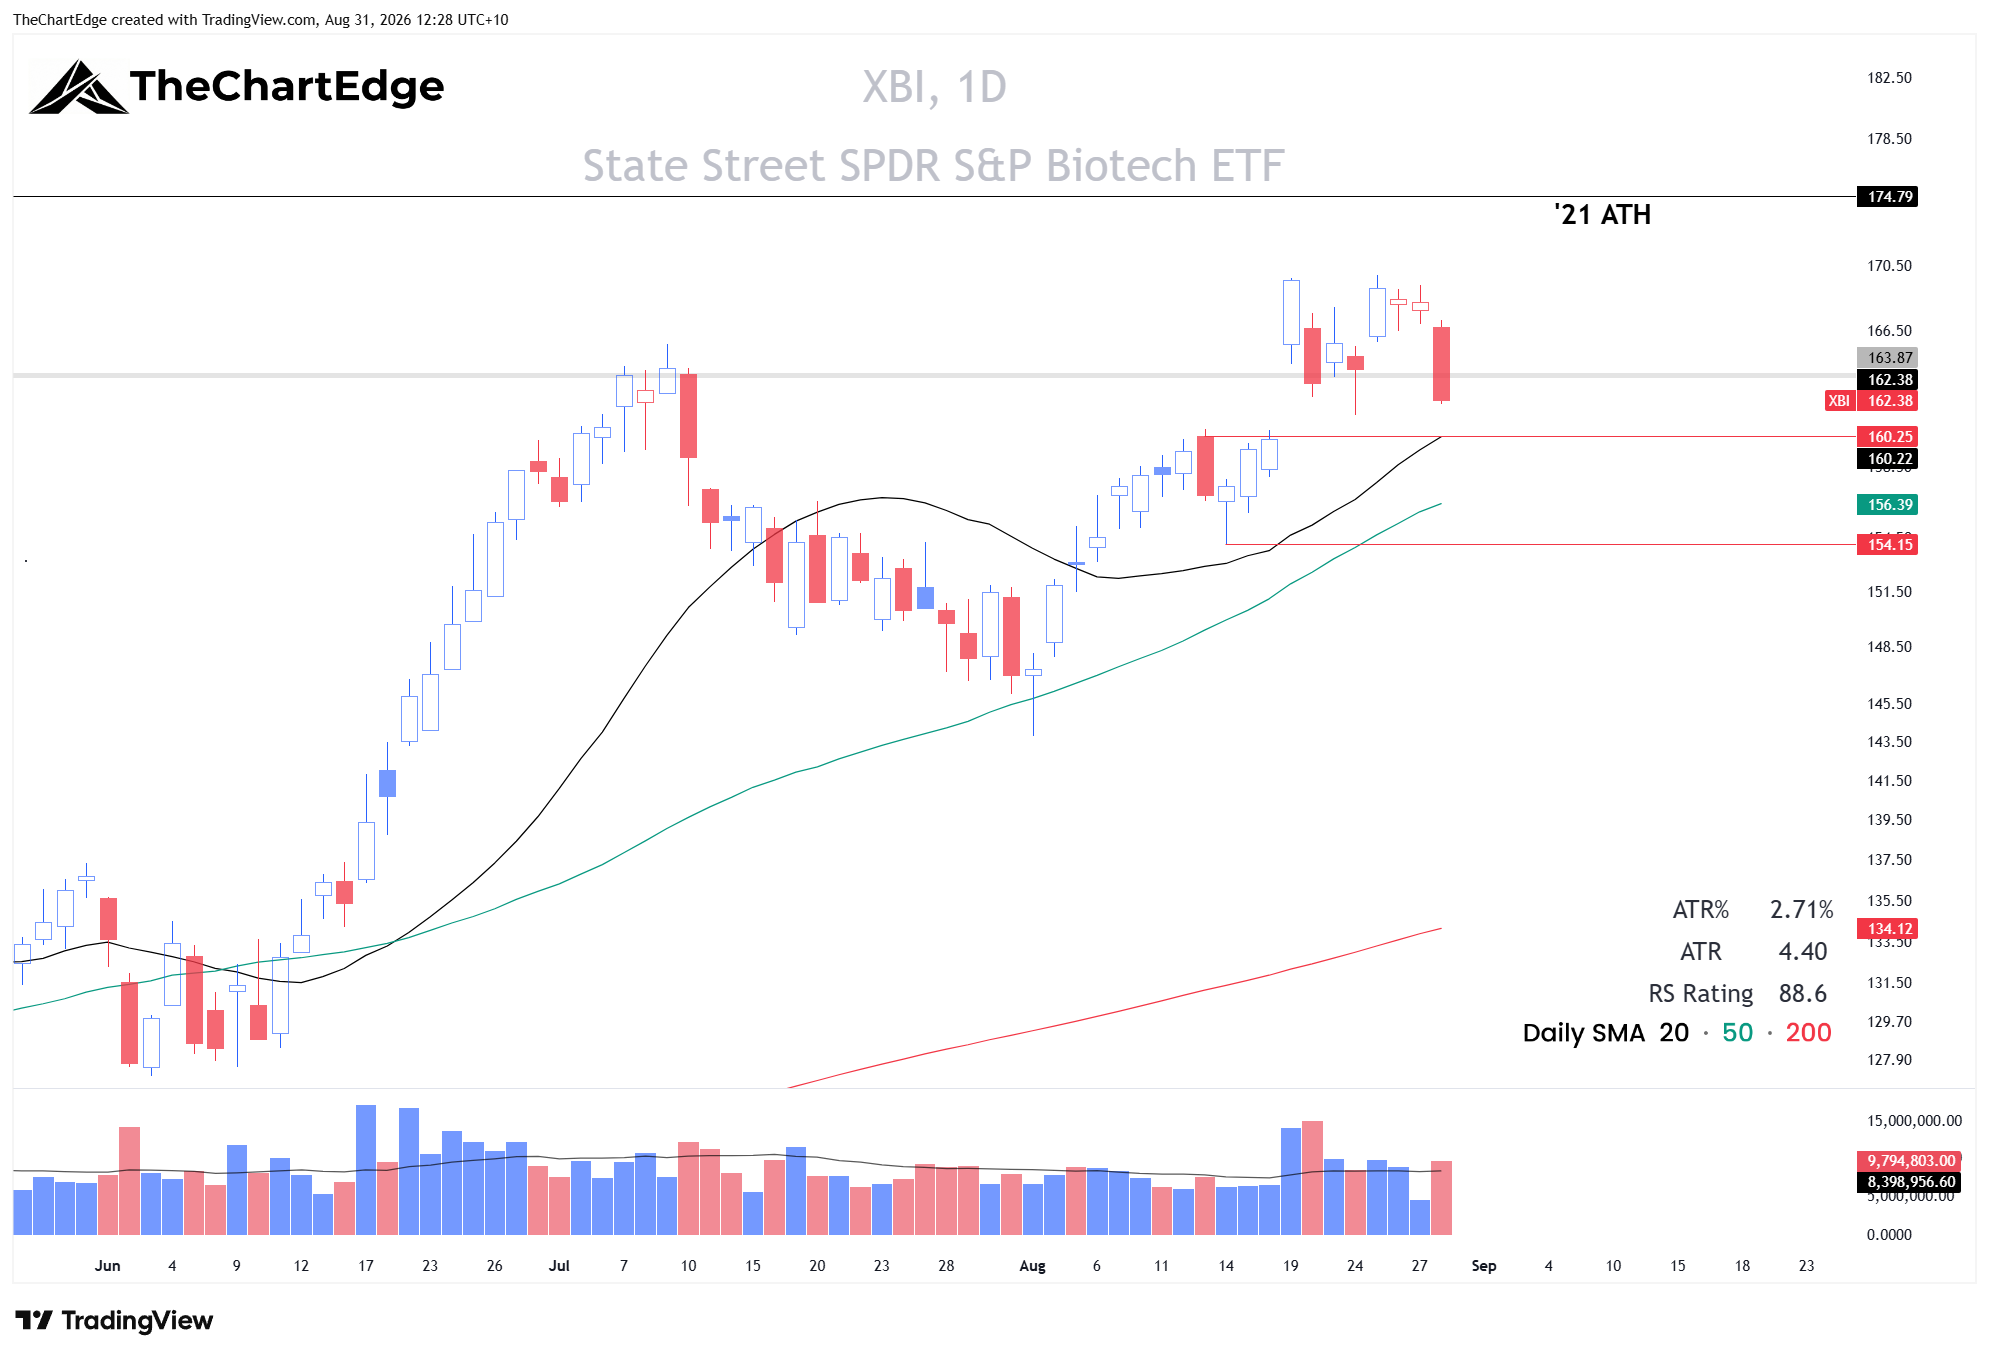
Biotech (XBI) got hit on Friday as well, but it’s still in a Strong Uptrend above its 20-day SMA. The order issue from a couple of weeks ago has been resolved with my broker. Without going into all the details, it was partially my fault. However, they did compensate me for the slowness to reach a resolution. Anyway, as it stands now, I do not have a position in XBI. That’s one of the reasons I placed the Eli Lilly trade on Wednesday.
LIT Chart
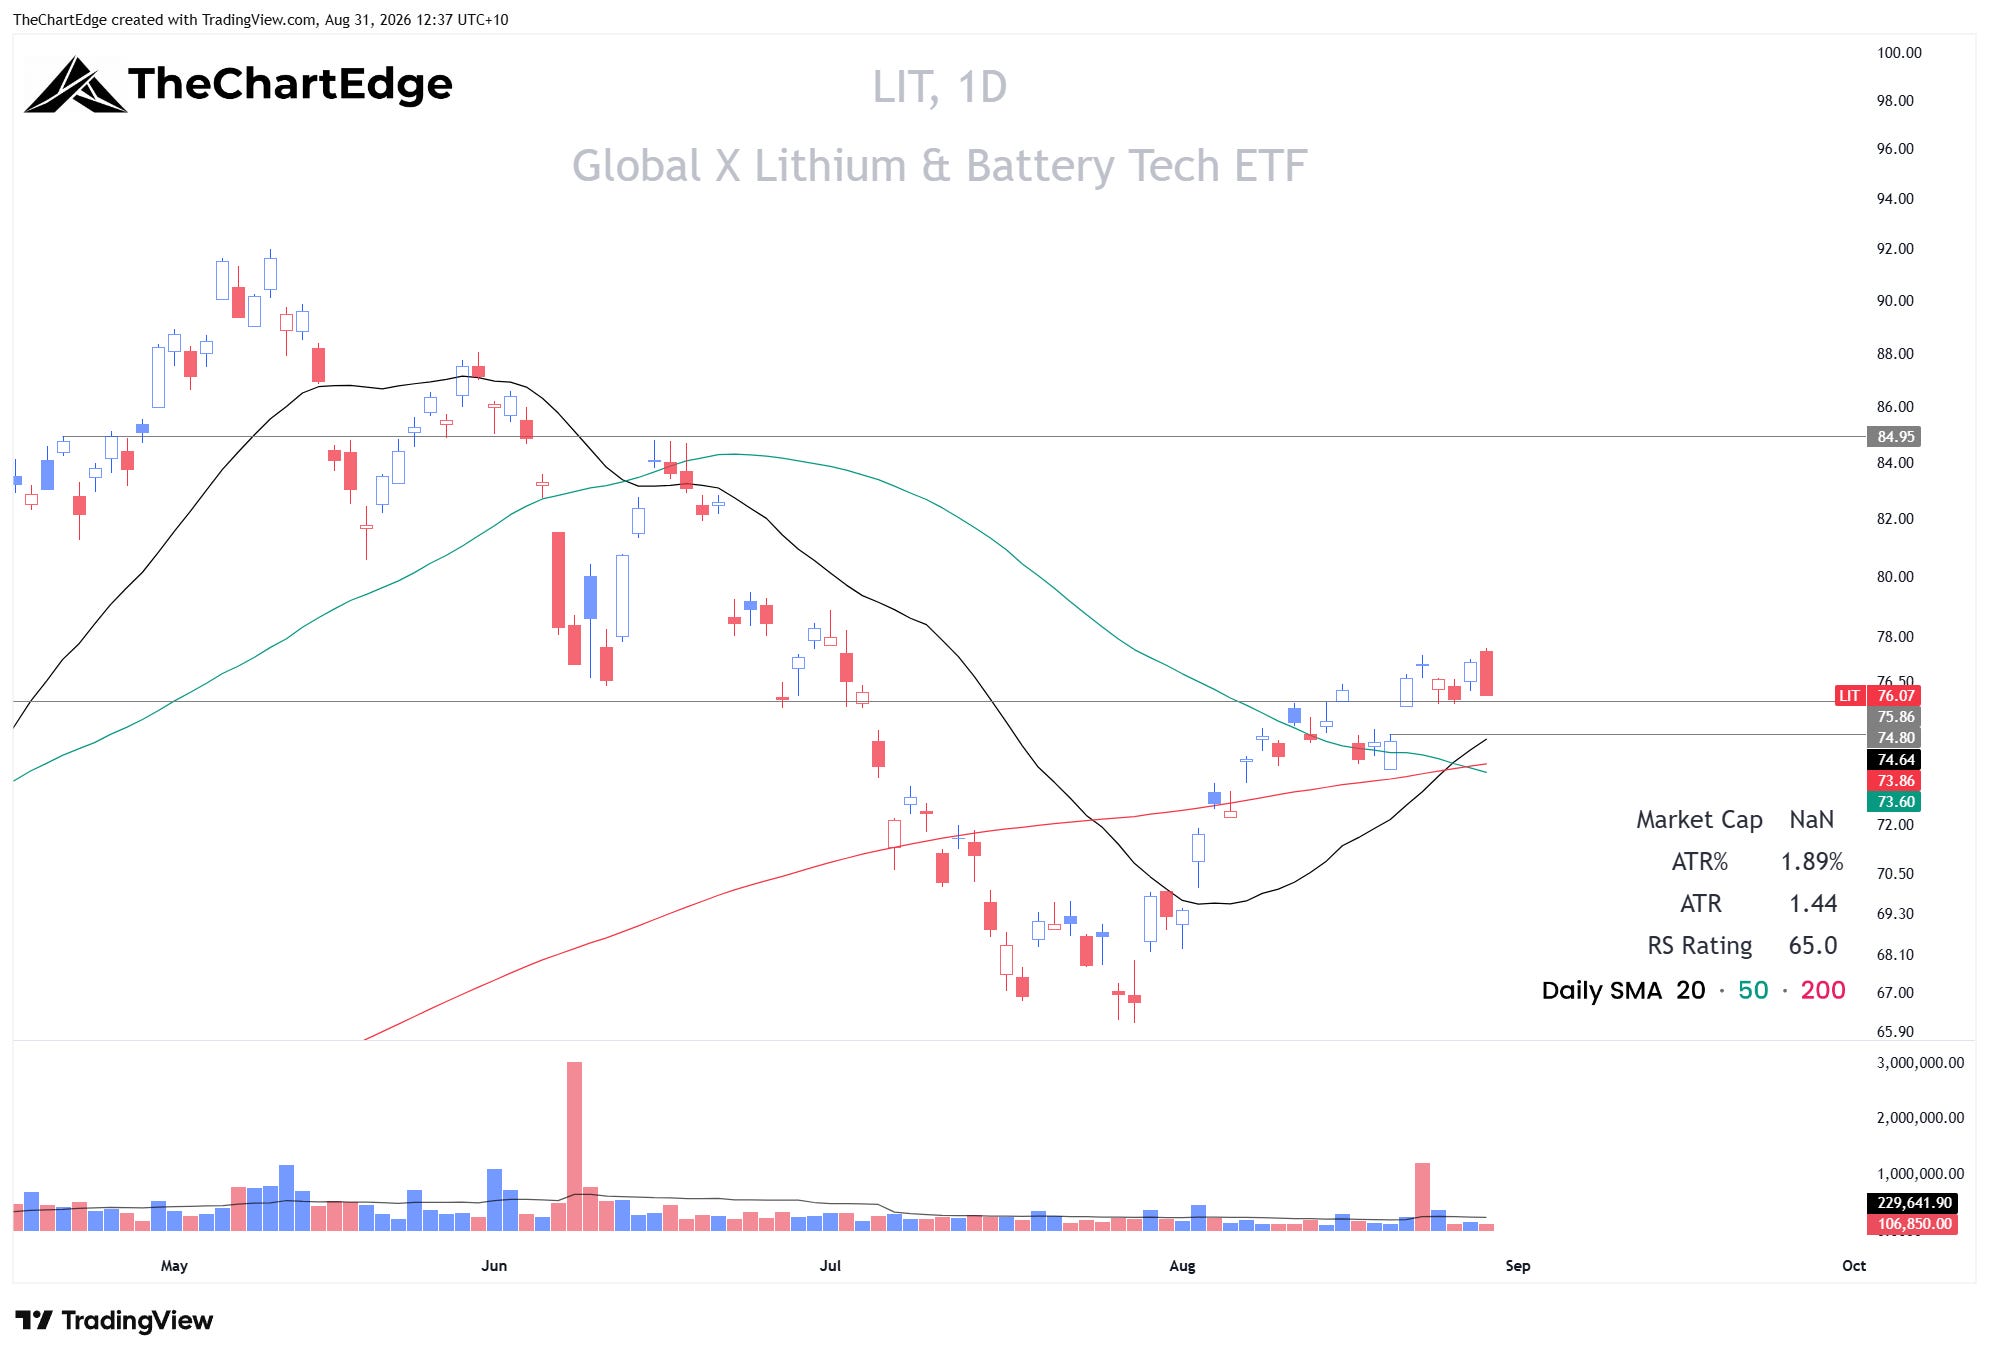
My buy limit order on Lithium (LIT) at 75 didn’t fill. I will leave it there this week and see if it triggers. My stop-loss is at 72.20, but I may bring it up a little depending on what happens. Initially, when I set the stop, I placed it under the cluster of SMAs, but I was planning to use the 20-day as the trailing stop - at least initially - and it’s rising quite rapidly, currently sitting at 74.64.
ATI Chart
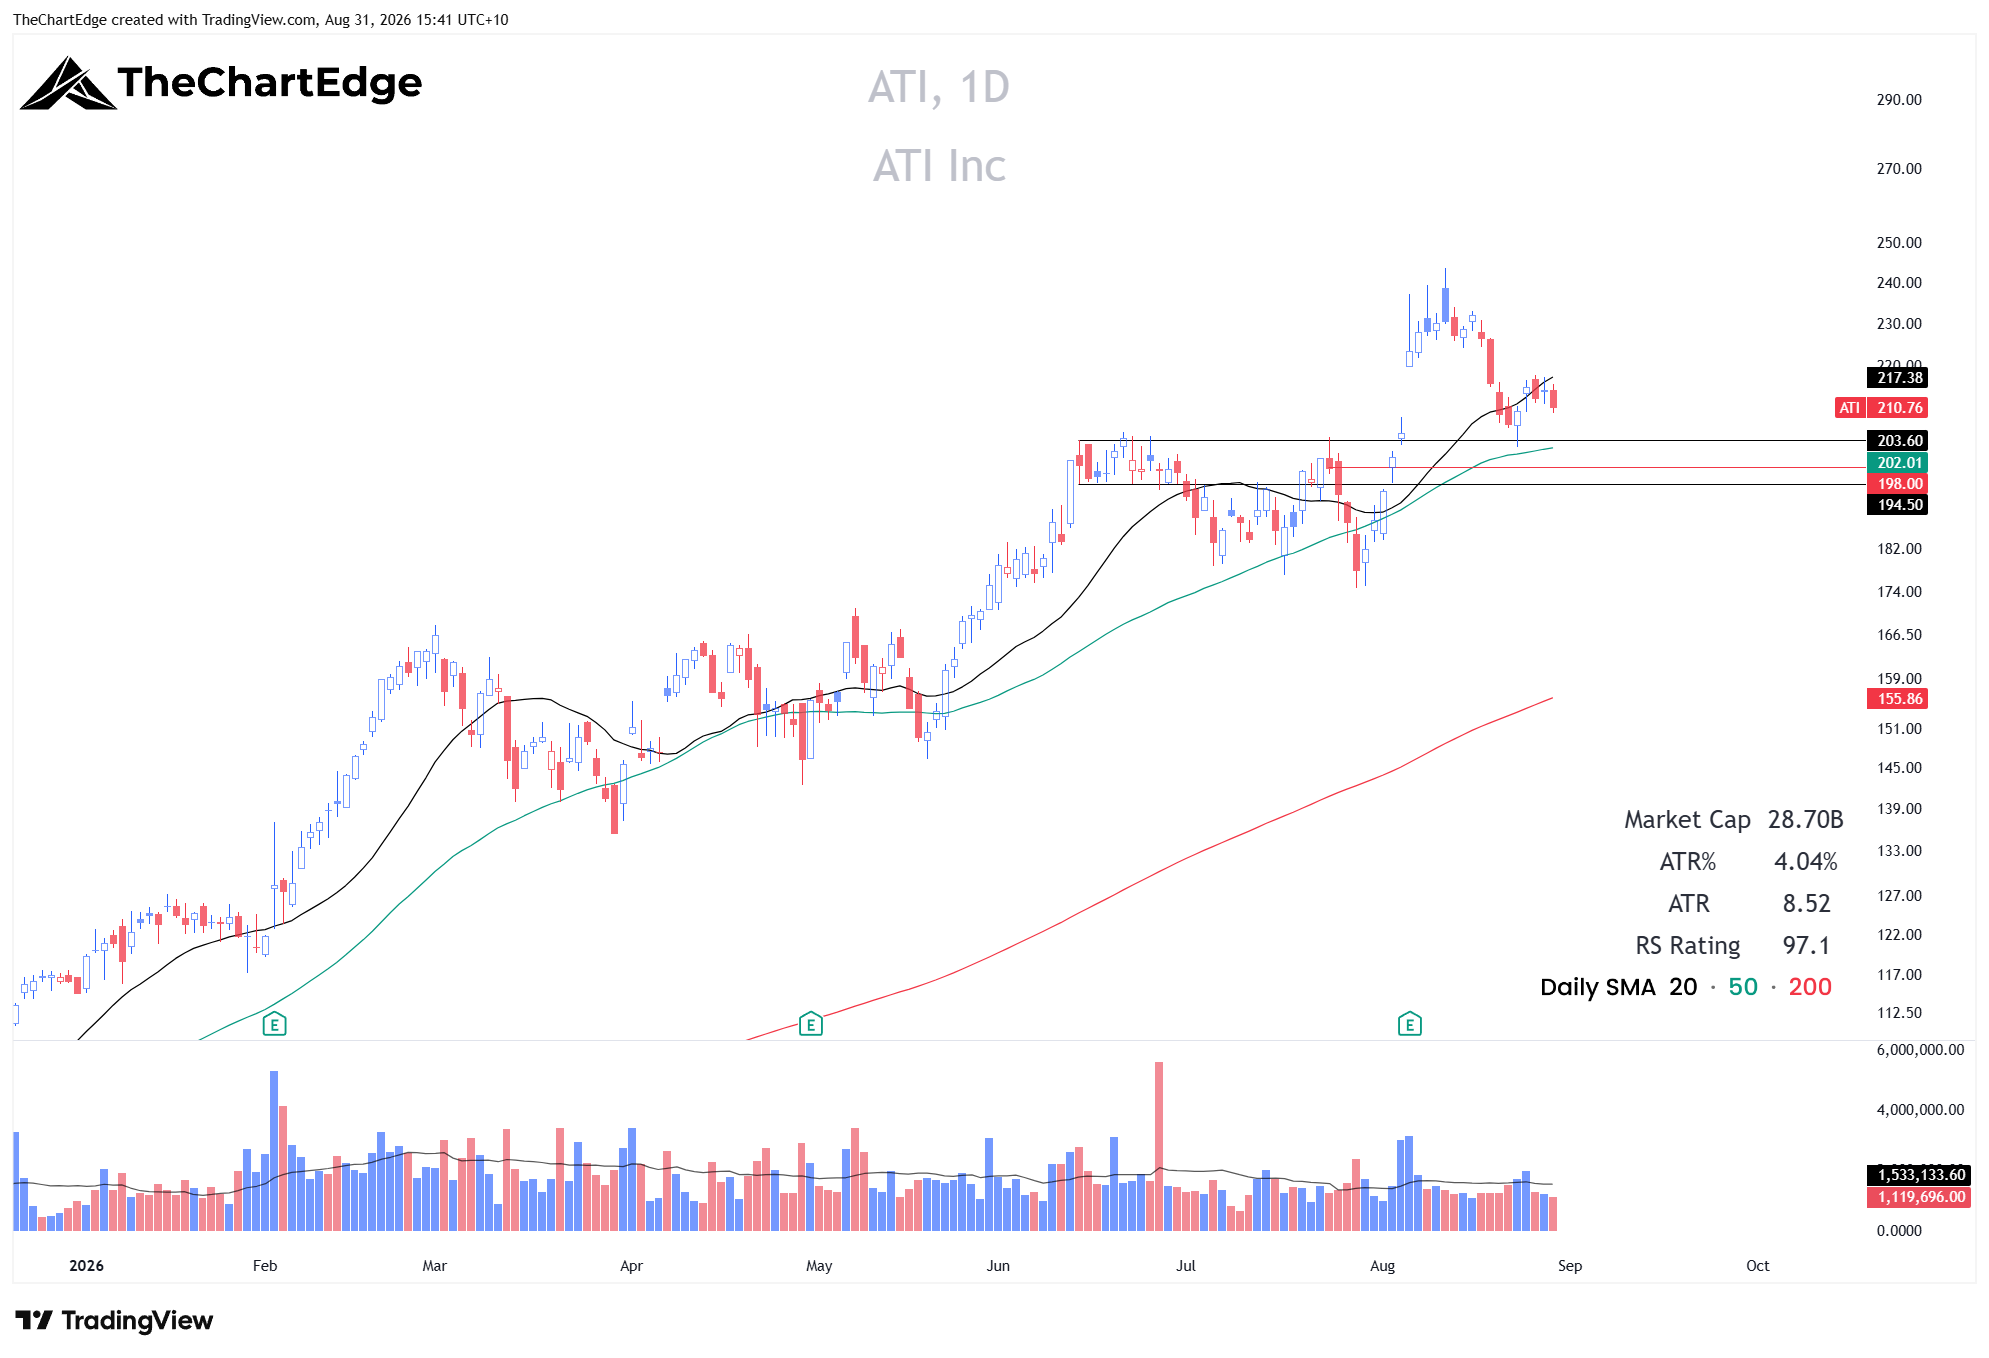
I also placed a buy limit order for ATI last Tuesday, at 205. I liked the upside reversal on Monday - which allowed for a relatively tight stop-loss, as well as a clear level to know whether the trade has worked or not. It’s been trending very nicely since September 2025 and has been a very strong outperformer, returning 83% year to date and 174% over the trailing 12 months. It is quite volatile though, with an ATR percentage just over 4%. The order did not trigger as the stock stayed above 205 all week after Monday. It closed the week just above 210. I’m still undecided whether to leave the pending order as is, as I am less confident it will hold on another test of the 202-204 level. It may, but it would have been cleaner if it went up and out last week, rather than finding resistance at the 20-day SMA. I may even change the order to a buy stop and buy strength above 218-219. This would be my preferred strategy in a stronger market. However, when the general market and leaders are not trending strongly, breakouts are more likely to fail. It would also require a much wider stop-loss, as I’d still want to keep it just under 200, below the 50-day at 202, and trail it up using one of the SMAs if it keeps rising. I also sized this order as a half position, due to the general market conditions, the tight stop-loss, and the ATR% of 4% on this stock.
The Week Ahead
SPY remains in a Strong Uptrend near all-time highs, and the Market Temperature sits in the Goldilocks Zone for a fourth straight week. However, participation has narrowed, with relatively short rotations in leadership and moves that haven’t been as orderly and sustained as those you see when the environment is more favourable for swing trading. Also, the feedback I got from the market last week tells me now is not the time to be overly aggressive. LLY couldn’t hold its 50-day SMA on this pullback and XPH cut through its 20-day on Friday on high volume (although the two trades are correlated, so I take that as one data point, or maybe 1.5 at most, rather than two). Add the big reversals on Friday in gold, silver, biotech and health care, which have been the recent leaders, and you now have the new leaders stumbling, while many of the old AI leaders are yet to stabilise, let alone start new uptrends.
I am mindful not to overtrade in this environment and have already reduced my position sizing. I will reduce it further if I am unable to get traction in the coming week(s). I am also considering my overall risk, in case a few of these orders trigger in quick succession - ideally I’ll have some profit cushion and some stops at break even before entering multiple new positions. For example, I have 2 active positions and will probably have 5 resting orders going into the market open later today. If I were to risk 2% of my portfolio per trade, which I often do, and got stopped out of all of them, I’d be down 14% - not something I’d like to see in a short period of time. The fact that all the buy orders are under the current market price also makes me more wary. I usually prefer to buy strength, but in choppy or consolidating markets it tends to be a less successful entry strategy. Due to the number of resting buy limit orders I will have, I am risking less than 1% per trade for the majority of orders, in case we get a rapid decline that triggers (and stops me out of) all my orders.
In terms of new setups - XSW on a mild pullback is my favourite at this stage and Ethereum above 2350. Otherwise, I’ll leave the resting orders in the S&P 500 CFD, LIT and probably ATI as they are, and manage LLY and XPH. If we lose 700 on QQQ, which would likely coincide with further weakness in SMH, I will be far more conservative adding new long positions and probably sell any position(s) not in profit and/or add a short position or two as a hedge.
Note that US markets will be closed Monday September 7 for Labor Day, after which volume and volatility may pick up as the mid-terms approach.
Stay open-minded and manage risk carefully.
Cheers,
Marcus Grant, CFTe
Disclaimer: The content provided in this newsletter is for informational and educational purposes only and should not be considered as financial, investment, or legal advice. The information shared is based on our research and analysis, but we are not a licensed financial advisor, nor can we guarantee its accuracy, completeness, or timeliness. Market conditions and financial instruments can change rapidly, and any opinions expressed may not be suitable for all investors. Any opinions expressed and or securities mentioned do not constitute a recommendation to buy, sell, or hold that or any other security. You should conduct your own due diligence and consult with a licensed financial advisor or other professional before making any investment decisions. Past performance is not indicative of future results, and all investments carry the risk of loss. The authors and publishers of this newsletter are not responsible for any financial decisions made based on the content provided herein. By reading and/or subscribing to this newsletter, you acknowledge and agree that you are using the information at your own risk.