


Everything below is as of Friday October 2 close.
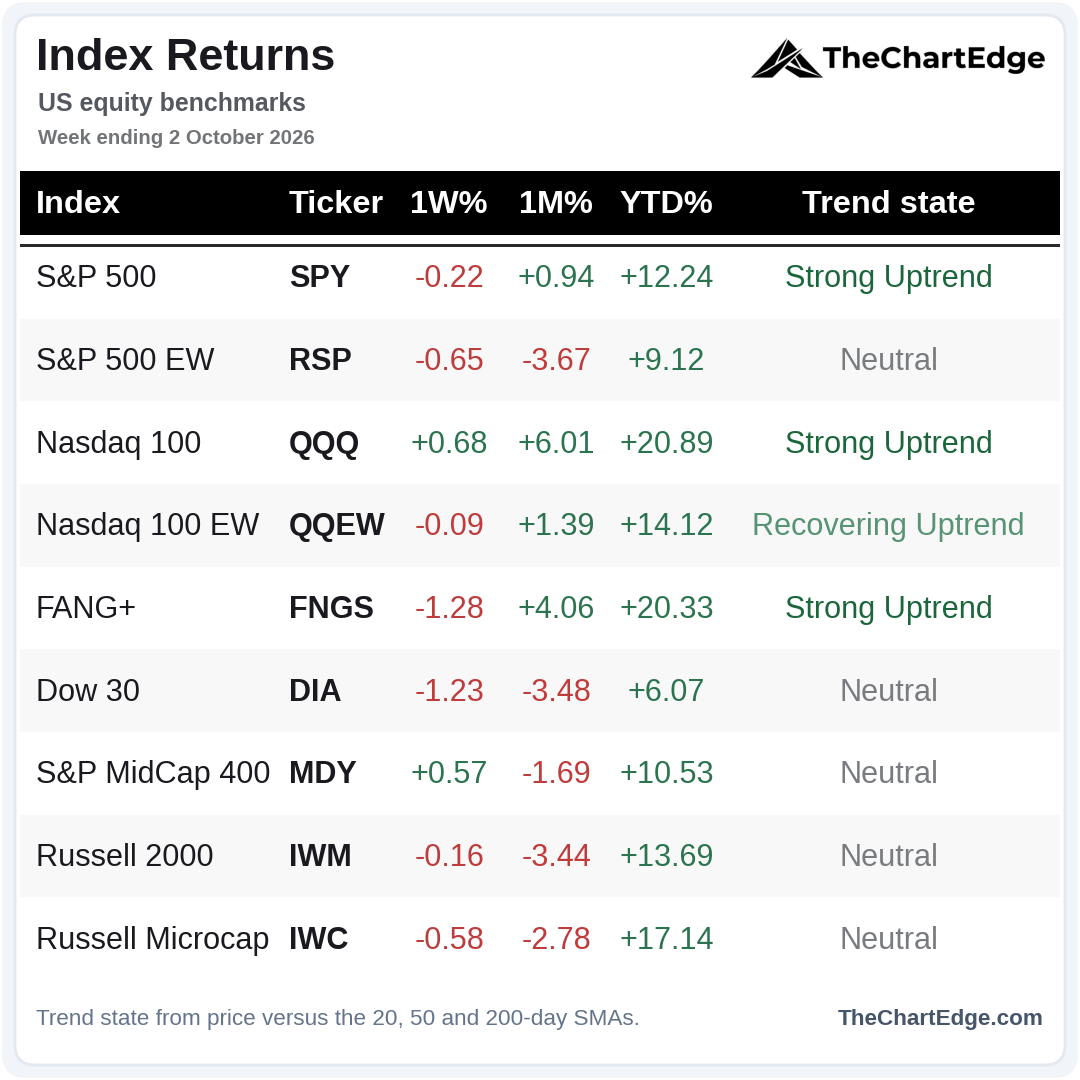
Of the major indices I track, only 2 of the 9 finished the week higher - the Nasdaq 100 (QQQ) and mid-caps (MDY). Only SPY, QQQ, the equal-weight Nasdaq 100 (QQEW) and FANG+ (FNGS) remain above their 20 and 50-day SMAs.
S&P 500 (SPY) Chart
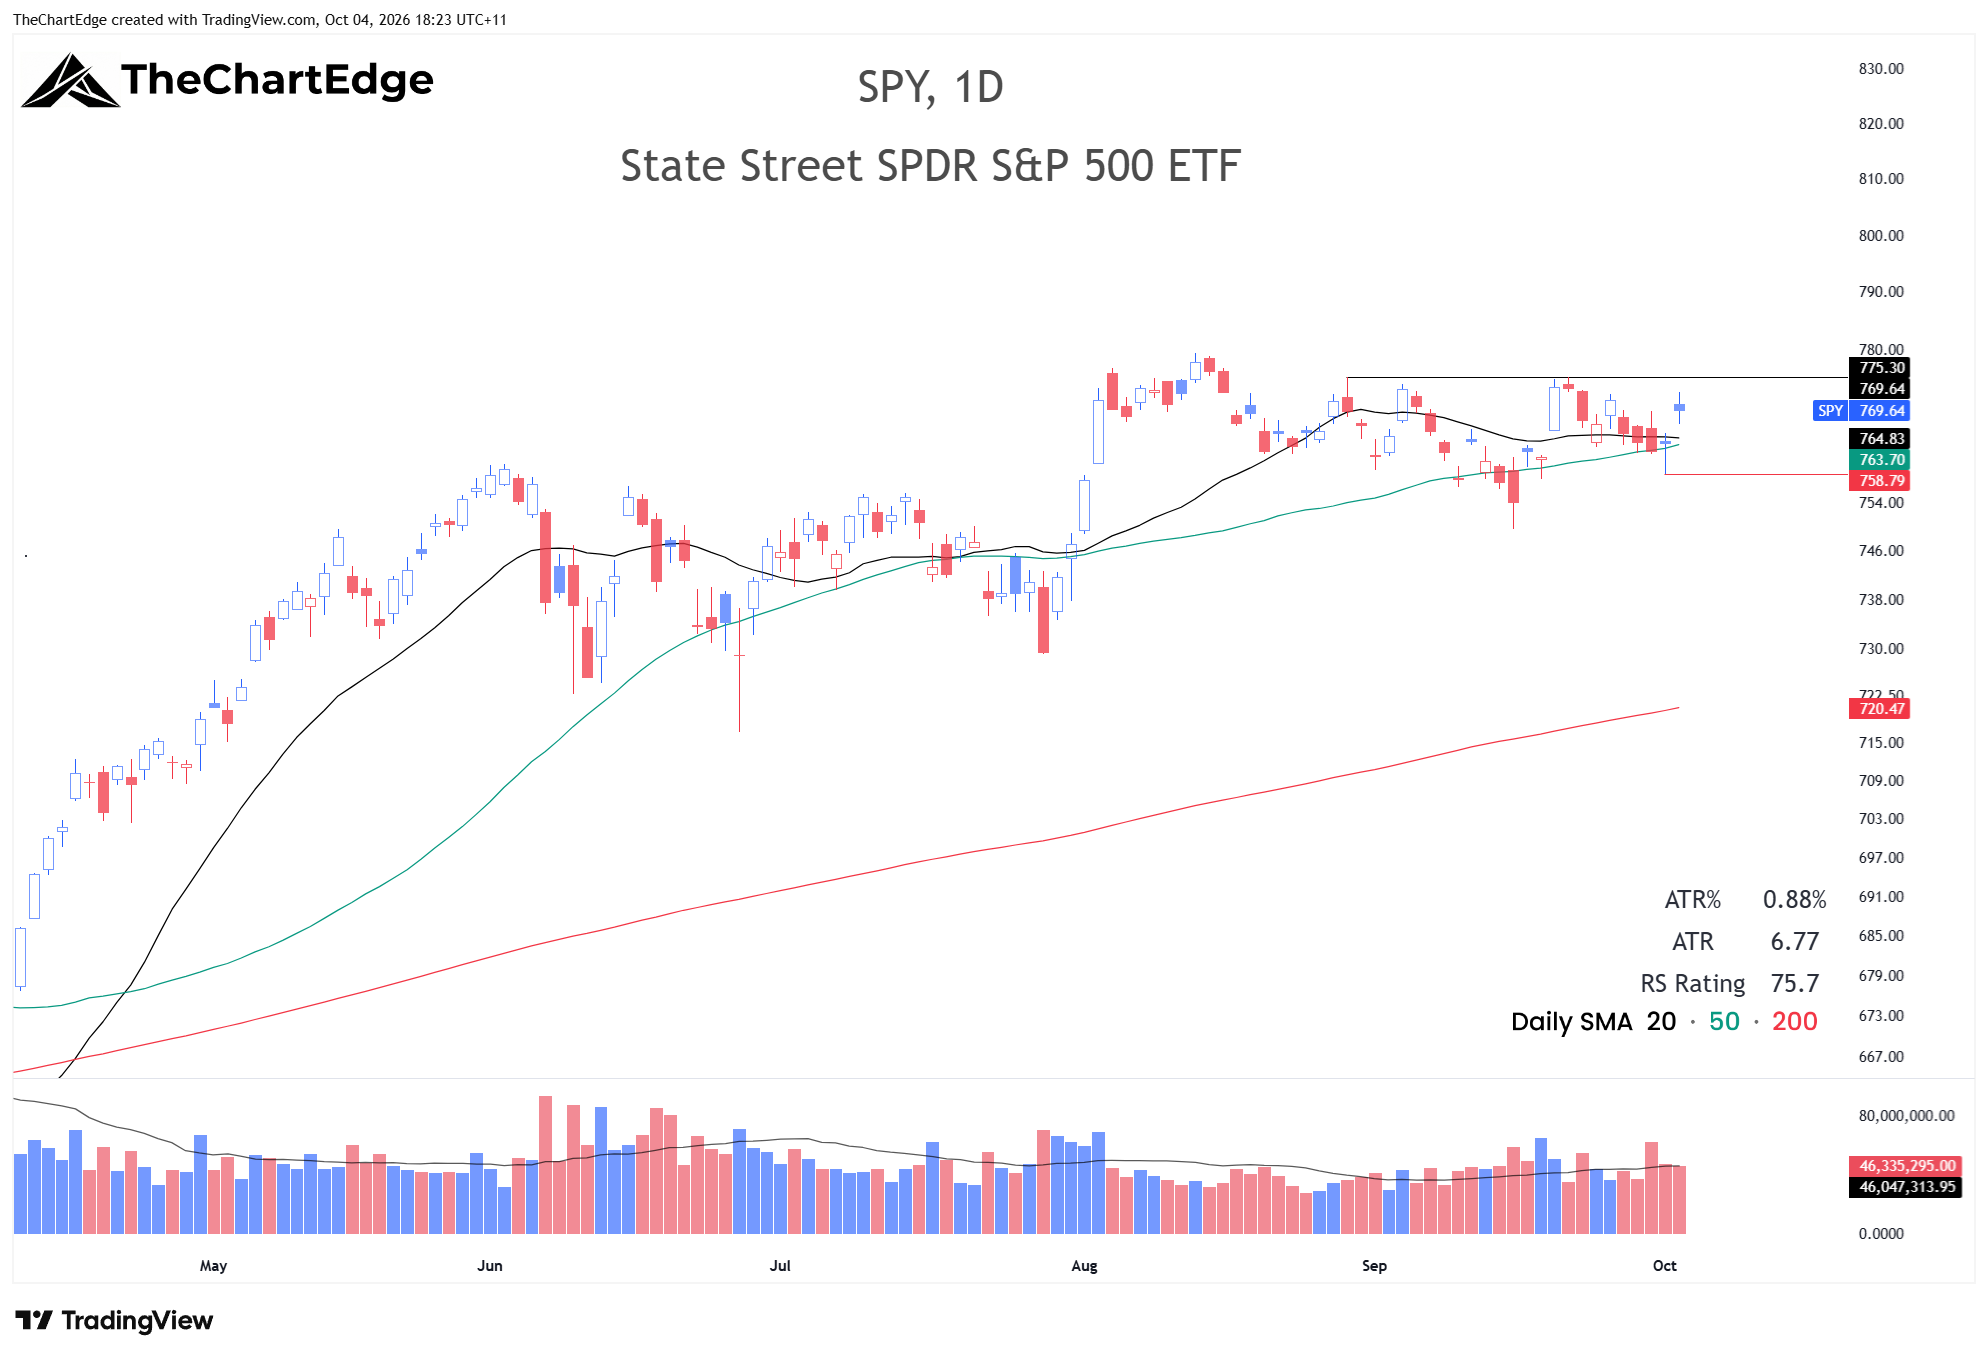
SPY closed at 769.64, in a Strong Uptrend and 1.3% below its all-time high, but only just above its 20 and 50-day SMAs, which both sit around 764. SPY is stuck in a sideways range for now. I’m still watching 775 on the upside and now Thursday’s low just under 759 on the downside. However, a close under the 20 and 50-day SMAs would be the first red flag.
Nasdaq 100 (QQQ) Chart
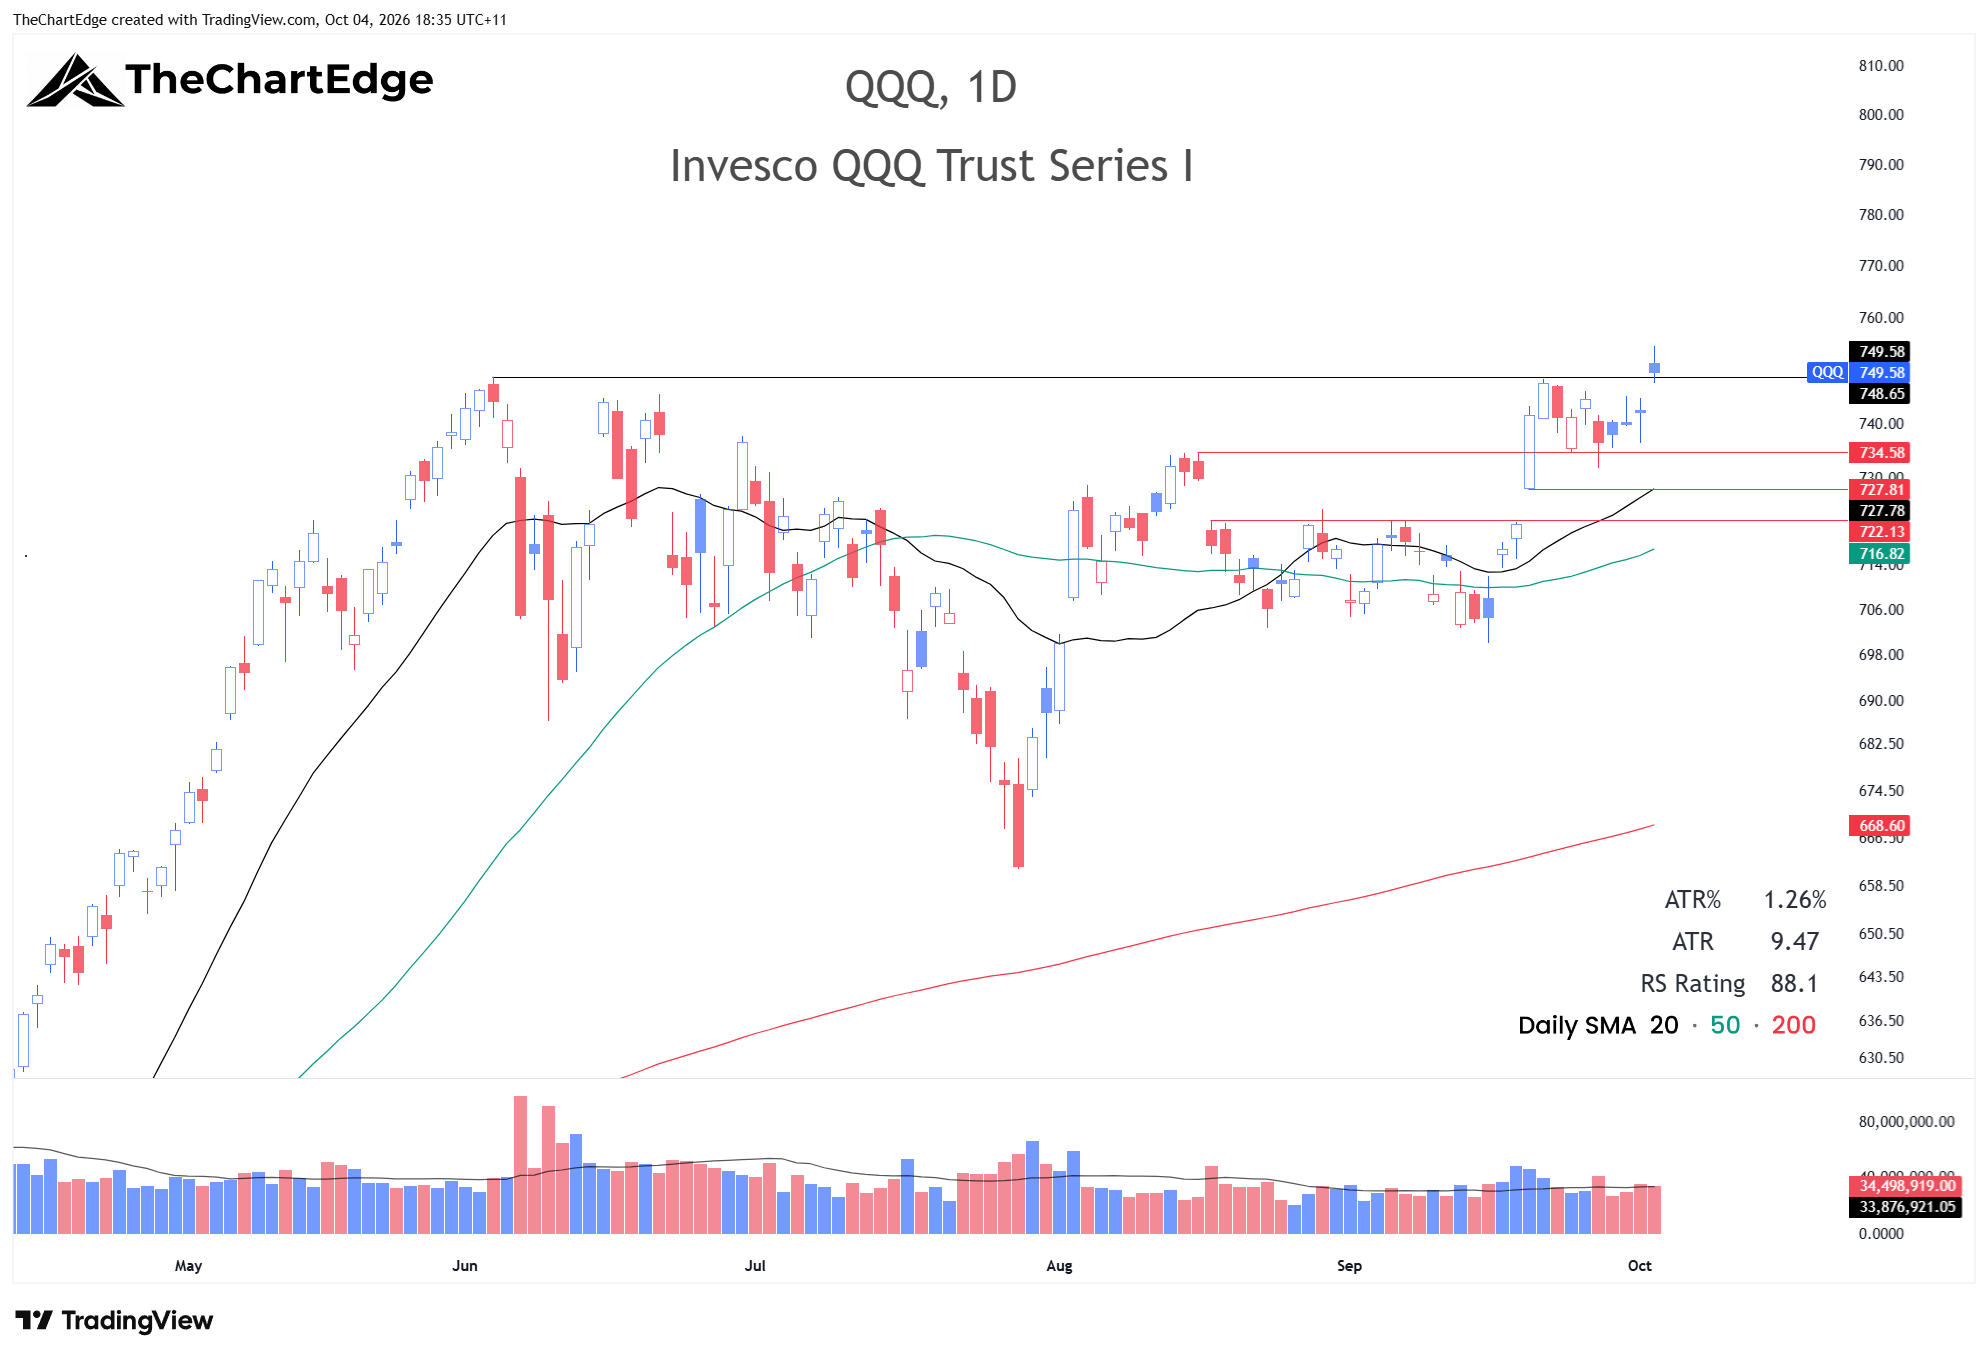
QQQ closed at 749.58, another all-time weekly closing high. However, Friday’s close after the gap up was a little weak and it’s somewhat extended from the 20 and 50-day SMAs. Any pullback would ideally form a higher low above the 20-day SMA.
Market Temperature
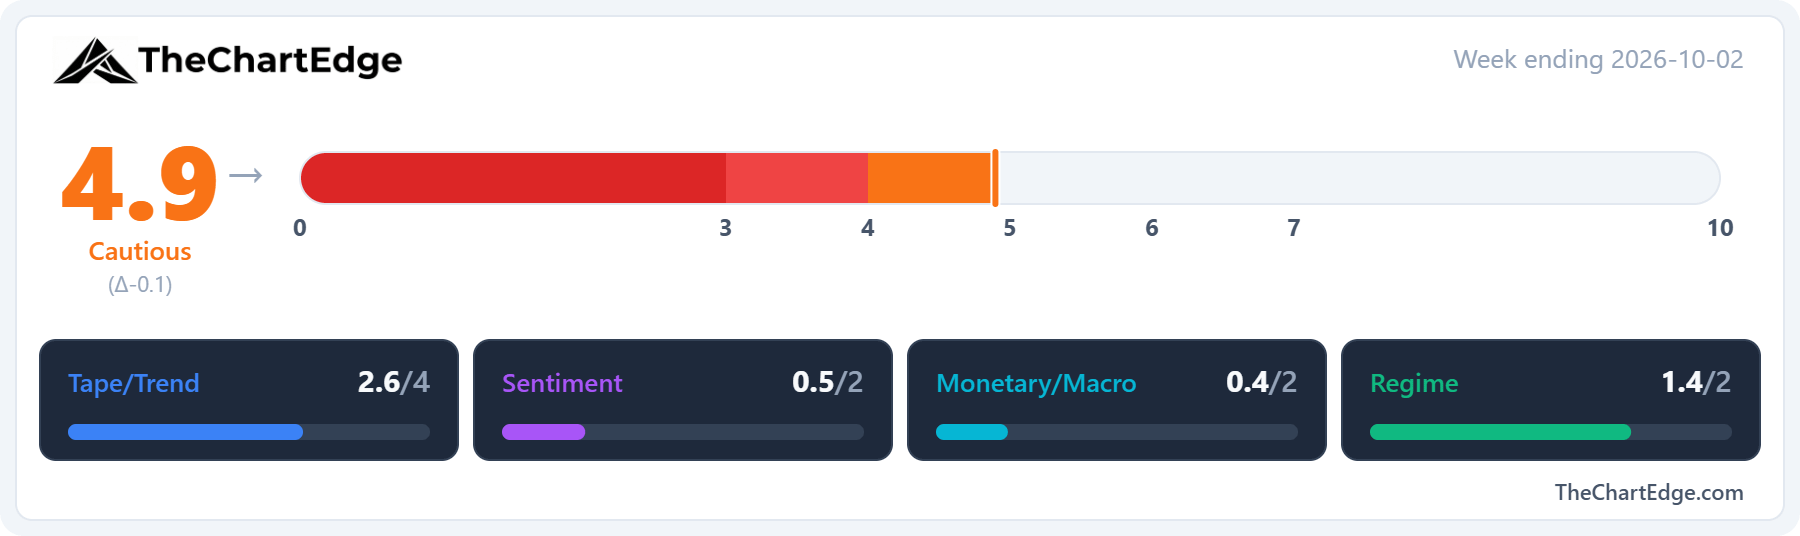
The Market Temperature came in at 4.9, down from 5.0, and is back in the Cautious Zone after one week in Goldilocks.
The Monetary/Macro pillar was responsible for all the fall - the other three pillars all rose slightly. Most of it was due to the US dollar, with UUP up 2.9% against its 4-week comparison (the DXY also closed above its late June highs). The MOVE index rose to 107.3 from 96.0, and credit spreads continued to widen. Yields on Treasuries also finished higher again, with the 10-year at 5.28% up from 5.18% and the 30-year at 5.63% up from 5.50%.
Breadth continued to deteriorate - the share of US stocks above their 50-day moving average fell for a 7th straight week, to 27.9% from 30.2% last weekend and 34.0% two weeks ago. The 200-day measure fell to 43.2% from 45.8%. However, both scored slightly better in the model again, as the two-week look-back compares against a lower reading.
GICS Sector Relative Strength
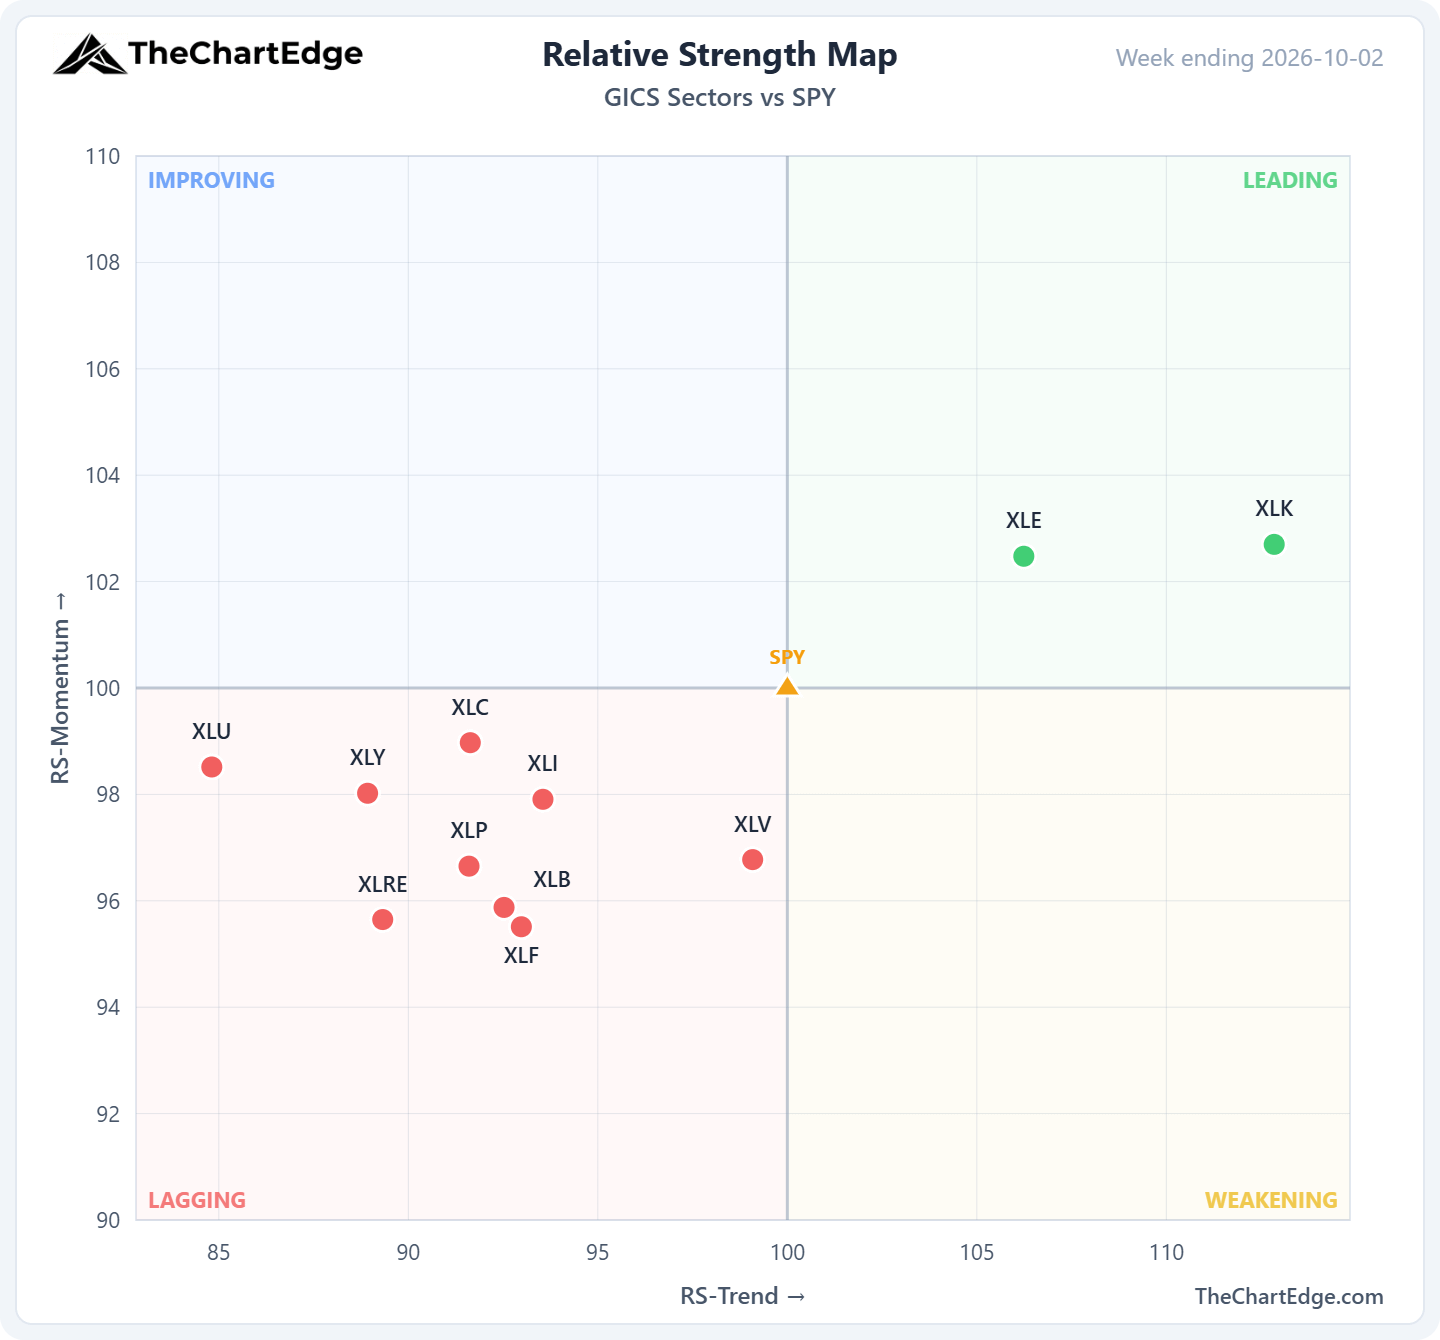
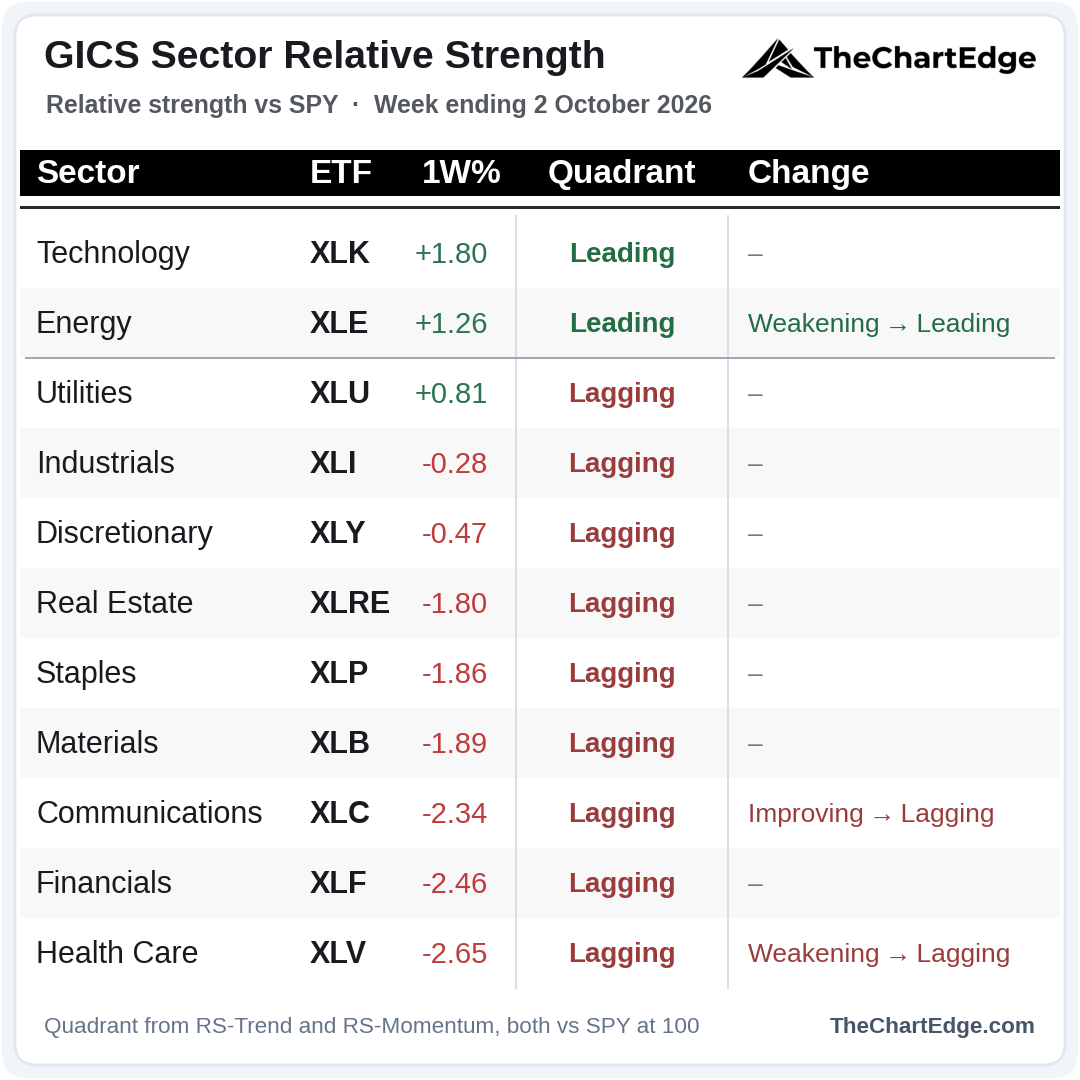
Technology, energy and utilities were the only sectors to finish higher. Energy moved from Weakening back into Leading, joining technology. Health care and communications both fell into Lagging, leaving 9 of the 11 there.
Momentum Leaderboard
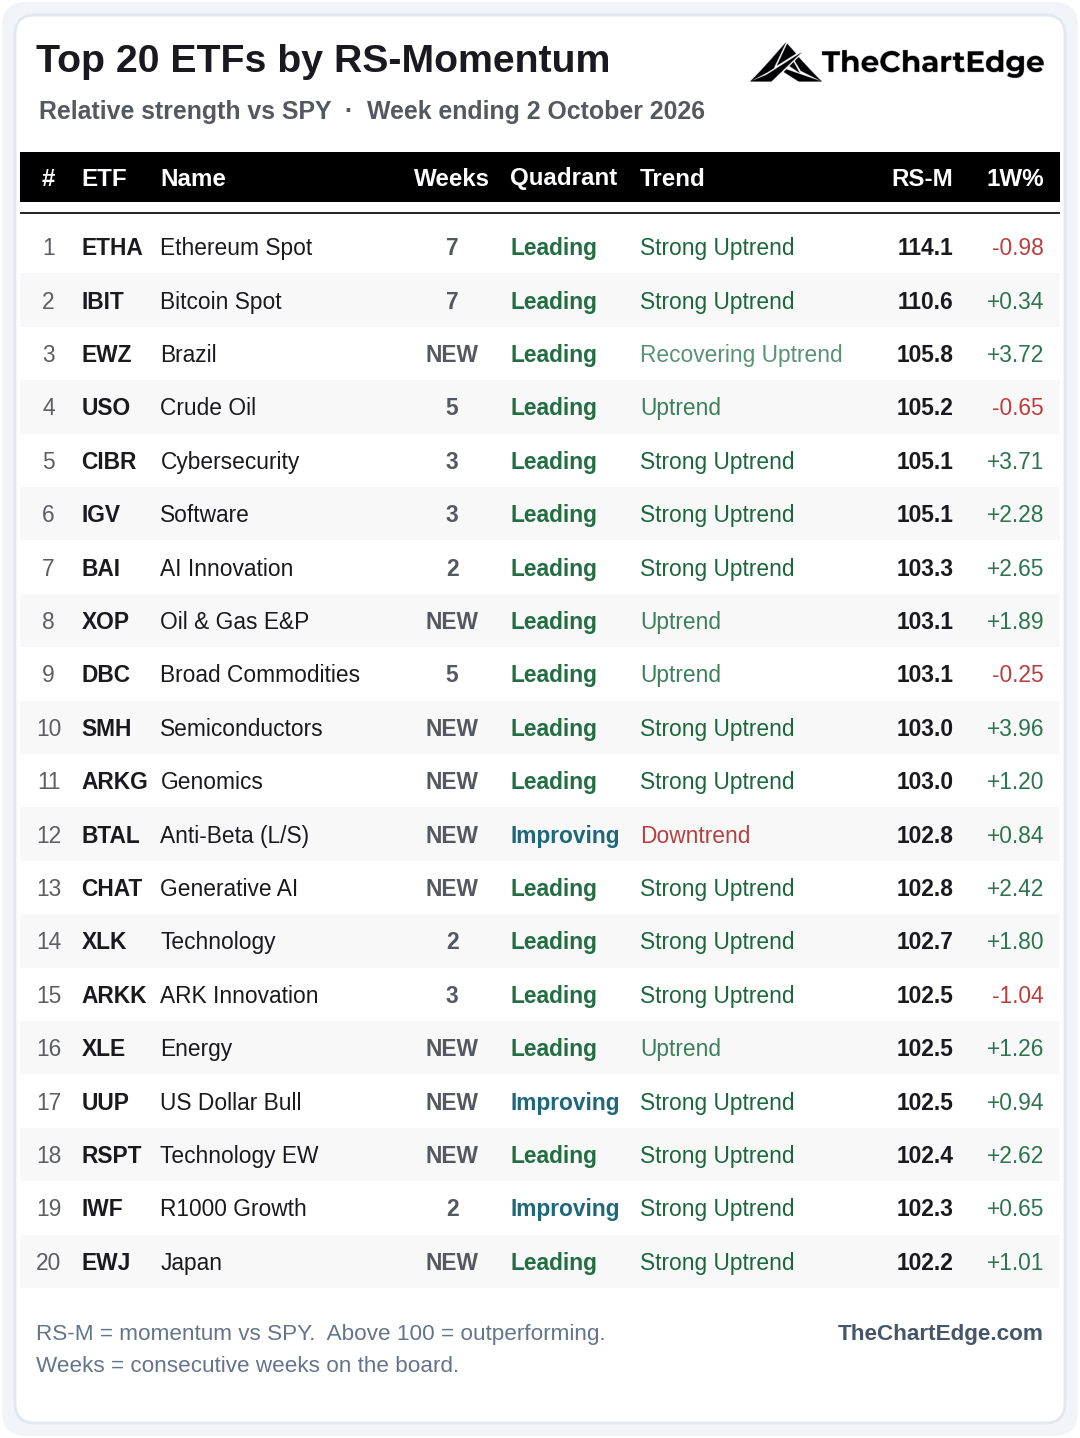
10 of the 20 are new again. The mega-caps and Nasdaq names are gone - FNGS, QQQ and QQEW - along with internet (FDN), communications (XLC), AI (THNQ), equal-weight semis (XSD), cloud computing (FCLD), ARK Autonomous Tech (ARKQ) and natural gas (UNG).
Semiconductors (SMH), generative AI (CHAT) and equal-weight technology (RSPT) are all back for the first time since June, joined by energy (XOP and XLE), Brazil (EWZ), Japan (EWJ) and genomics (ARKG). Anti-Beta (BTAL) and the US dollar (UUP) are also back after one week off.
Ethereum (ETHA) holds number 1 for a 7th straight week, sharing the longest streak on the board with Bitcoin (IBIT) at 7.
Trend States Across the Universe
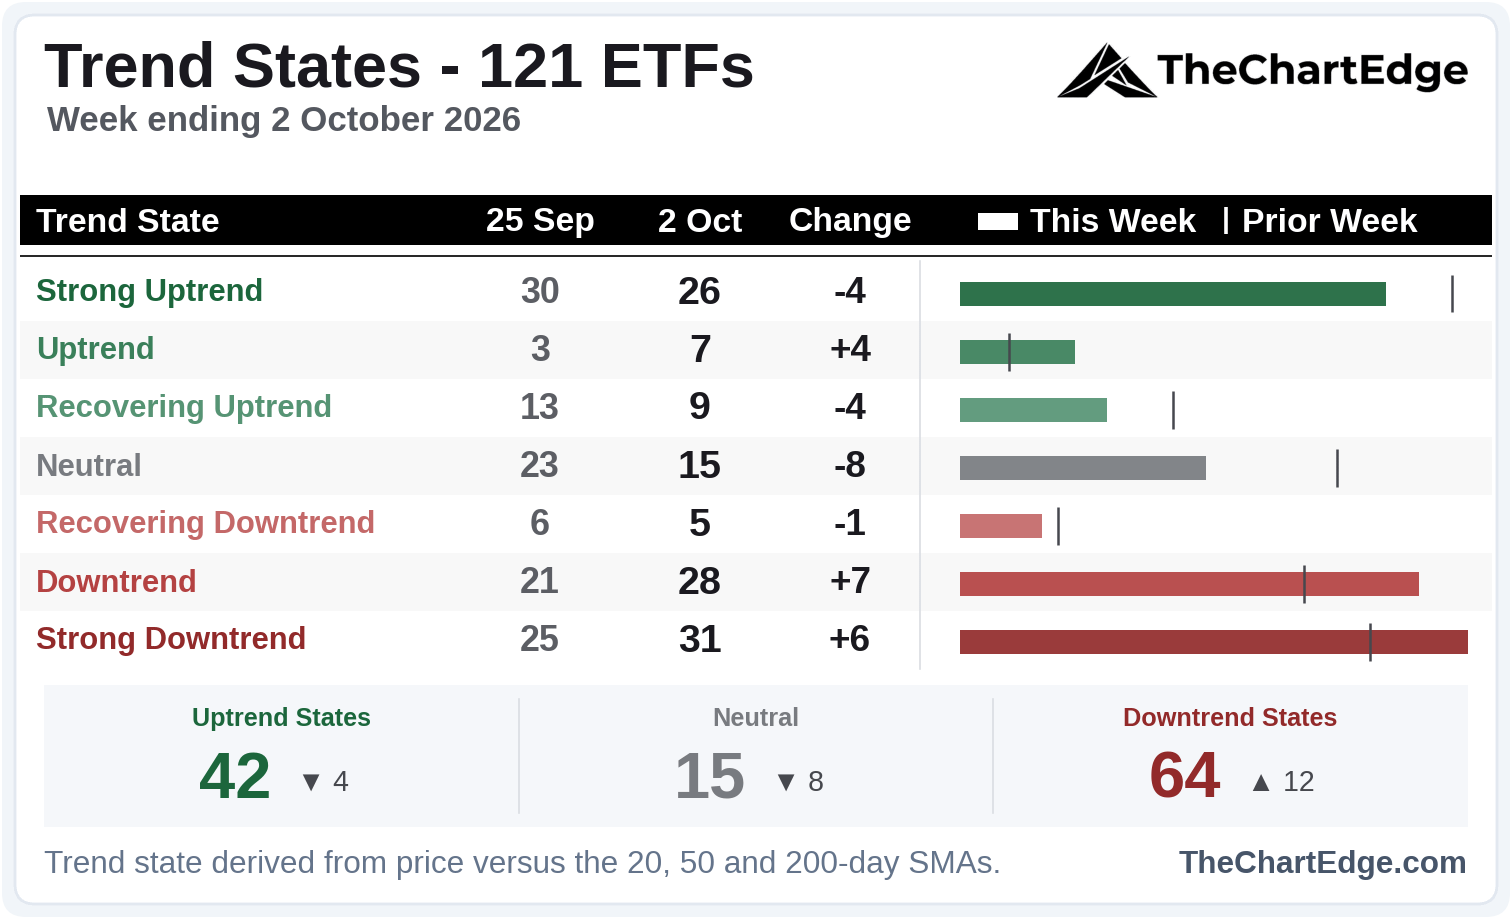
On aggregate, downtrend states now outnumber uptrend states by a wide margin.
Financials led the moves lower - XLF, equal-weight financials (RSPF), banks (KBE) and insurance (KIE) all slipped from Neutral into Downtrends. Health care (XLV) dropped from a Strong Uptrend straight to Neutral, and the gold and silver miners (GDX and SIL) fell from Recovering Uptrends into Recovering Downtrends.
Conversely, equal-weight semis (XSD), Bitcoin (IBIT) and Ethereum (ETHA) moved up into Strong Uptrends, as their SMAs finally returned to bullish alignment.
Industry Breadth - Leading Stocks
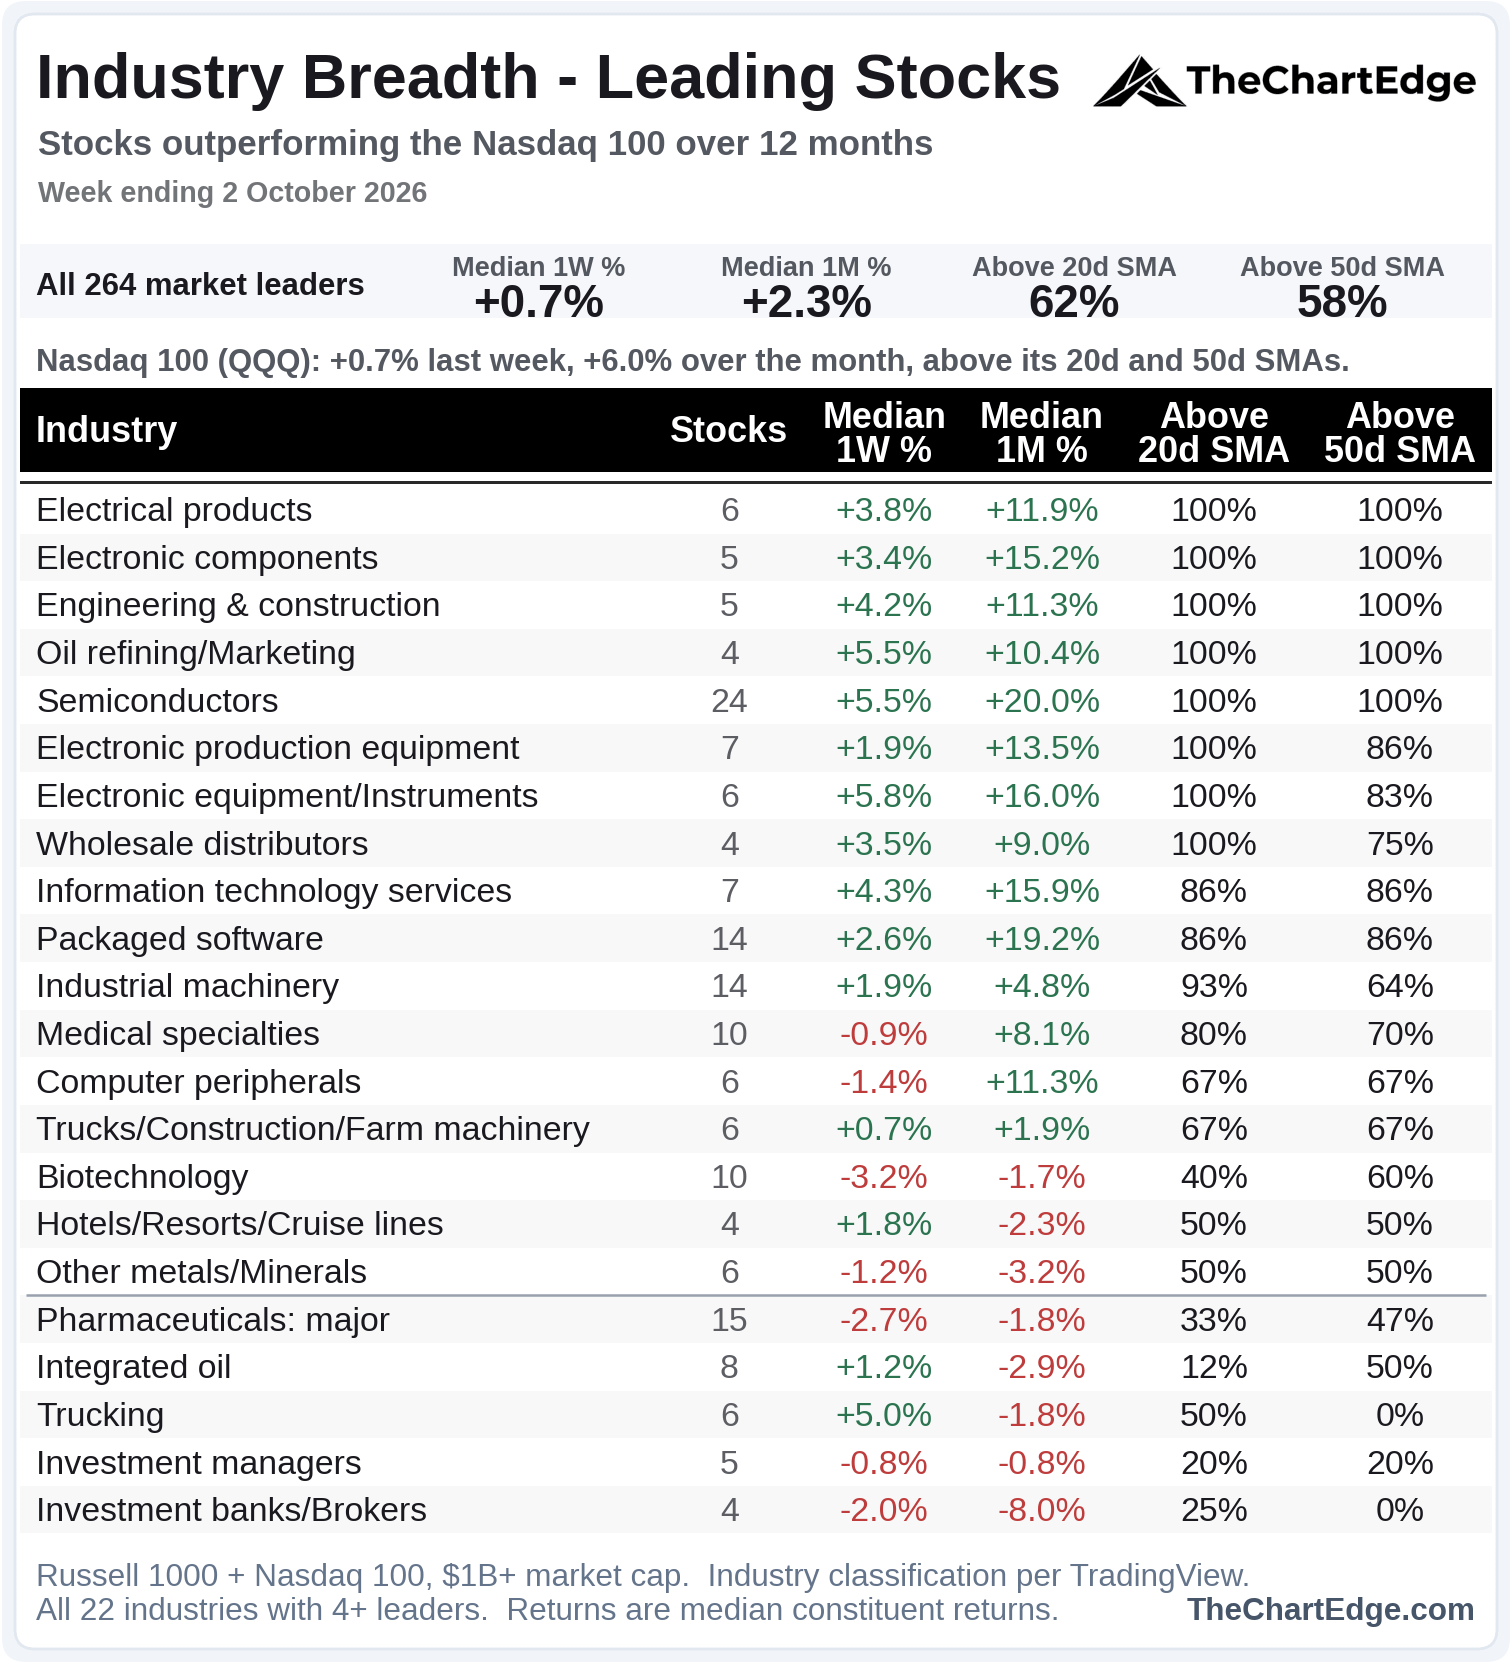
Semiconductors now have all 24 names above both their 20 and 50-day SMAs, joining electrical products, electronic components, engineering & construction and oil refining as the 5 industries with every name above both.
Computer peripherals saw a sharp deterioration, going from 2nd to 13th, and major pharmaceuticals dropped back below the 50% line.
What Actually Drove QQQ
It wasn’t the mega-caps. Apart from NVIDIA, the Magnificent 7 were a net drag on QQQ, mostly due to Apple (AAPL) and Meta (META).
NVIDIA (NVDA) alone accounted for roughly half of QQQ’s gain. The chip equipment makers - Applied Materials (AMAT), Lam Research (LRCX), KLA (KLAC) and ASML - added even more, despite being only about 5% of the index. Cybersecurity (PANW, CRWD and FTNT) and SpaceX (SPCX) contributed too.
The memory and storage names were a drag - Micron (MU), SanDisk (SNDK), Western Digital (WDC) and Seagate (STX) all finished lower.
57 of QQQ’s 101 holdings fell (there are 101 names because of Alphabet’s two classes of shares), and fewer than half are now above their 20 and 50-day SMAs - 49.5% and 43.6% respectively, down from 54.5% and 46.5% the prior week.
Semiconductors (SMH) Chart
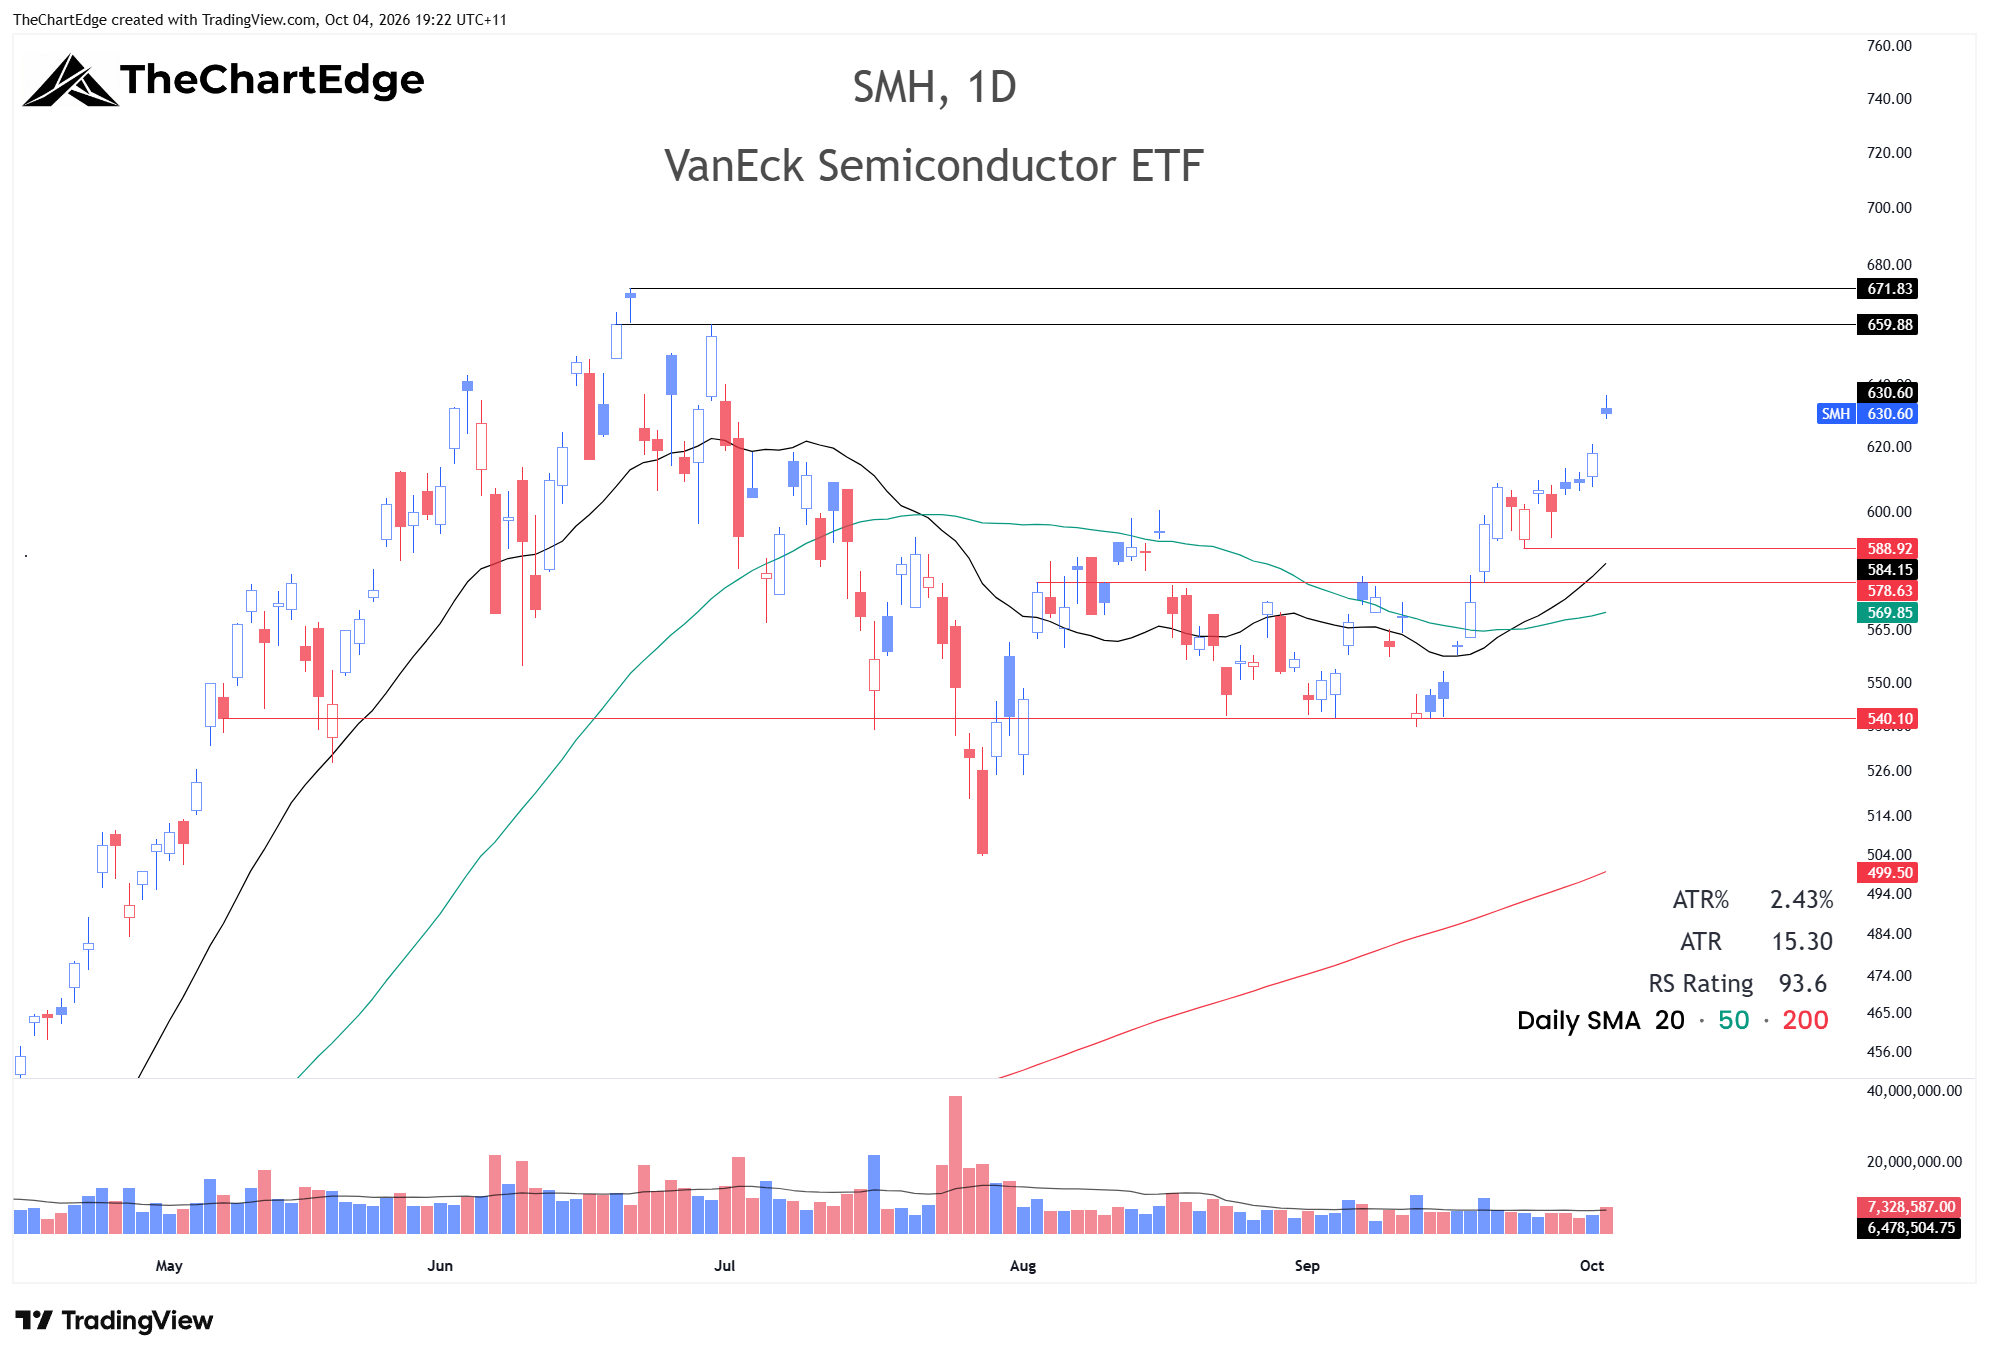
SMH didn’t give me the pullback I was hoping for. It pushed higher, closing at 630.60, 6.1% below its all-time high and now more than 3 x ATR above its 20-day SMA.
Lam Research (LRCX) Chart
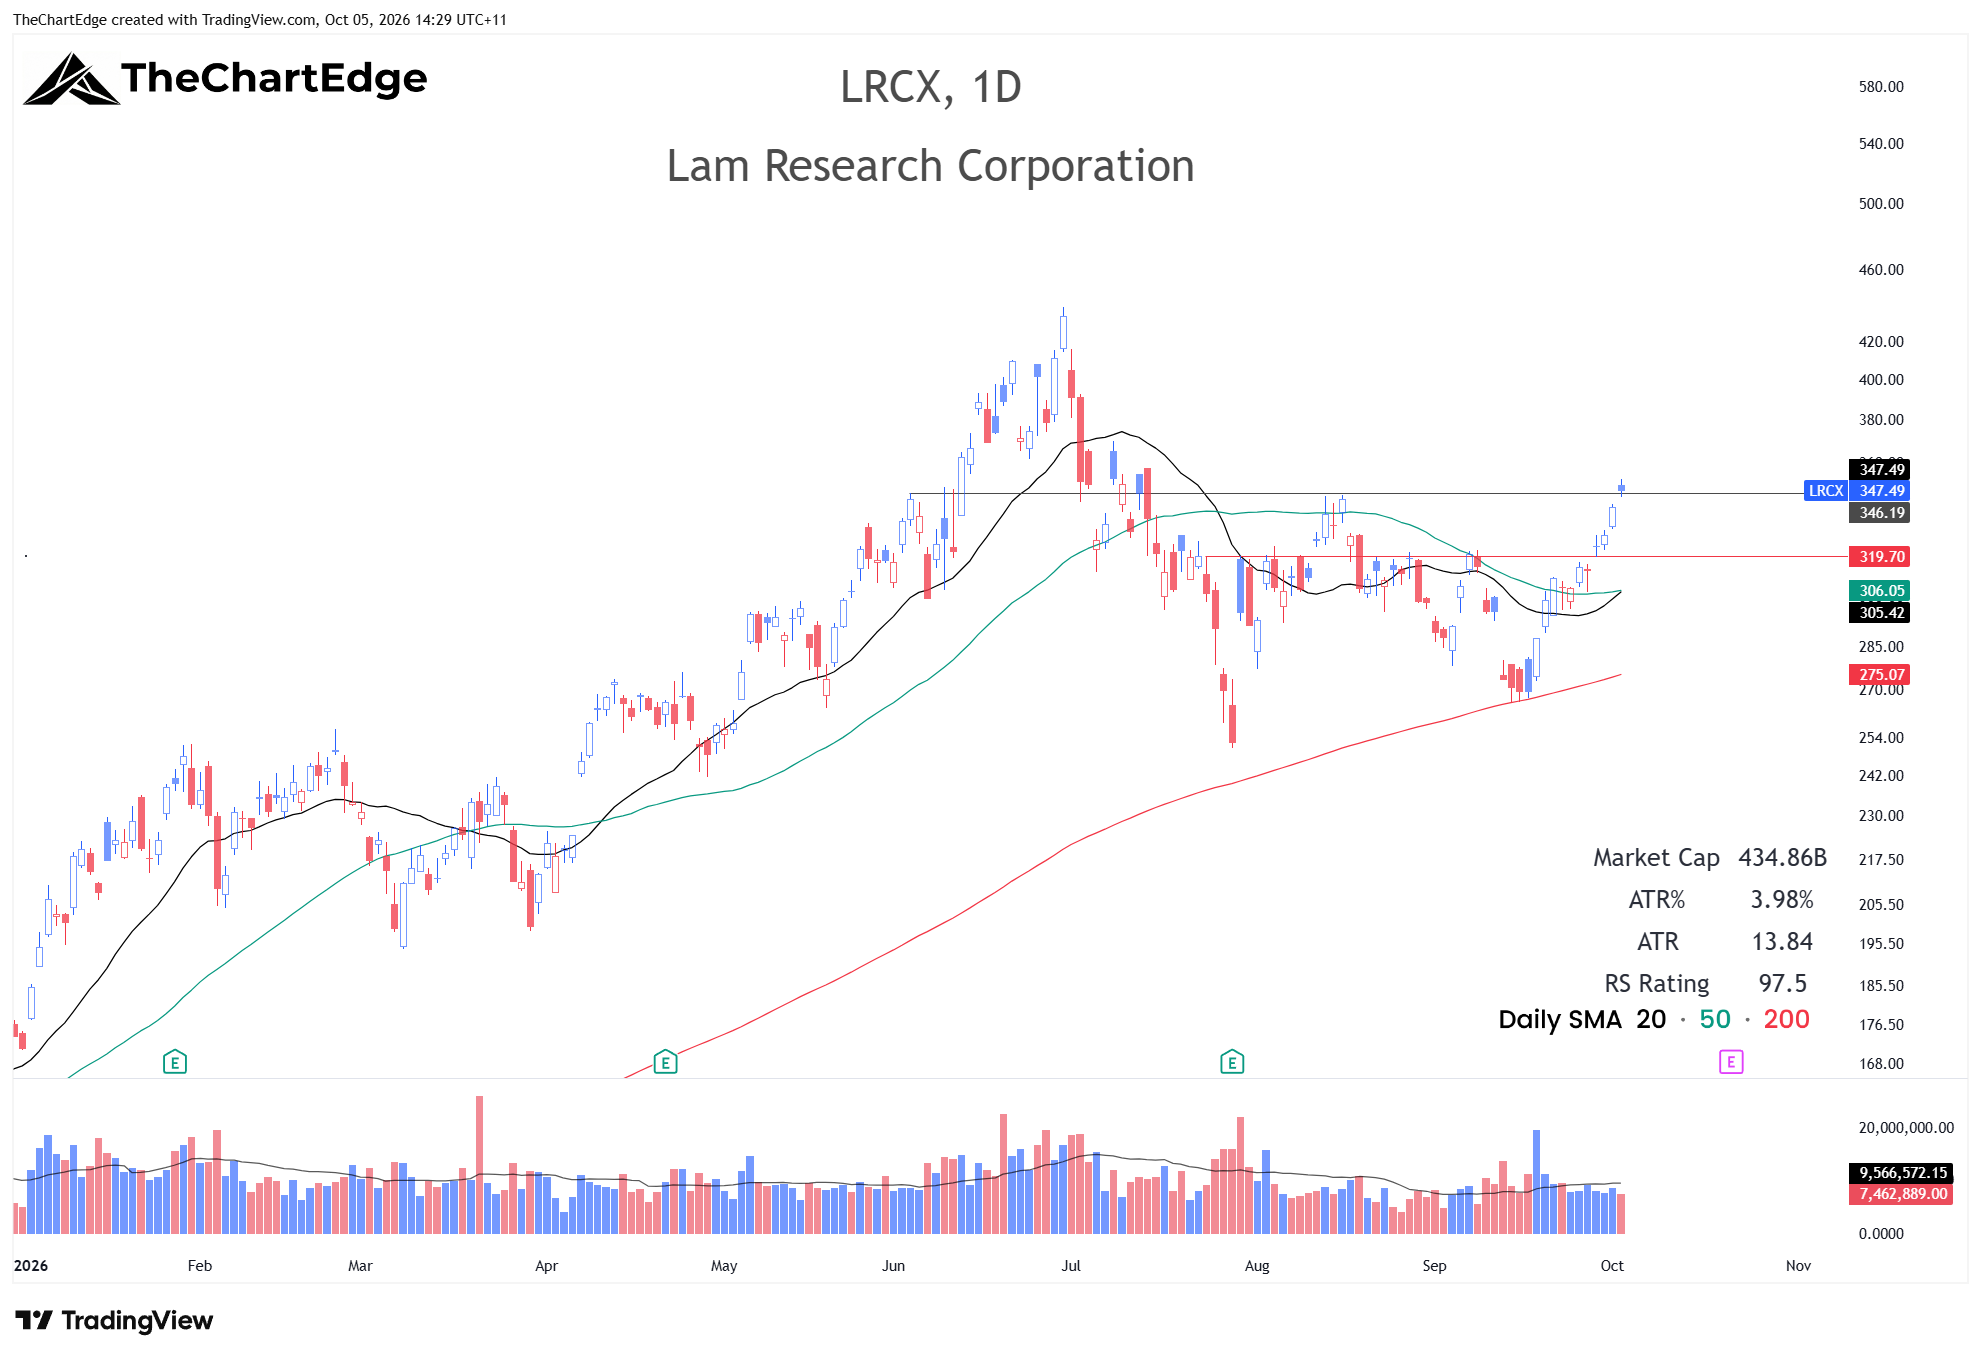
LRCX rose 10.2% for the week but is still around 21% below the June 30 all-time high. It’s currently more than 3 x ATR above its 20-day, but a pullback that forms a higher low above 320 could be a potential entry opportunity. Earnings are on October 22 though.
Large Caps Near All-Time Highs
I’ve included a new scan this weekend - stocks in the S&P 500, Nasdaq 100 and Russell 1000 that are within 10% of their all-time highs, with a market cap above $15 billion and at least $100 million in turnover on Friday. 87 names made the cut, and 44 of them are in Strong Uptrends. Strength in two groups stood out.
Cybersecurity
Rubrik (RBRK), Fortinet (FTNT), CrowdStrike (CRWD), Palo Alto Networks (PANW) and F5 (FFIV) all finished within 2% of their all-time highs and in Strong Uptrends.
CrowdStrike (CRWD) Chart
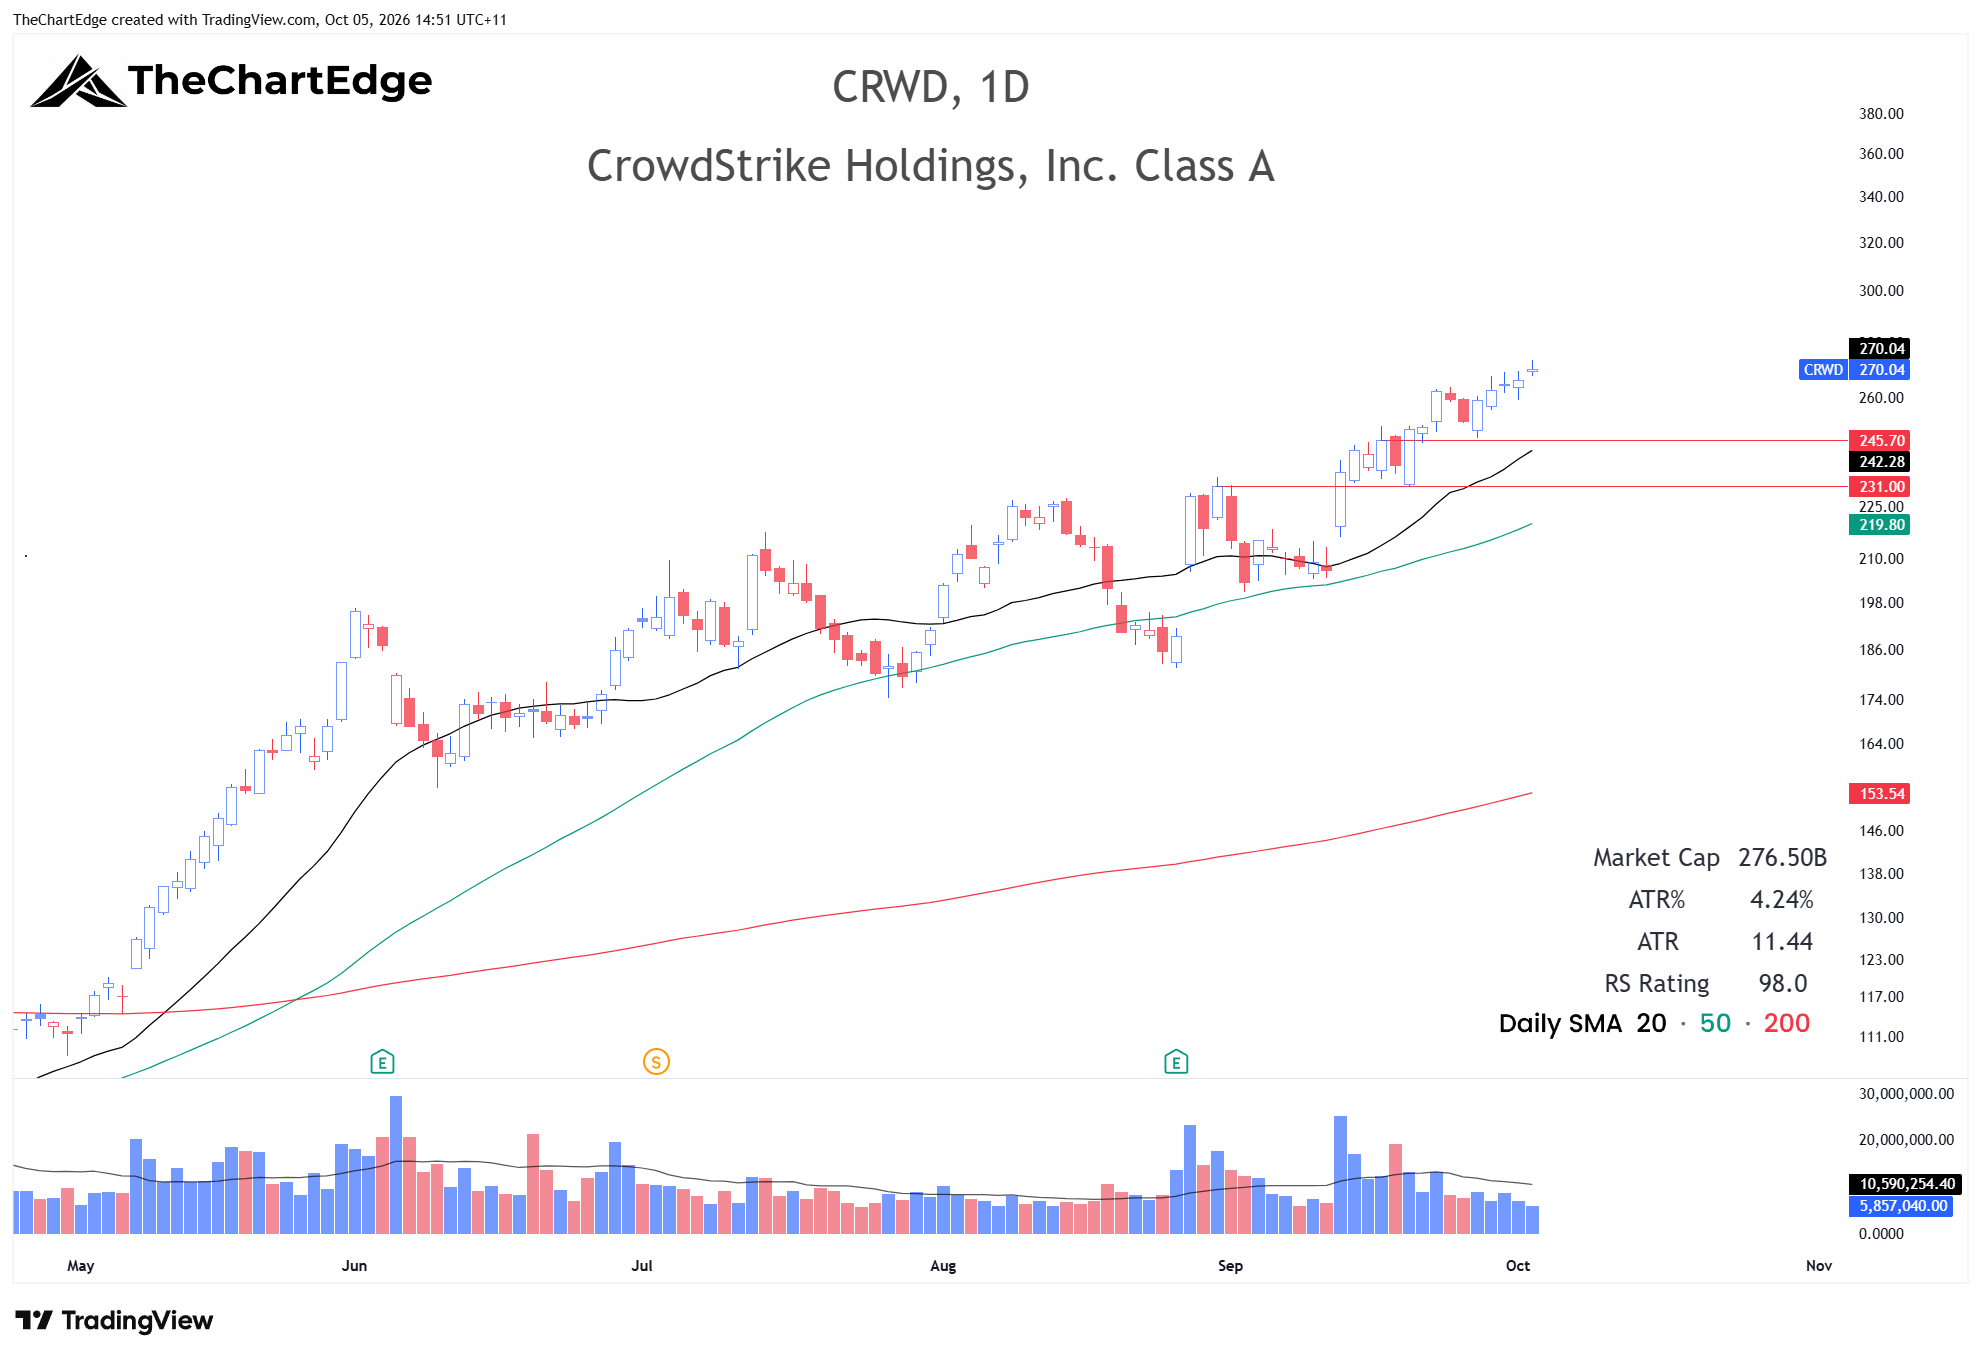
CRWD rose 7.1% to 270.04 - it’s not buyable here but might be on strength after a pullback towards 231-246, or some sort of consolidation that holds above this area.
Oil Refiners
Marathon Petroleum (MPC), Valero (VLO), HF Sinclair (DINO) and Phillips 66 (PSX) are all in Strong Uptrends, within 5% of their all-time highs and less than 1.5 x ATR above their 20-day SMAs. It’s a different picture from the energy ETFs - XLE and XOP, which both finished the week below their 20-day.
Marathon Petroleum (MPC) Chart
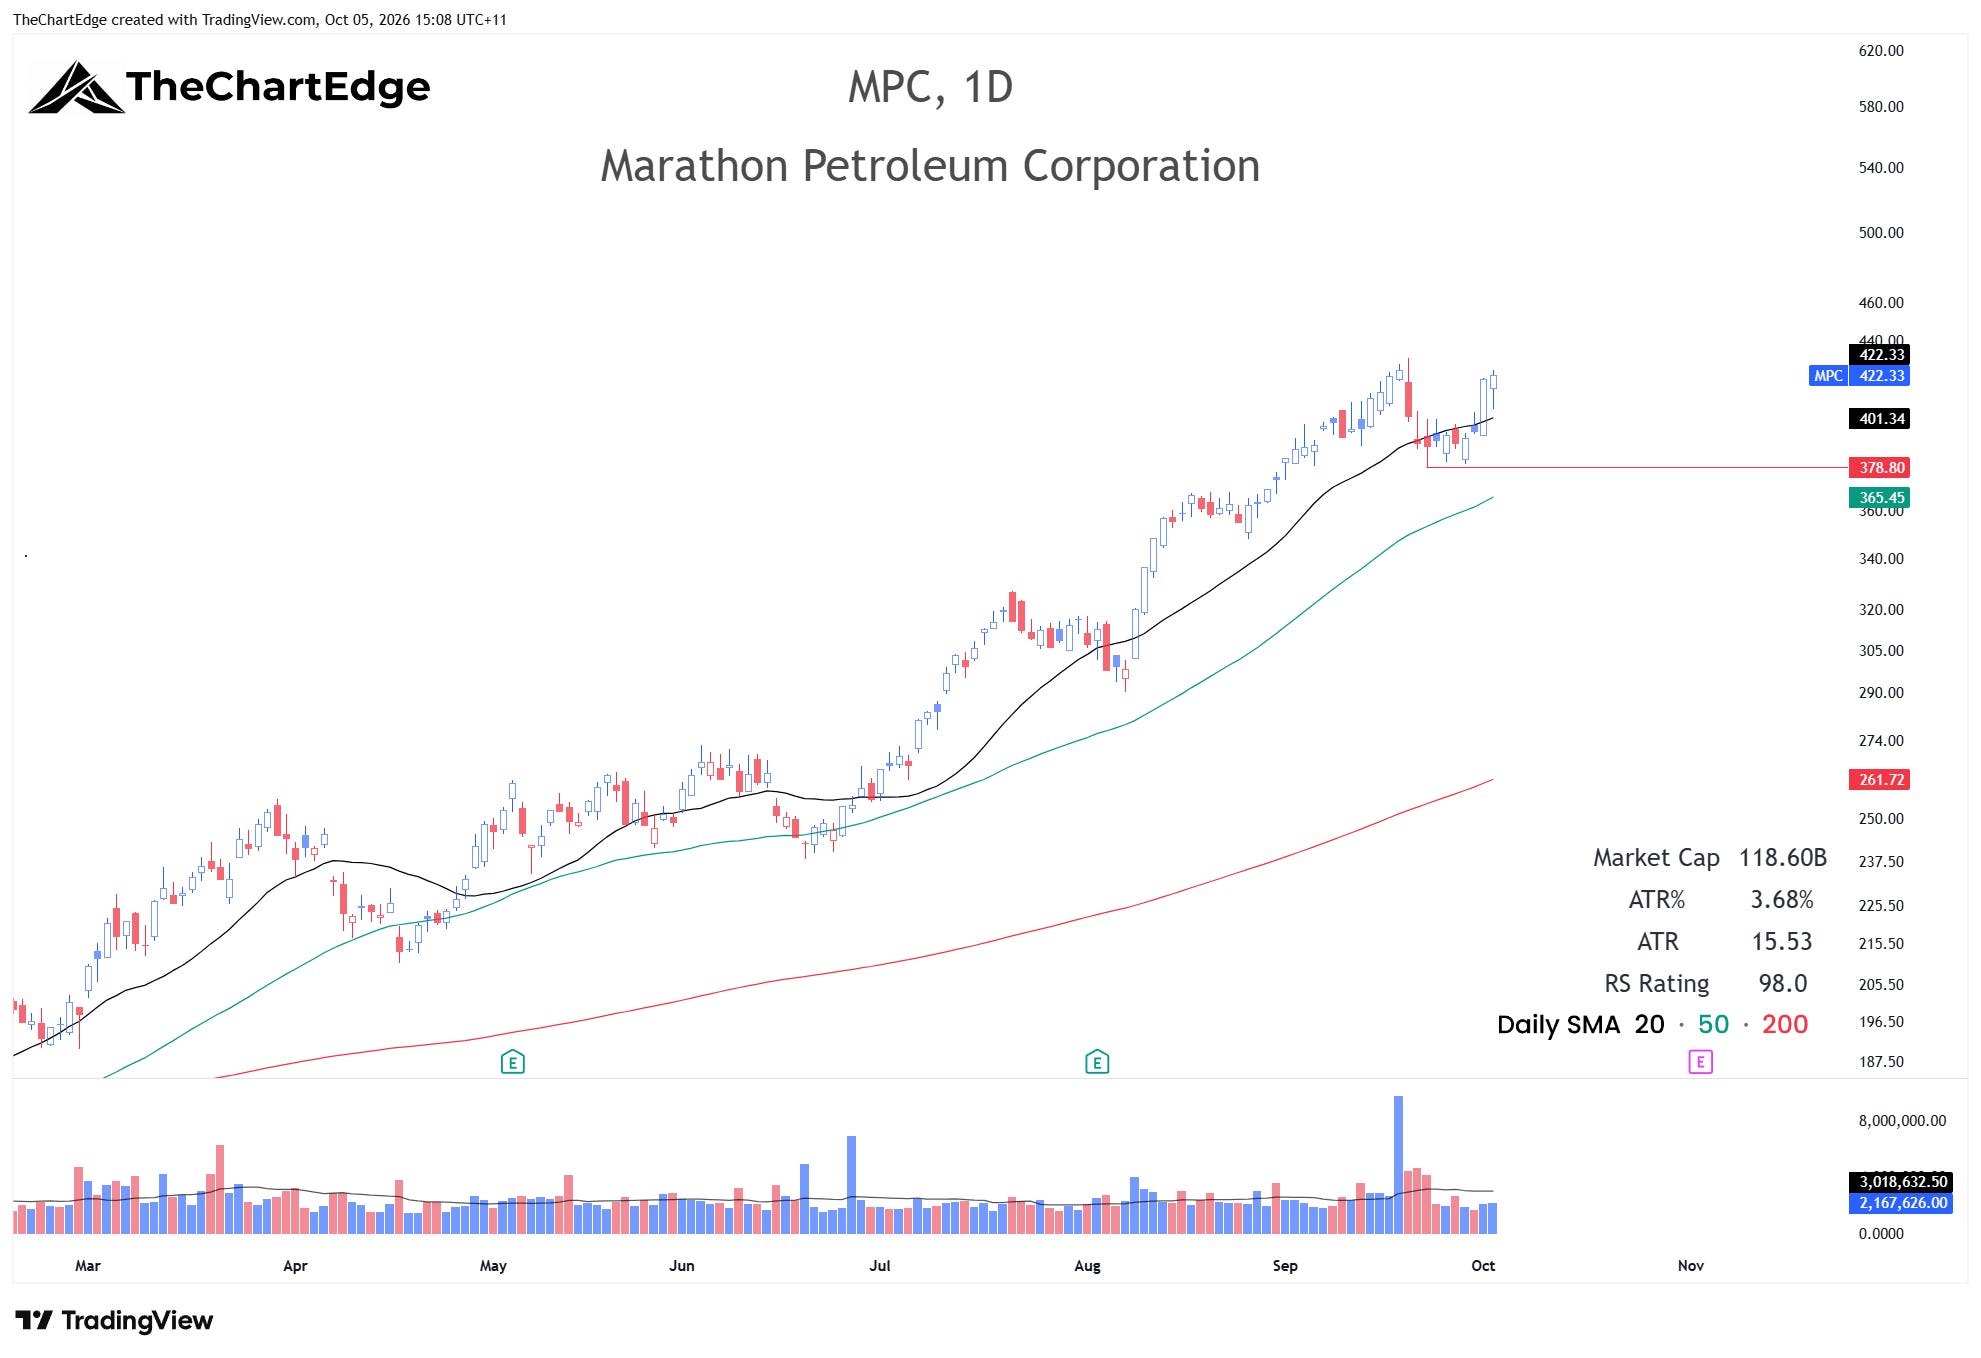
MPC rose 7.3% to 422.33, 2.0% below its all-time high. Headline risk is high for MPC and the group, but they could provide a useful hedge if Middle East tensions flare again.
Outside those two groups, the scan also shows where weakness is creeping in. 12 financials made the cut, including Berkshire Hathaway (BRK.B), Visa (V), Mastercard (MA) and JPMorgan (JPM), but none of them is in a Strong Uptrend and 11 of the 12 finished below their 20-day SMA. Pharma is similar - Johnson & Johnson (JNJ), Merck (MRK) and Vertex (VRTX) are all below their 20-day, while the life science tools names, Thermo Fisher (TMO), Waters (WAT) and Agilent (A), are in Strong Uptrends.
Trades & Follow-Ups
FCLD is still my only swing position, and my stop remains at 42.90 - my plan at this stage is to raise it to or near breakeven if it breaks out to all-time highs.
Cloud Computing (FCLD) Chart
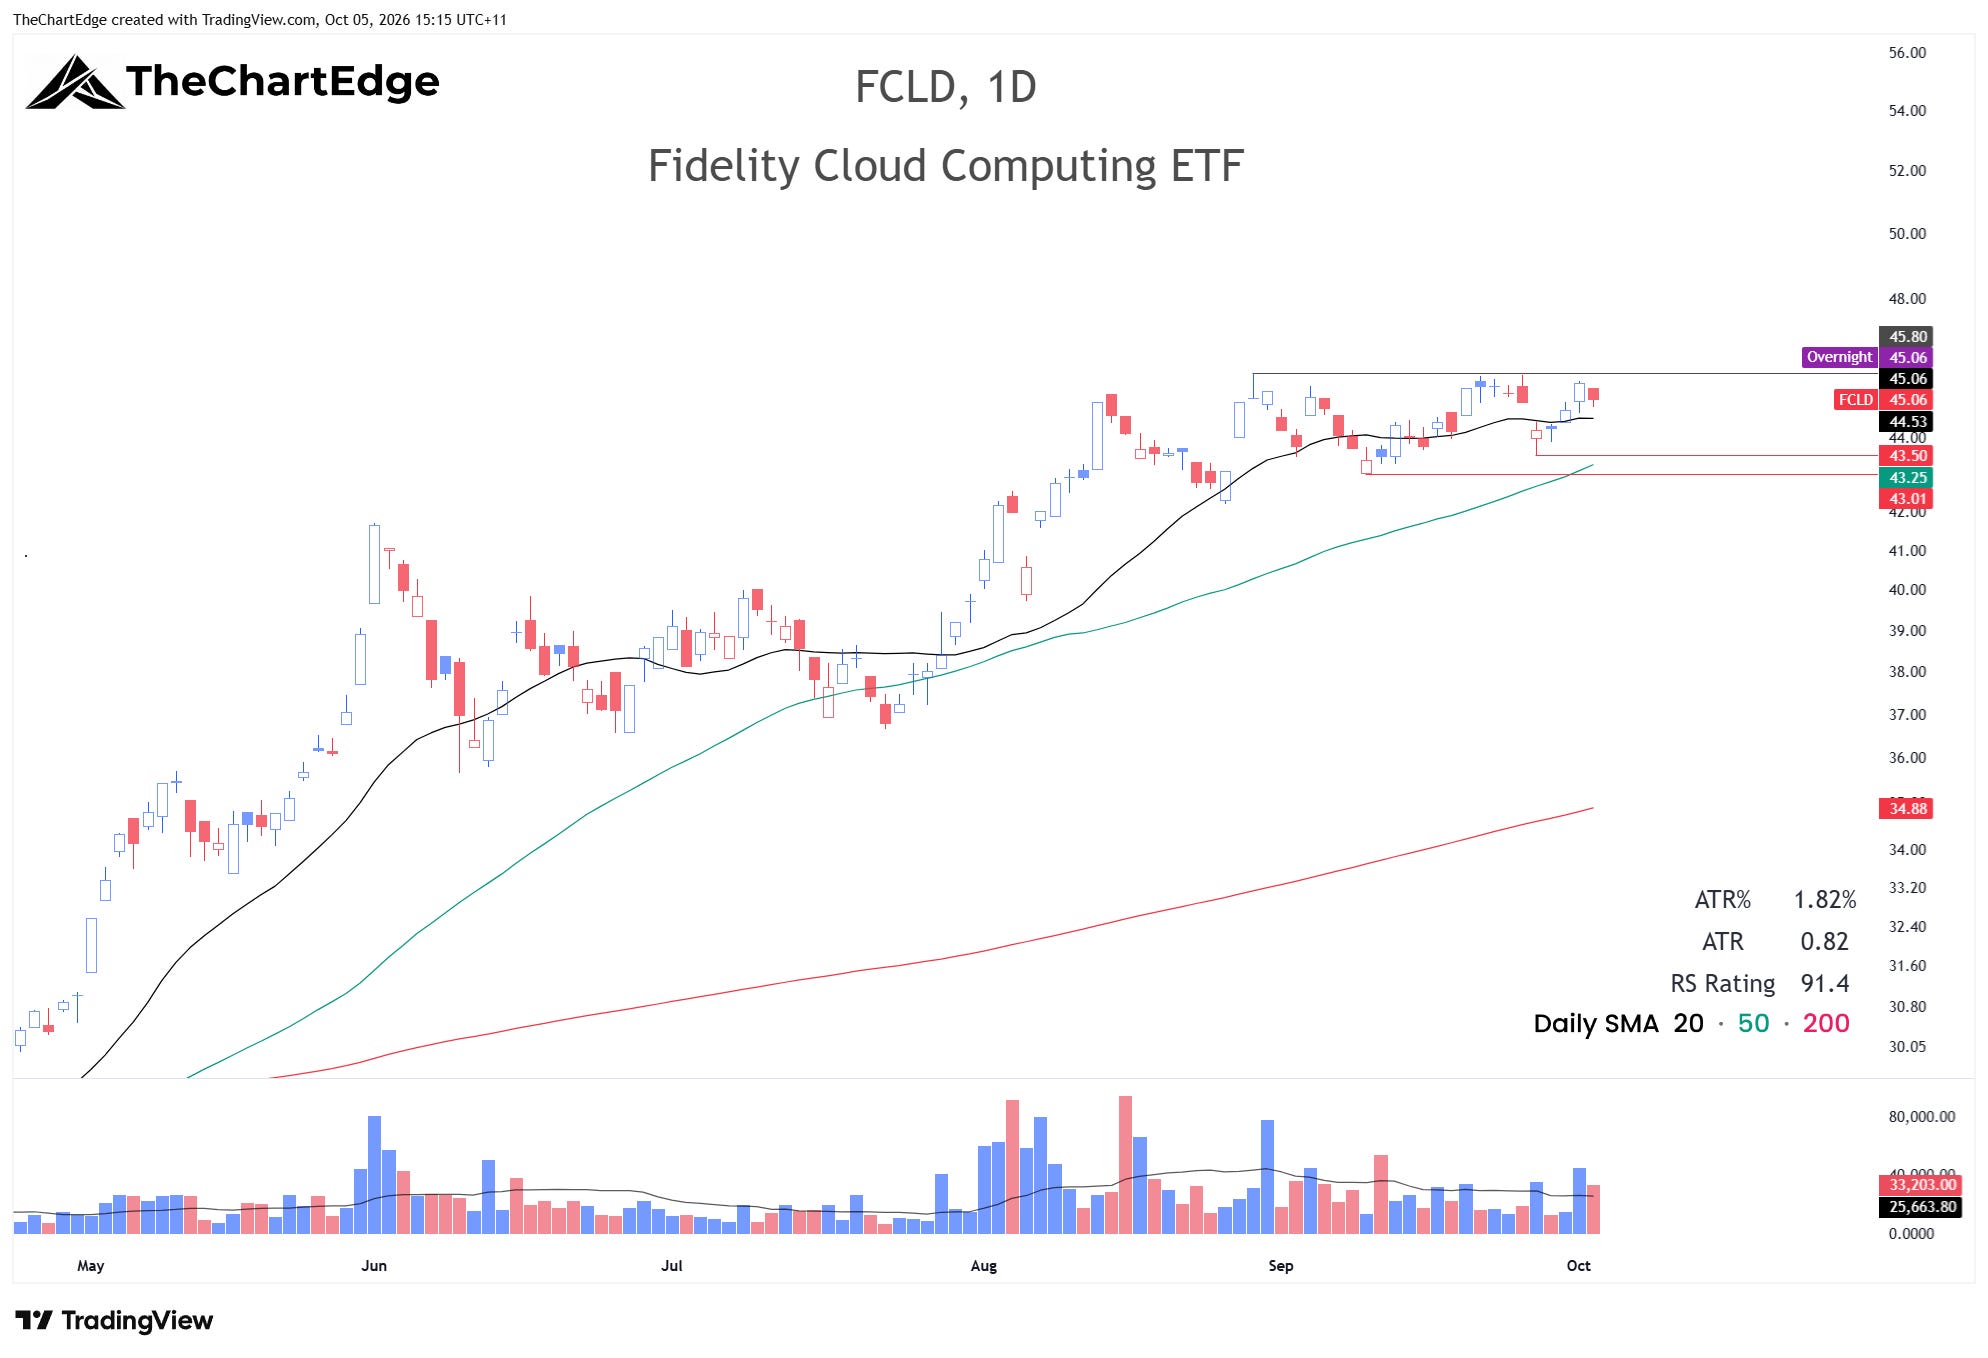
FCLD closed at 45.06, 1.6% below its all-time high.
Ethereum Chart
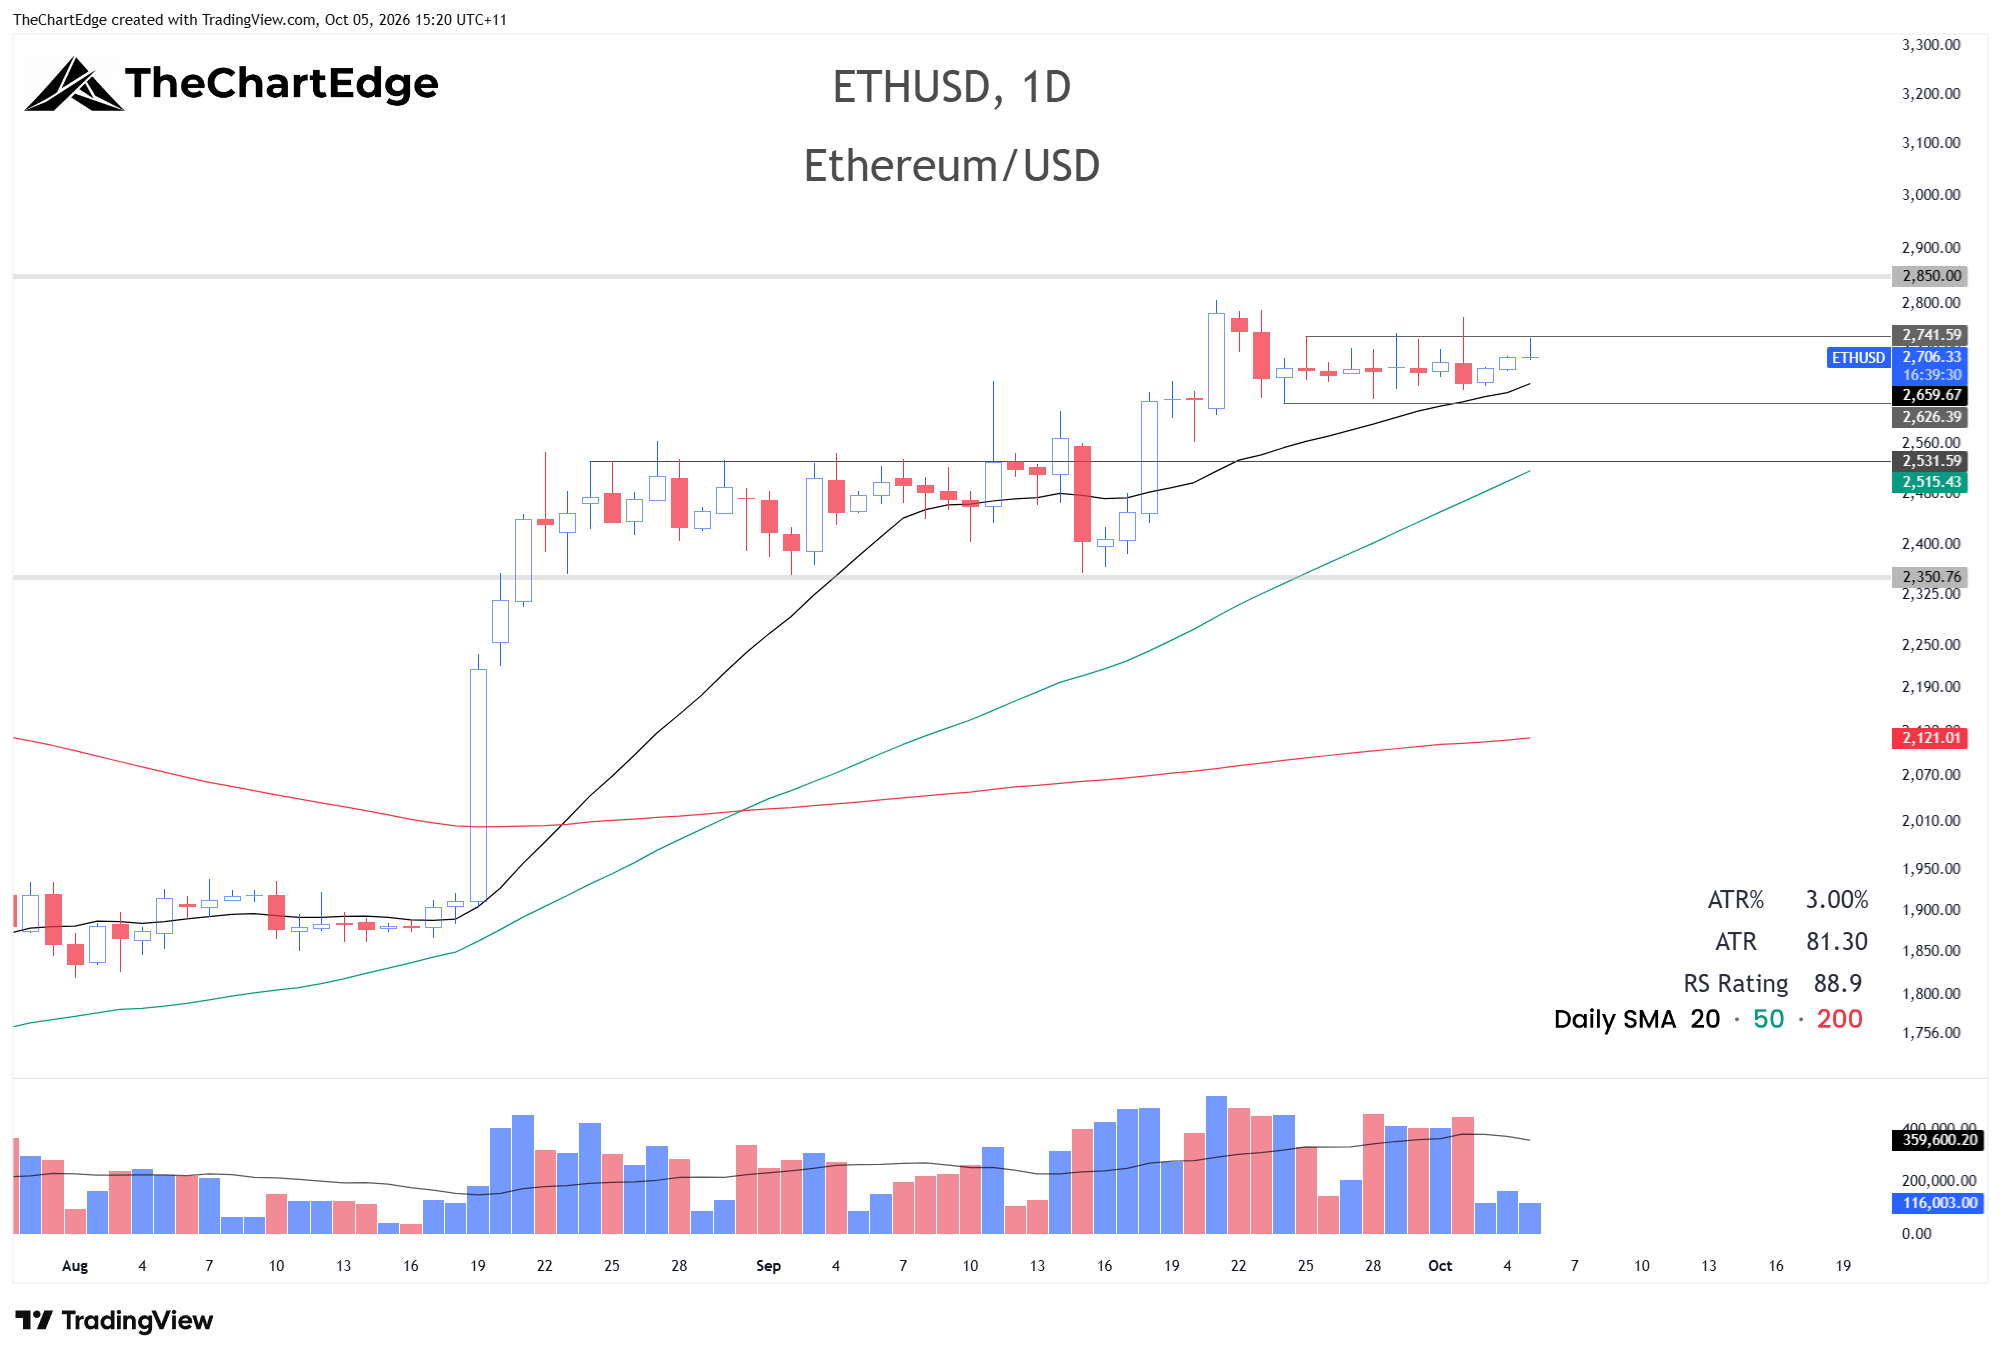
ETH has been consolidating in a tight range between about 2625 and 2740, just above a rising 20-day SMA. On Friday it looked like it was going to break out, but it reversed and swiftly retested the mid to lower end of the range. It’s currently trading around 2720, on Monday early evening Melbourne time. I’d still like to see it pull back and test 2515-2530 before going higher, but I’m prepared to buy strength if it breaks above 2800.
The Week Ahead
I’m mindful the breadth divergences are getting worse. SPY and QQQ are holding up mainly due to tech names, while most of what I track outside tech looks poor. 40 of the 121 ETFs I track finished higher, from 52 last weekend. Also, the continued rise in the MOVE index makes me more cautious.
The Dow (DIA) and Russell 2000 (IWM) both bounced very close to their 200-day SMAs on Thursday, with DIA turning higher right at the February high around 505. Neither is something I’d buy, but if tech holds up and other areas start to recover, it would be a positive sign.
With the Market Temperature back in Cautious, that’s exactly what I plan to be for now.
Stay open-minded and manage risk carefully.
Cheers,
Marcus Grant, CFTe
Disclaimer: The content provided in this newsletter is for informational and educational purposes only and should not be considered as financial, investment, or legal advice. It is general information only and does not take into account your objectives, financial situation or needs. The information shared is based on our research and analysis, but we are not a licensed financial advisor, nor can we guarantee its accuracy, completeness, or timeliness. Market conditions and financial instruments can change rapidly, and any opinions expressed may not be suitable for all investors. Any opinions expressed and/or securities mentioned do not constitute a recommendation to buy, sell, or hold that or any other security. You should conduct your own due diligence and consult with a licensed financial advisor or other professional before making any investment decisions. Past performance is not indicative of future results, and all investments carry the risk of loss. The authors and publishers of this newsletter are not responsible for any financial decisions made based on the content provided herein. By reading and/or subscribing to this newsletter, you acknowledge and agree that you are using the information at your own risk.