


Apologies this is out late this week, I had something important I had to do the last couple of days and didn’t have time to finish it earlier.
Everything below is as of Friday September 18 close.
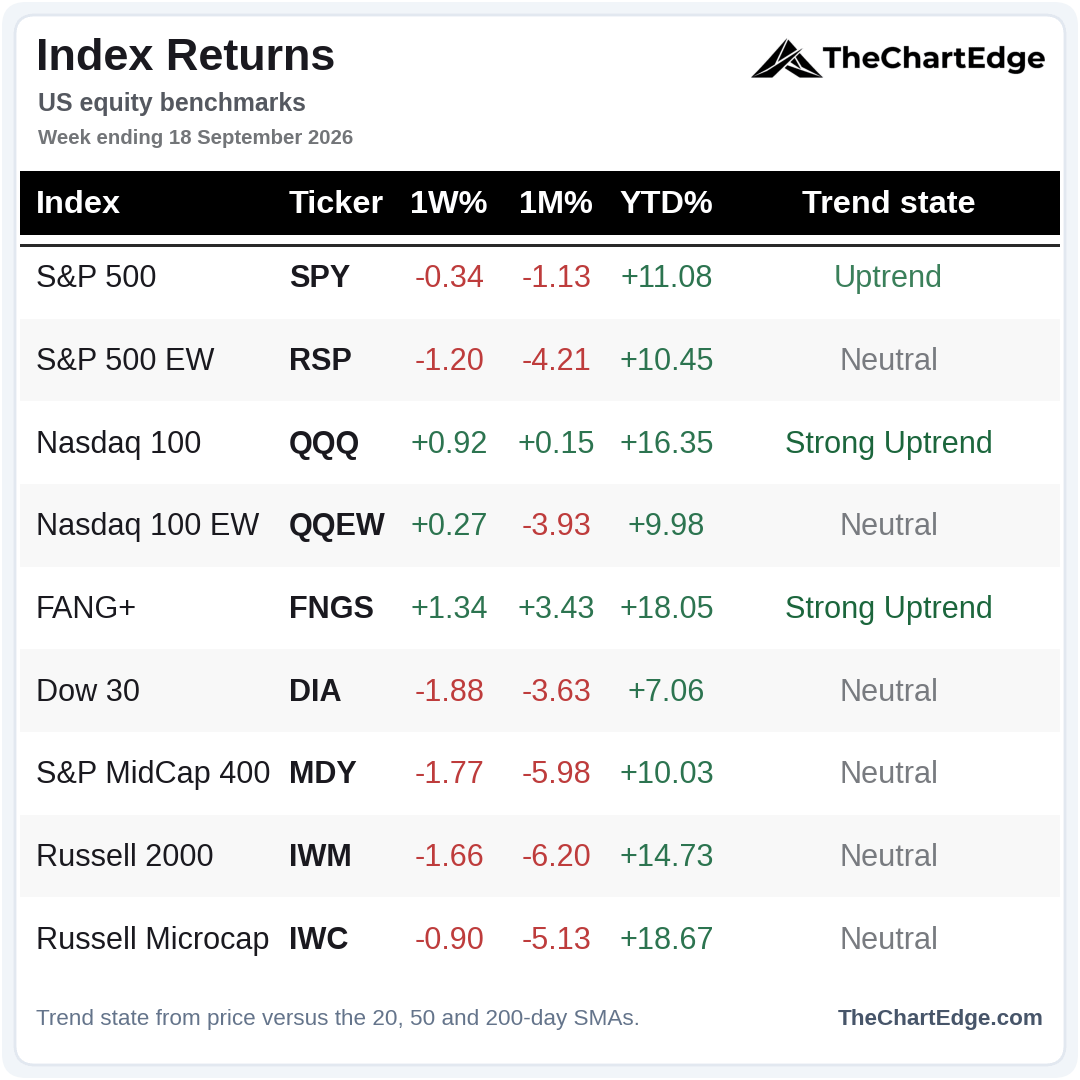
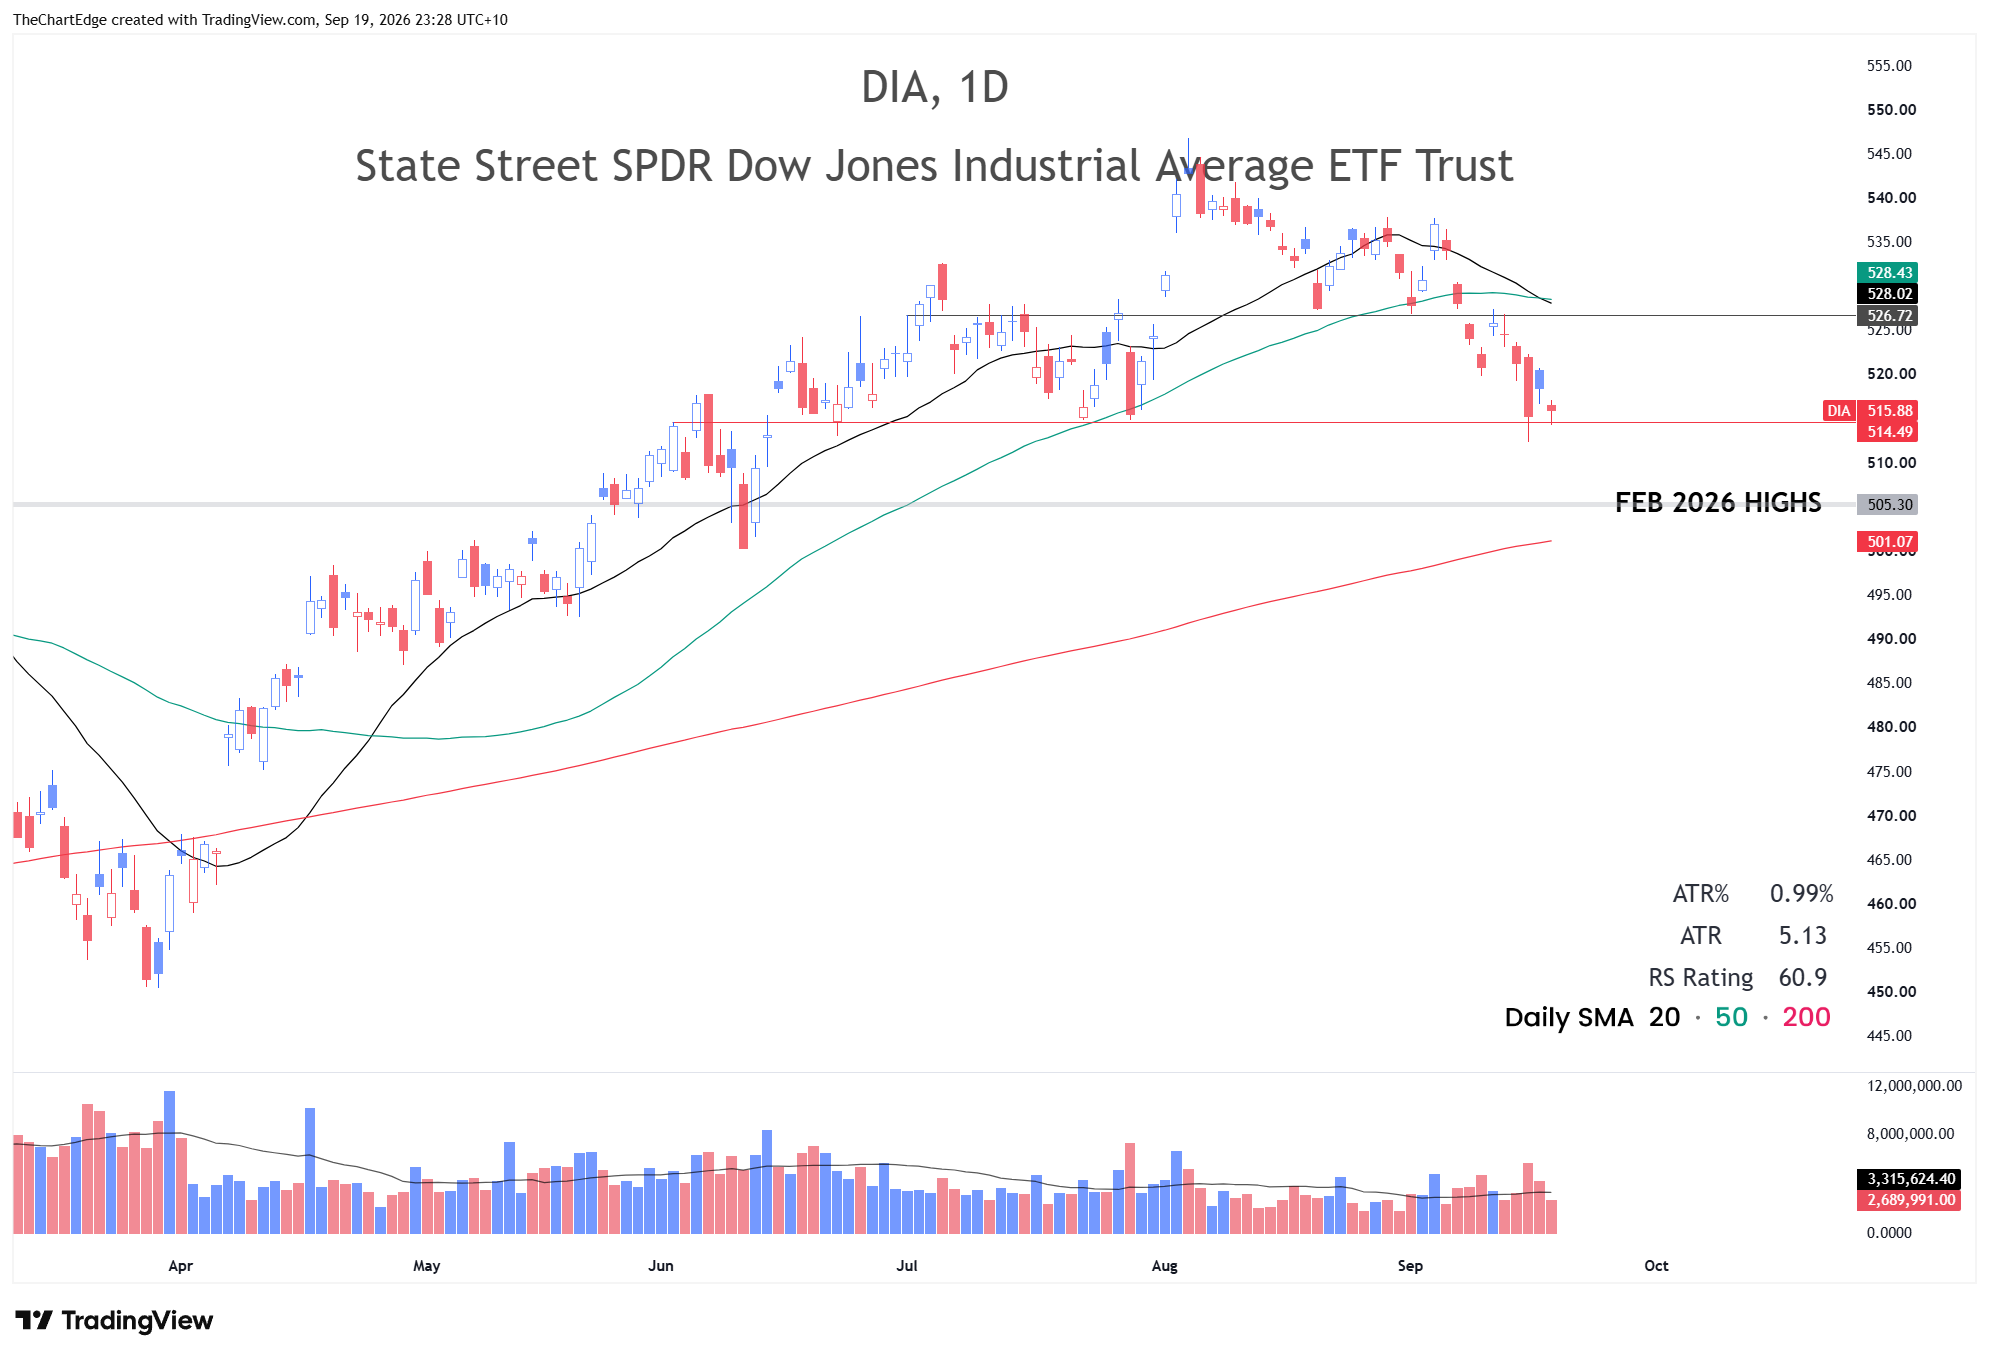
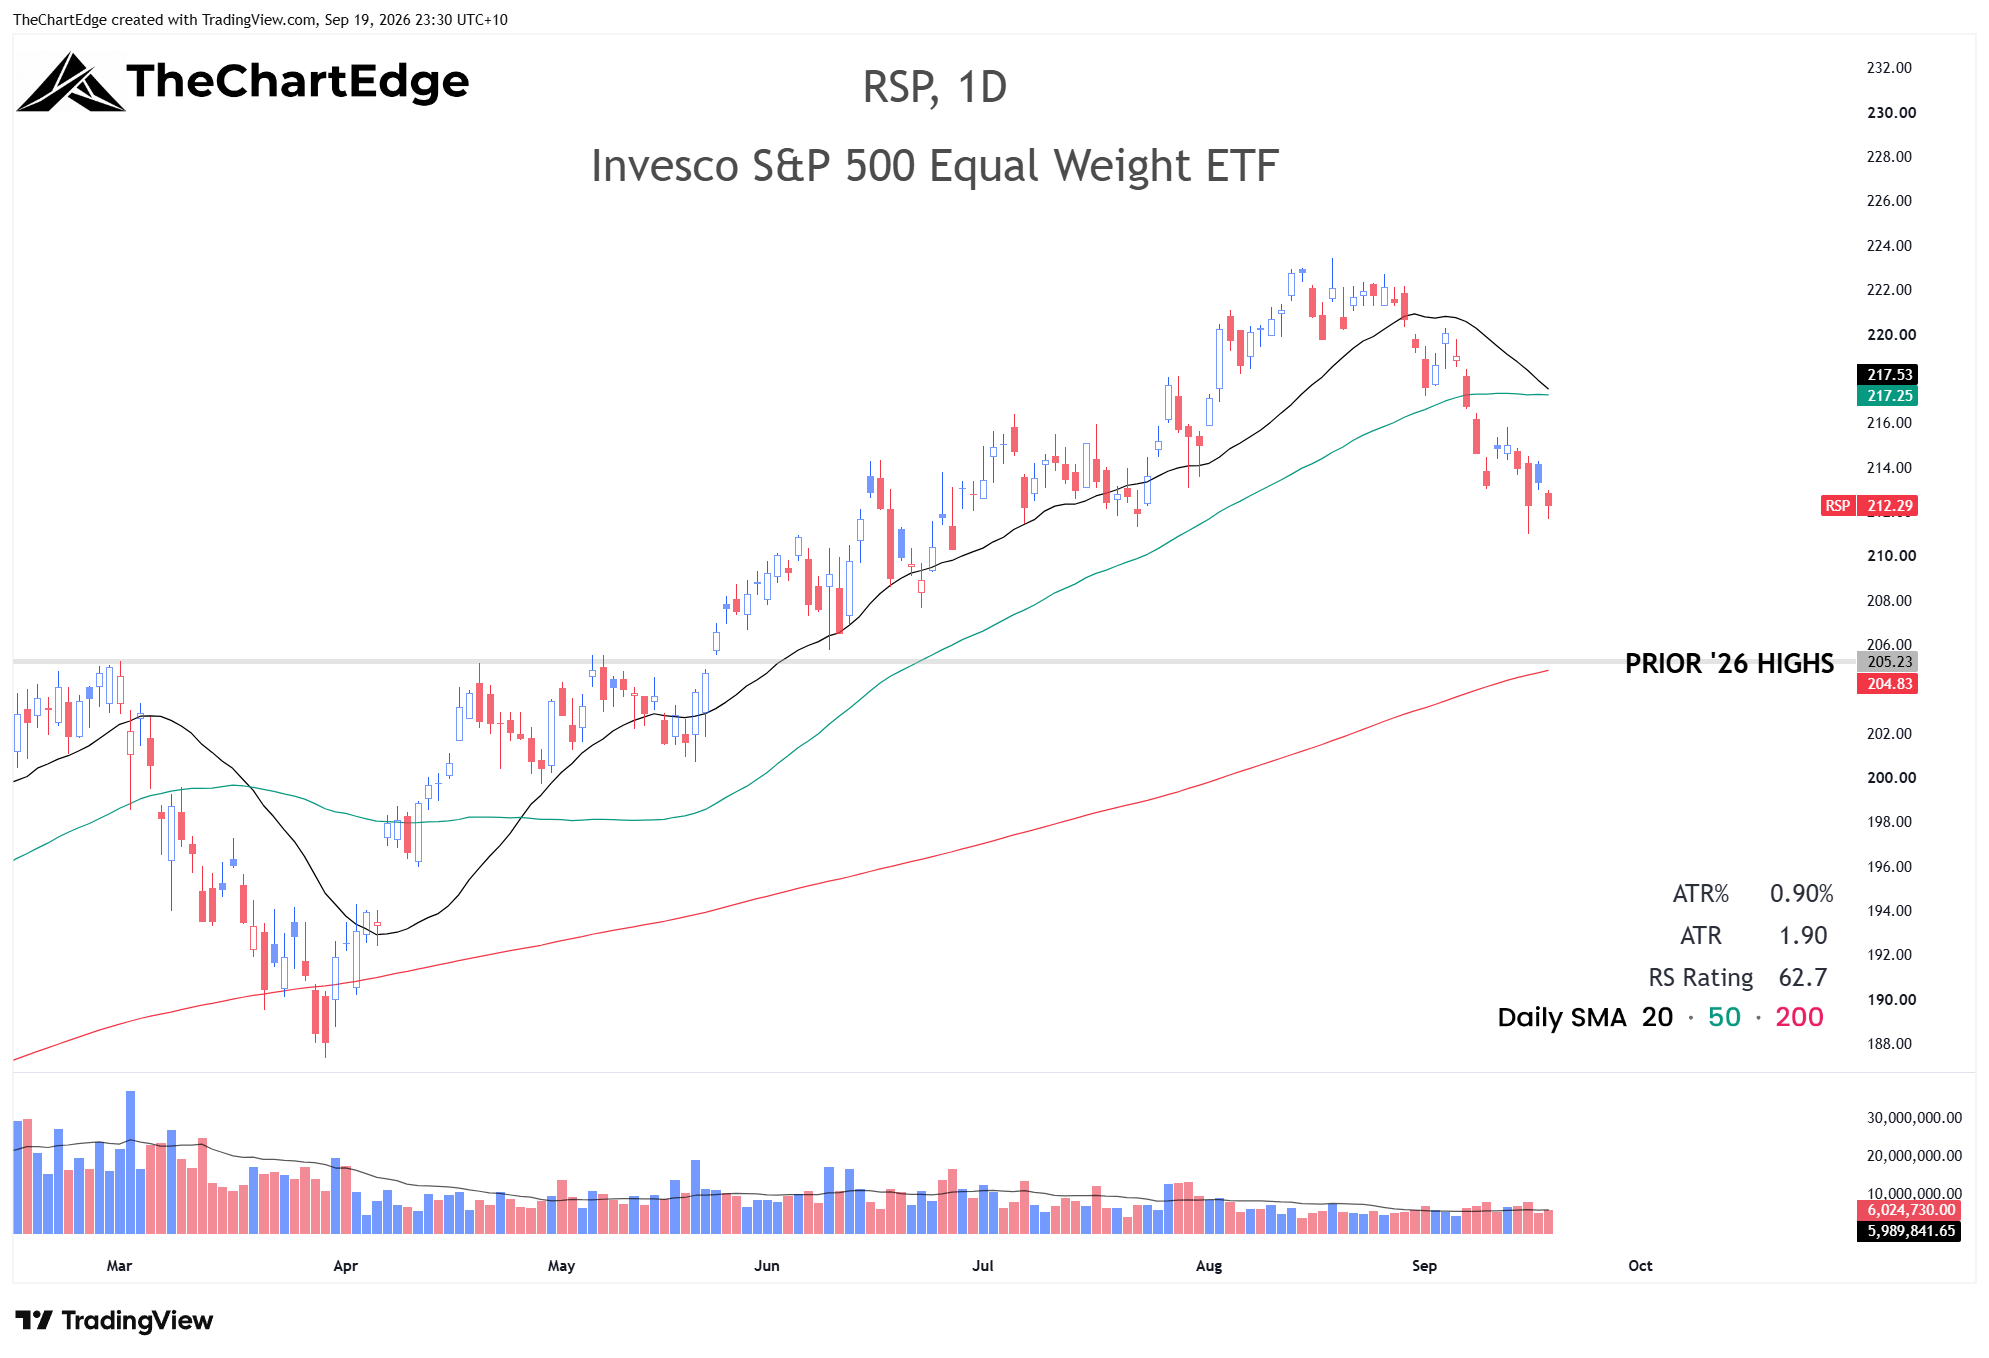
Of the major indices I track, only 3 of the 9 finished the week higher - mega-caps (FNGS) and tech (QQQ, QQEW). SPY looks OK, above its 50-day SMA but the other indices all look weak. This weekend I have included The Dow (DIA) and equal weighted S&P500 (RSP) below to show how the other indices look - small and mid-caps look equally bad or worse.
Dow 30 (DIA) Chart
S&P 500 EW (RSP) Chart
S&P 500 (SPY) Chart
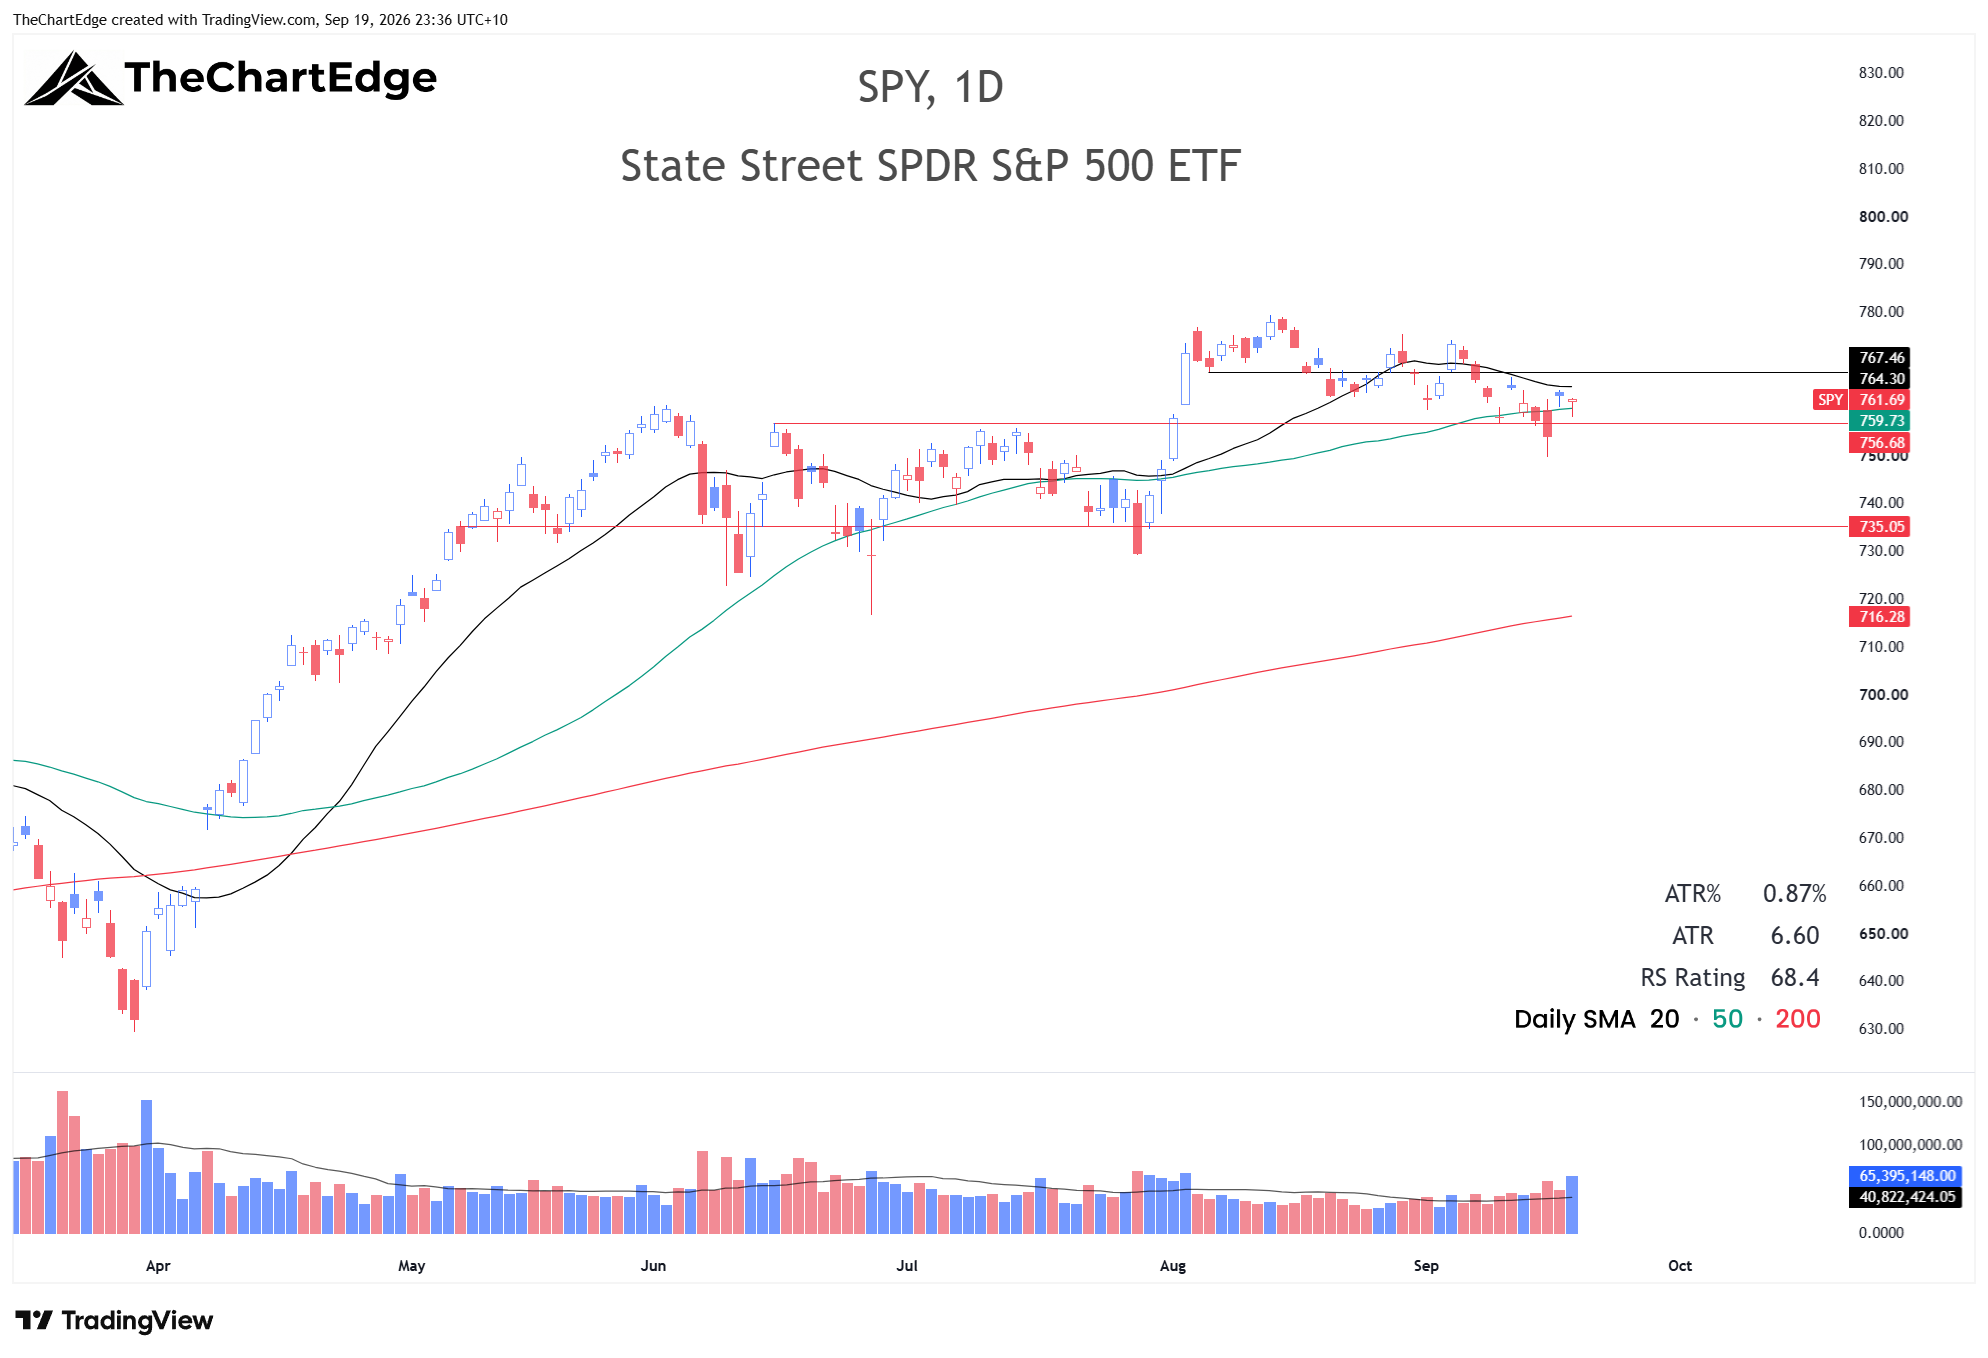
SPY closed at 761.69, just above its 50-day SMA and still in an Uptrend. The initial reaction to the Fed hiking rates took it down under 750 intraday on Wednesday but it closed off the lows. It gapped up on Thursday above the 50-day and had a decent close on Friday - although less impressive than QQQ. I’m still watching for a close below 756.6 to indicate the possibility of deeper pullback. Living under a declining 20-day SMA and hanging on to the 50-day by a thread is not giving me great confidence.
Nasdaq 100 (QQQ) Chart
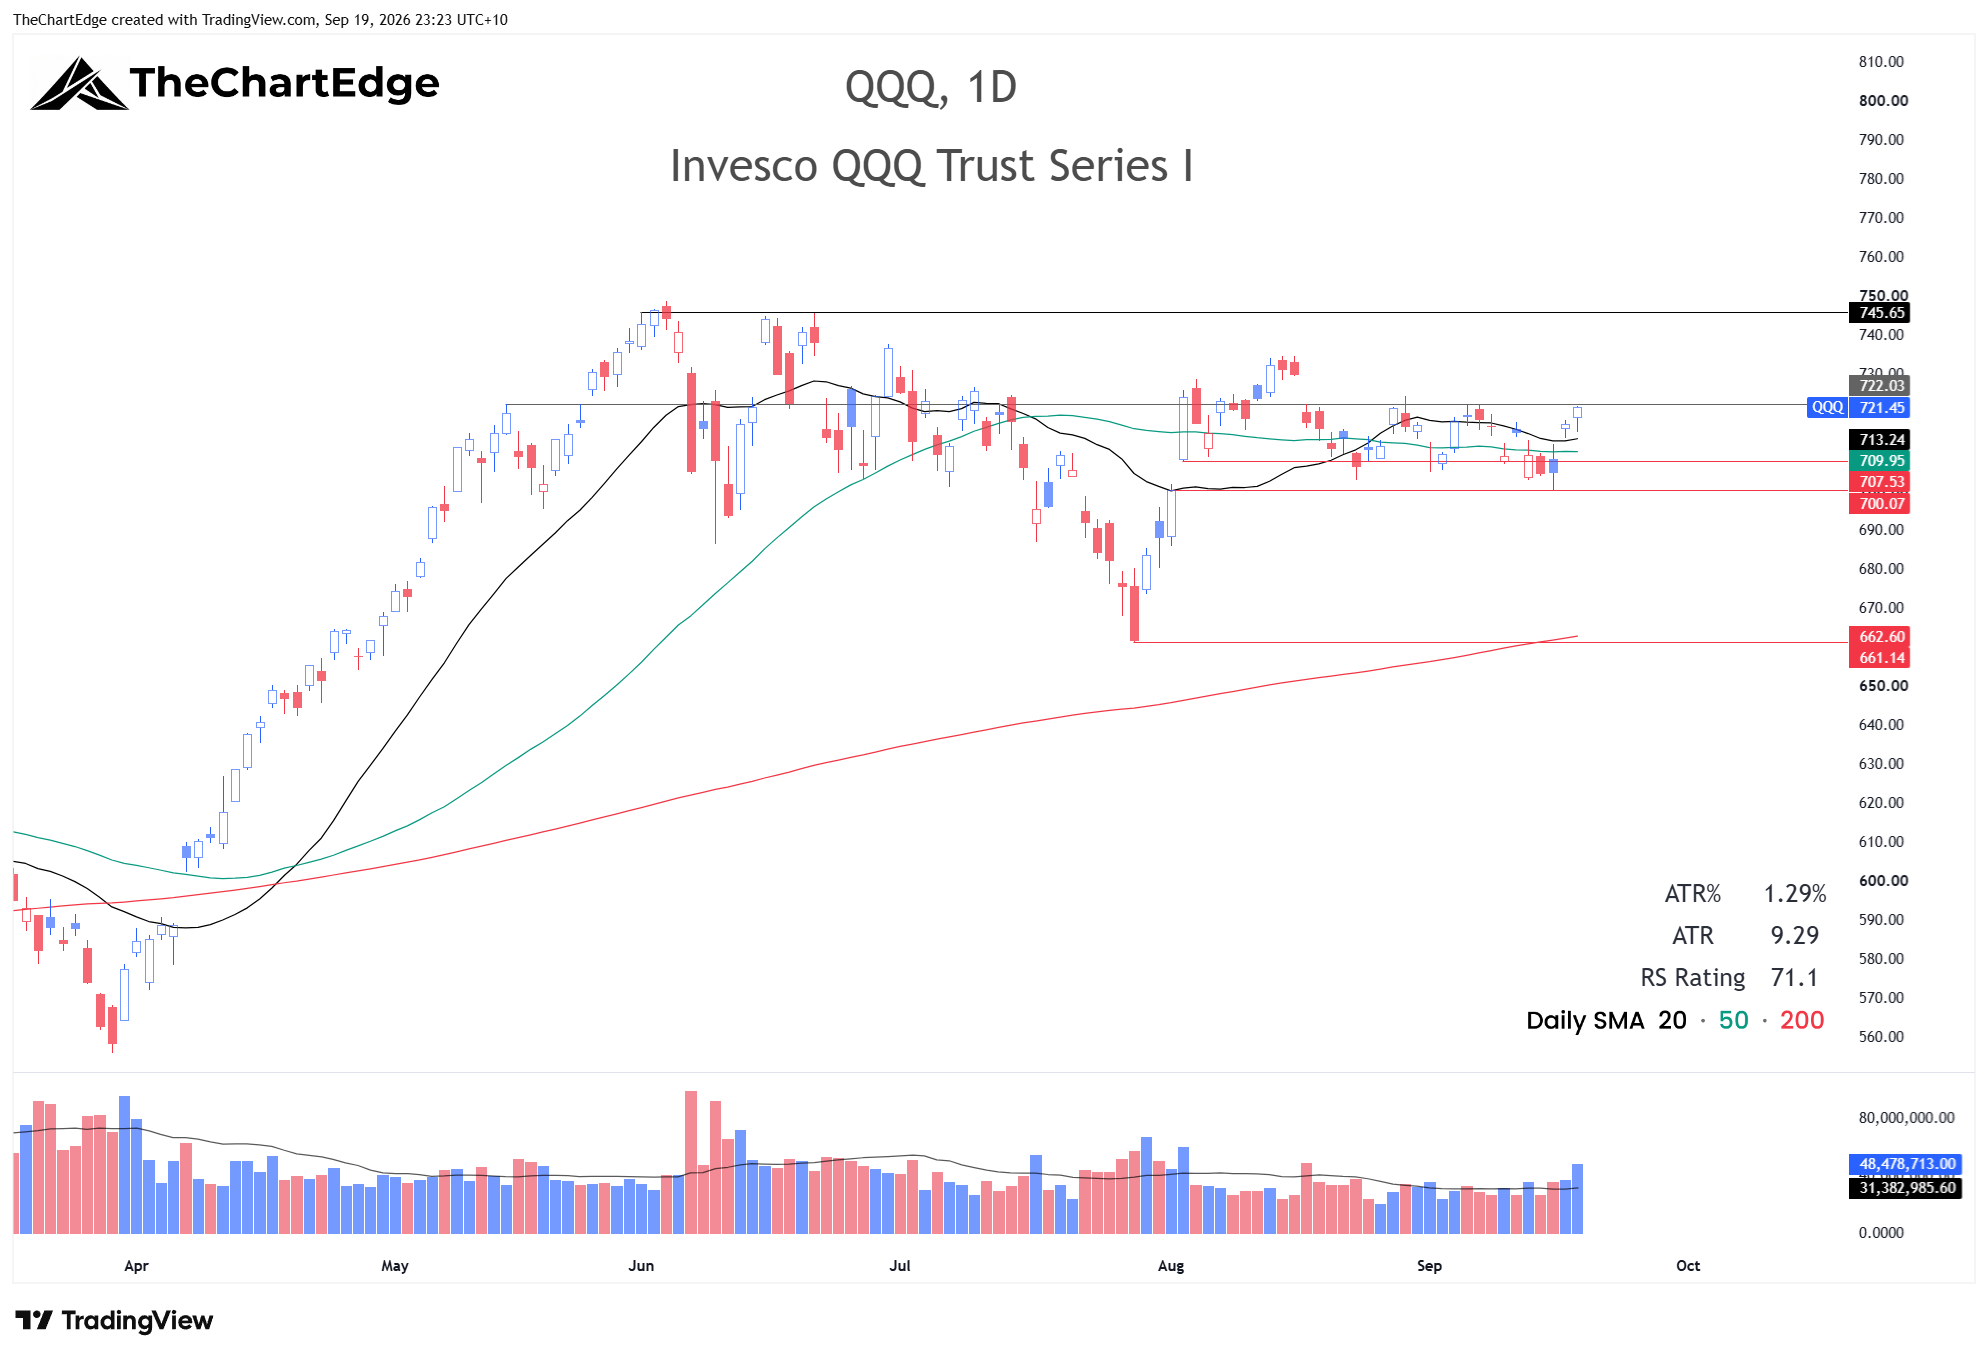
QQQ undercut its recent lows on Wednesday, touching 700 before bouncing. It couldn’t manage a green close, however it gapped up quite powerfully on Thursday and followed through on Friday - closing the week at 721.45 and back in a Strong Uptrend. I’m still watching 722 on the upside and 700 on the downside. It finished the week right at the top of that range, but I am hesitant to buy a “breakout” over 722 for numerous reasons, including the recent sideways action, the Market Temperature in the Cautious Zone and the weakness in nearly all the other indices. If it can break out above 722 and set a higher low on a pullback to trade against, I would consider taking a new position.
FANG+ (FNGS) Chart
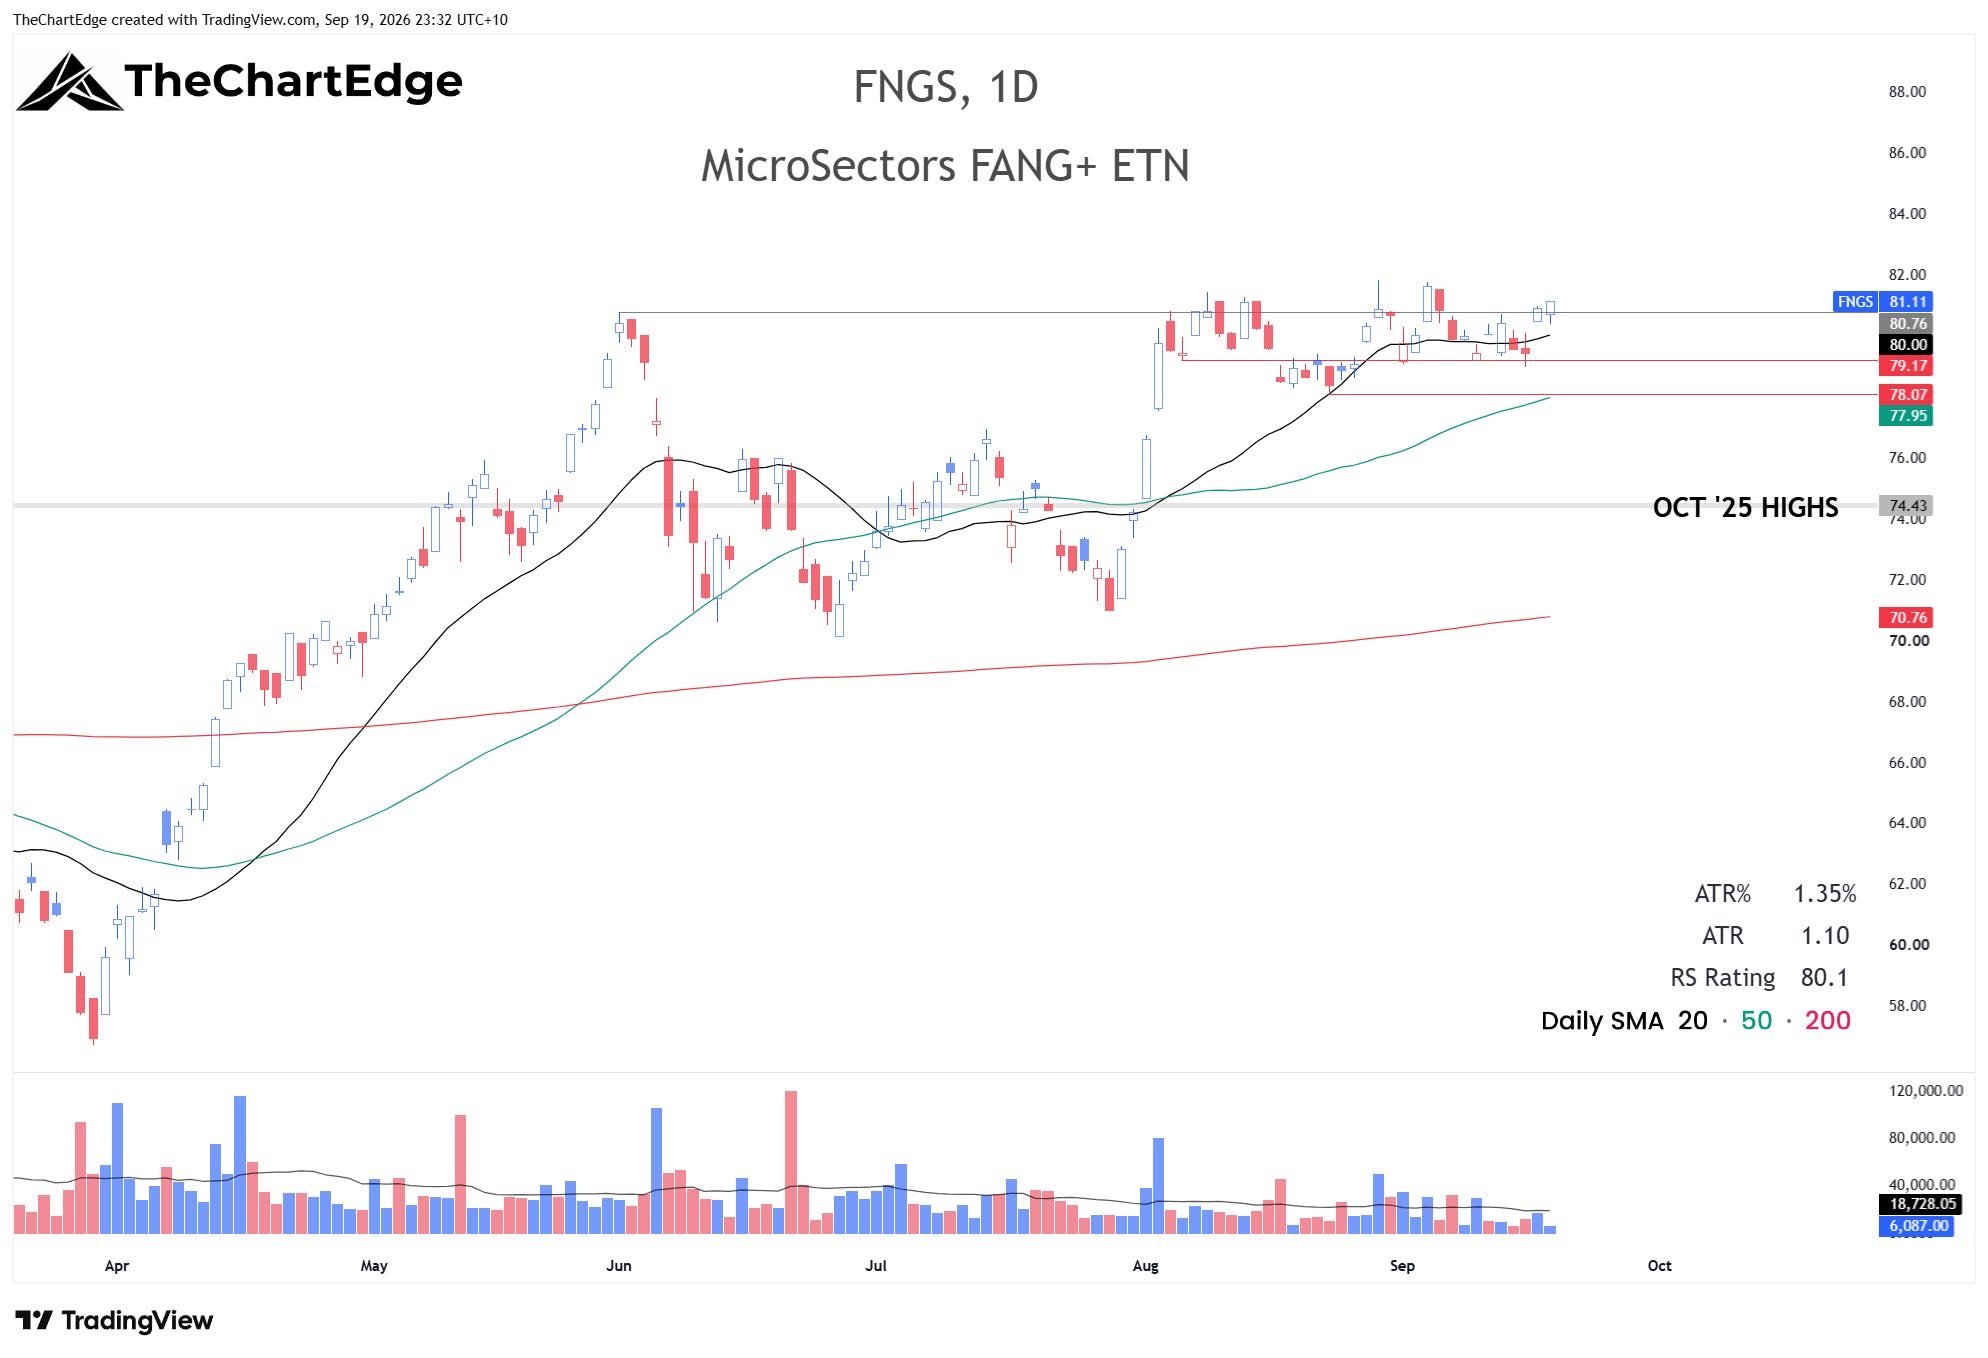
FNGS is easily the best-looking index chart right now - 0.9% off its all-time high and in a Strong Uptrend. If it can tighten up for a bit here and we get improvement in the other indices and breadth, it may be buyable with minimal risk in a week or two. I plan on being patient and am not in a great hurry to do anything this coming week in terms of swing trades.
Market Temperature
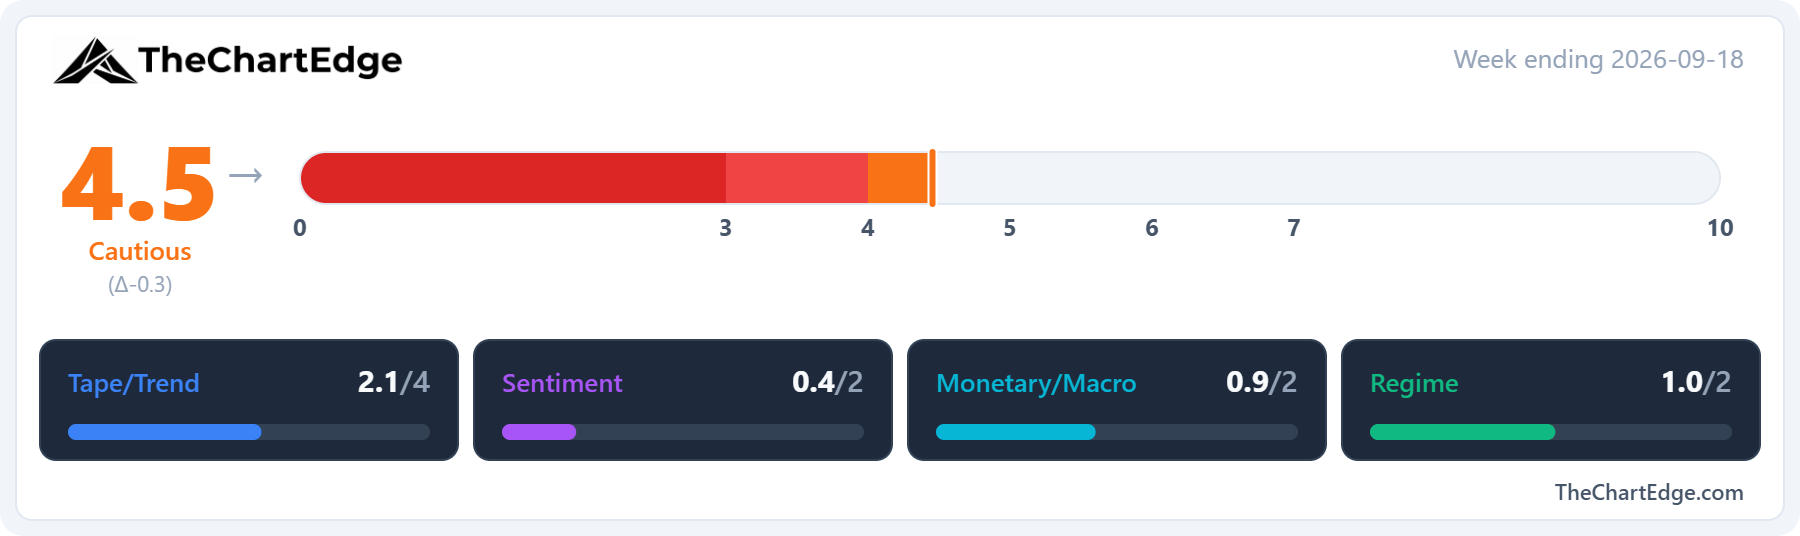
The Market Temperature came in at 4.5, down from 4.8, a second straight week in the Cautious Zone.
The Tape/Trend pillar finished close to flat. Breadth continued to deteriorate - only 34.0% of US stocks finished above their 50-day moving average, from 50.3% two weeks ago, and the 200-day measure fell to 48.0% from 57.7% - however QQQ moving back into a Strong Uptrend offset nearly all of this in the pillar score.
Half the week’s fall came from the Monetary/Macro pillar, almost entirely due to the US dollar - UUP is up 1.8% against its 4-week comparison and the DXY is back above 100. The MOVE index easing to 80.6 from 82.2 offset a little.
Sentiment accounted for the majority of the rest, as the VIX dropped to 14.8 from 15.8, which the model reads as a contrarian negative.
The Regime pillar was little changed - the XLY/XLP ratio is down 2.3% over the model’s 4-week window.
GICS Sector Relative Strength
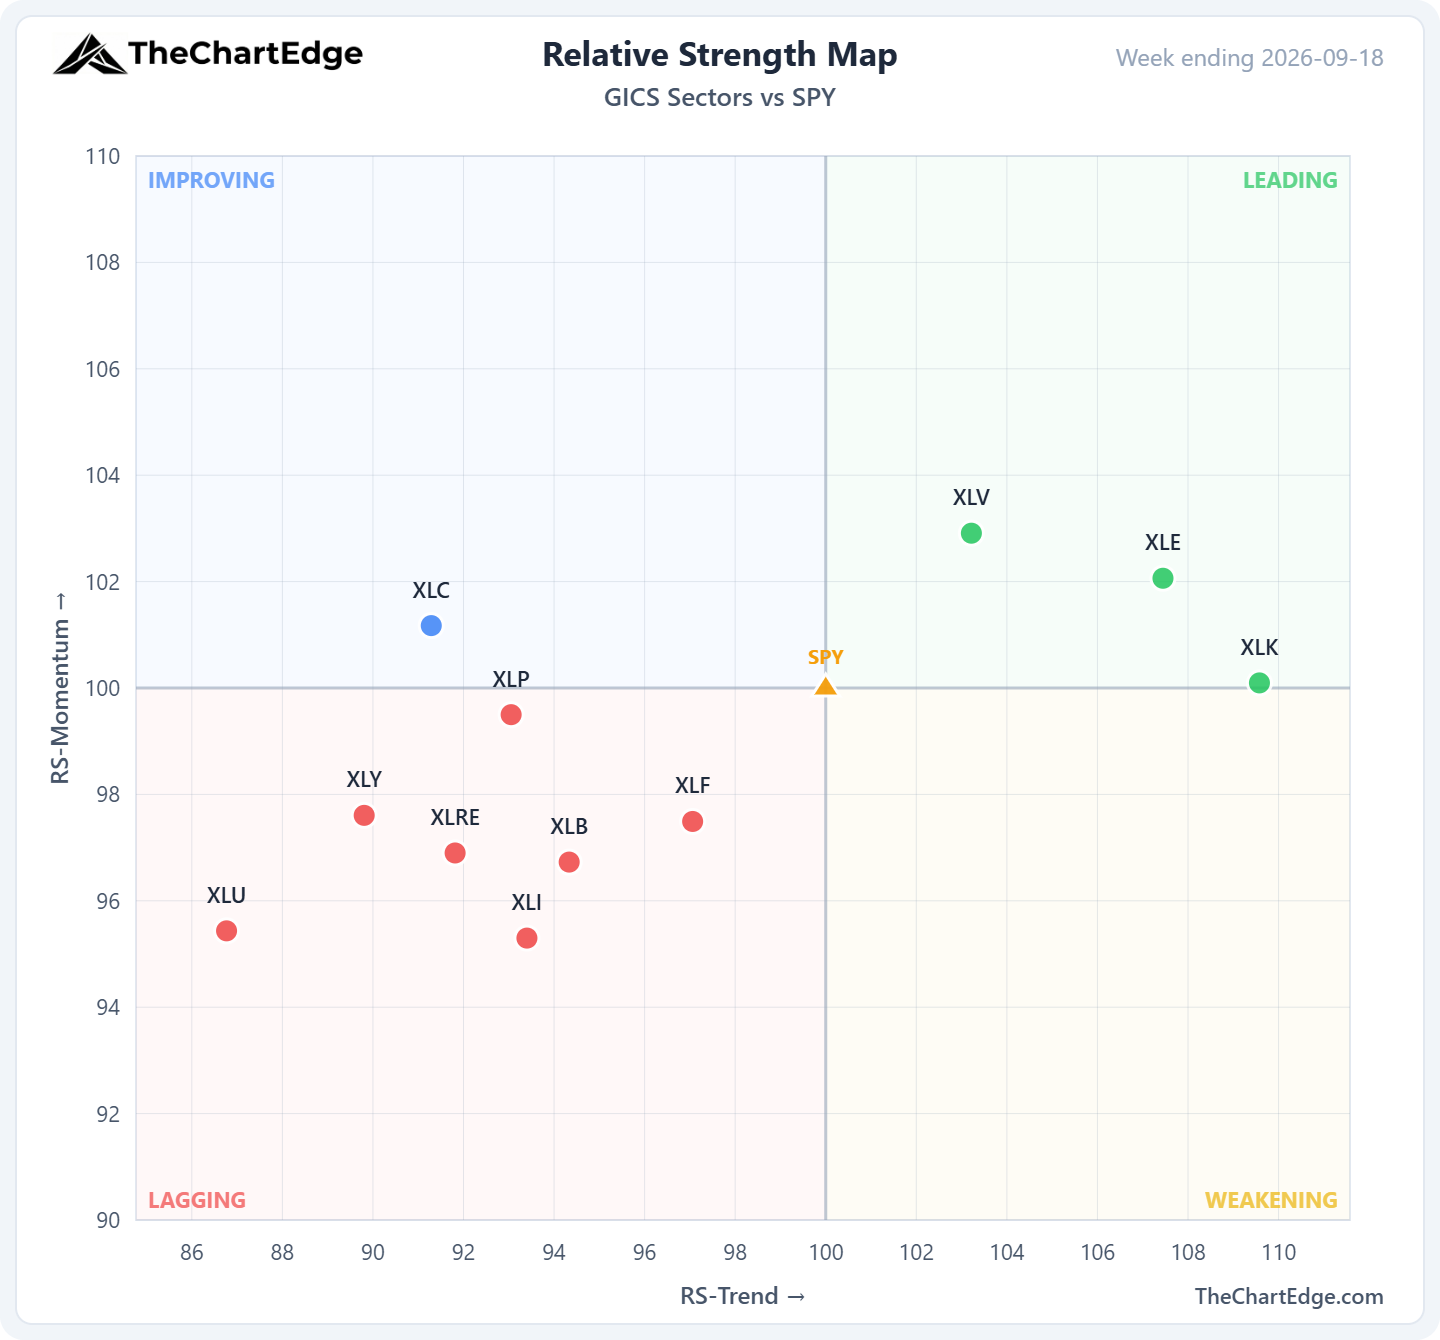
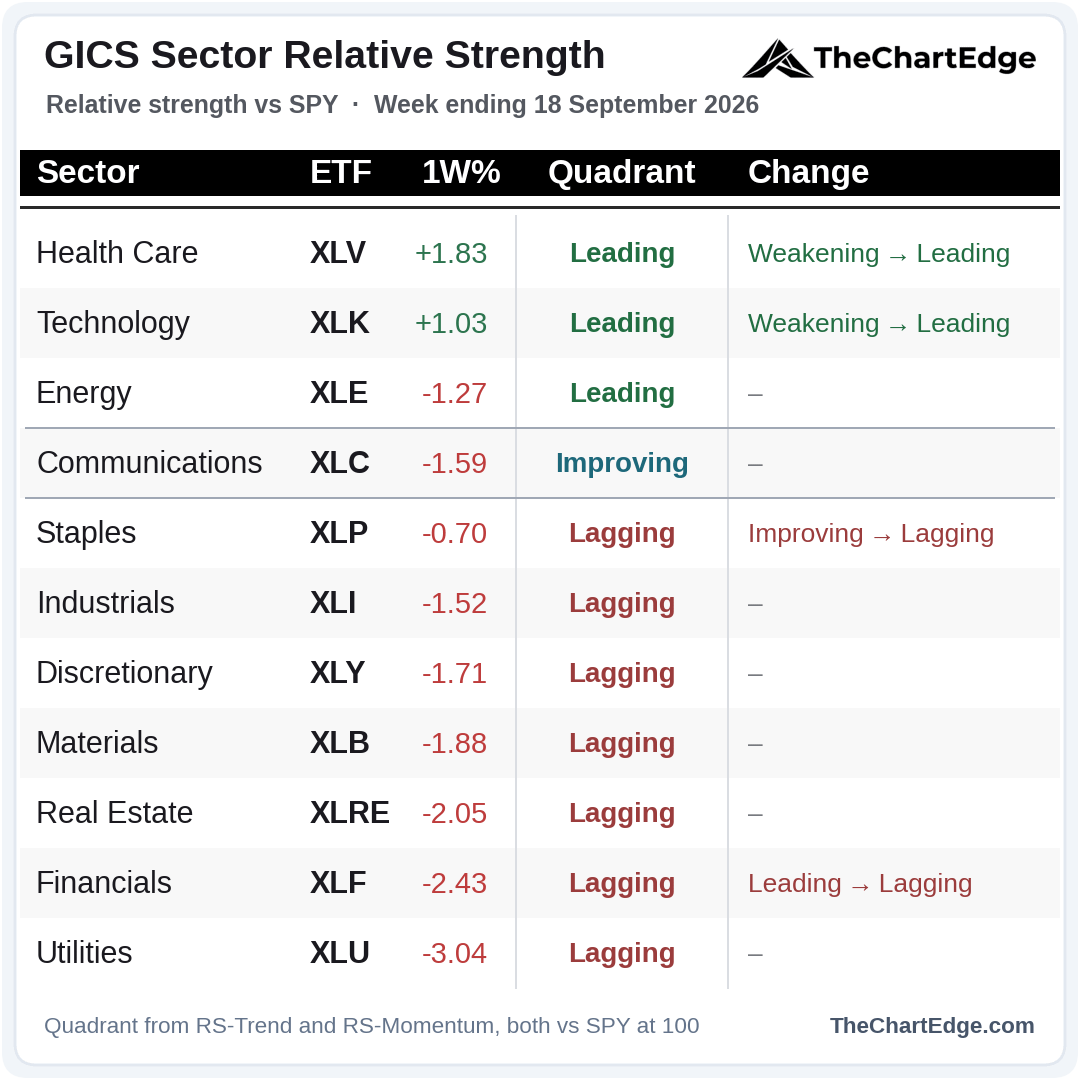
Health care and technology were the only sectors to finish higher, and both moved back into Leading - technology only just, crossing the RS-Momentum line by a tenth of a point.
Financials went the other way, straight from Leading to Lagging - it crossed both RS axes in a single week, without stopping in Weakening.
Energy stays in Leading despite a down week.
Momentum Leaderboard
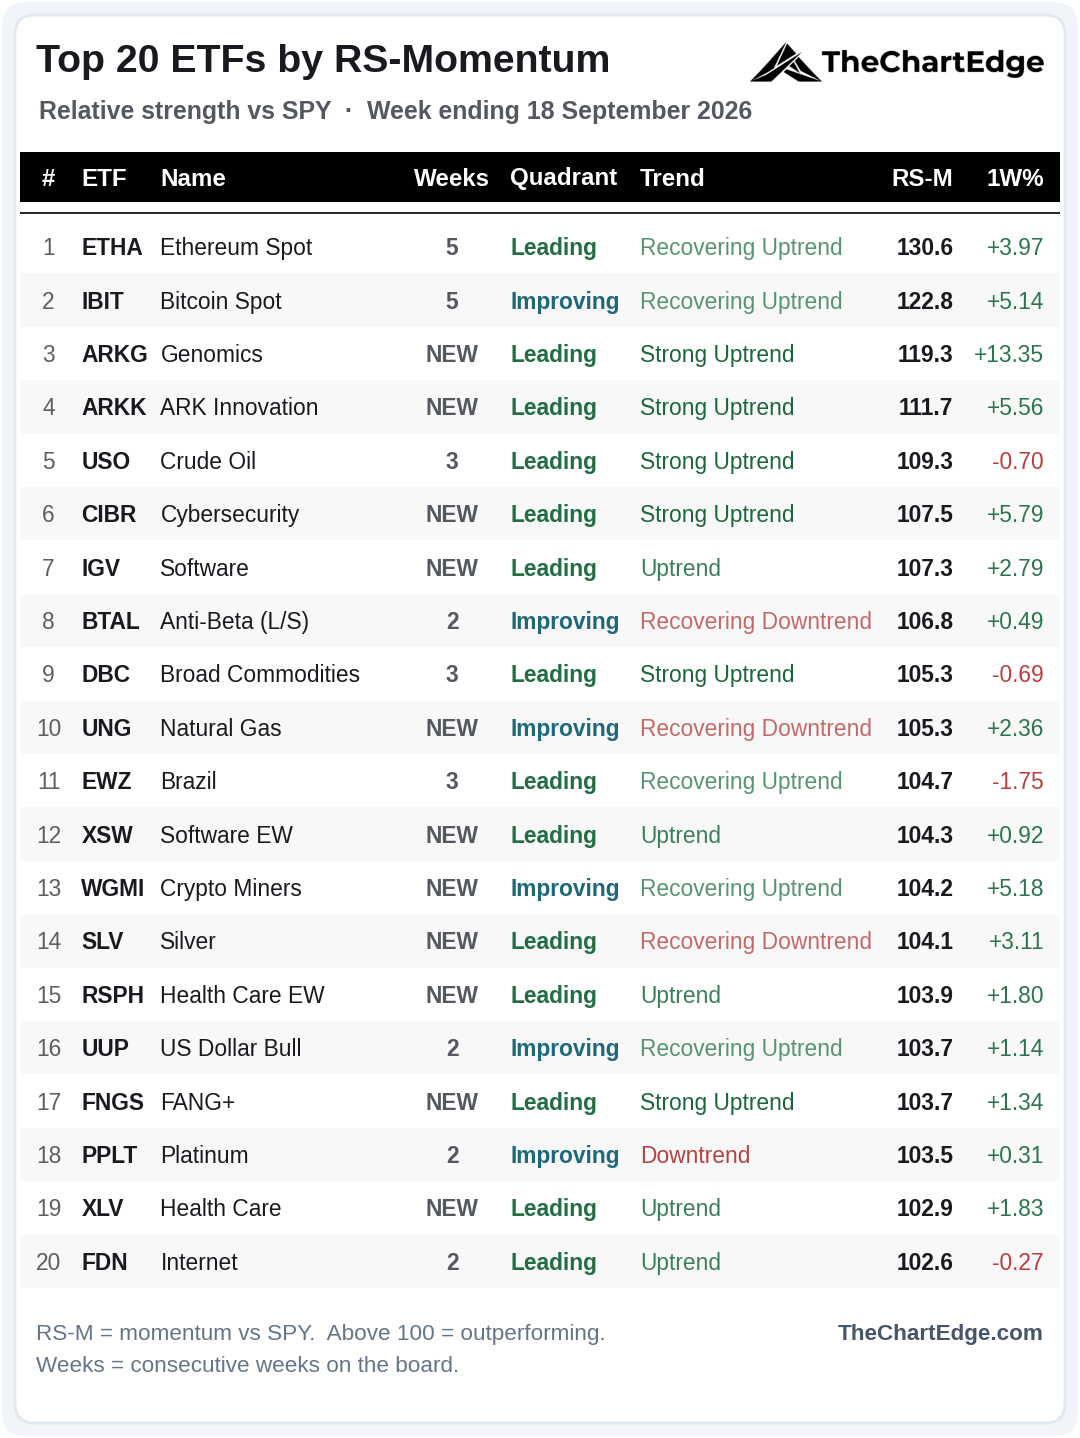
11 of the 20 are new this weekend, and the mix has flipped from last weekend’s risk-off arrivals. The 0-3 month T-bills (SGOV) and 1-3 year Treasuries (SHY) are gone after just one week on the board (although BTAL remains). In their place: software (IGV, XSW and CIBR), the ARK complex (ARKK and ARKG), Crypto Miners (WGMI), health care (RSPH and XLV), FANG+ (FNGS), Silver (SLV) and Natural Gas (UNG).
The energy names fell off the board again - XOP, XLE and RSPG - along with Agribusiness (MOO). Gold Miners (GDX) and Silver Miners (SIL) also fell off the board, ending their 6-week streaks. The longest streak now belongs to Ethereum (ETHA) and Bitcoin (IBIT) at 5, sitting in the top 2 spots - ETHA holds number 1 for a third week.
Only 6 of the 20 are in Strong Uptrends, from 8 last weekend.
Trend States Across the Universe
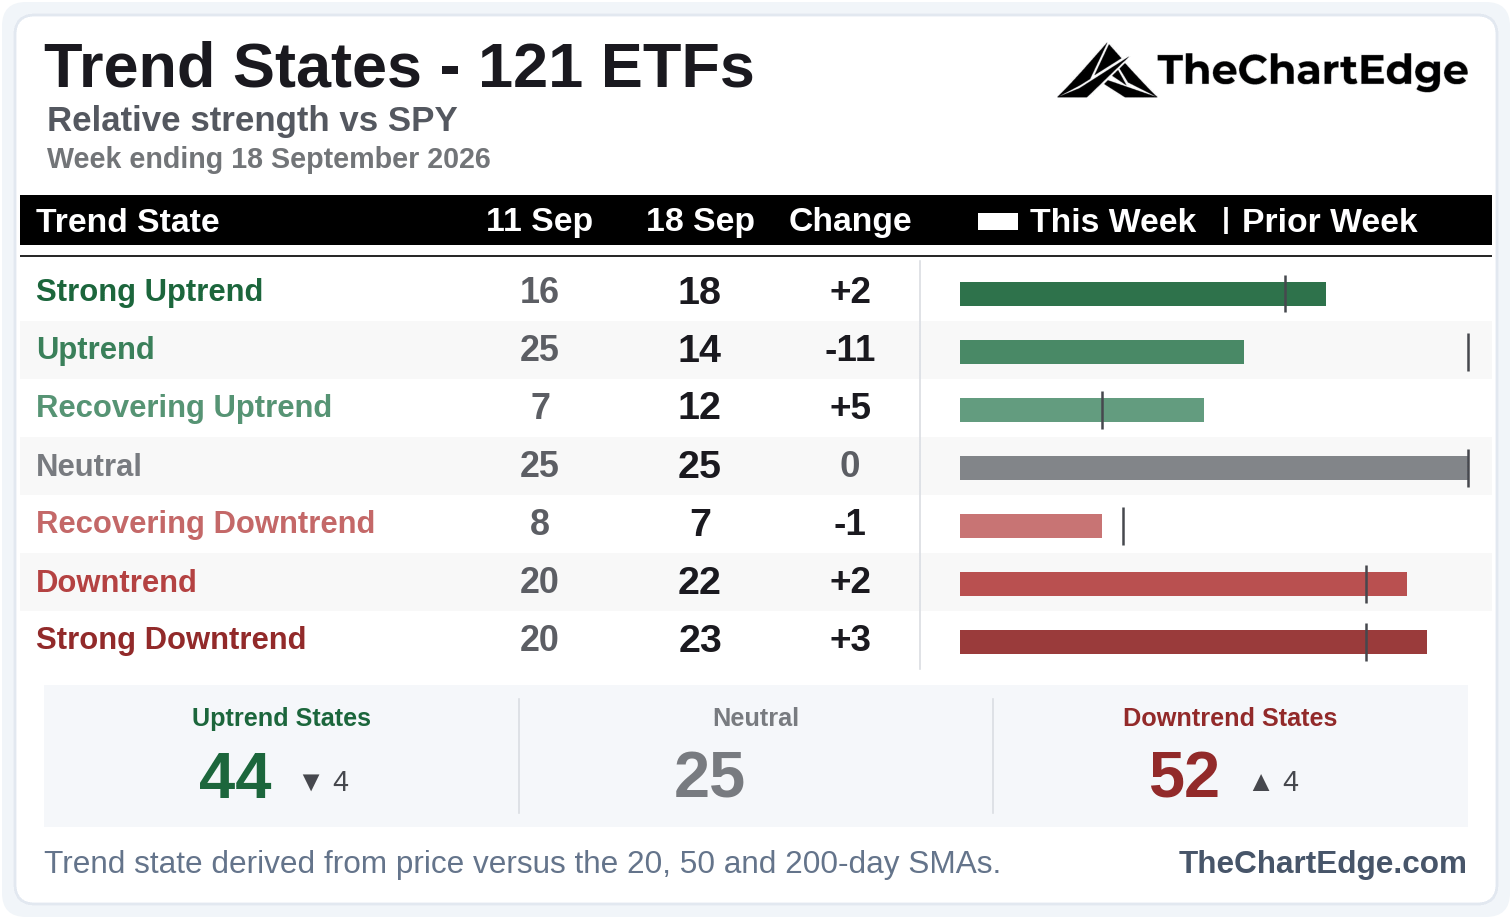
The names tell you as much as the aggregate totals this weekend. QQQ, ARKK, ARKG, CIBR, THNQ, FCLD and growth (IWF) all moved up into Strong Uptrends, while XLI, XLRE, XLB, transports (IYT) and Germany (EWG) dropped into Downtrends, and XLF slipped from an Uptrend into Neutral.
Industry Breadth - Leading Stocks
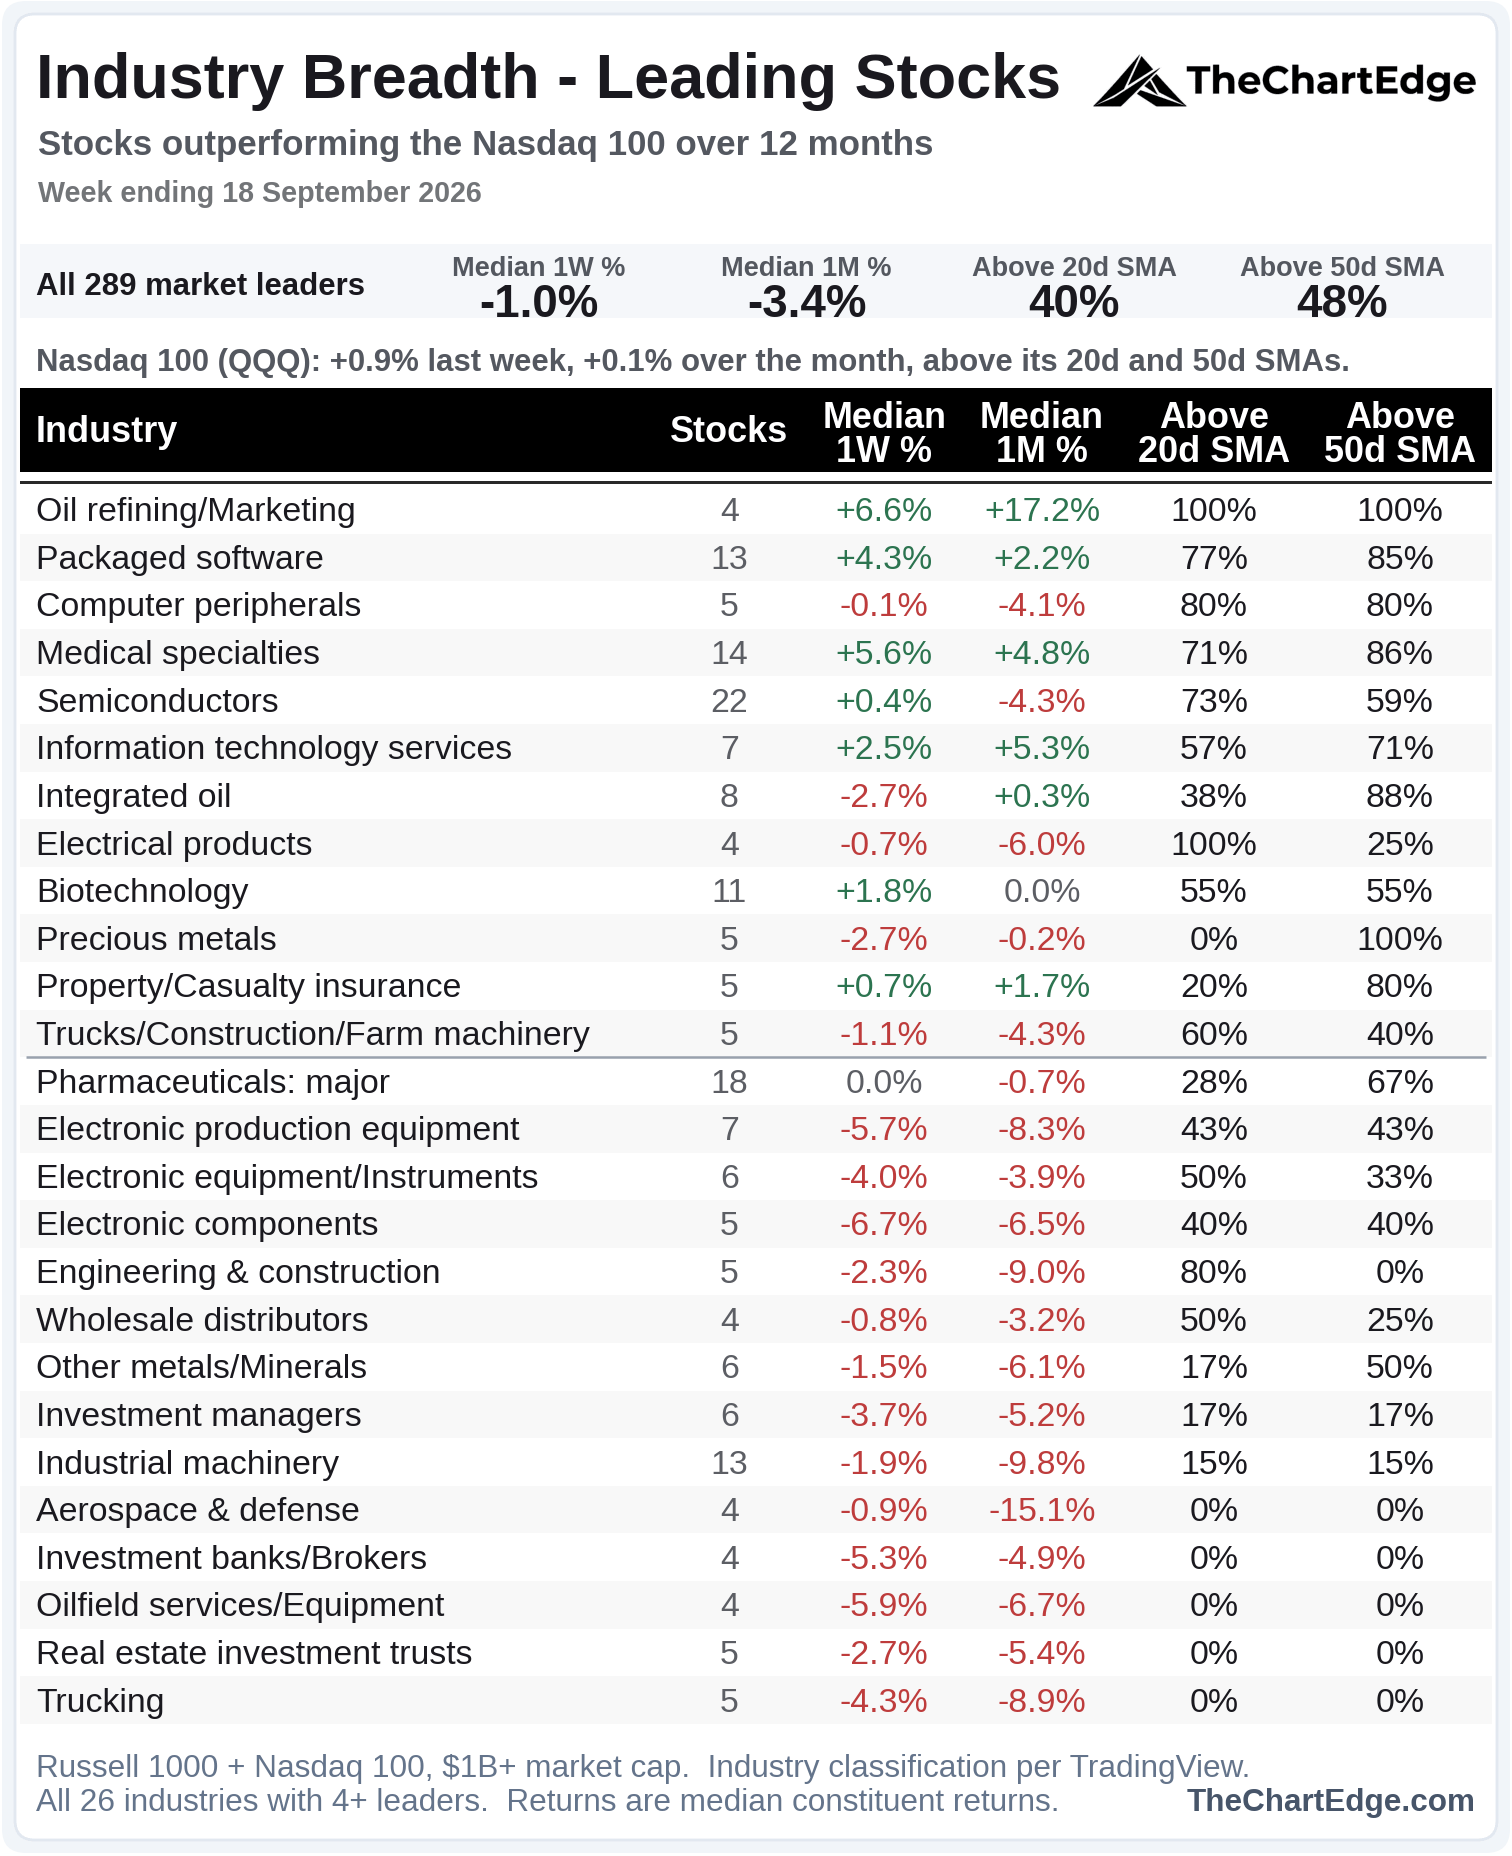
Semiconductors moved up again, from 8th to 5th, holding 73% of its names above the 20-day SMA for a second week. However, 3 of the 4 industries that crossed above the 50 line with it last weekend - electronic components, production equipment and instruments - are now back below it. Only IT services remain above the line. Computer peripherals - which includes SNDK, STX, ANET, NTAP and WDC - remains above the line for a third week.
Health care moved in the opposite direction. Medical specialties and biotechnology are back above the line, while the major pharmaceuticals stayed below.
Precious metals stayed split for a second week - still no names above the 20-day SMA, and all 5 above the 50-day.
Semis & AI
Semiconductors (SMH) Chart
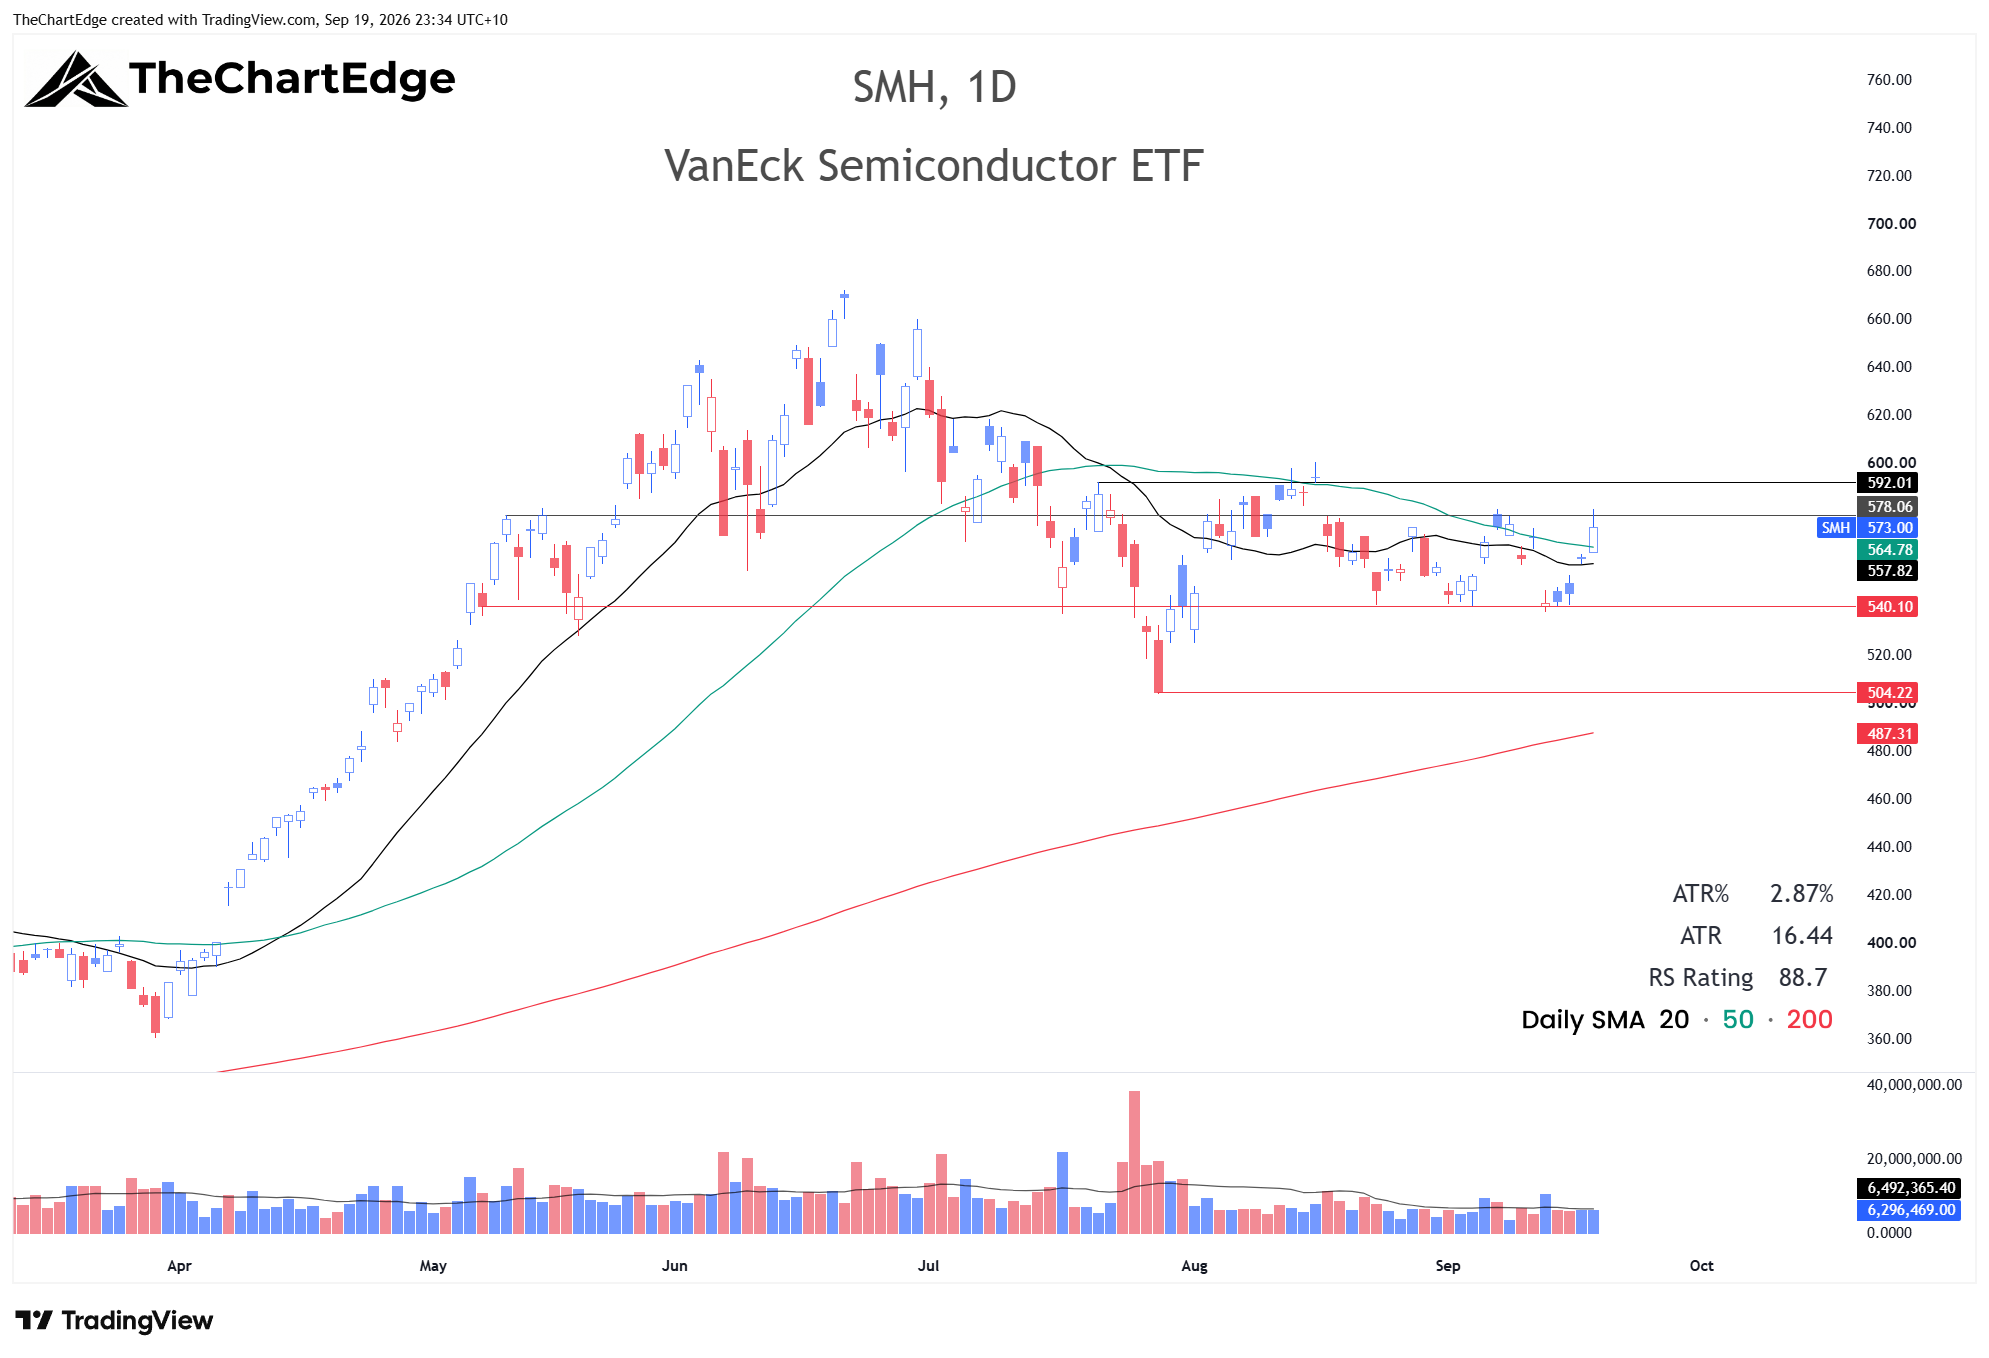
SMH tested 578 on Friday but closed off highs at 573.00. Similar to QQQ, I’d like to see it break out towards 592-600 and then pull back to set a higher low - and have the 20-day turn up and get back above the 50-day - before I’d be willing to take a decent sized new position. Its refusal so far to close under 540 gives me some confidence for now but I will wait for a better setup before entering - if we are to get out of this chop and resume a new uptrend, there should be ample opportunity to get long.
ROBO Global Artificial Intelligence (THNQ) Chart
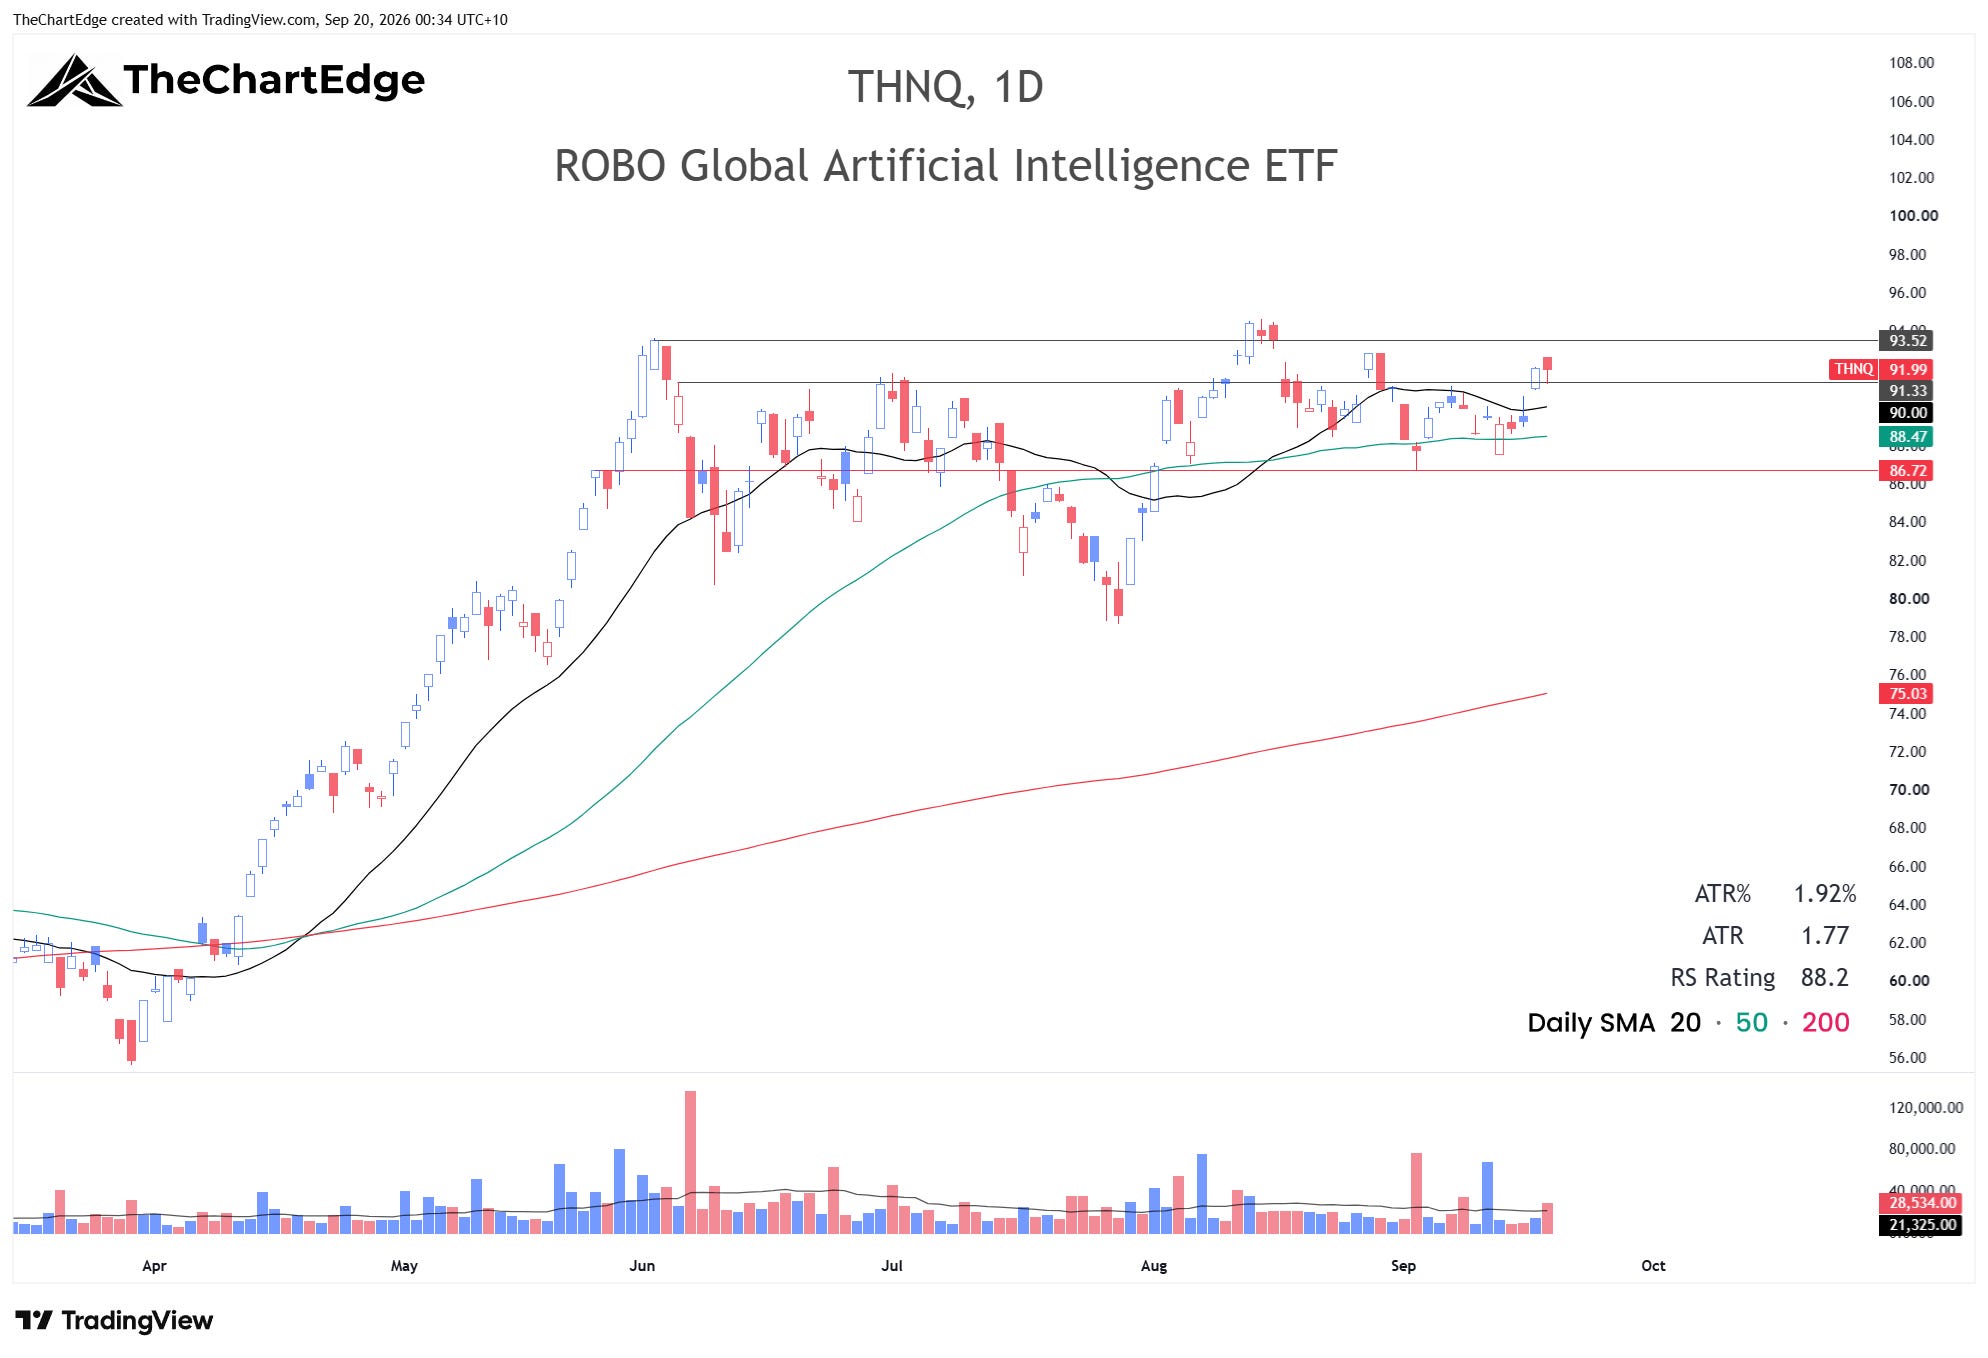
THNQ is back in a Strong Uptrend and sits 2.7% off its all-time high - still one of the better AI charts I track. A breakout followed by a pullback that sets a higher low, above a rising 20-day is also my preferred entry for this - let’s see if we get it.
Generative AI (CHAT) Chart
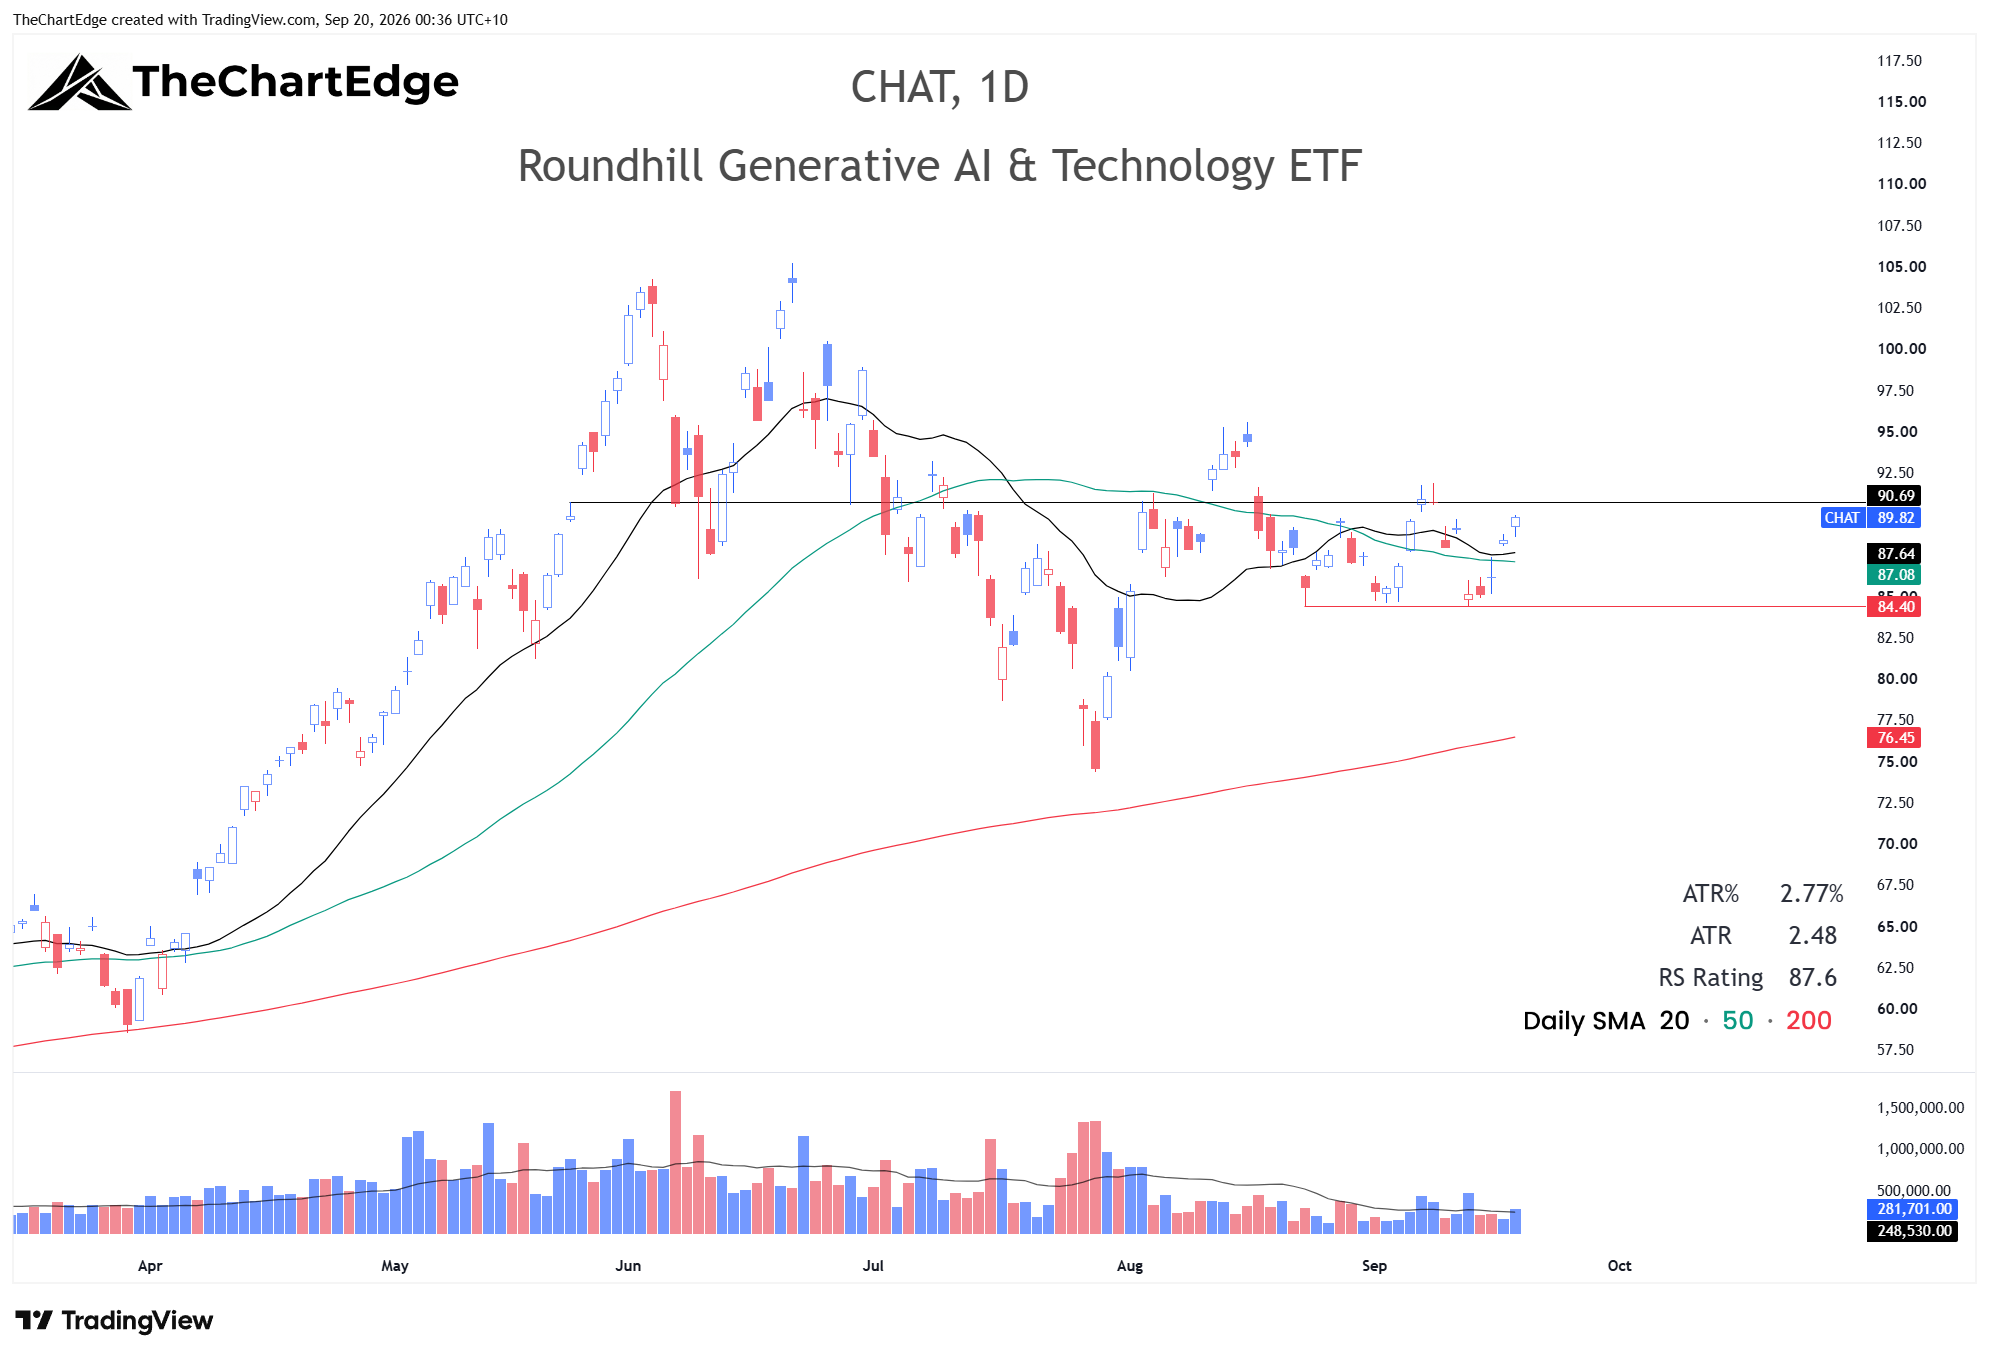
CHAT held its Strong Uptrend state for a third week - although looking at the chart the trend is clearly sideways, despite finishing above its SMAs which are in bullish alignment. I’m starting to sound like a broken record - but I do not plan to buy a “breakout” above 90.7, if it comes - I’ll wait for a pullback that sets a higher low above a rising 20-day before entering.
Trades & Follow-Ups
I was stopped out of 2 more positions last week, leaving me with only FCLD.
Gold Miners (GDX)
I was stopped out of GDX at 93 on Monday. It closed the week at 95.48, back above my stop level but still below its 20-day SMA. I am not looking to get involved with this again until at a minimum it’s above the 20-day and has a close above 99 or so.
Ethereum Chart
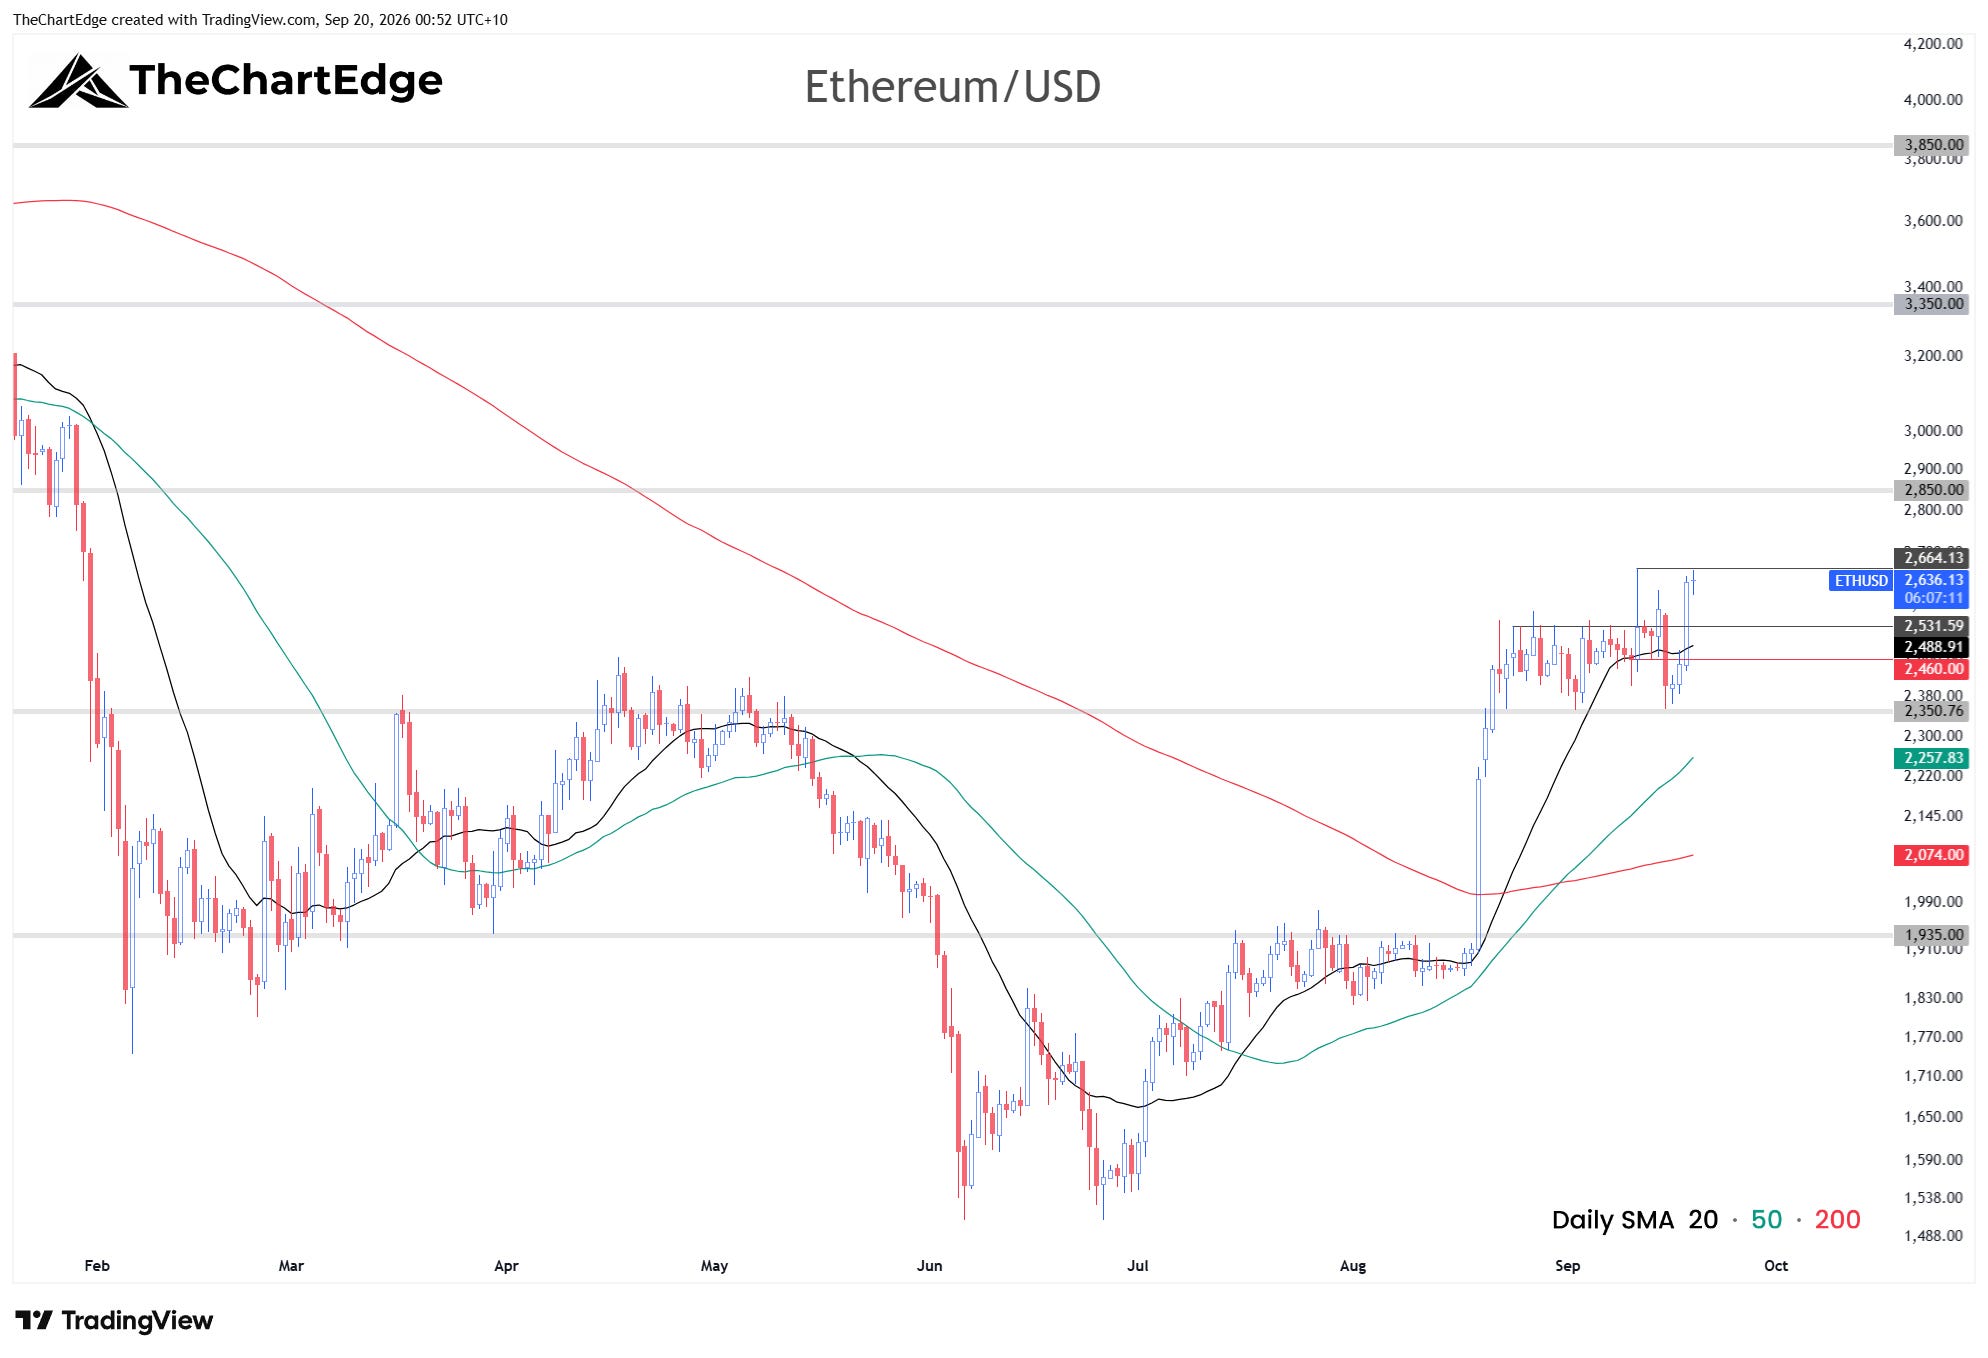
ETH chart is from Saturday
The Clarity Act failed its Senate vote on Tuesday and the selling took out my 2460 stop. However, 2350 held nicely - as I’ve mentioned a couple of times previously I was hoping for an undercut and reclaim of 2350 to shake out anyone with their stop under this level - I like this setup/entry tactic as it also gives you a clear and sensible level for your own stop-loss placement.
I didn’t take a new position but strongly considered it on Friday, as Bitcoin did undercut and reclaim its recent range lows between Wednesday night and Friday afternoon (Melbourne time). On Friday when the US markets opened ETH ripped $100+ back up to test the Friday Sep 11 highs around 2660 - the move looked more sustainable this time and it held above 2600 on Saturday and early Sunday (Melbourne time) - but it’s now under this level around 2575. I’d like to see 2530 hold and may consider an entry if we get a bounce at or around that area. Bitcoin has also cleared 80,000 on this same move. There wasn’t one clean catalyst on Friday that I can see - the market seems to have moved past the Clarity failure, with the SEC’s new Innovation Exemption for tokenised assets helping sentiment.
I am looking to re-enter ETH, but after the explosive move between August 19-21, I am mindful we may need more time to digest and consolidate here. Crypto’s frequently erratic price action, and tendency to have pretty loose consolidations make it harder to trade, but the moves it makes sometimes offer huge asymmetric opportunities with good entries and stop placement, so it can be very profitable even with a low win rate.
Cloud Computing (FCLD) Chart
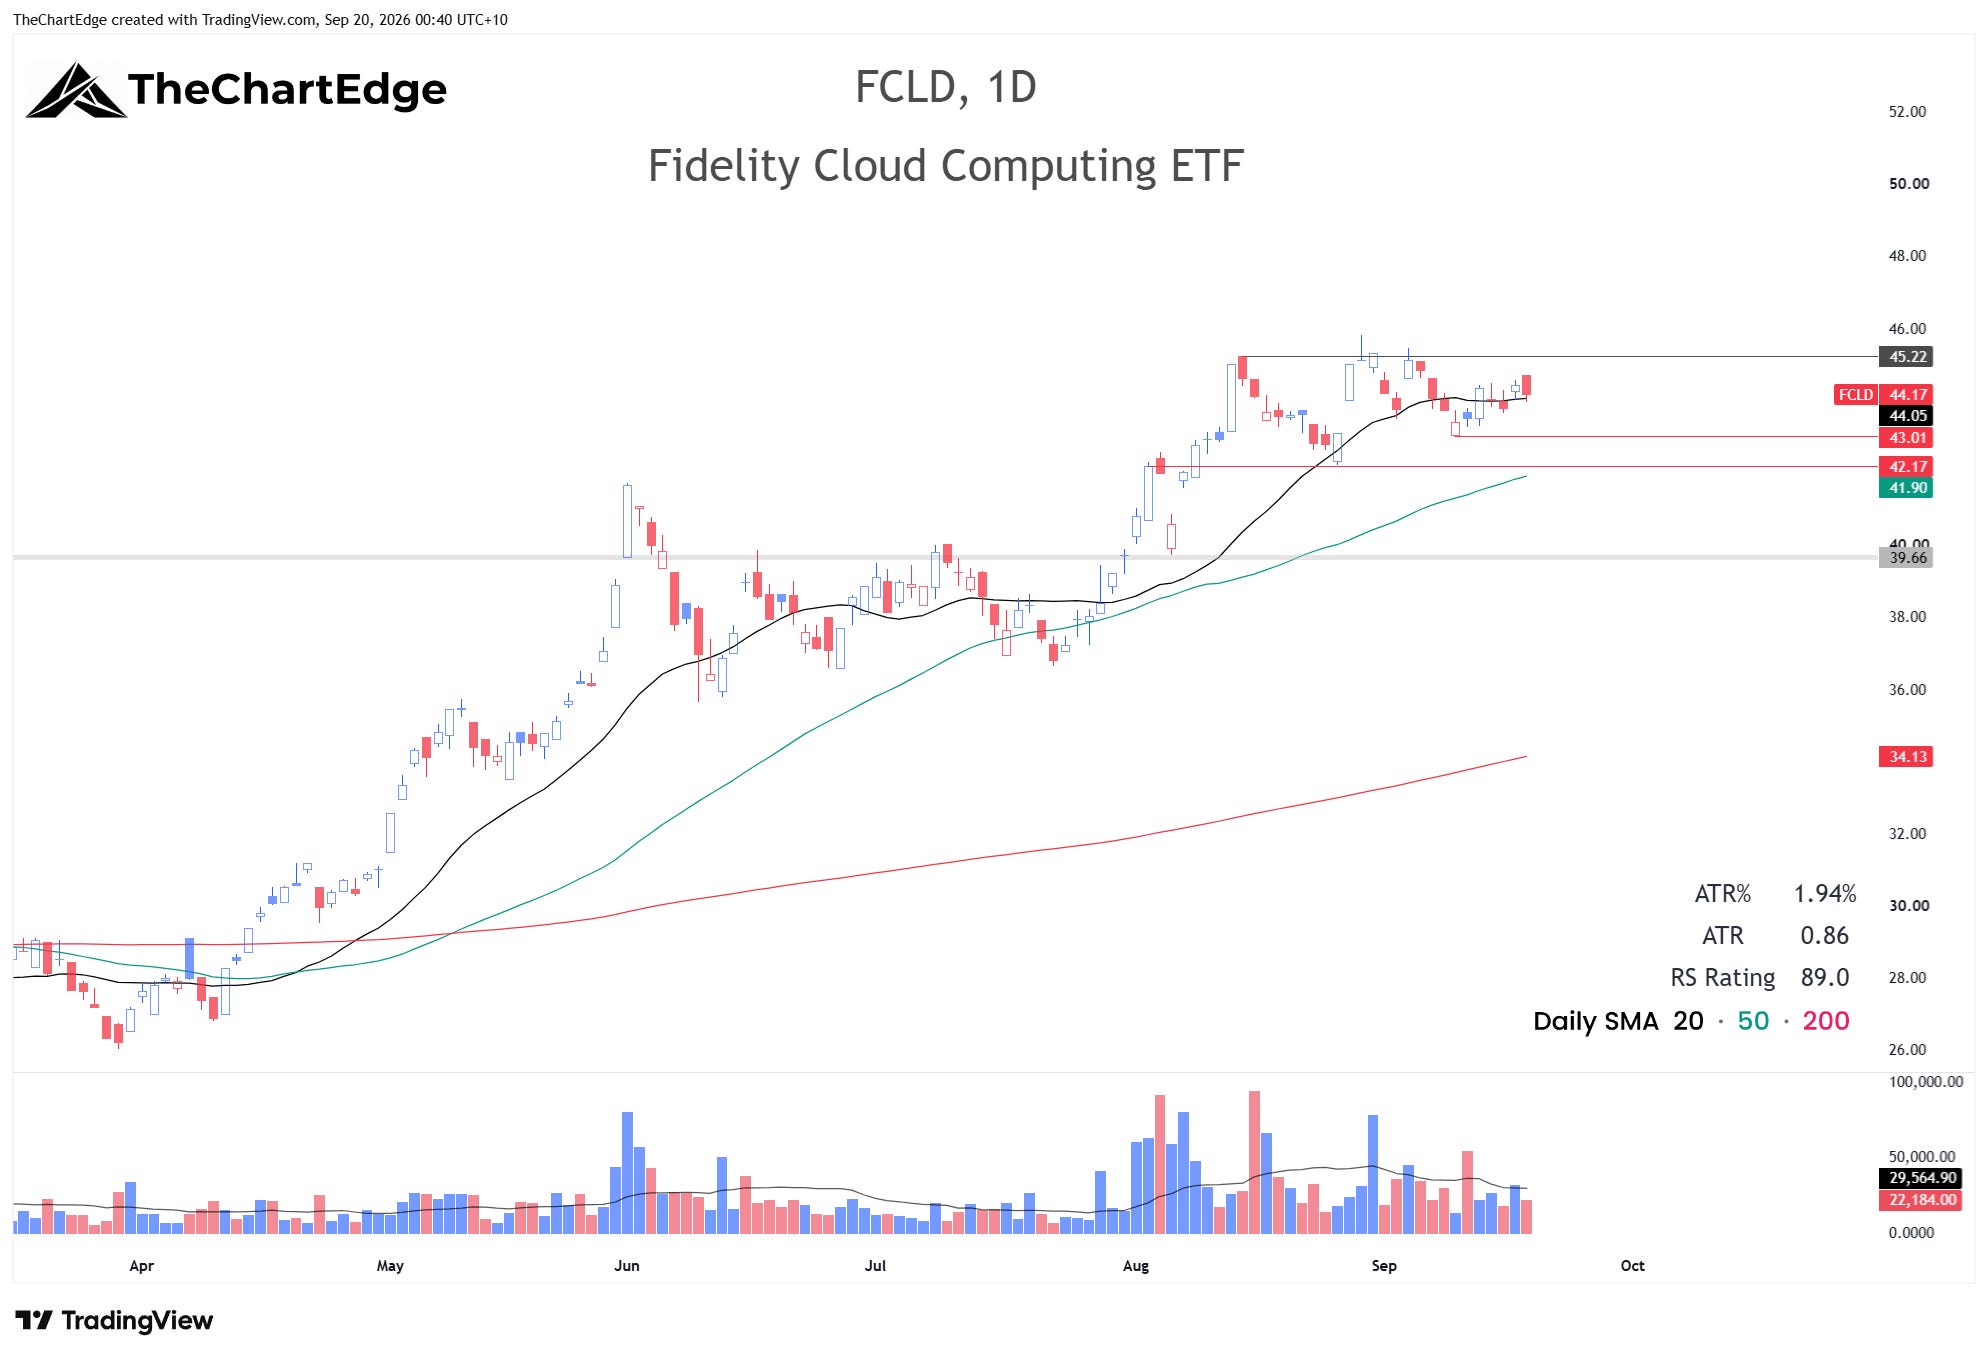
FCLD had a decent week, despite an ugly candle on Friday - it gapped up but reversed to finish near the lows of the day. It closed at 44.17, back above its 20-day SMA and technically in a Strong Uptrend, although the chart doesn’t look as good as the trend state suggests. My stop is still at 42.90.
Yields
The 10-year yield finished at 5.00% and the 30-year at 5.33%. The 10-year edged up through 5% during the week, while the 30-year was down slightly despite the hike - the Fed’s first in three years. Both remain above the levels I flagged a few weeks ago and I will continue to keep an eye on yields.
The Week Ahead
The Market Temperature is in the Cautious Zone for a second week and breadth keeps narrowing. 42 of the 121 ETFs I track finished higher, from just 19 last weekend, however the list is heavily tilted to tech, AI, health care, crypto and defensives.
The market feedback from my own trading hasn’t improved either - 2 more stop-outs take the run to 6 in two weeks. I am glad I was keeping all the positions small, so the drawdown is still minimal.
I’m down to a single position in FCLD and I’m not in a hurry to add new ones. I want to see a recovery in breadth and the other indices before taking any new positions. I will likely focus on QQQ, SMH, CHAT and THNQ, but want to see them break out and set a higher low above a rising 20-day SMA. I’ll also be watching FNGS to see if it can tighten up and then break out. Other than these I will continue watching ETH and try to work my way into a new position.
Stay open-minded and manage risk carefully.
Cheers,
Marcus Grant, CFTe
Disclaimer: The content provided in this newsletter is for informational and educational purposes only and should not be considered as financial, investment, or legal advice. It is general information only and does not take into account your objectives, financial situation or needs. The information shared is based on our research and analysis, but we are not a licensed financial advisor, nor can we guarantee its accuracy, completeness, or timeliness. Market conditions and financial instruments can change rapidly, and any opinions expressed may not be suitable for all investors. Any opinions expressed and/or securities mentioned do not constitute a recommendation to buy, sell, or hold that or any other security. You should conduct your own due diligence and consult with a licensed financial advisor or other professional before making any investment decisions. Past performance is not indicative of future results, and all investments carry the risk of loss. The authors and publishers of this newsletter are not responsible for any financial decisions made based on the content provided herein. By reading and/or subscribing to this newsletter, you acknowledge and agree that you are using the information at your own risk.