


Everything below is as of Friday’s close (ending July 24).
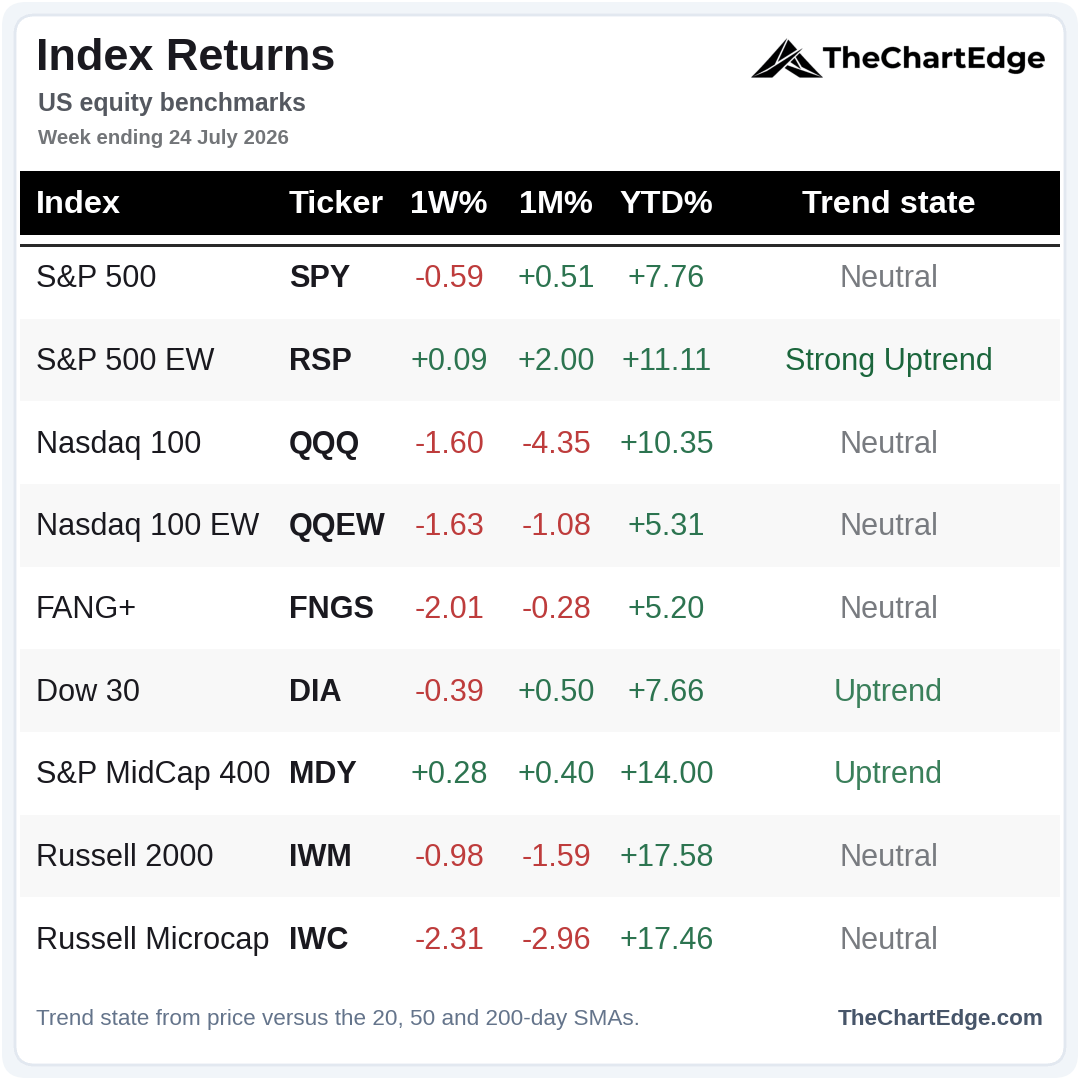
Of the major indices I track, only the EW S&P 500 and the S&P Mid-Cap 400 were up for the week. The Dow was down 39 basis points, but its three-week pullback has been orderly so far.
SPY Chart
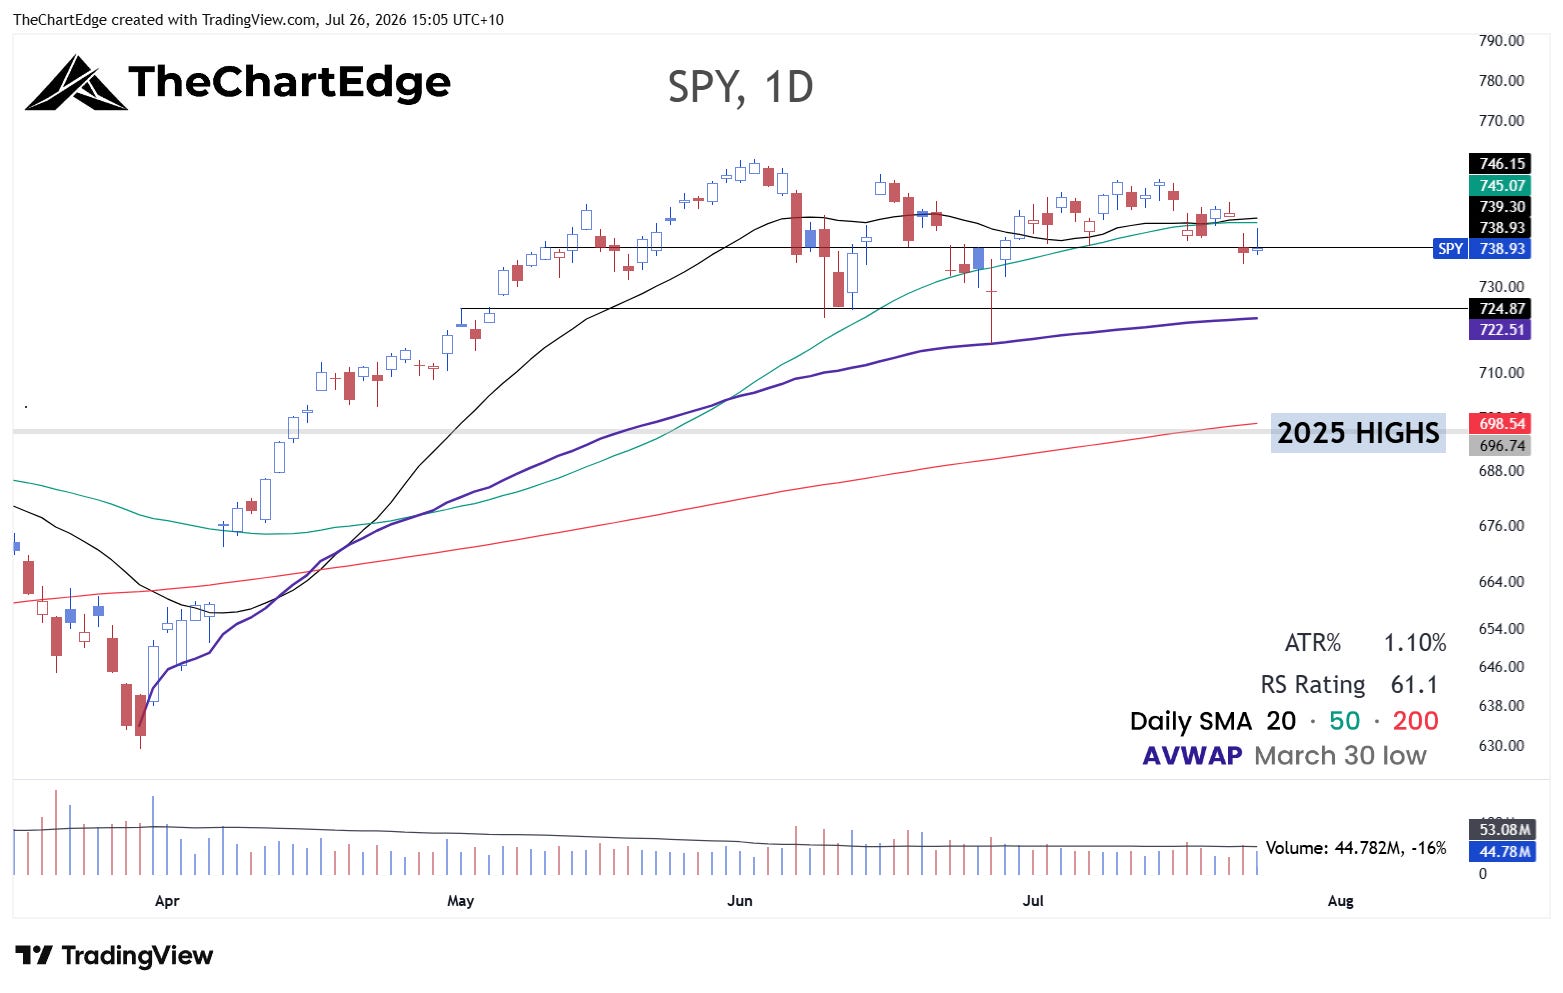
SPY spent another week range bound, closing below both its 20-day and 50-day SMAs. If there is further downside, the AVWAP from the March 30 low, which currently sits around 722.5, would be the first level of potential support. If that fails to hold, a test of the 200-day SMA, which sits 5.8% below Friday’s close, would be possible.
QQQ Chart
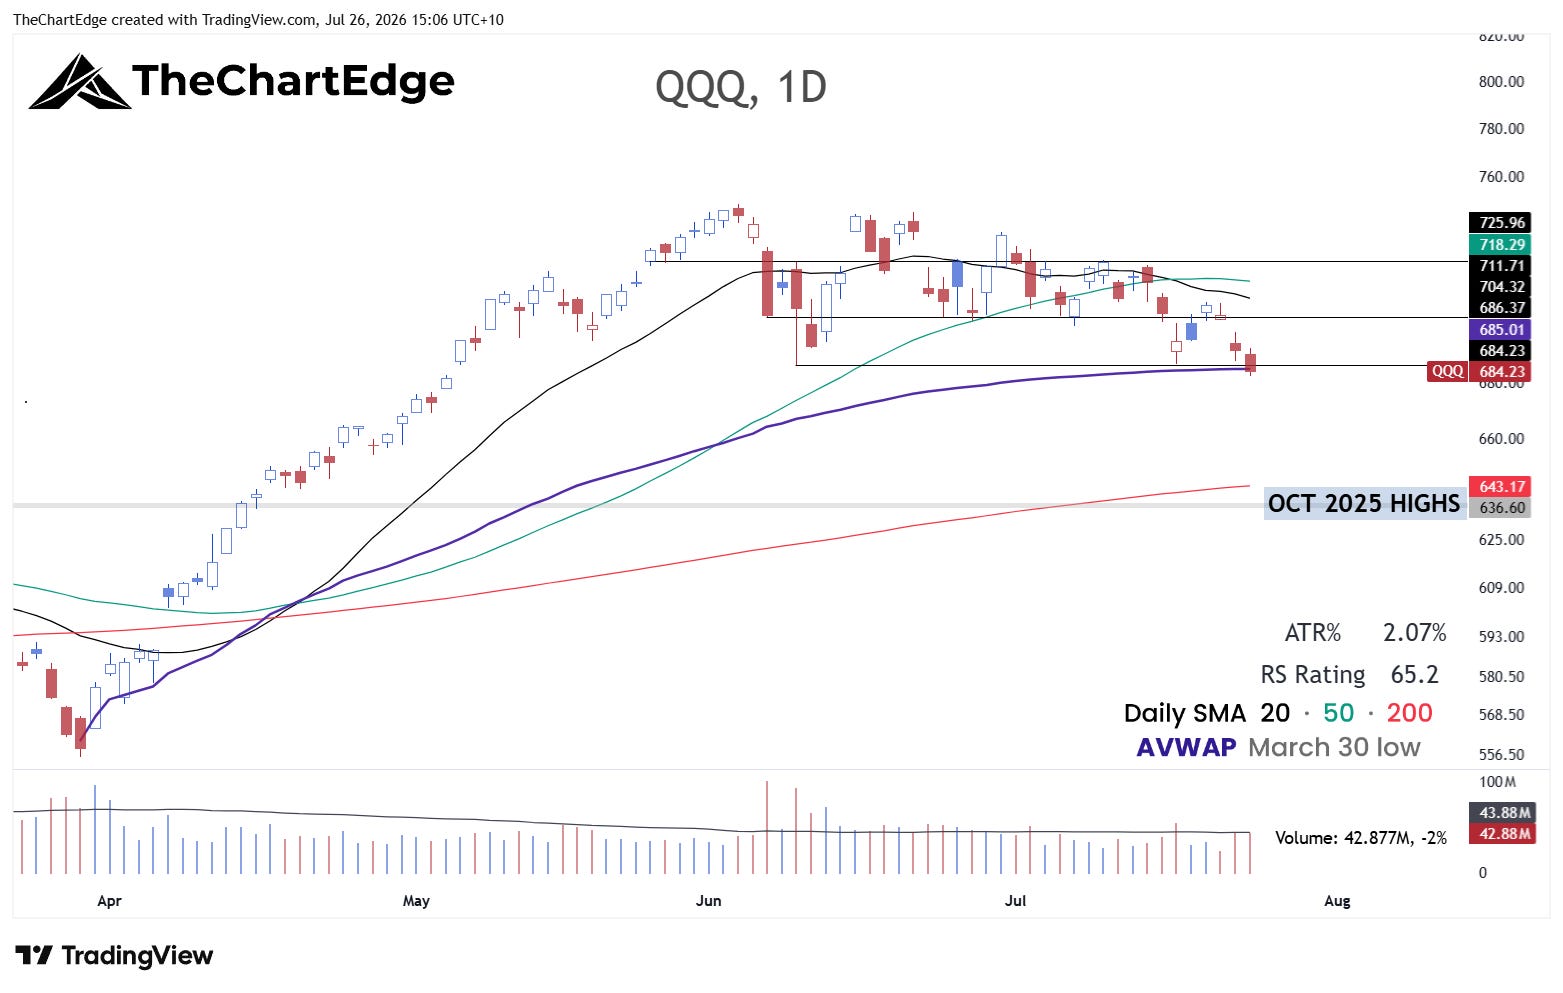
QQQ still looks significantly weaker than SPY and closed the week sitting right on the AVWAP from the March 30 low. It held on Friday, but only just. If we see further downside this week, the 200-day SMA currently sits around 643, only 6.4% below Friday’s close. Given QQQ’s ATR% is a little more than 2%, it is certainly within striking distance. There is also no obvious structure or support between the AVWAP and 200-day SMA, due to the furious April/May rally. Between April 16 and May 6 the QQQ rallied about 56 points (8.8%) in just 14 trading days, after breaking out over 637.
Market Temperature
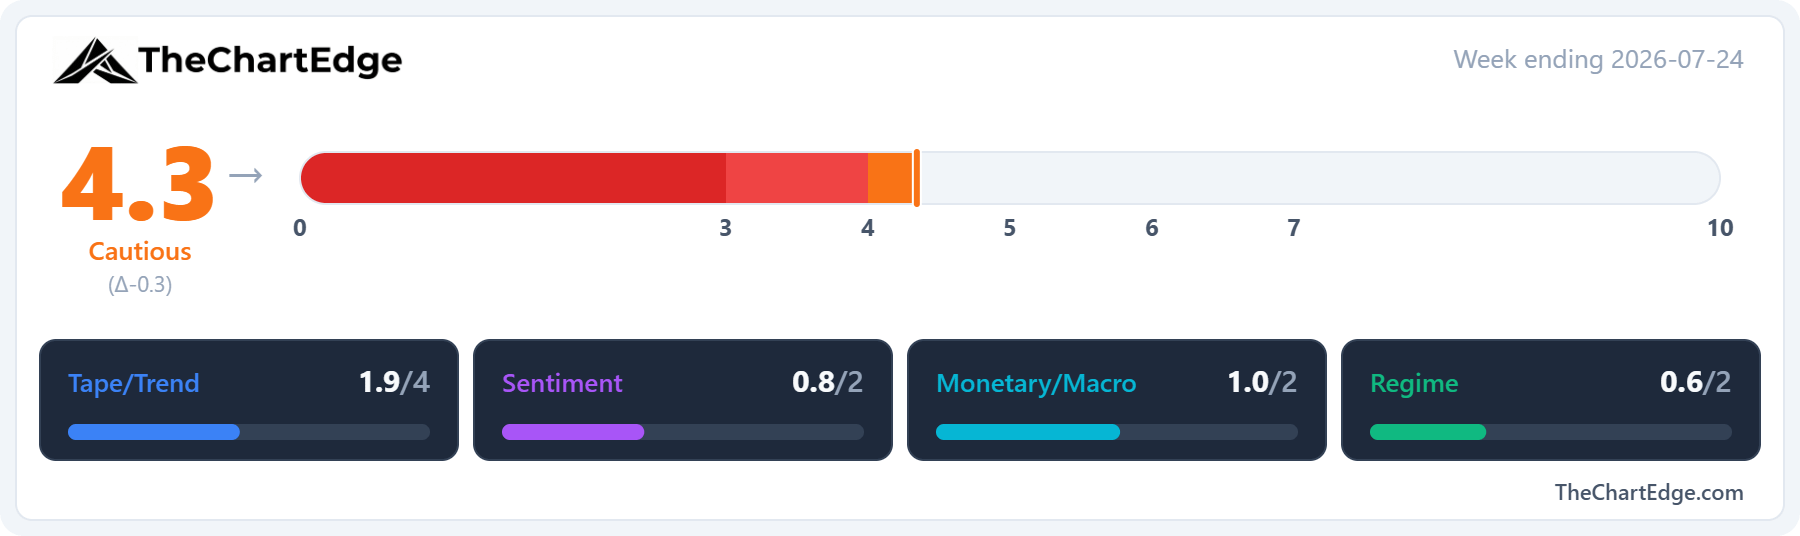
The Market Temperature came in at 4.3, down from 4.6, posting a second straight week in Cautious. As I wrote four weeks ago in this post, a week or two in Cautious is close to a coin-flip historically. It’s sustained weakness below 4.0 that has mattered.
Last week felt worse than a 0.3 drop. The Tape/Trend pillar held up because SPY and QQQ were both already sitting in Neutral, so this inputs score remained unchanged. By design, neither index can flip to a downtrend while above their 200-day SMAs. The rest of the Tape/Trend pillar weakened - breadth and the SPY weekly RSI were both lower, which brought the pillar score down 0.2 from last week.
Regime weakened slightly, due to the XLY/XLP ratio continuing down.
The Sentiment score was unchanged to one decimal place, as the VIX barely moved on the week.
The Macro/Monetary pillar score was also unchanged.
GICS Sector Relative Strength
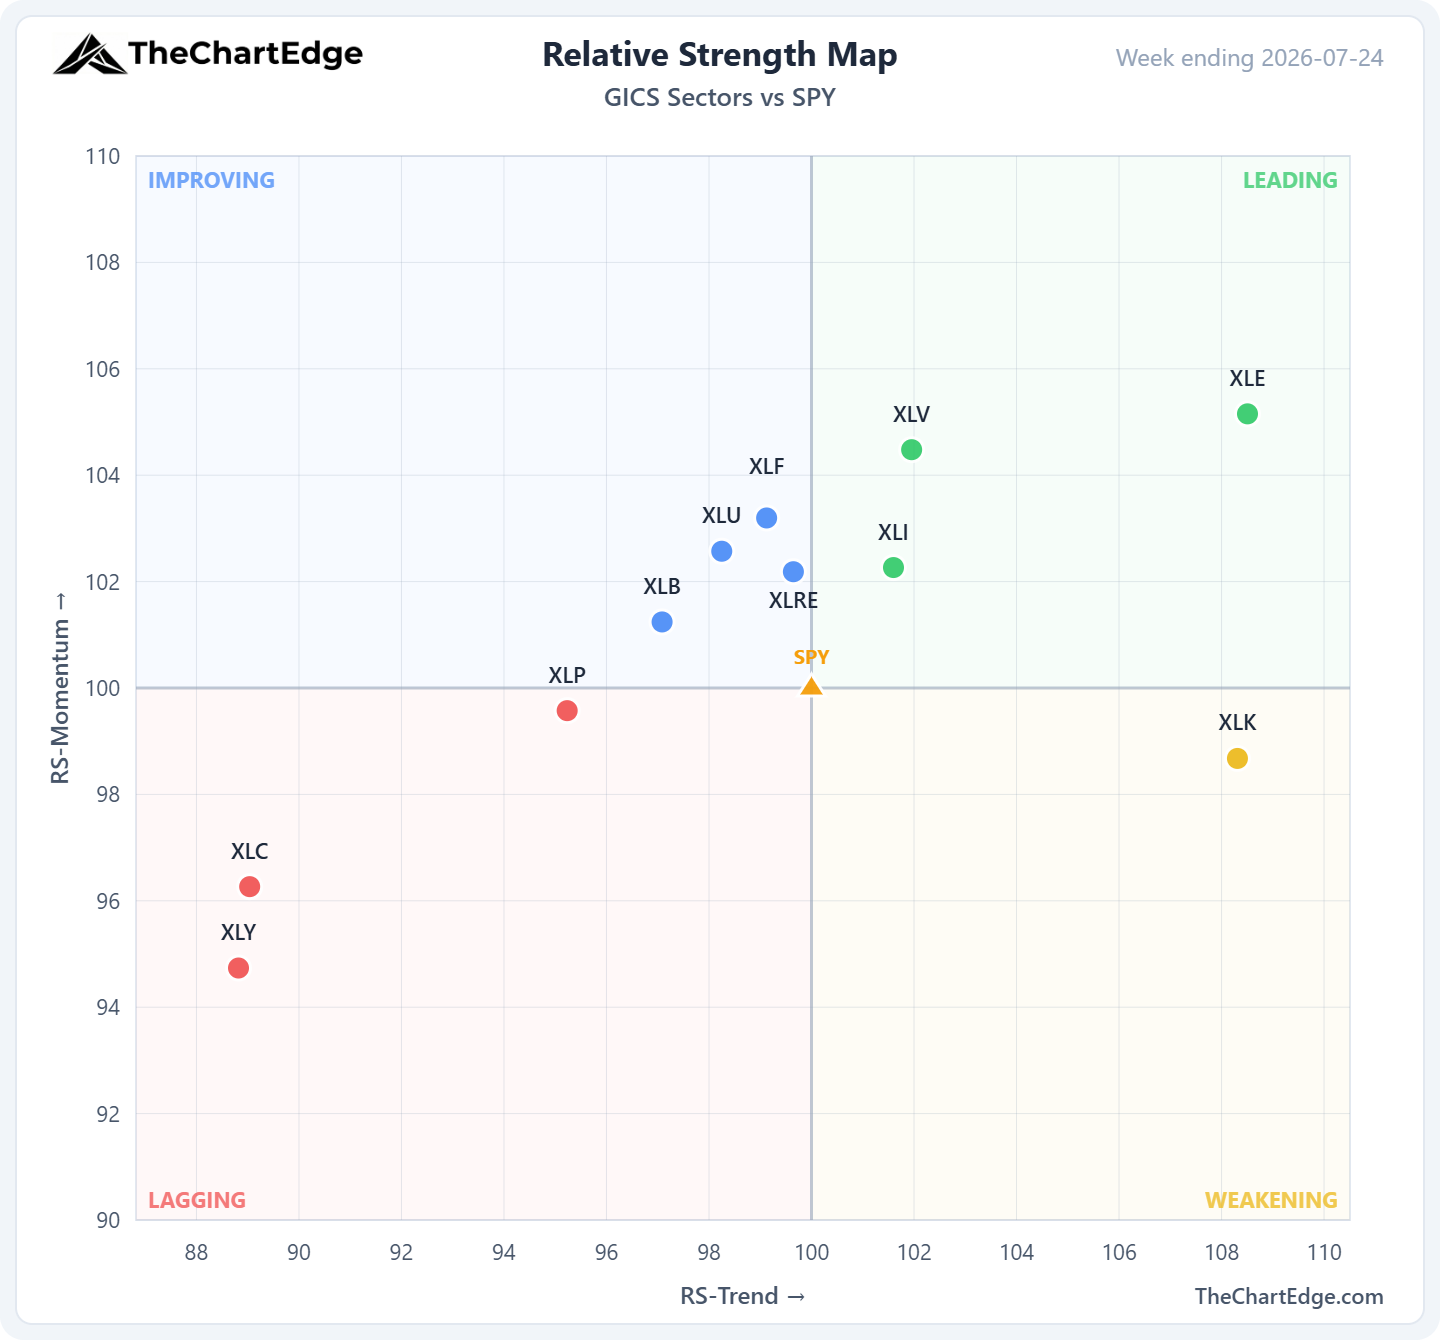
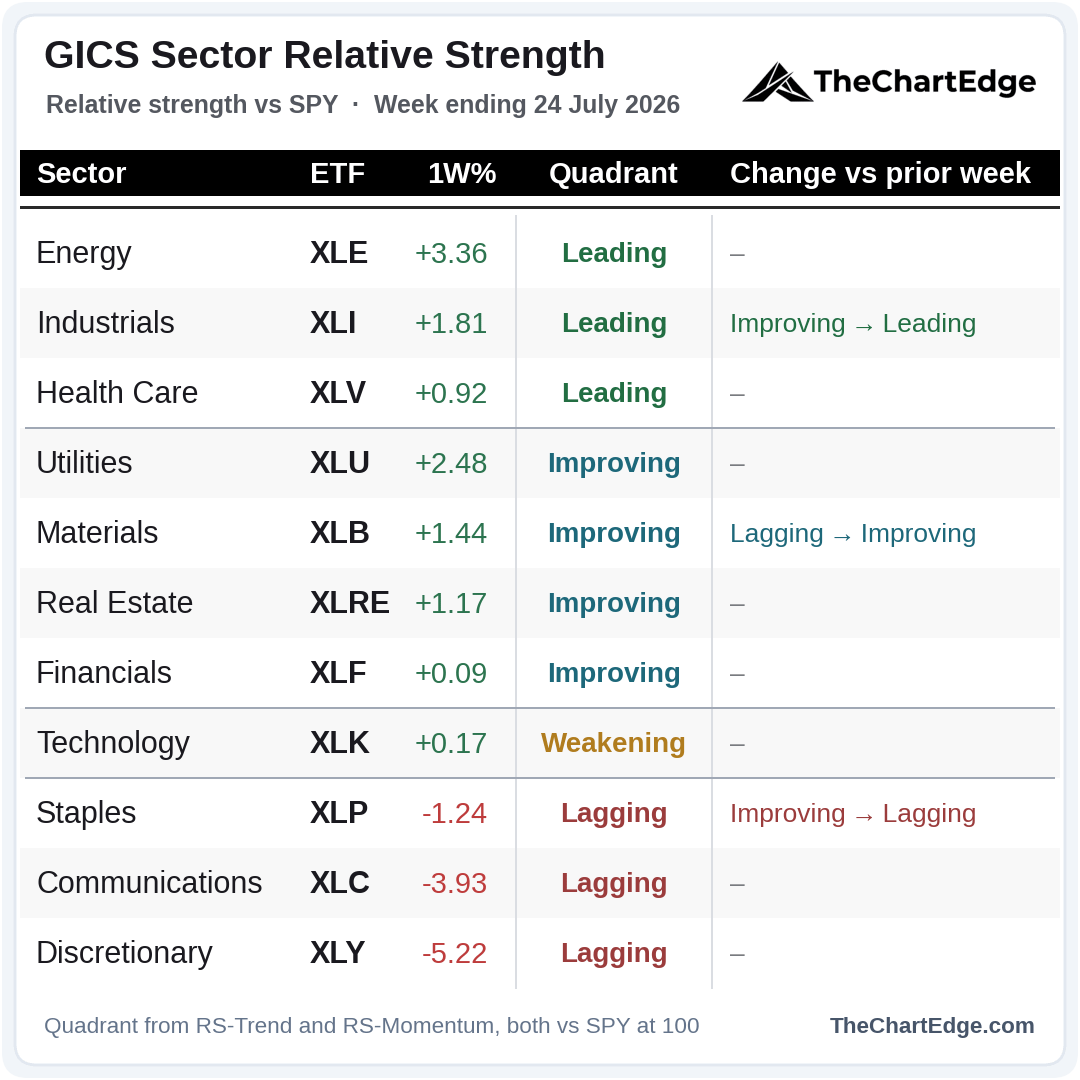
Eight of the eleven sectors finished the week higher while SPY finished lower. Energy, industrials and healthcare all hold the Leading quadrant, with financials, utilities, materials and real estate in Improving.
But how long can this rotation carry the S&P 500 if technology continues to underperform? XLK is roughly a third of the S&P 500, and doesn’t include Alphabet, Amazon, Meta, Netflix or Tesla.
Communications was rallying and Discretionary holding in throughout early to mid-July. However, both had big falls on Thursday July 23 and are both negative year to date, down 10.0% and 8.9% respectively.
Momentum Leaderboard
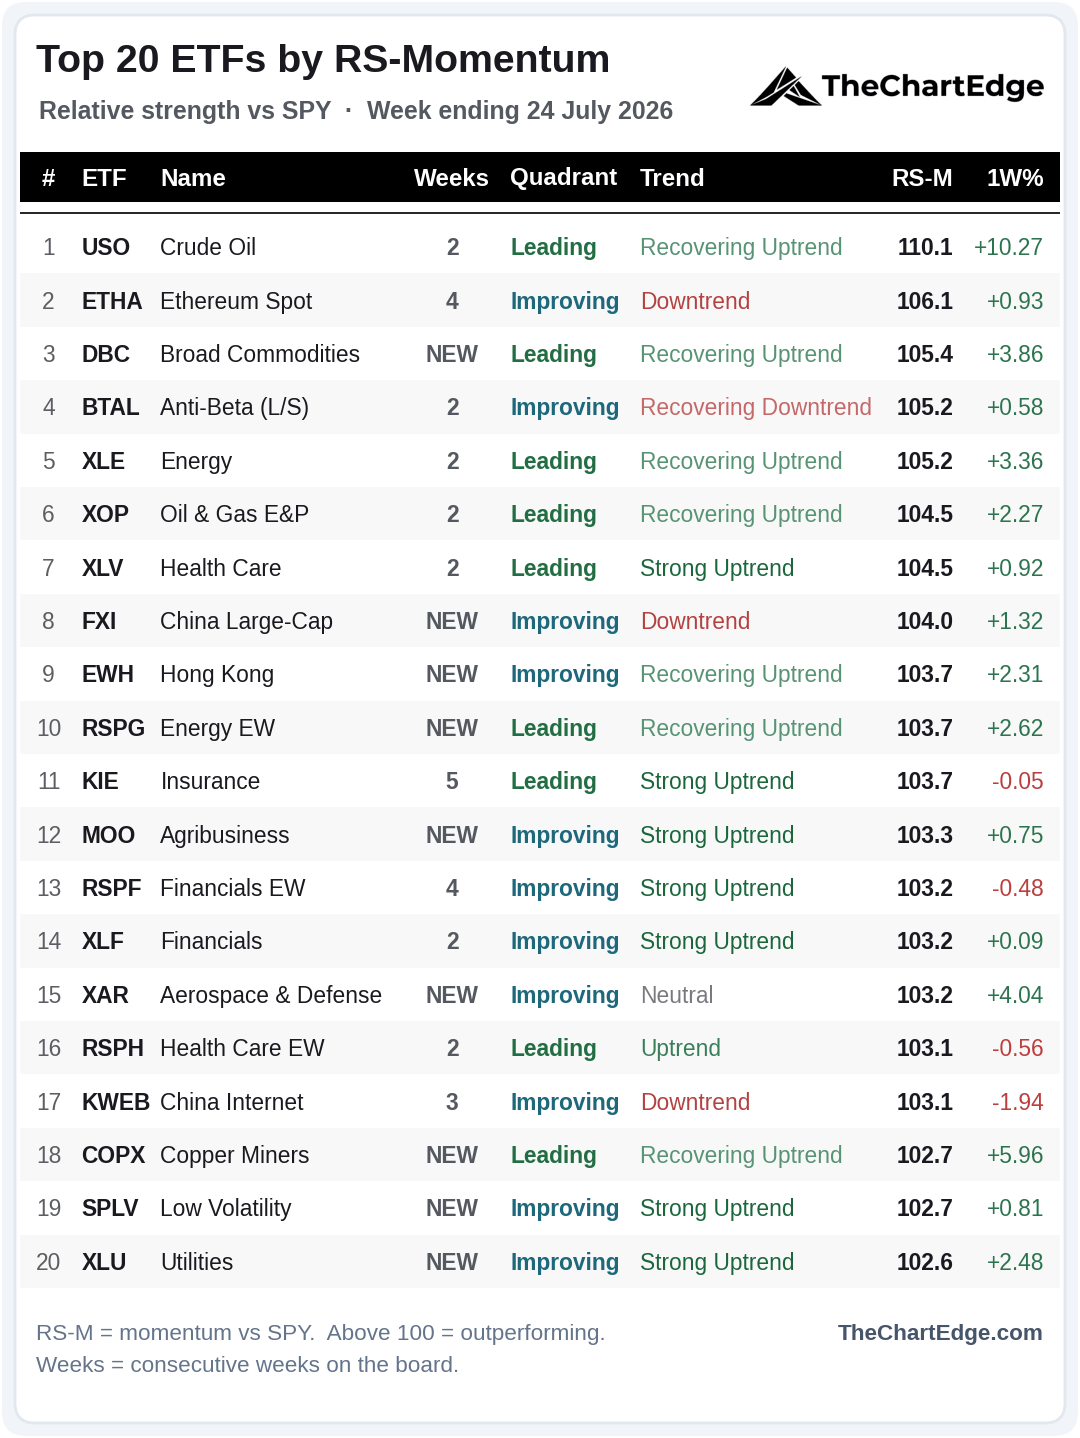
Nine of the twenty are new, with Crude oil (USO) topping the board. Energy and commodity ETFs hold five of the top ten places, and even Broad Commodities (DBC) is heavily weighted to oil, gasoline and other distillates. Anti-Beta (BTAL) at number 4 indicate risk appetite is not high. China Large-Cap (FXI) and Hong Kong (EWH) also arrived on the board, placing in the top ten.
The banks (KBE & KRE), cybersecurity (CIBR), both software proxies (IGV & XSW) and retail (XRT) dropped off, as did Genomics (ARKG) after a run of six straight weeks. It was the only name that had been on the board every week since I started publishing it.
Trend States Across the Universe
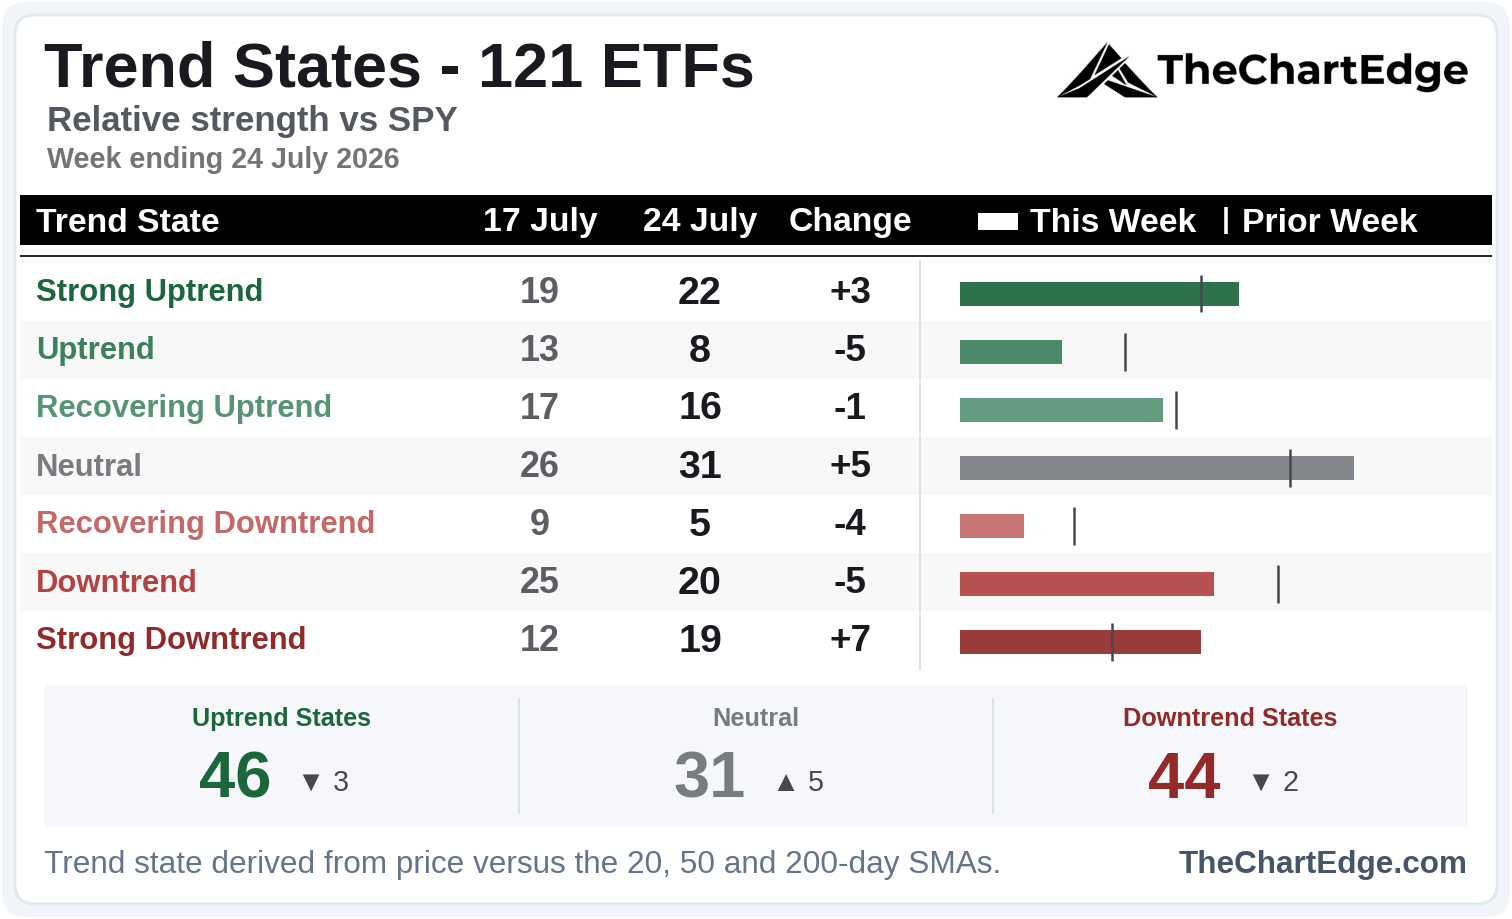
Looking at the Trend States Board this weekend there was only a little shuffling around at the aggregate level of Uptrend, Downtrend and Neutral States.
Industry Breadth
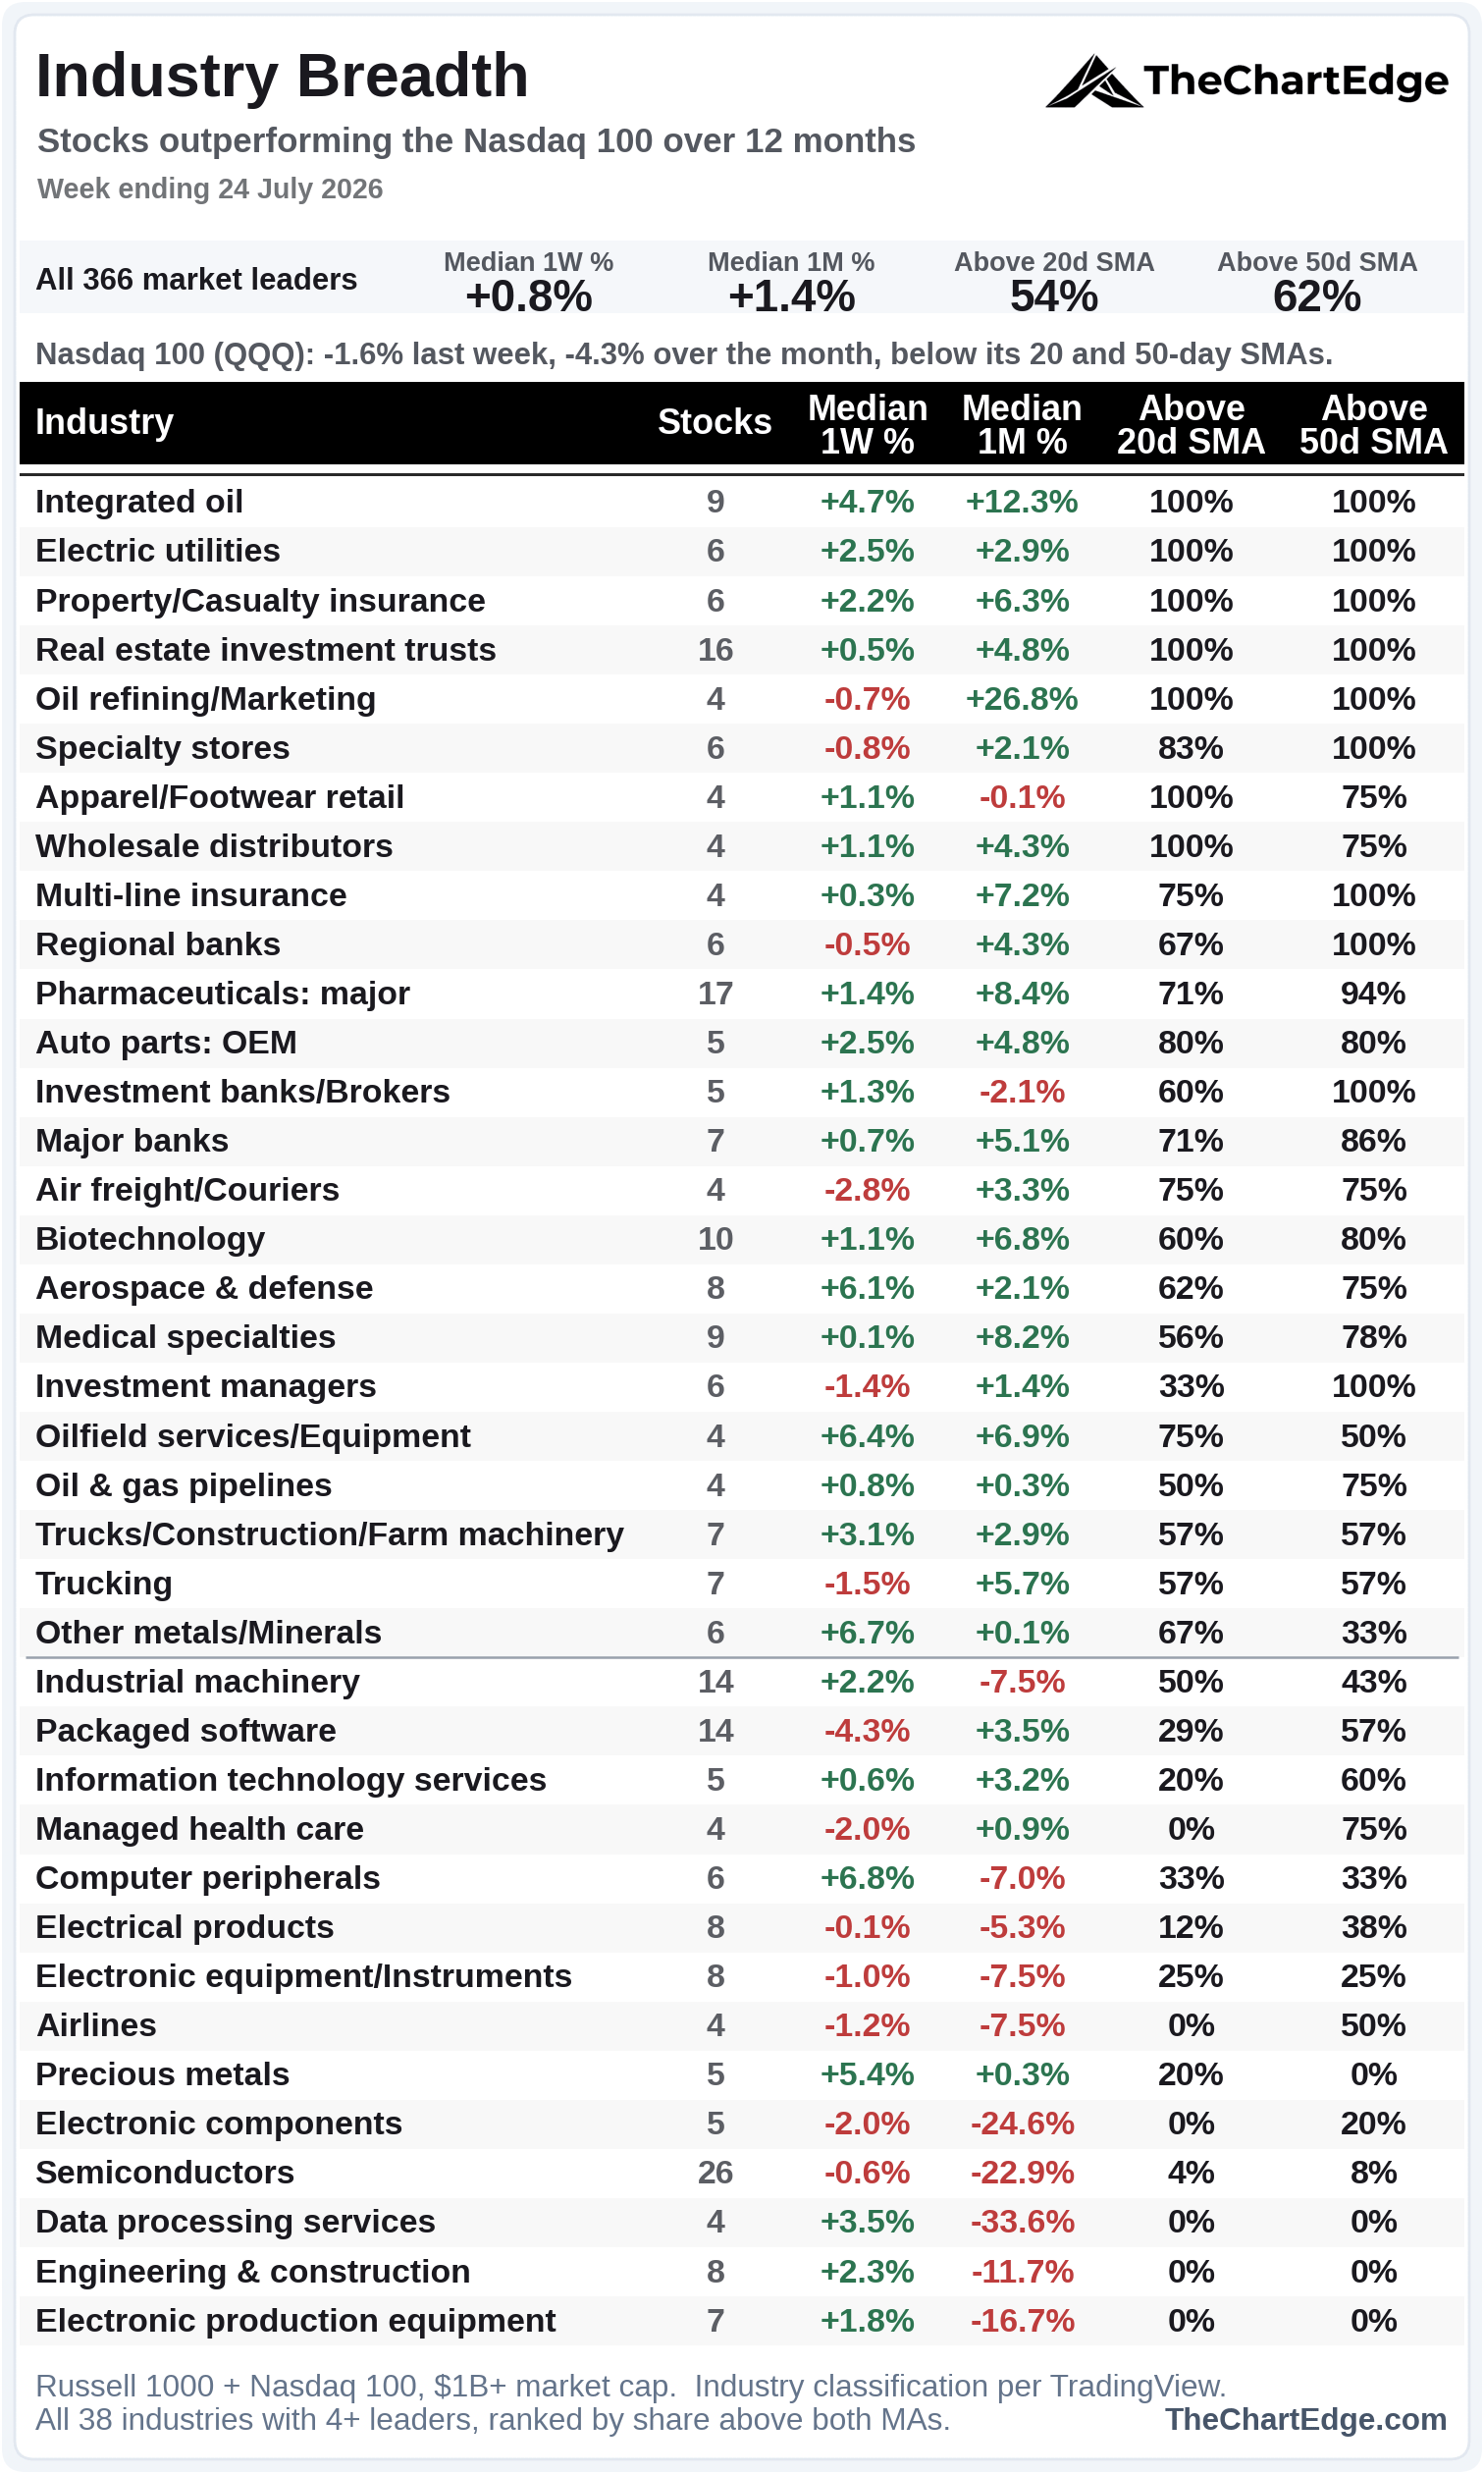
One change to this board, which I introduced last weekend. I have decided to rank it by the average of the percentage of each industry’s names above their 20 and 50-day SMAs, rather than by weekly return.
At the top end, integrated oil, electric utilities, property and casualty insurance, REITs and oil refining all have 100% of names above both SMAs.
Financials continue to look healthy. Regional banks, investment banks and investment managers all have every name above the 50-day, but fewer above the 20-day.
Biotech is holding reasonably well after the recent pullback, with 80% of names still above their 50-day SMAs.
Noticeably, no technology industry appears until you reach the bottom third of the board and all nine of them sit there.
Semis at a Crossroads
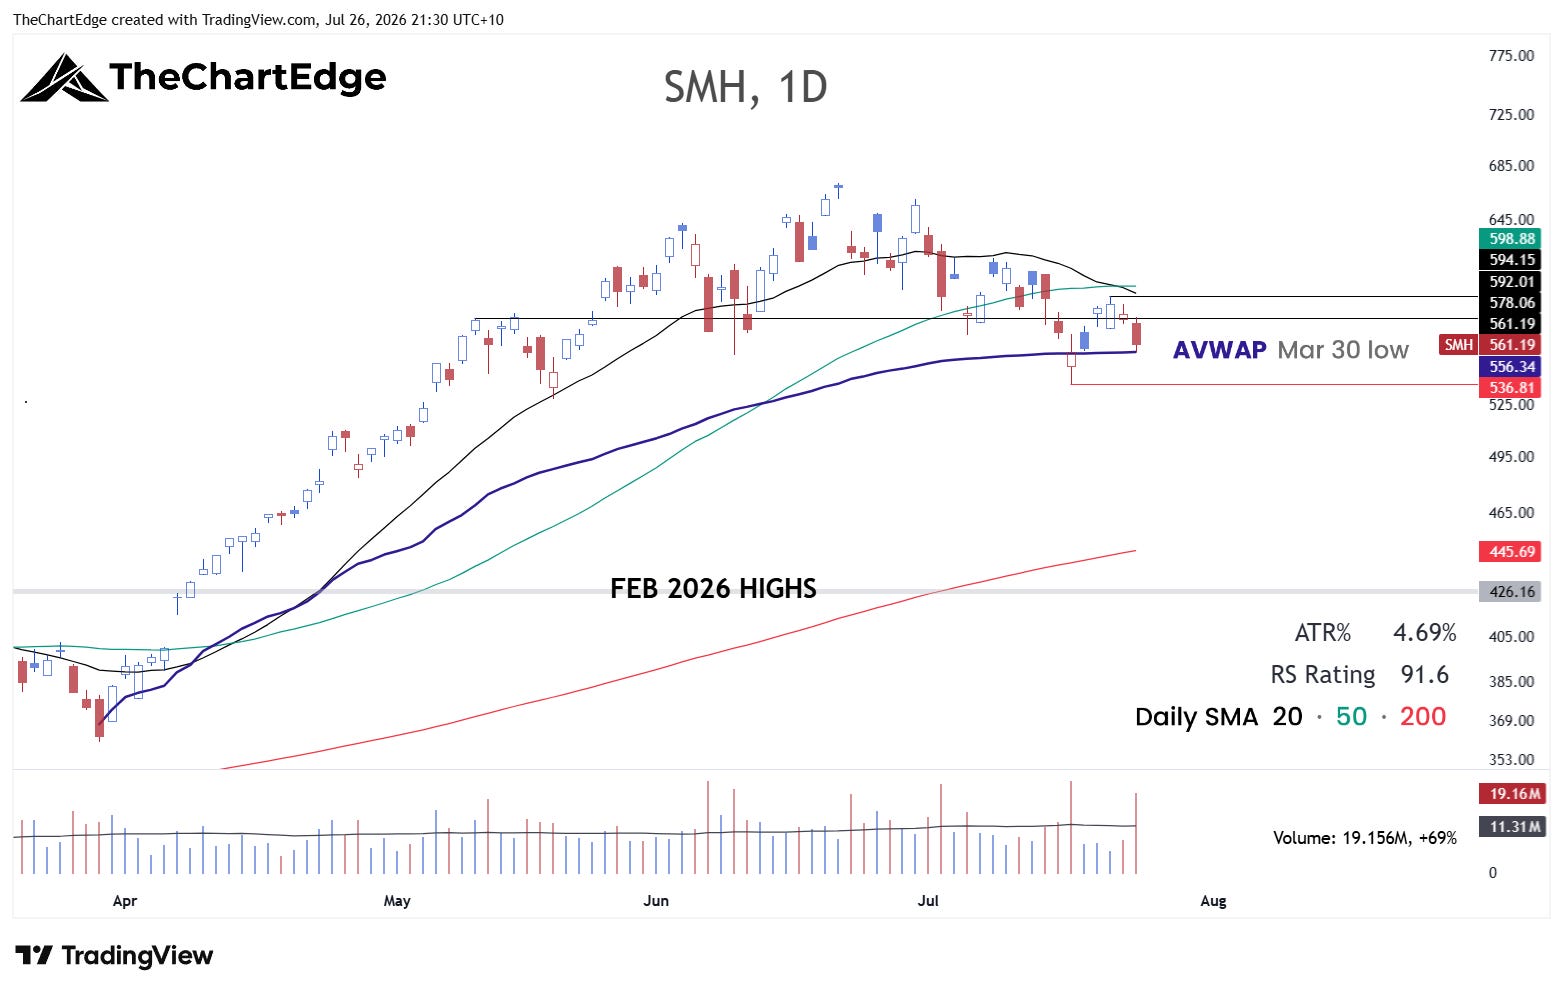
Mid-week it looked like SMH was going to play out another failed head and shoulders “top”. After a shakeout below the AVWAP from the March 30 low, on Friday July 17, and a strong start to last week, it had reclaimed the neckline of the H&S pattern and looked ready to push higher. However, it stalled under its 20 and 50-day SMAs on Wednesday and rolled over on Friday, closing just above the AVWAP, with the 20-day now under the 50-day SMA. I’m watching 536 and 592 as important levels.
SMH Chart
Levels I’m Watching on the Dollar Index and TLT
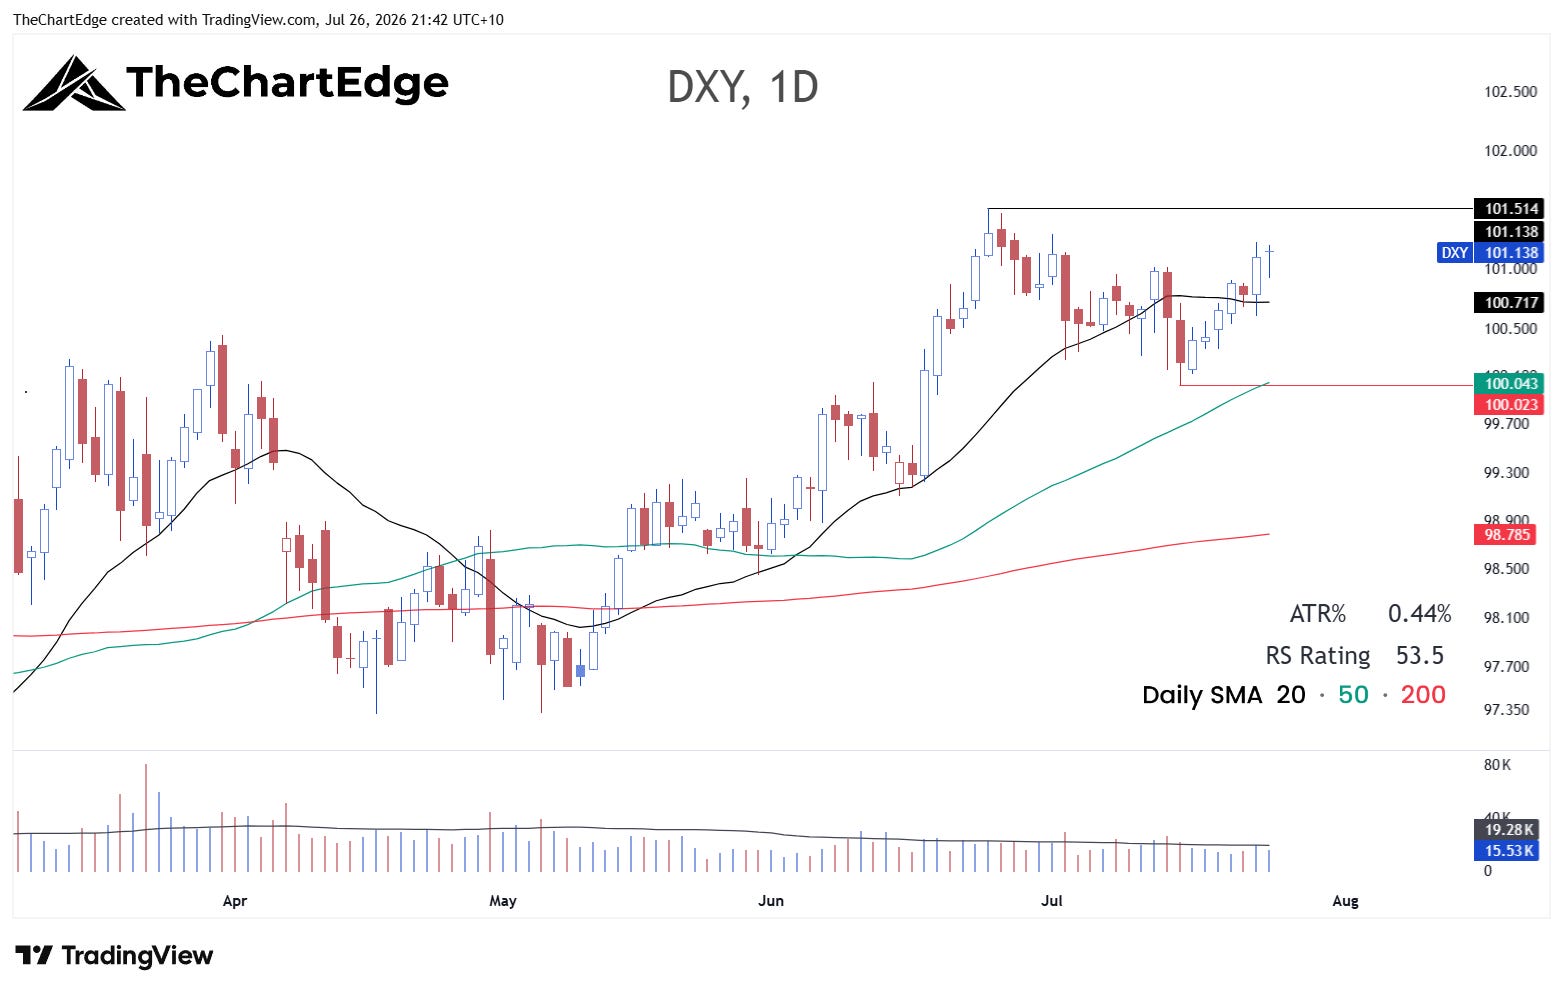
The US dollar is in a Strong Uptrend and is a potential headwind if it continues higher. I am watching 100 and 101.50 - a break higher will likely be a negative for equities. If it stays in the range or breaks lower, I would read that as a positive.
DXY Chart
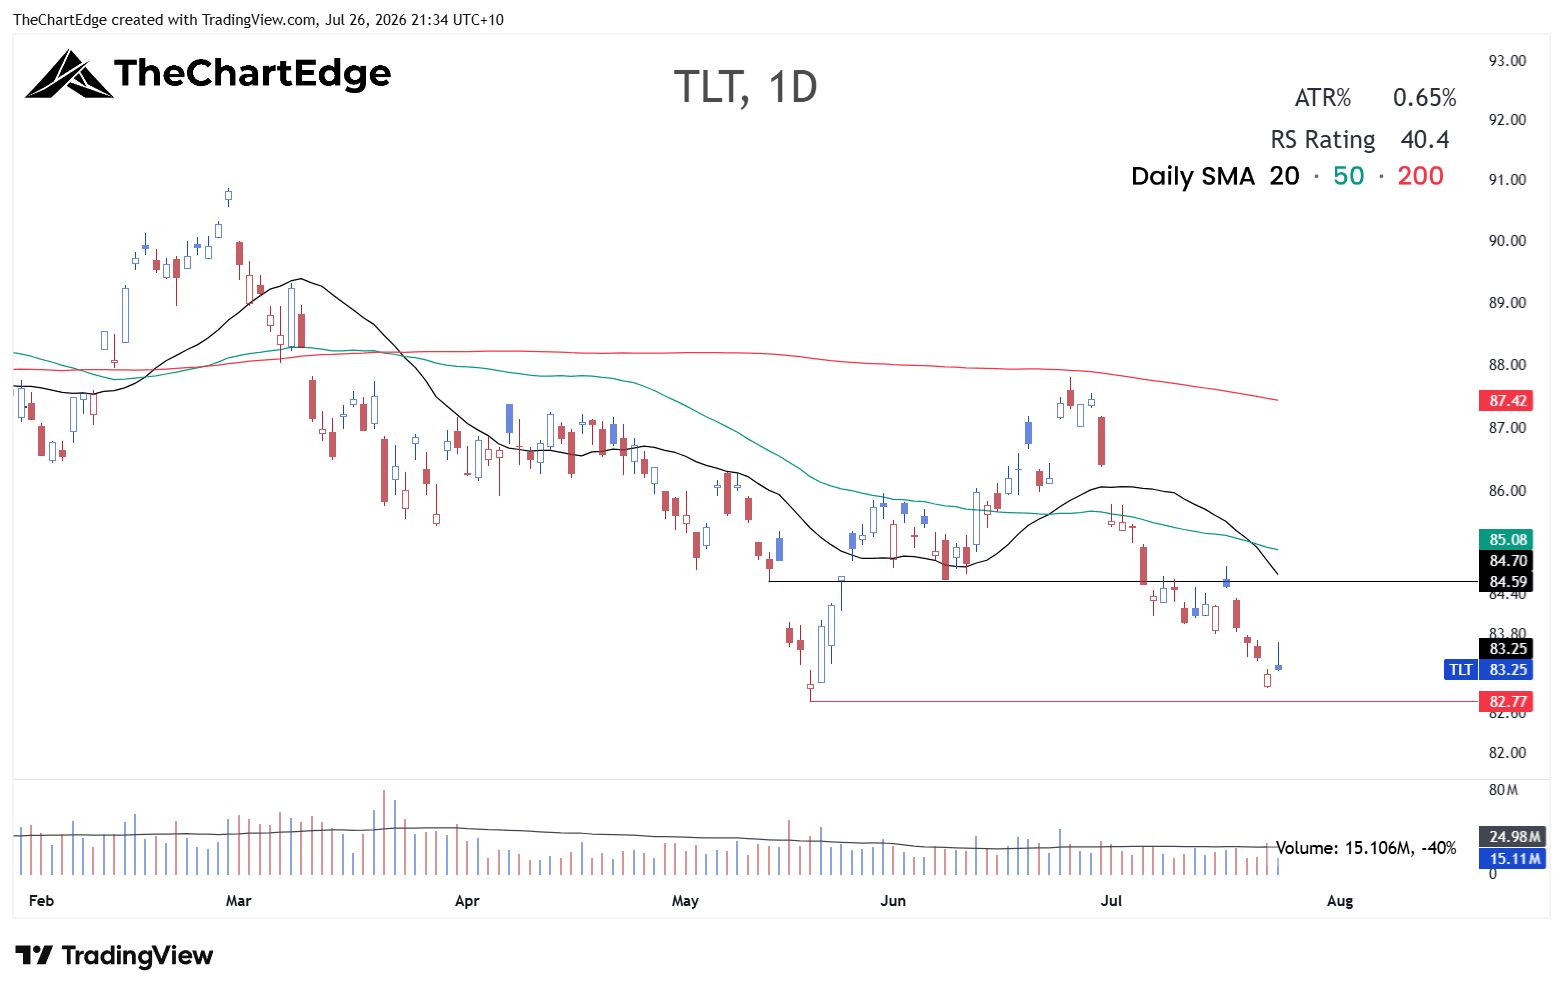
TLT closed the week about half a percent above its May low (82.77). If that level breaks and yields push over 4.75-4.8% towards 5%, it will be another tick in the bearish column.
TLT Chart
Follow-Up on Last Week’s Names
Last weekend I wrote that Dell (DELL), AMD, Cisco (CSCO) and Astera Labs (ALAB), which I had pointed out the previous week had held up well, all broke down (only Dell closed the week above its 50-day SMA), and that was itself a warning. However, last week Dell and AMD recovered. CSCO and ALAB are now off my watchlist.
DELL Chart
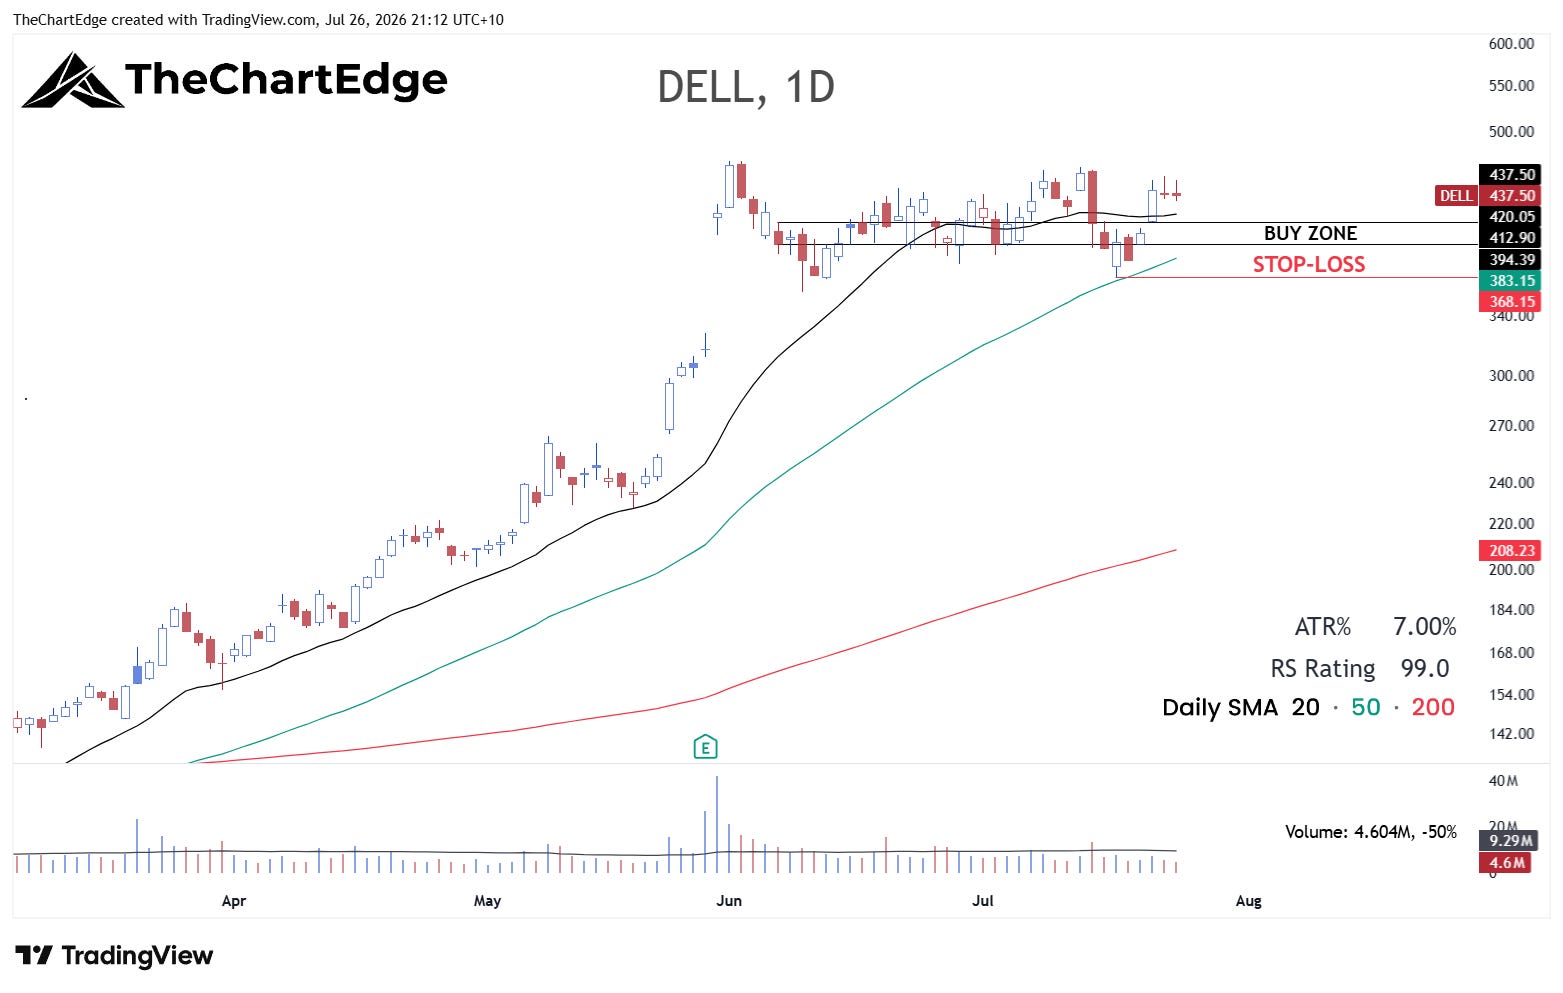
Dell rose 10.4% and is back above its 20 and 50-day SMAs.
AMD Chart
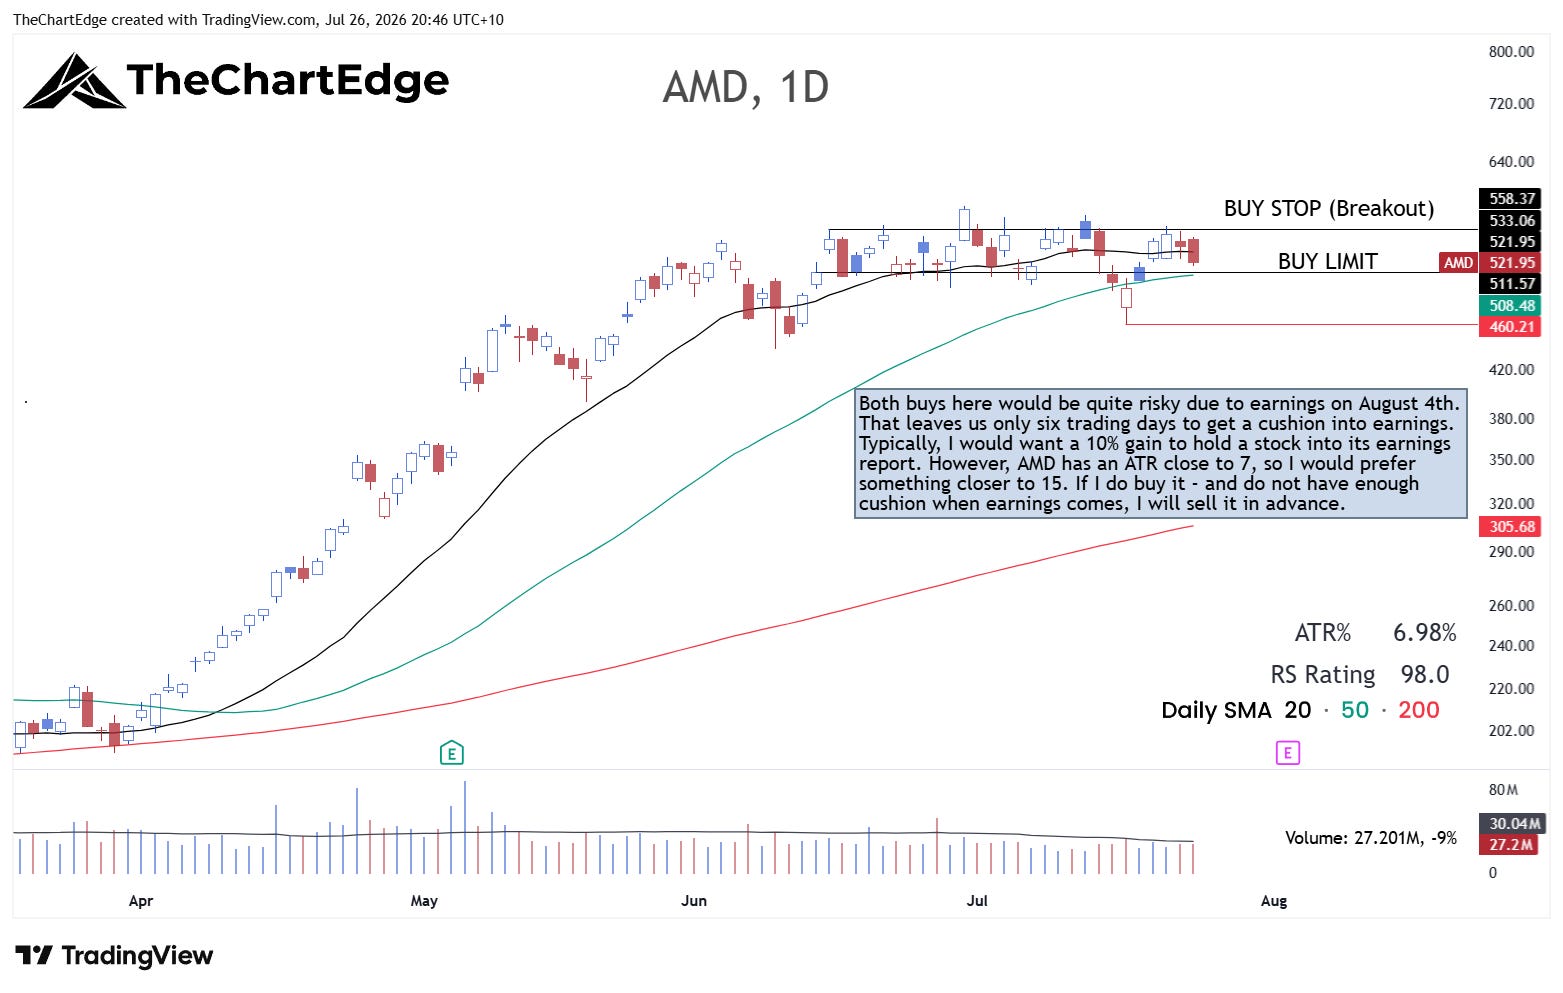
AMD bounced hard Monday through Wednesday reclaiming its 20 and 50-day SMAs. However, Friday’s 3.3% fall put it back below its 20-day and below the prior three days’ lows, taking off some of the shine. Some tight consolidation for a bit here, before an eventual breakout would be very constructive and potentially offer a low-risk entry.
New Names on the Watchlist
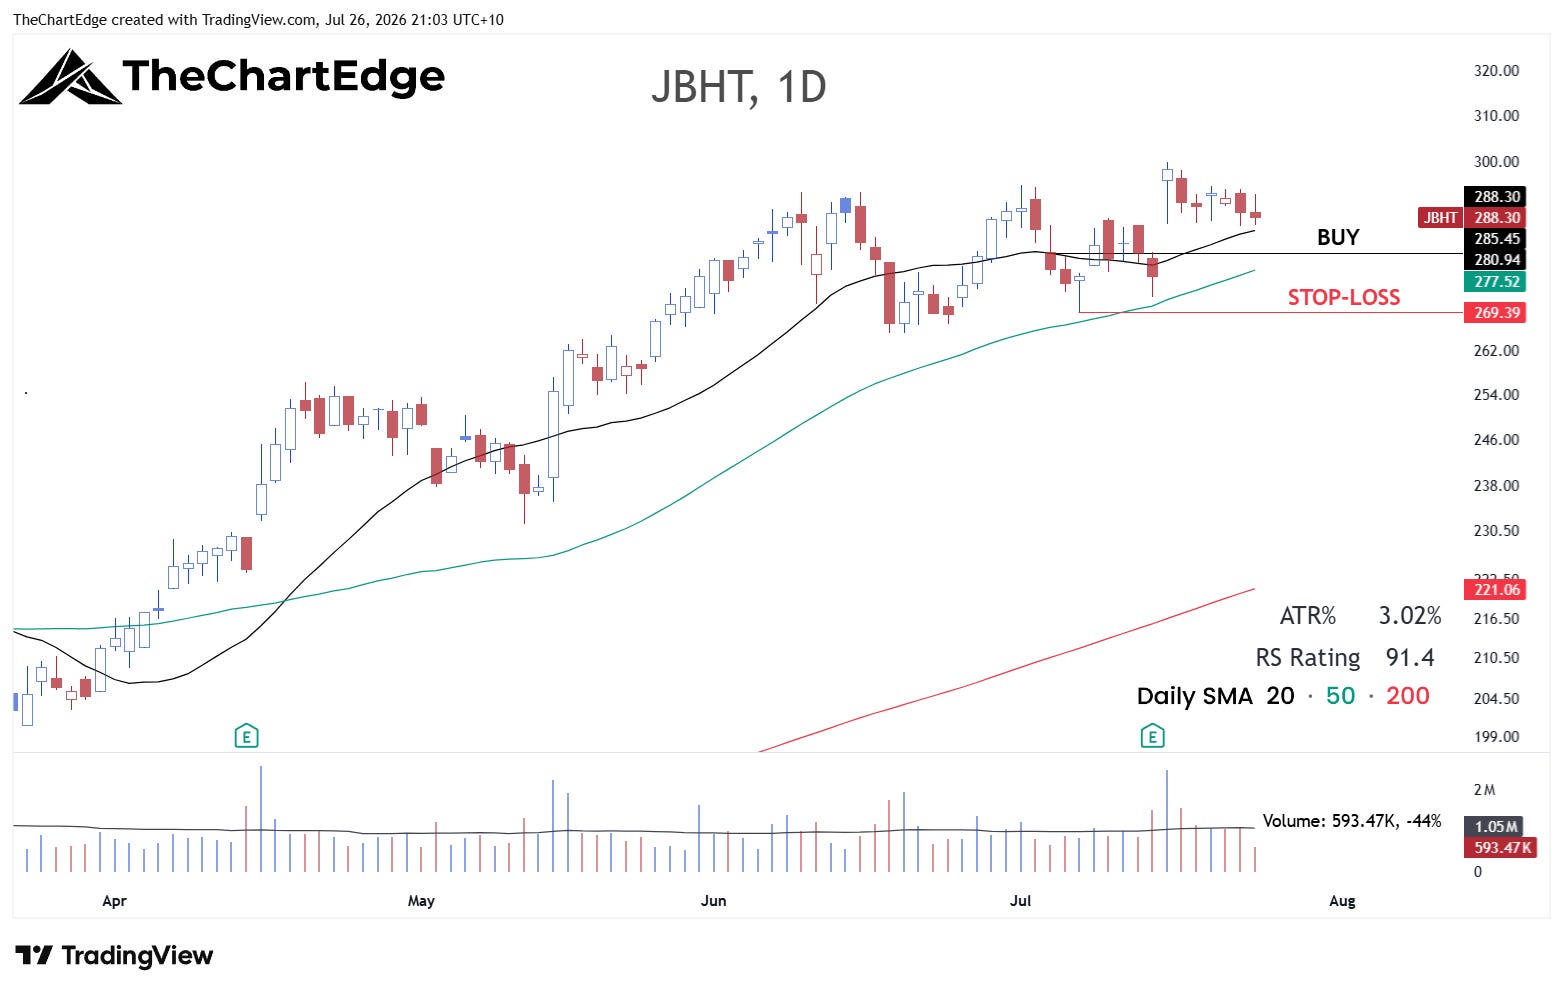
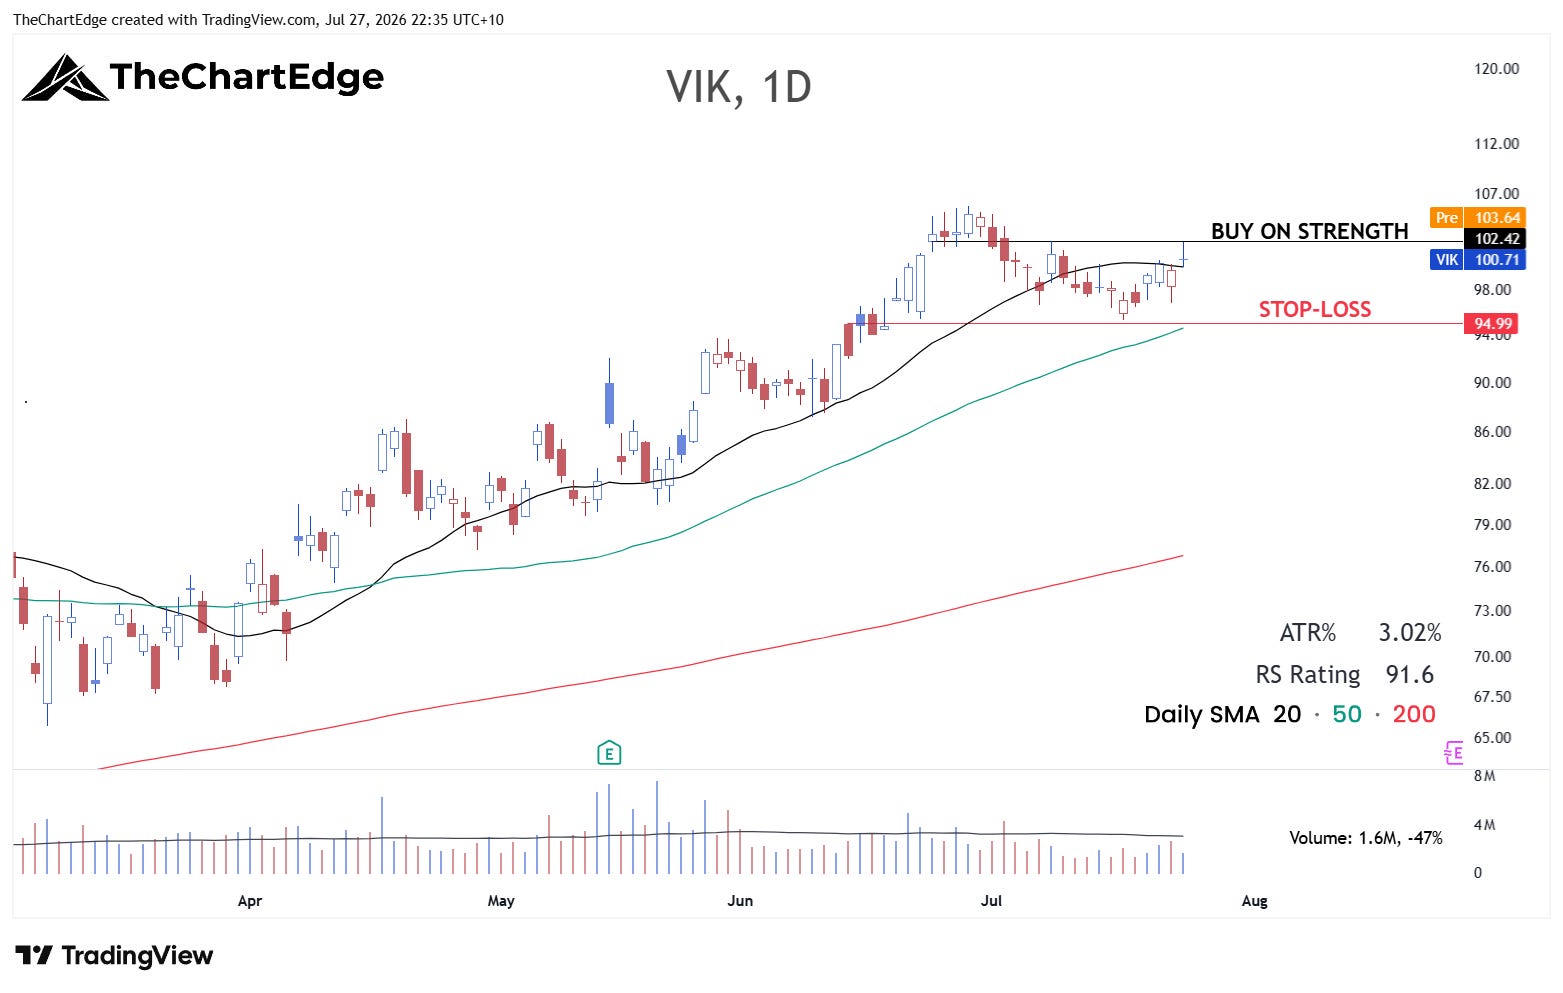
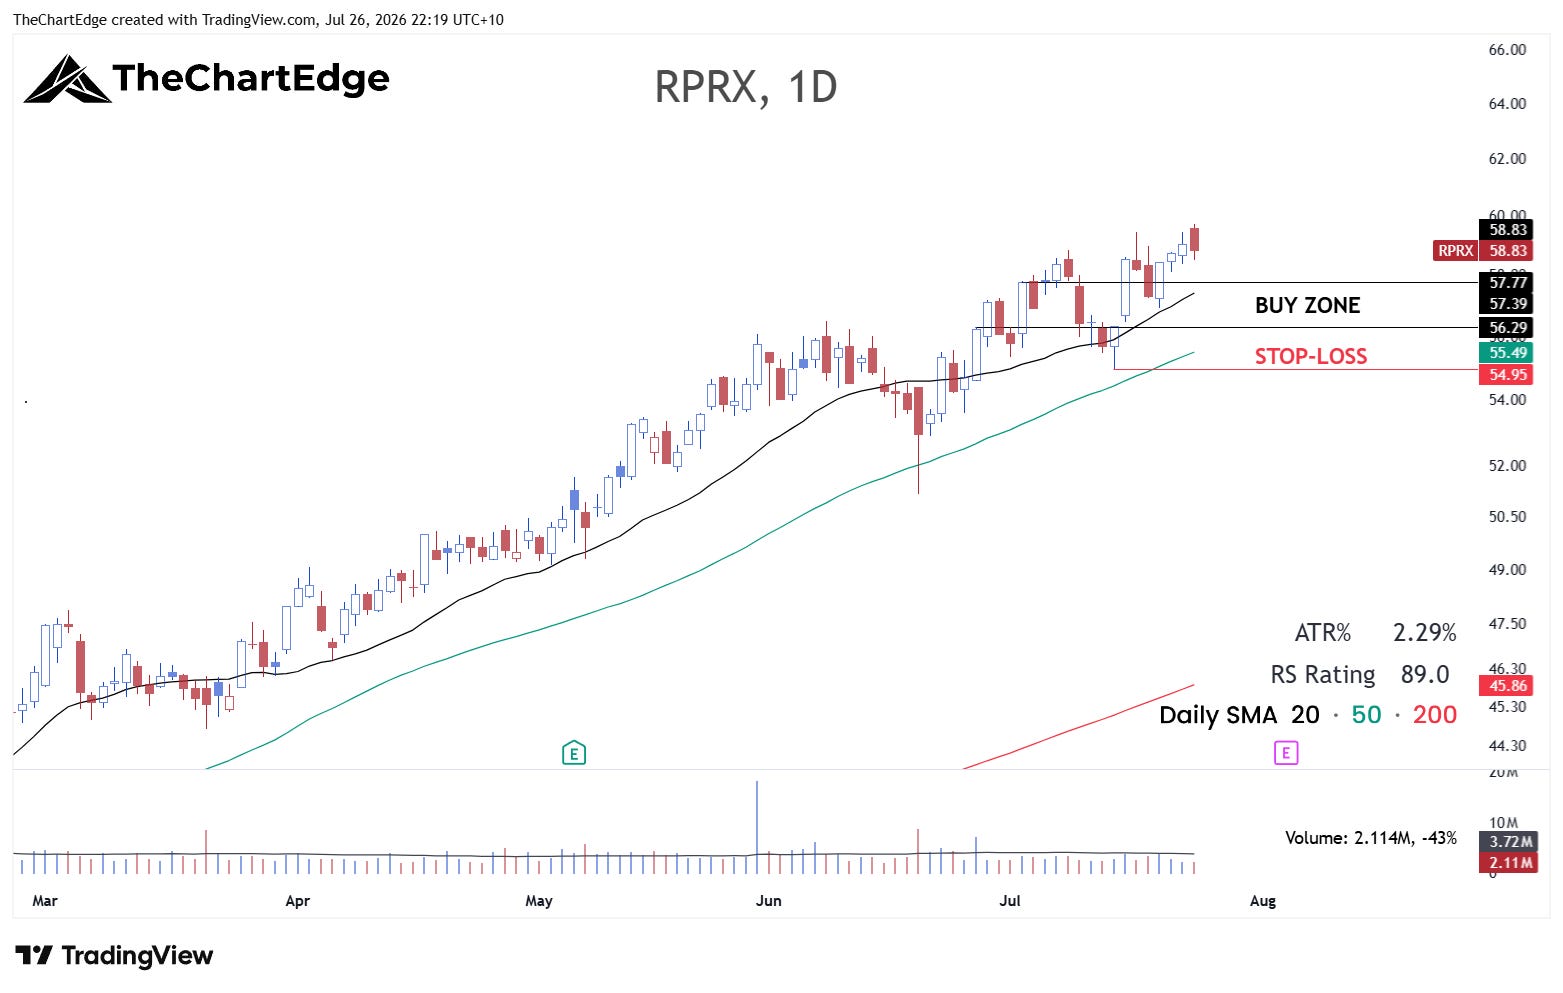
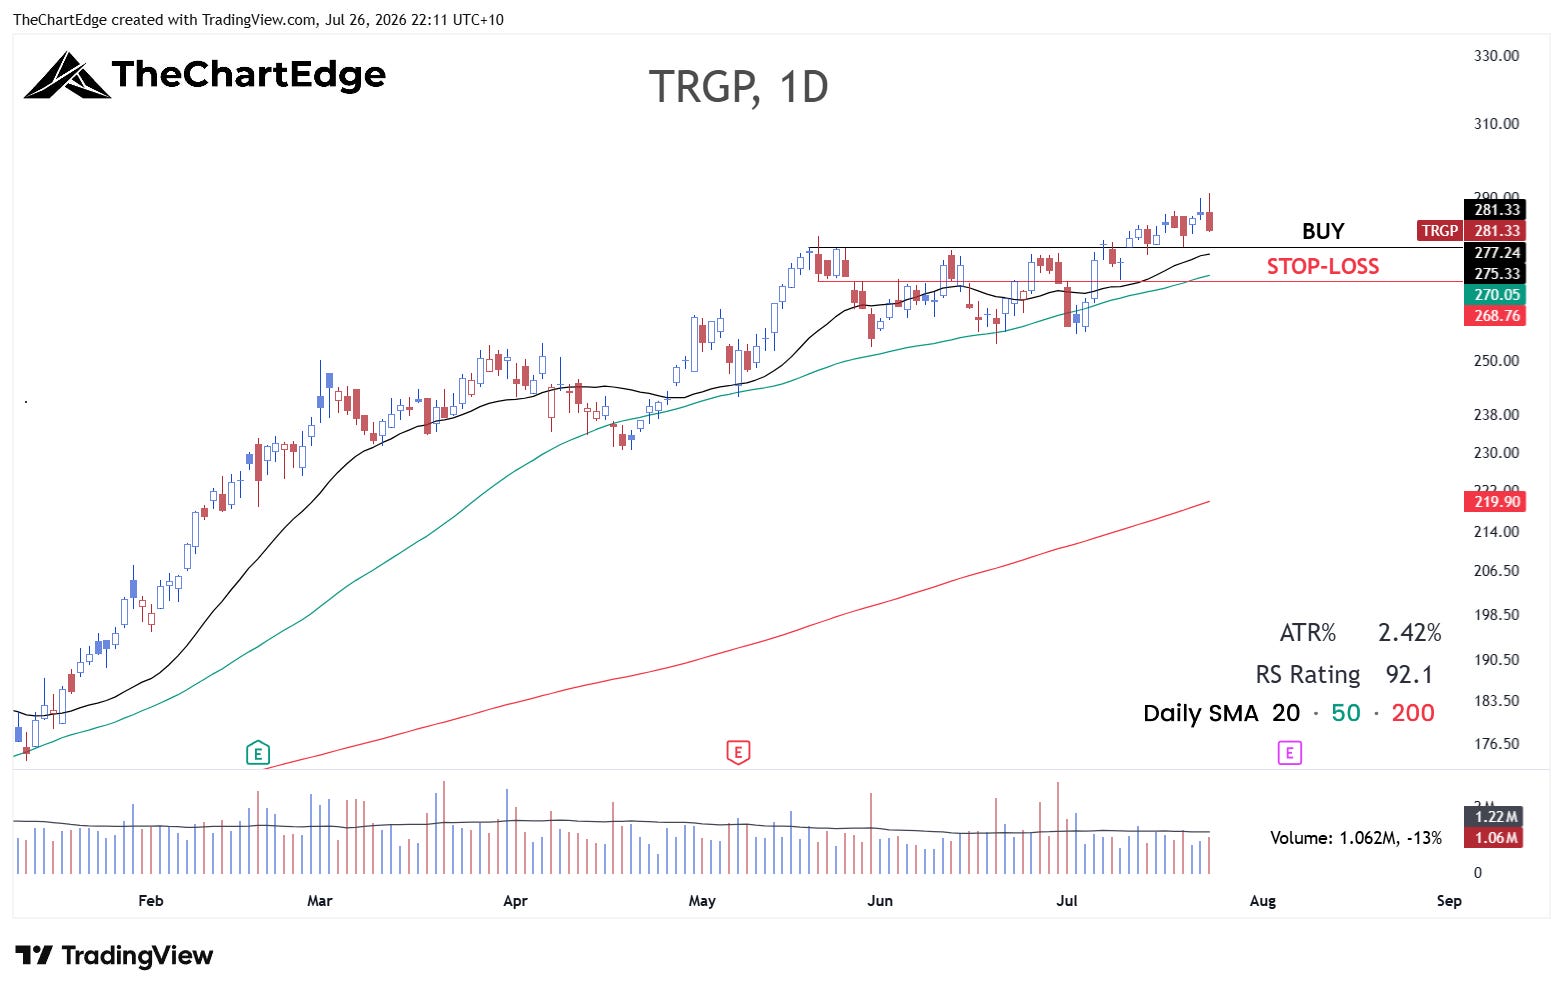
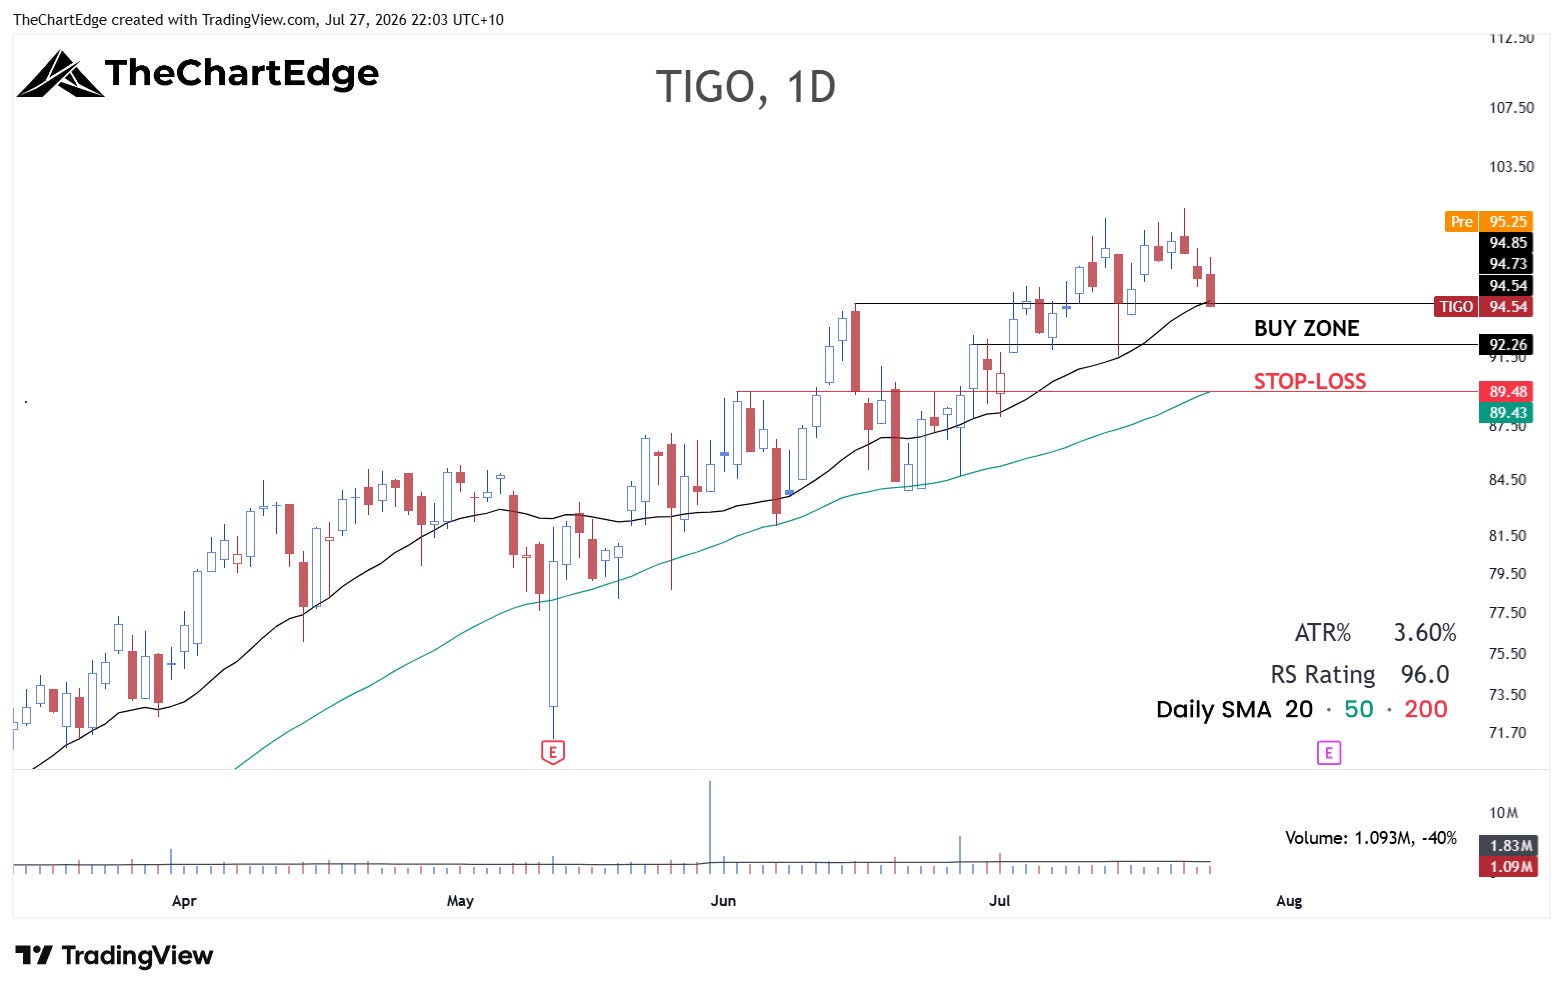
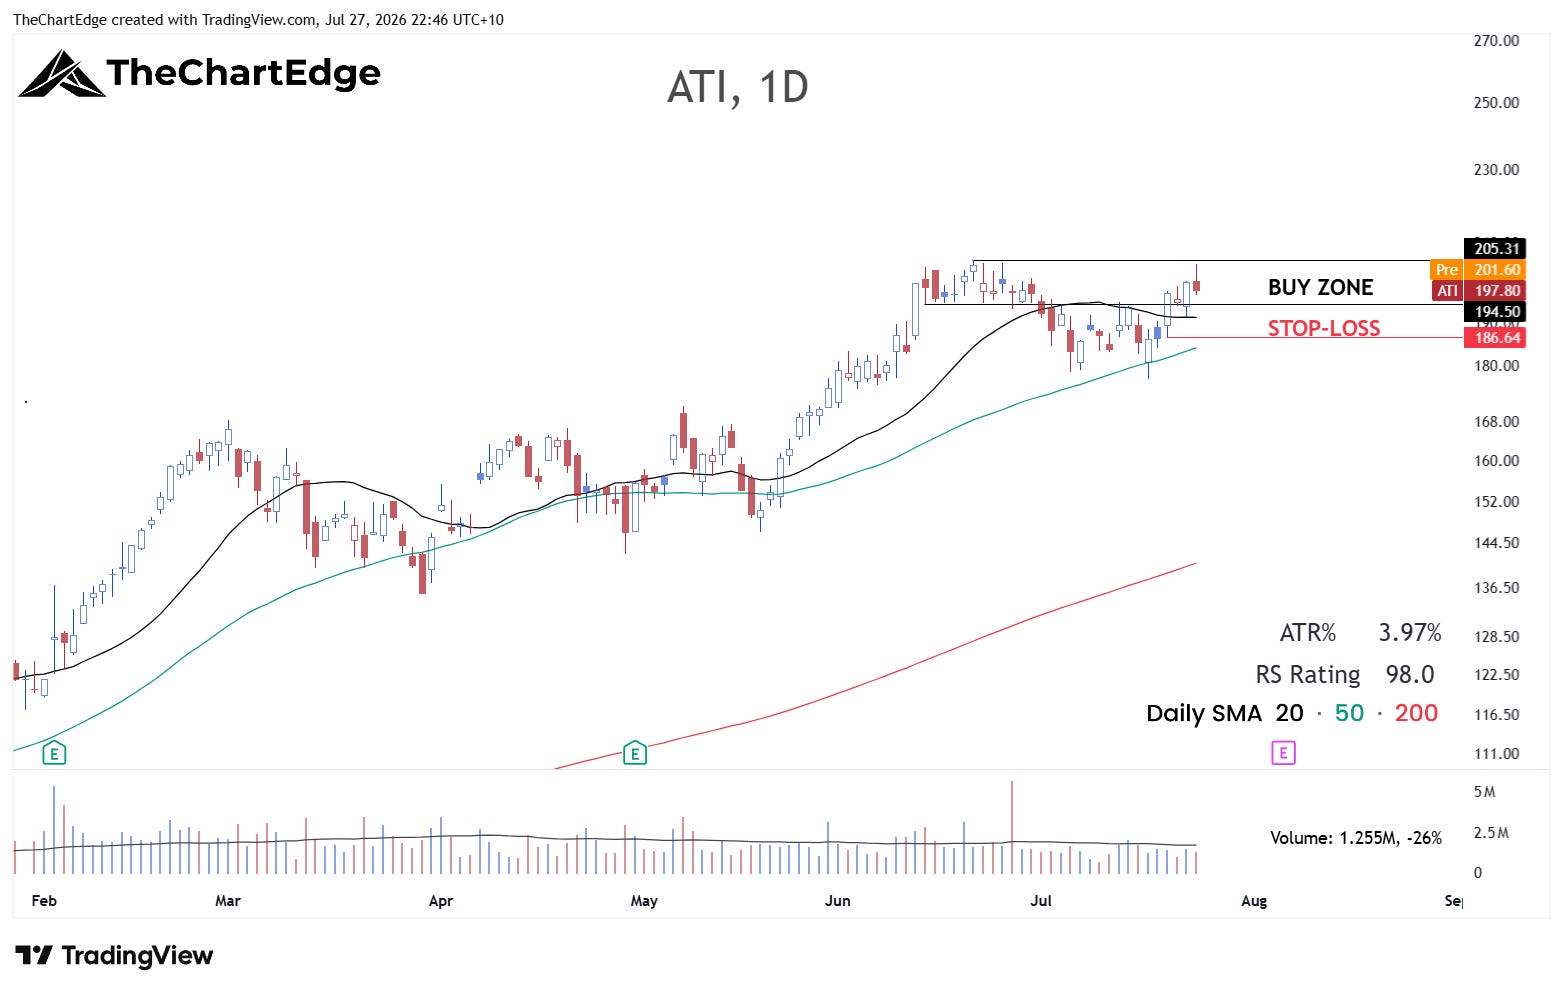
These all come from the same universe as the Industry Breadth board. That is stocks from the Russell 1000 and Nasdaq 100 that have outperformed the Nasdaq 100 over the prior twelve months. I went through the charts and picked out names showing relative strength, still close to all-time highs (HPE and TIGO aside) and potentially in a position to buy this week; so in an uptrend, above their 50-day SMA and preferably 20-day SMA, but not extended from it. Honestly, there weren’t a lot of names that met those criteria and had a chart I liked. And about half will report earnings within 9 trading days, so practically they aren’t good entries because they’re unlikely to gain enough in that time to have enough cushion to hold through earnings. Also, other than HPE they are all lower ATR% names, in the 2-4% range. This isn’t necessarily bad depending on your trading style and risk tolerance, but I generally prefer names with some juice. It also is a sign of current market conditions that the higher-ATR fast movers are mostly absent from my watchlist.
I have tried to be as specific as I can to show you how I consider potential entry levels. But I started writing this and annotating the charts over the weekend in Australia and will post it now as the US market opens on Monday. So, I need to be fluid, especially given the fast news cycle regarding Middle East hostilities. But it helps me to write out my analysis and ponder over the charts, and gives me a record of my thinking over time. This is not an easy market to swing trade, with few stocks trending smoothly above their moving averages, so I am being cautious and flexible, and will continue to be so until the market and individual names start trending smoothly again.
HPE Chart
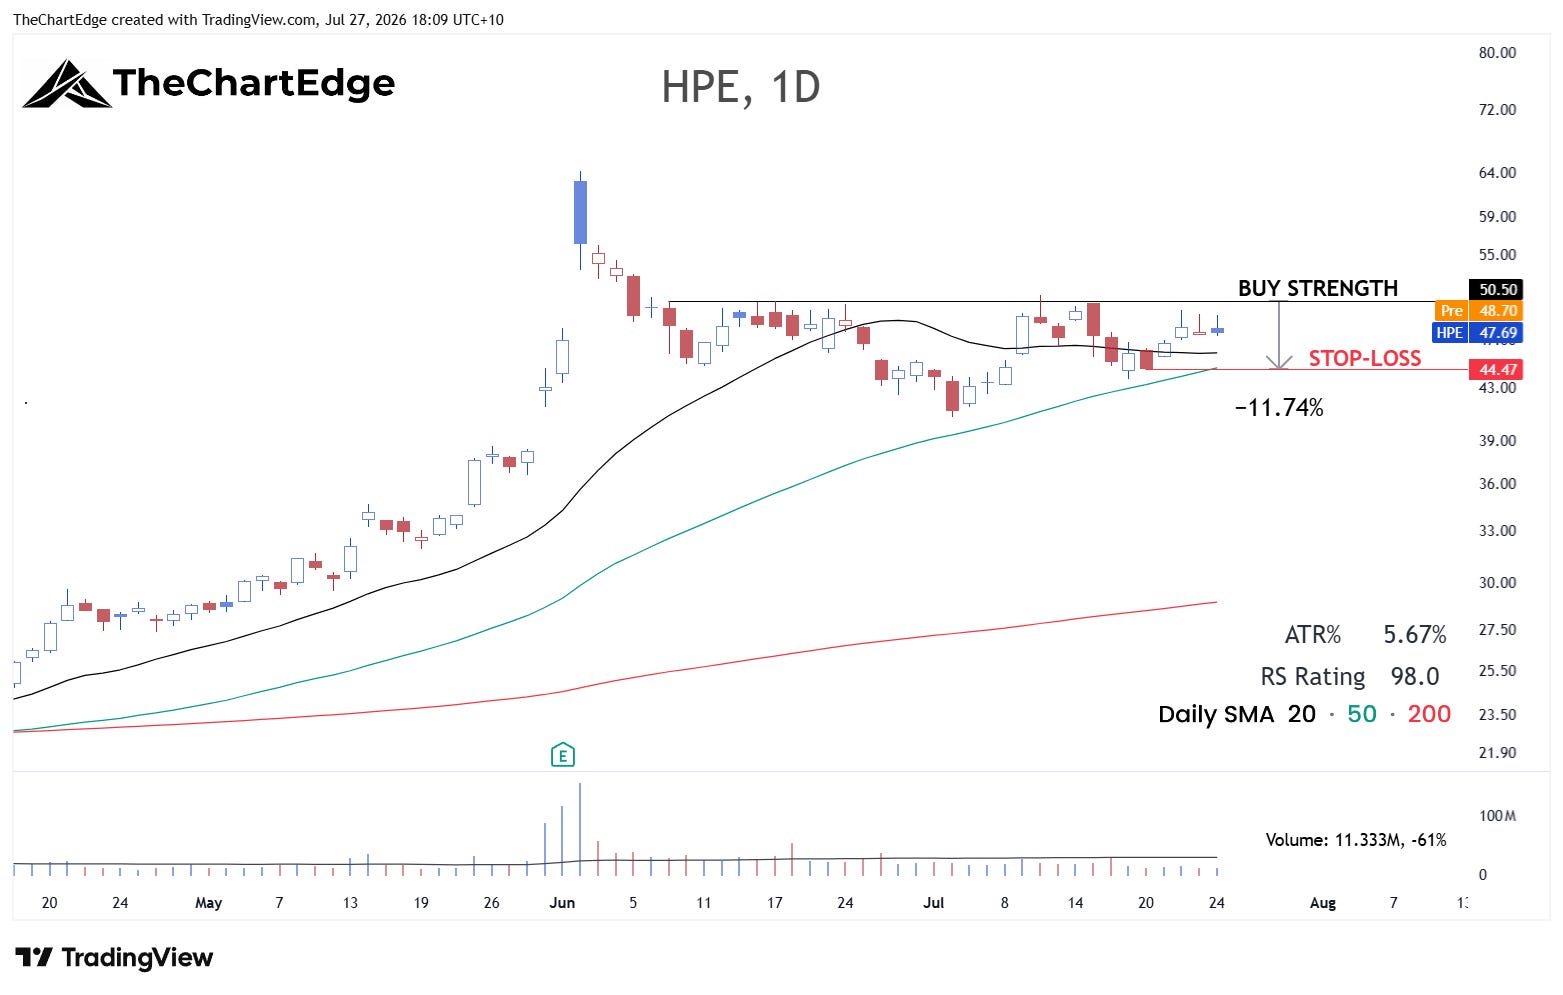
BNY Chart
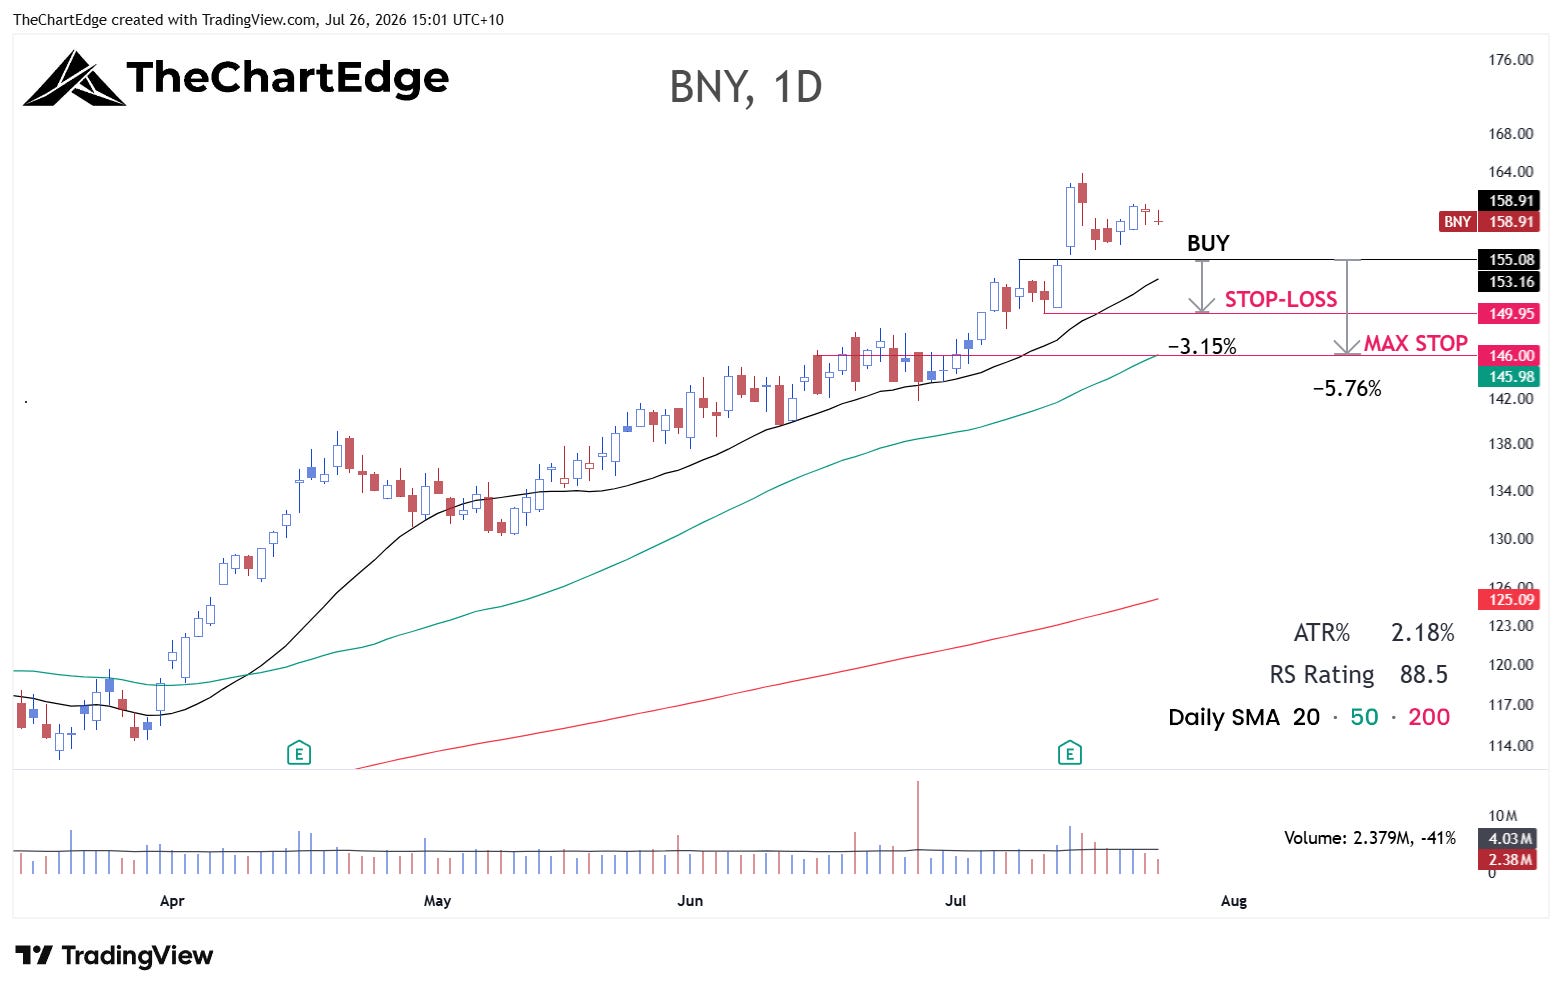
JBHT Chart
VIK Chart
RPRX Chart (reports August 5)
TRGP Chart (reports August 6)
TIGO Chart (reports August 6)
ATI Chart (reports August 6)
The Week Ahead
The Market Temperature is in Cautious and SPY and QQQ consolidating their big April/May gains, which is normal behaviour. However, for short/medium term swing trading - at least the way I trade - conditions are not favourable. So for me, that means less is more and I’m more focused on capital preservation right now. I didn’t put on any new swing trades last week. I may do this week, but if they get stopped out quickly, that’s valuable feedback telling me the time is still not right to get aggressive.
I have laid out some levels I’ll be watching this week. One or two data points alone won’t change my bias - which is neutral now. But if they all go one way and the future Market Temperature confirms what price is telling me, I can act with confidence within my process. To recap the markets and levels - SMH, specifically 536 and 592. QQQ holding its AVWAP from the March 30 low. TLT May 19 low of 82.77 and the US dollar Index levels 100 and 101.50.
Credit spreads and the MOVE Index show no stress yet. But in my model, both use multi-week lookbacks and I only calculate the Market Temperature once a week, so I’ll be monitoring those in real time as well.
Stay open-minded and manage risk carefully.
Cheers,
Marcus Grant, CFTe
Disclaimer: The content provided in this newsletter is for informational and educational purposes only and should not be considered as financial, investment, or legal advice. The information shared is based on our research and analysis, but we are not a licensed financial advisor, nor can we guarantee its accuracy, completeness, or timeliness. Market conditions and financial instruments can change rapidly, and any opinions expressed may not be suitable for all investors. Any opinions expressed and or securities mentioned do not constitute a recommendation to buy, sell, or hold that or any other security. You should conduct your own due diligence and consult with a licensed financial advisor or other professional before making any investment decisions. Past performance is not indicative of future results, and all investments carry the risk of loss. The authors and publishers of this newsletter are not responsible for any financial decisions made based on the content provided herein. By reading and or subscribing to this newsletter, you acknowledge and agree that you are using the information at your own risk.