


Everything below is as of Friday November 13 close.
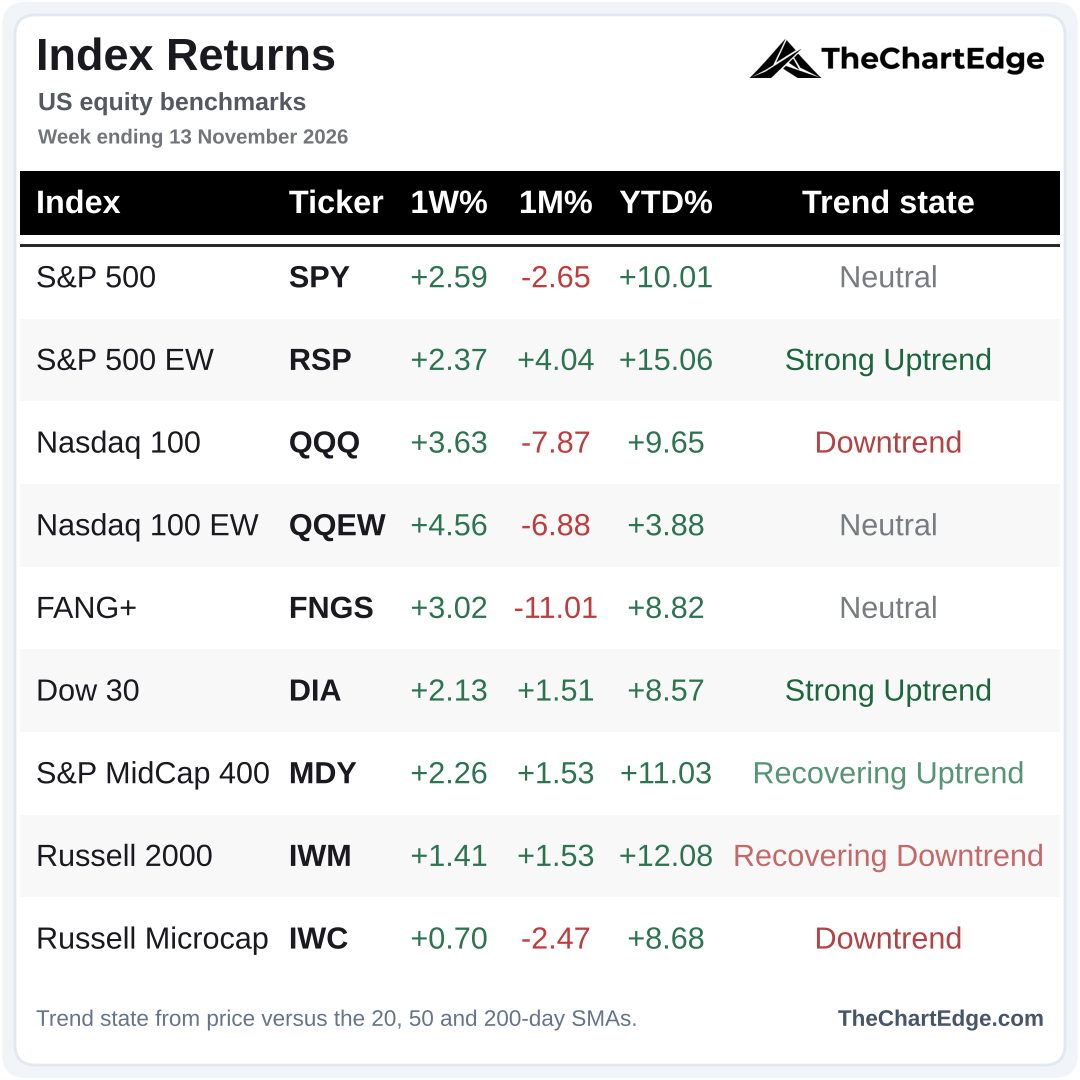
All 9 major indices I track finished the week higher, along with all 11 sectors. 85 of the 121 ETFs were up on the week, nearly double last weekend’s 43.
S&P 500 (SPY) Chart
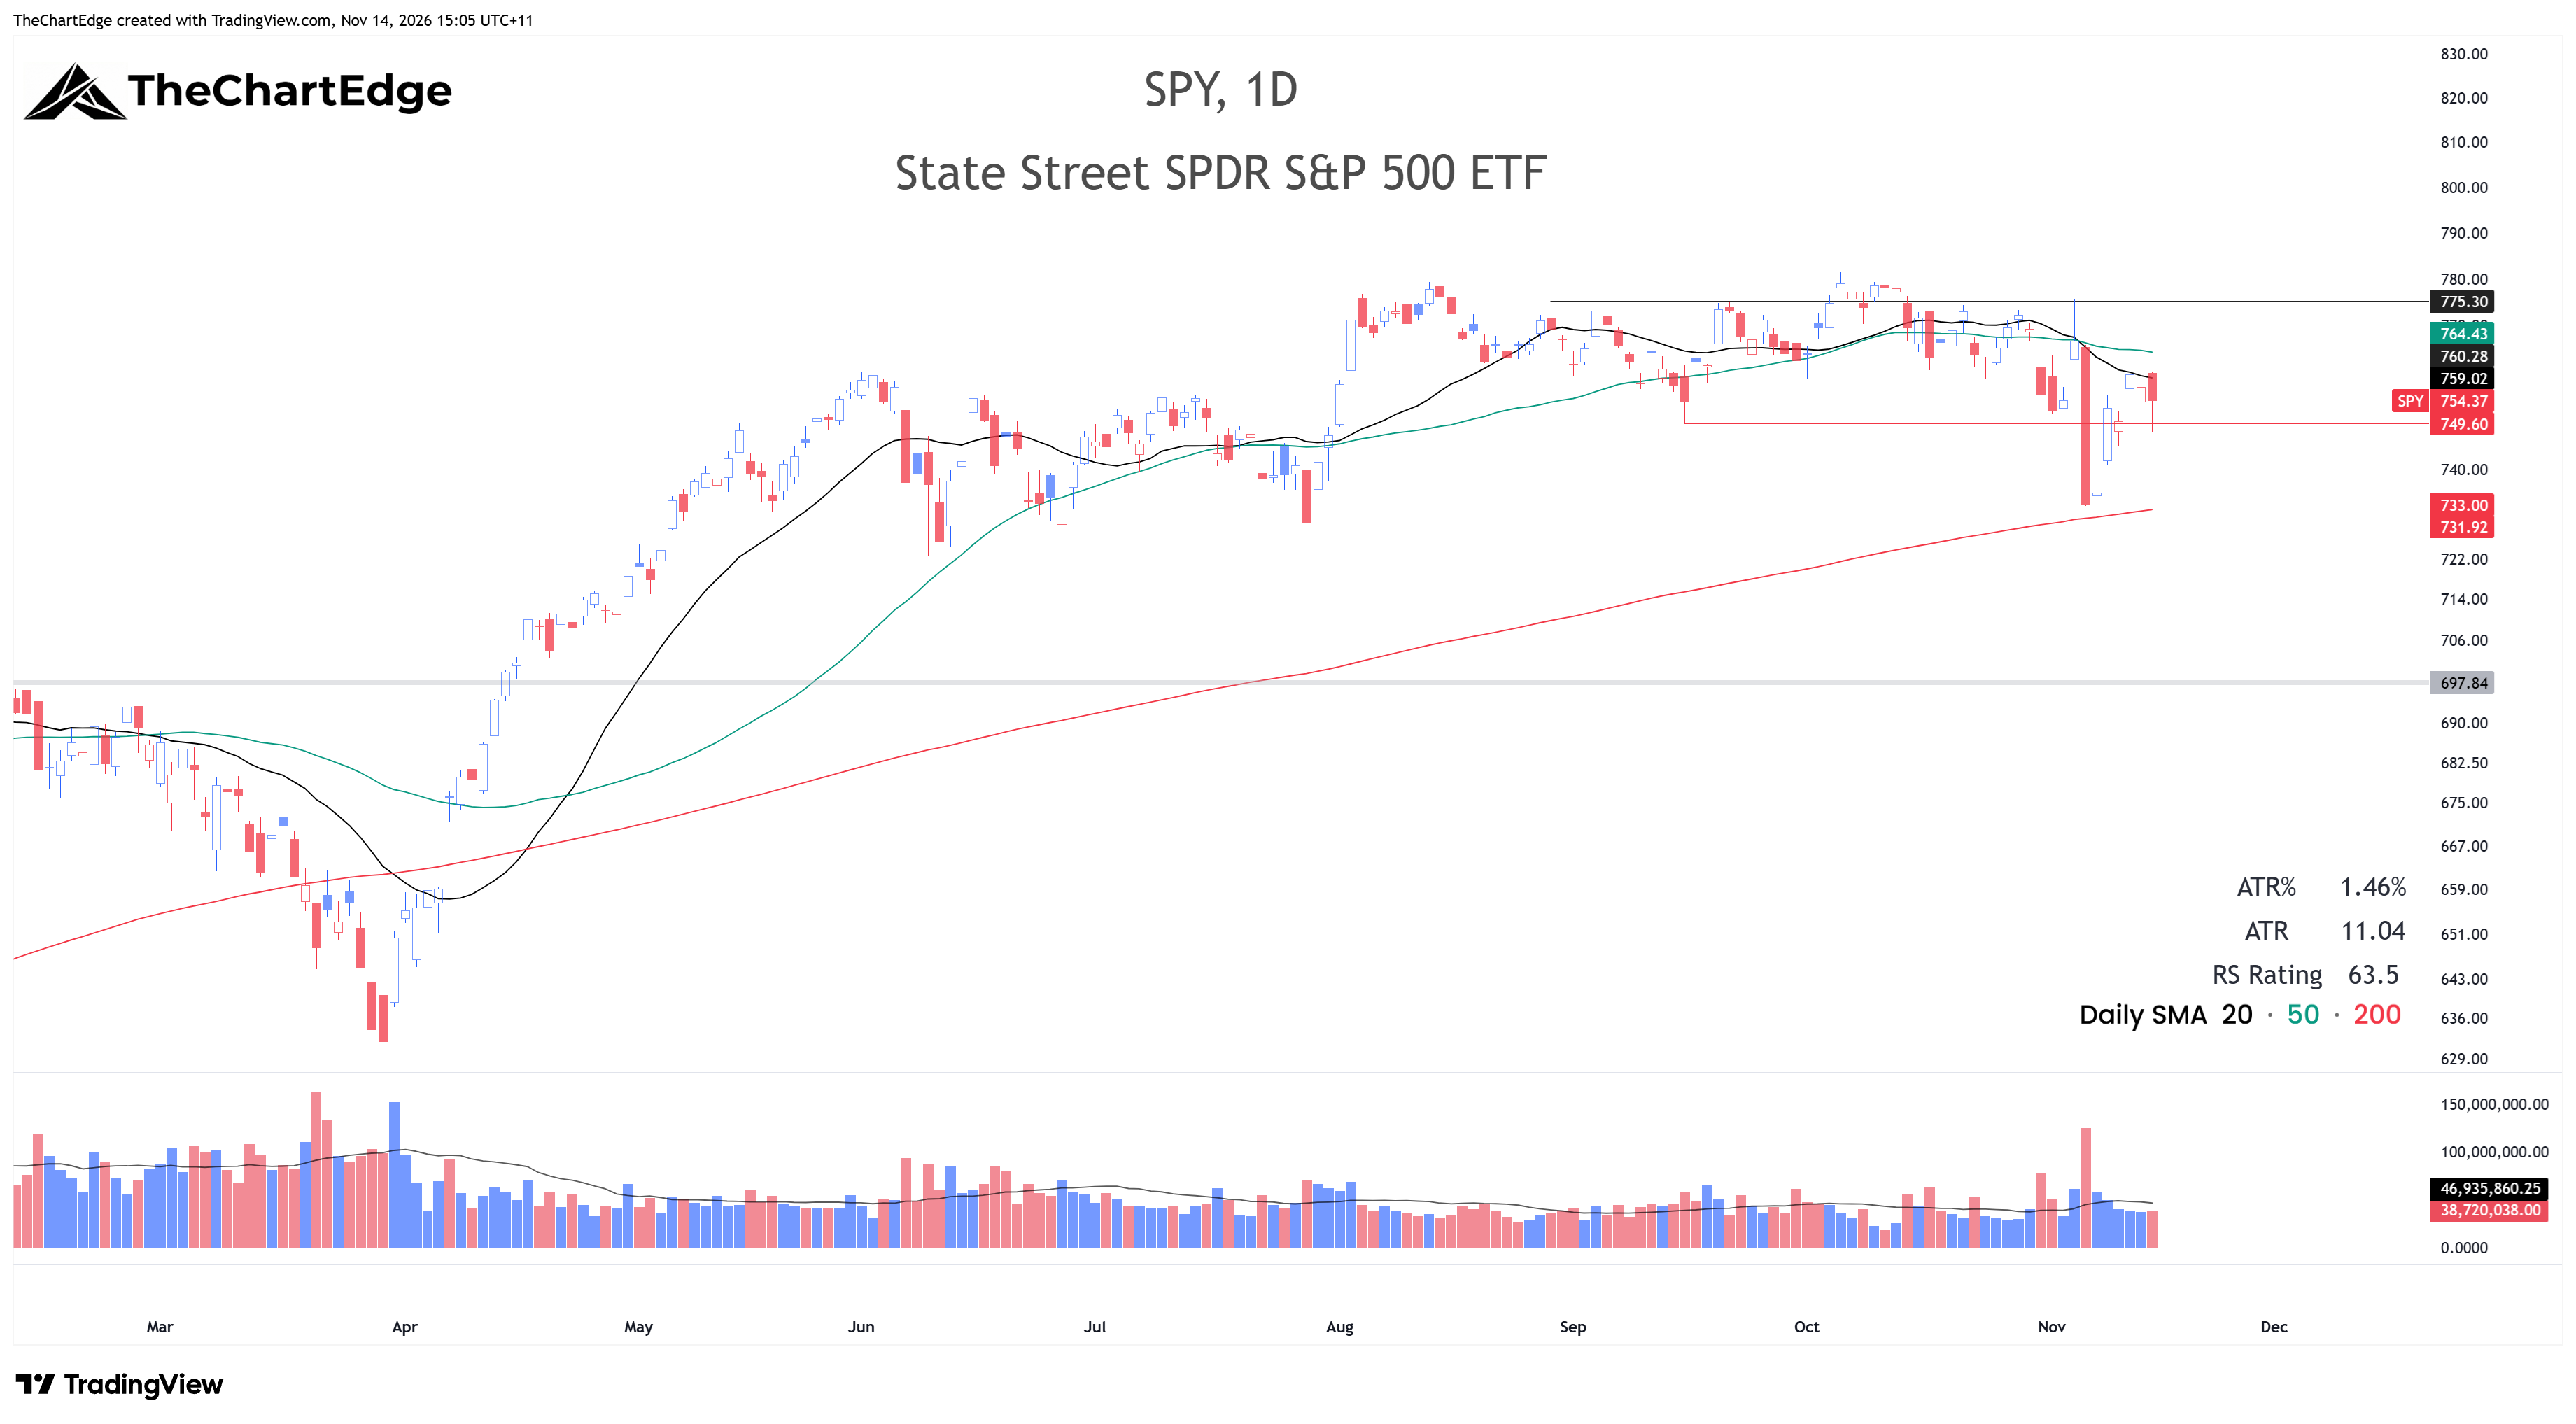
SPY closed at 754.37, still in the Neutral trend state. It bounced quite strongly on Monday and Wednesday but was unable to close above 760 and its 20-day SMA all week. On the upside, 760 remains an important level, as does the 50-day SMA above it, currently around 764. If the bulls are to regain control they need to get price above these levels. On the downside, Friday’s low around 748 and September’s low at 749.6 are levels the bulls would want to hold. Otherwise, Thursday November 5’s low, which lines up with the 200-day SMA around 732-733, could be retested.
Nasdaq 100 (QQQ) Chart
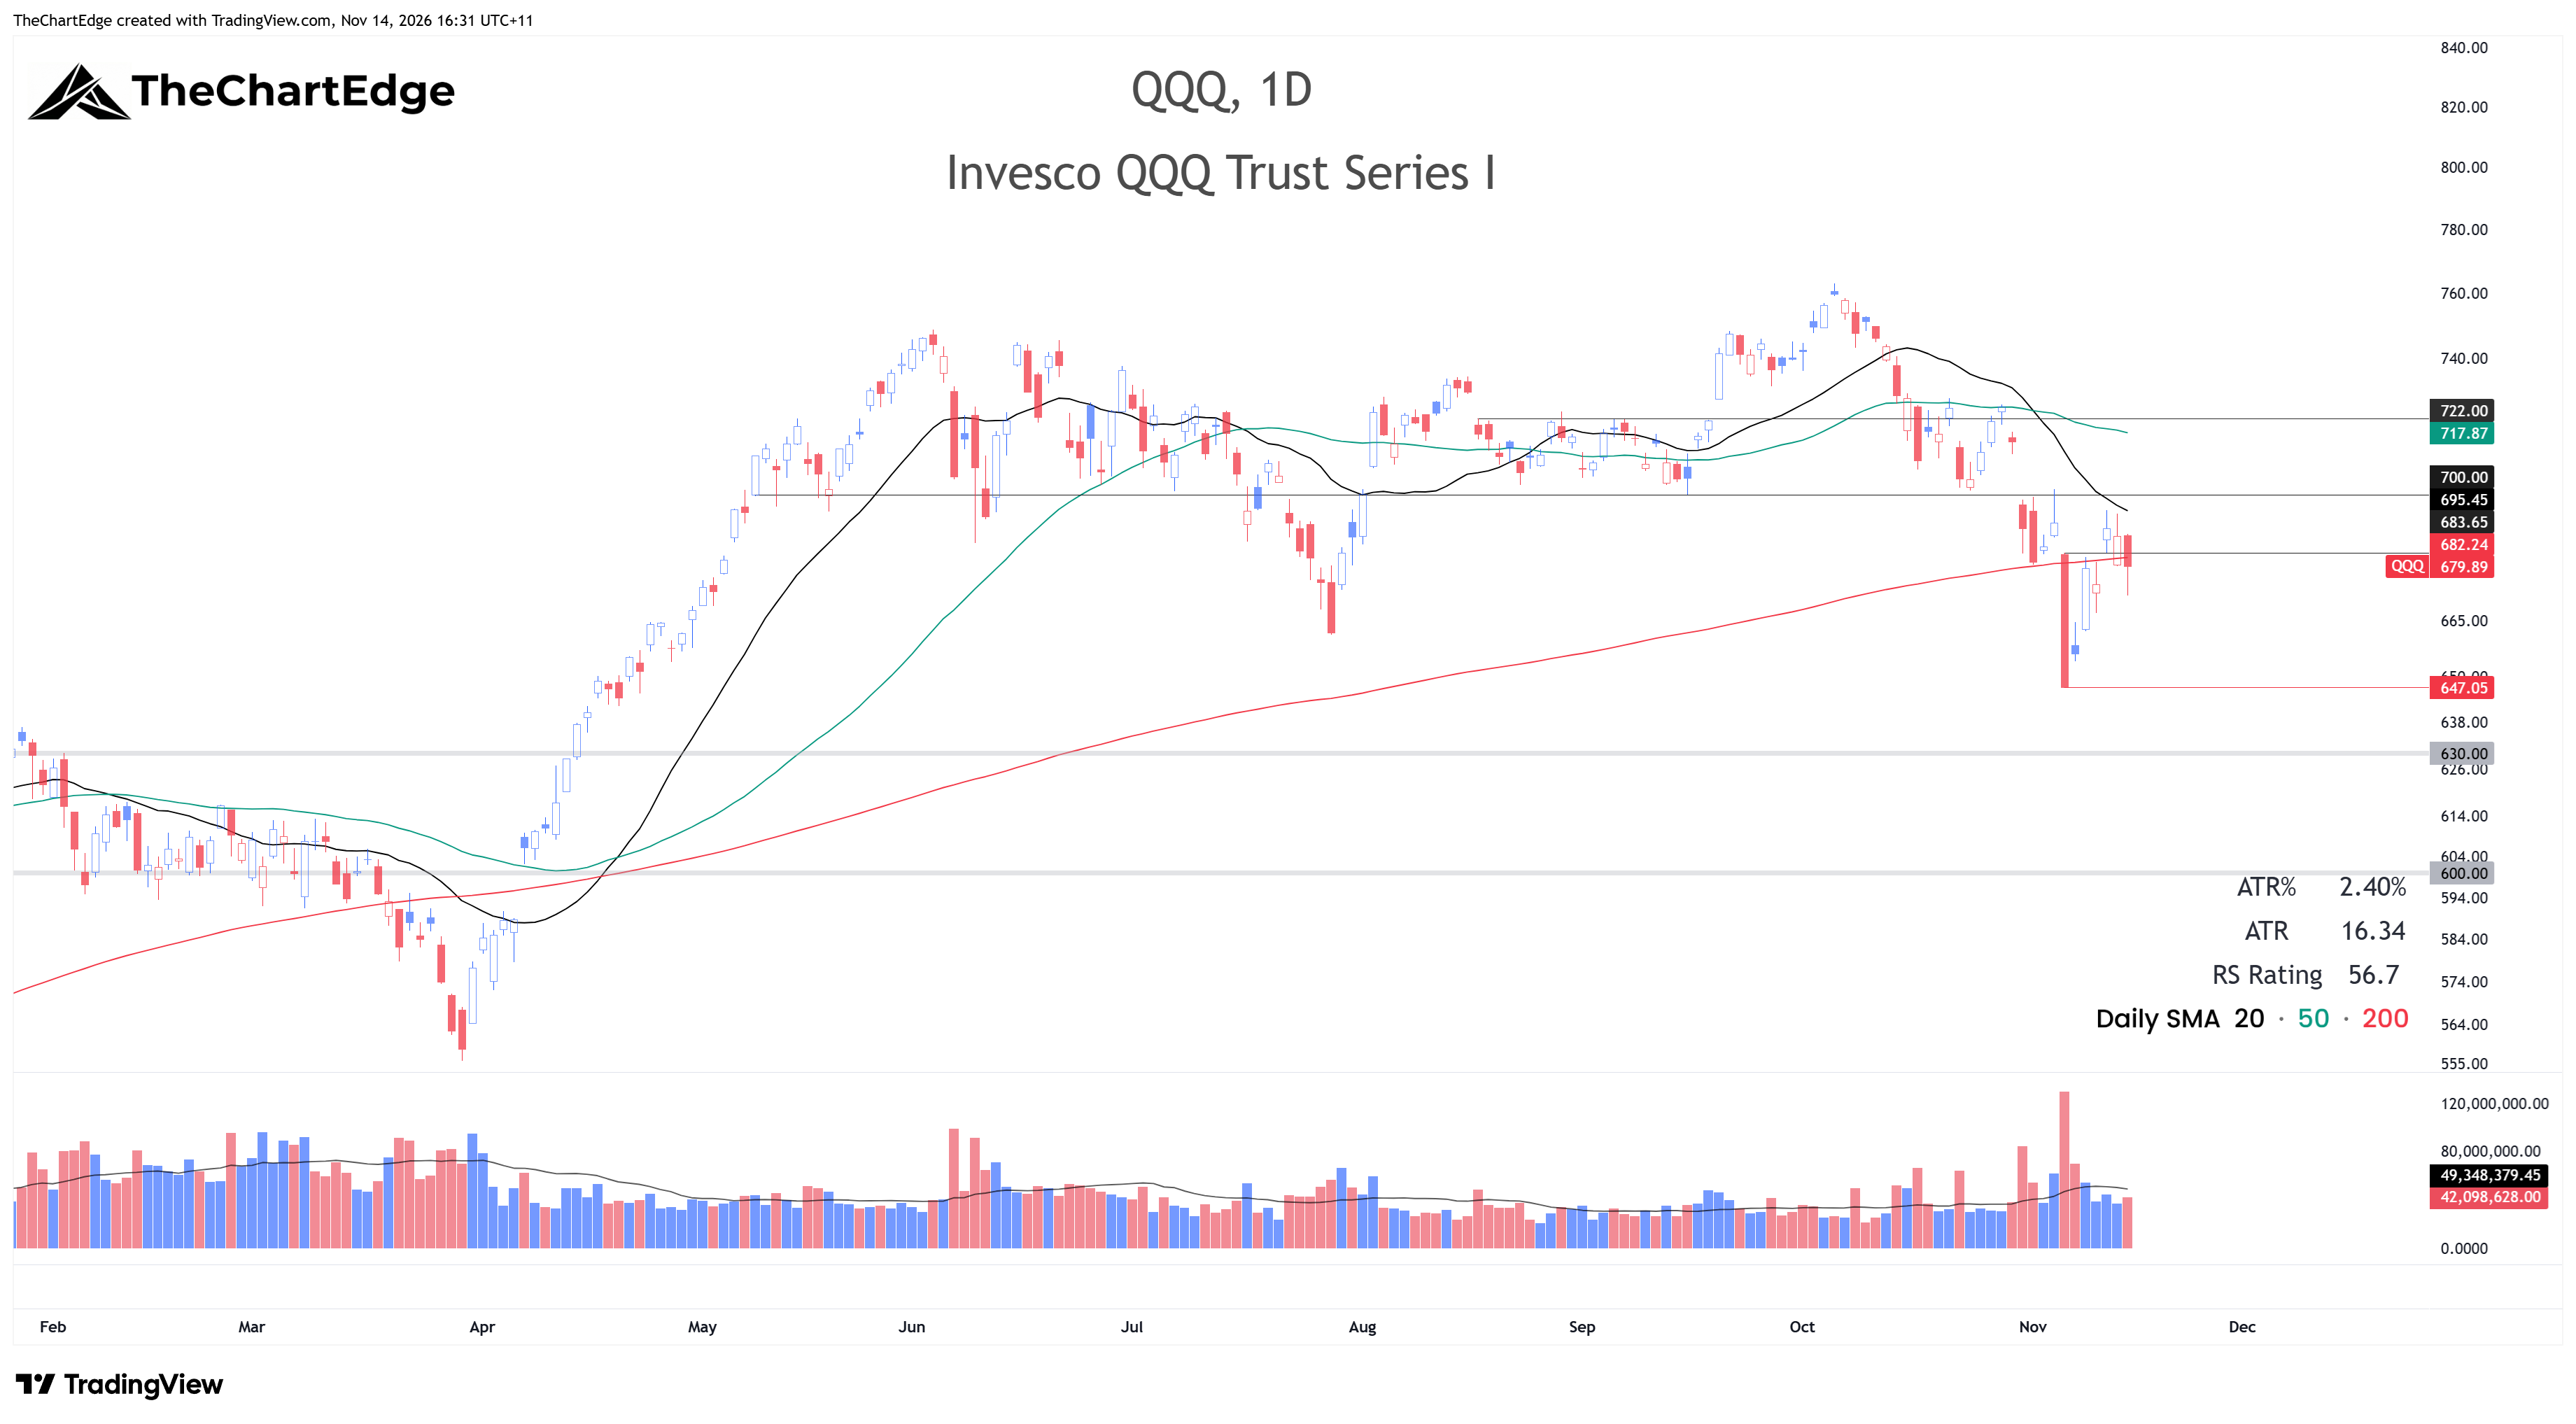
QQQ closed at 679.89, still in a Downtrend. The chart looks much worse than SPY. Despite having a big up day on Monday and another on Wednesday, it was unable to even touch 700 or the declining 20-day SMA. Thursday gapped down, then recovered to make another attempt intraday, but couldn’t get above Wednesday’s high. On Friday it opened pretty much flat but sold off, closing just under the 200-day SMA. On the upside, the 20-day SMA and 700 are the levels I’m watching, and on the downside Thursday November 5’s low of 647.05.
FANG+ (FNGS) Chart
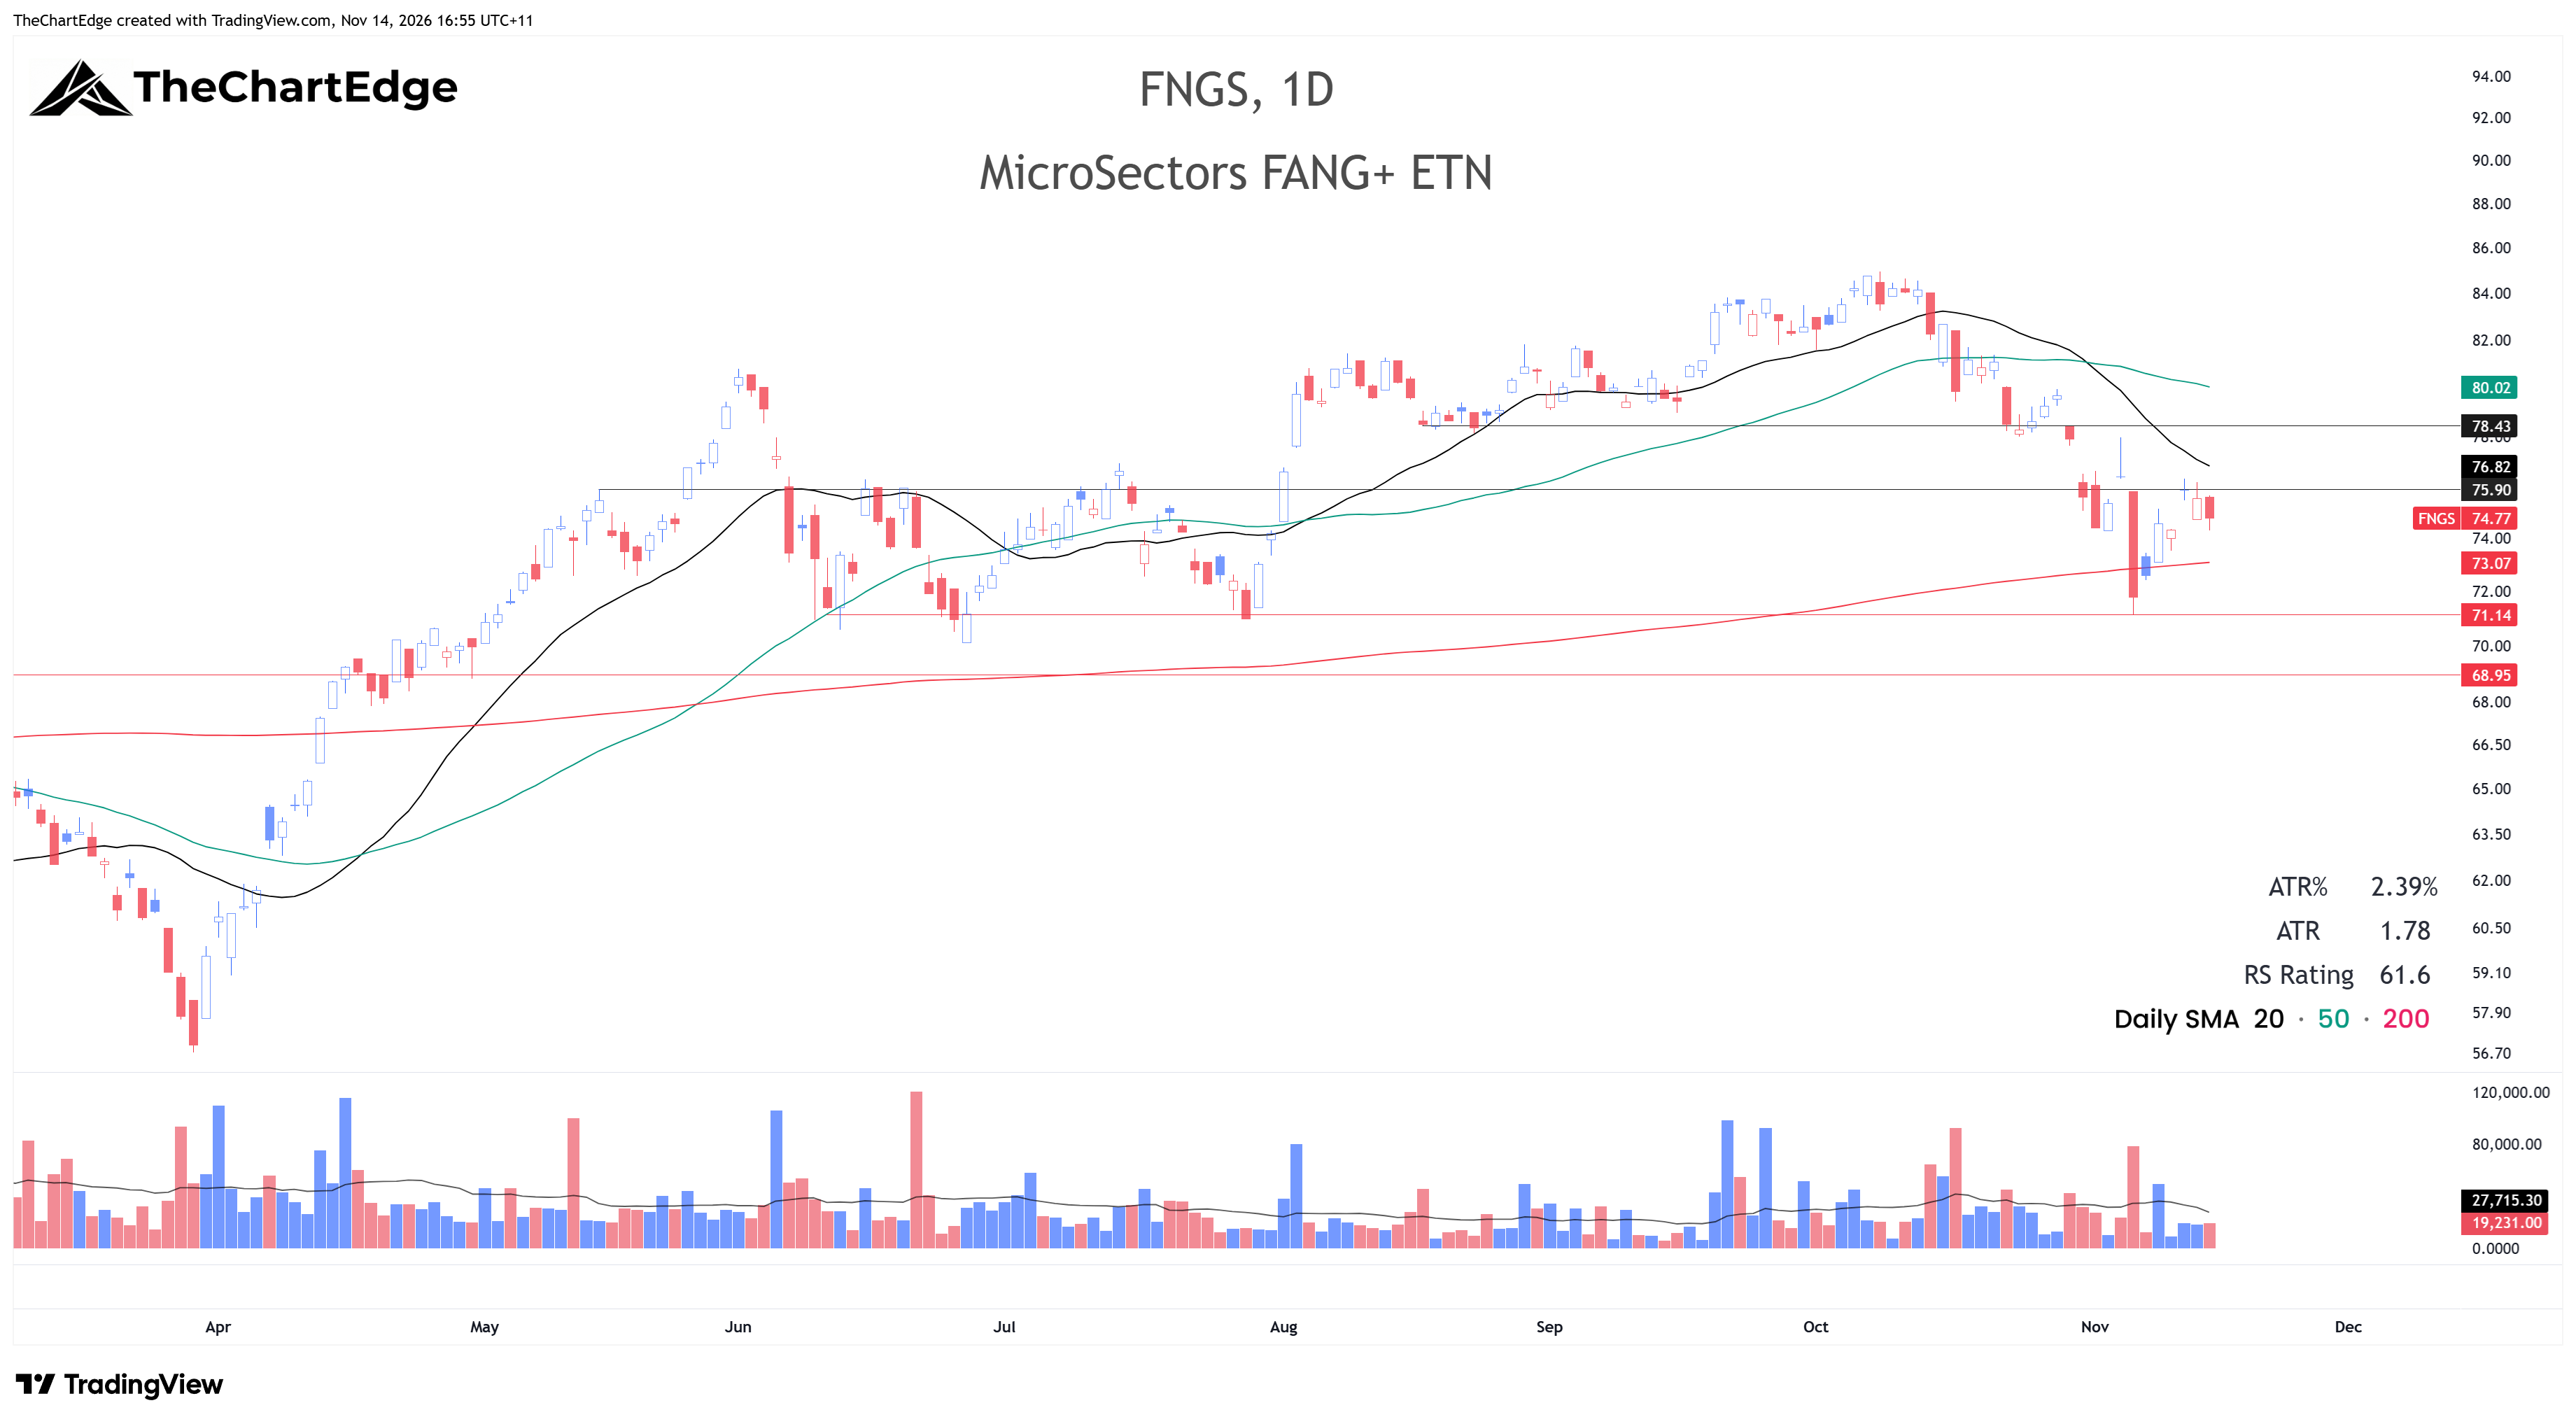
FNGS closed at 74.77, back in Neutral from a Downtrend. It looks better than QQQ, but not as good as SPY. It had a decent bounce on Monday and Wednesday but was unable to close above the 75.90 level and the 20-day SMA. These are the levels I’ll be watching on the upside. If it can break above these, 78.43 is the next level. On the downside, the 200-day SMA is currently around 73, with previous support around 71.
S&P 500 Equal Weight (RSP) Chart
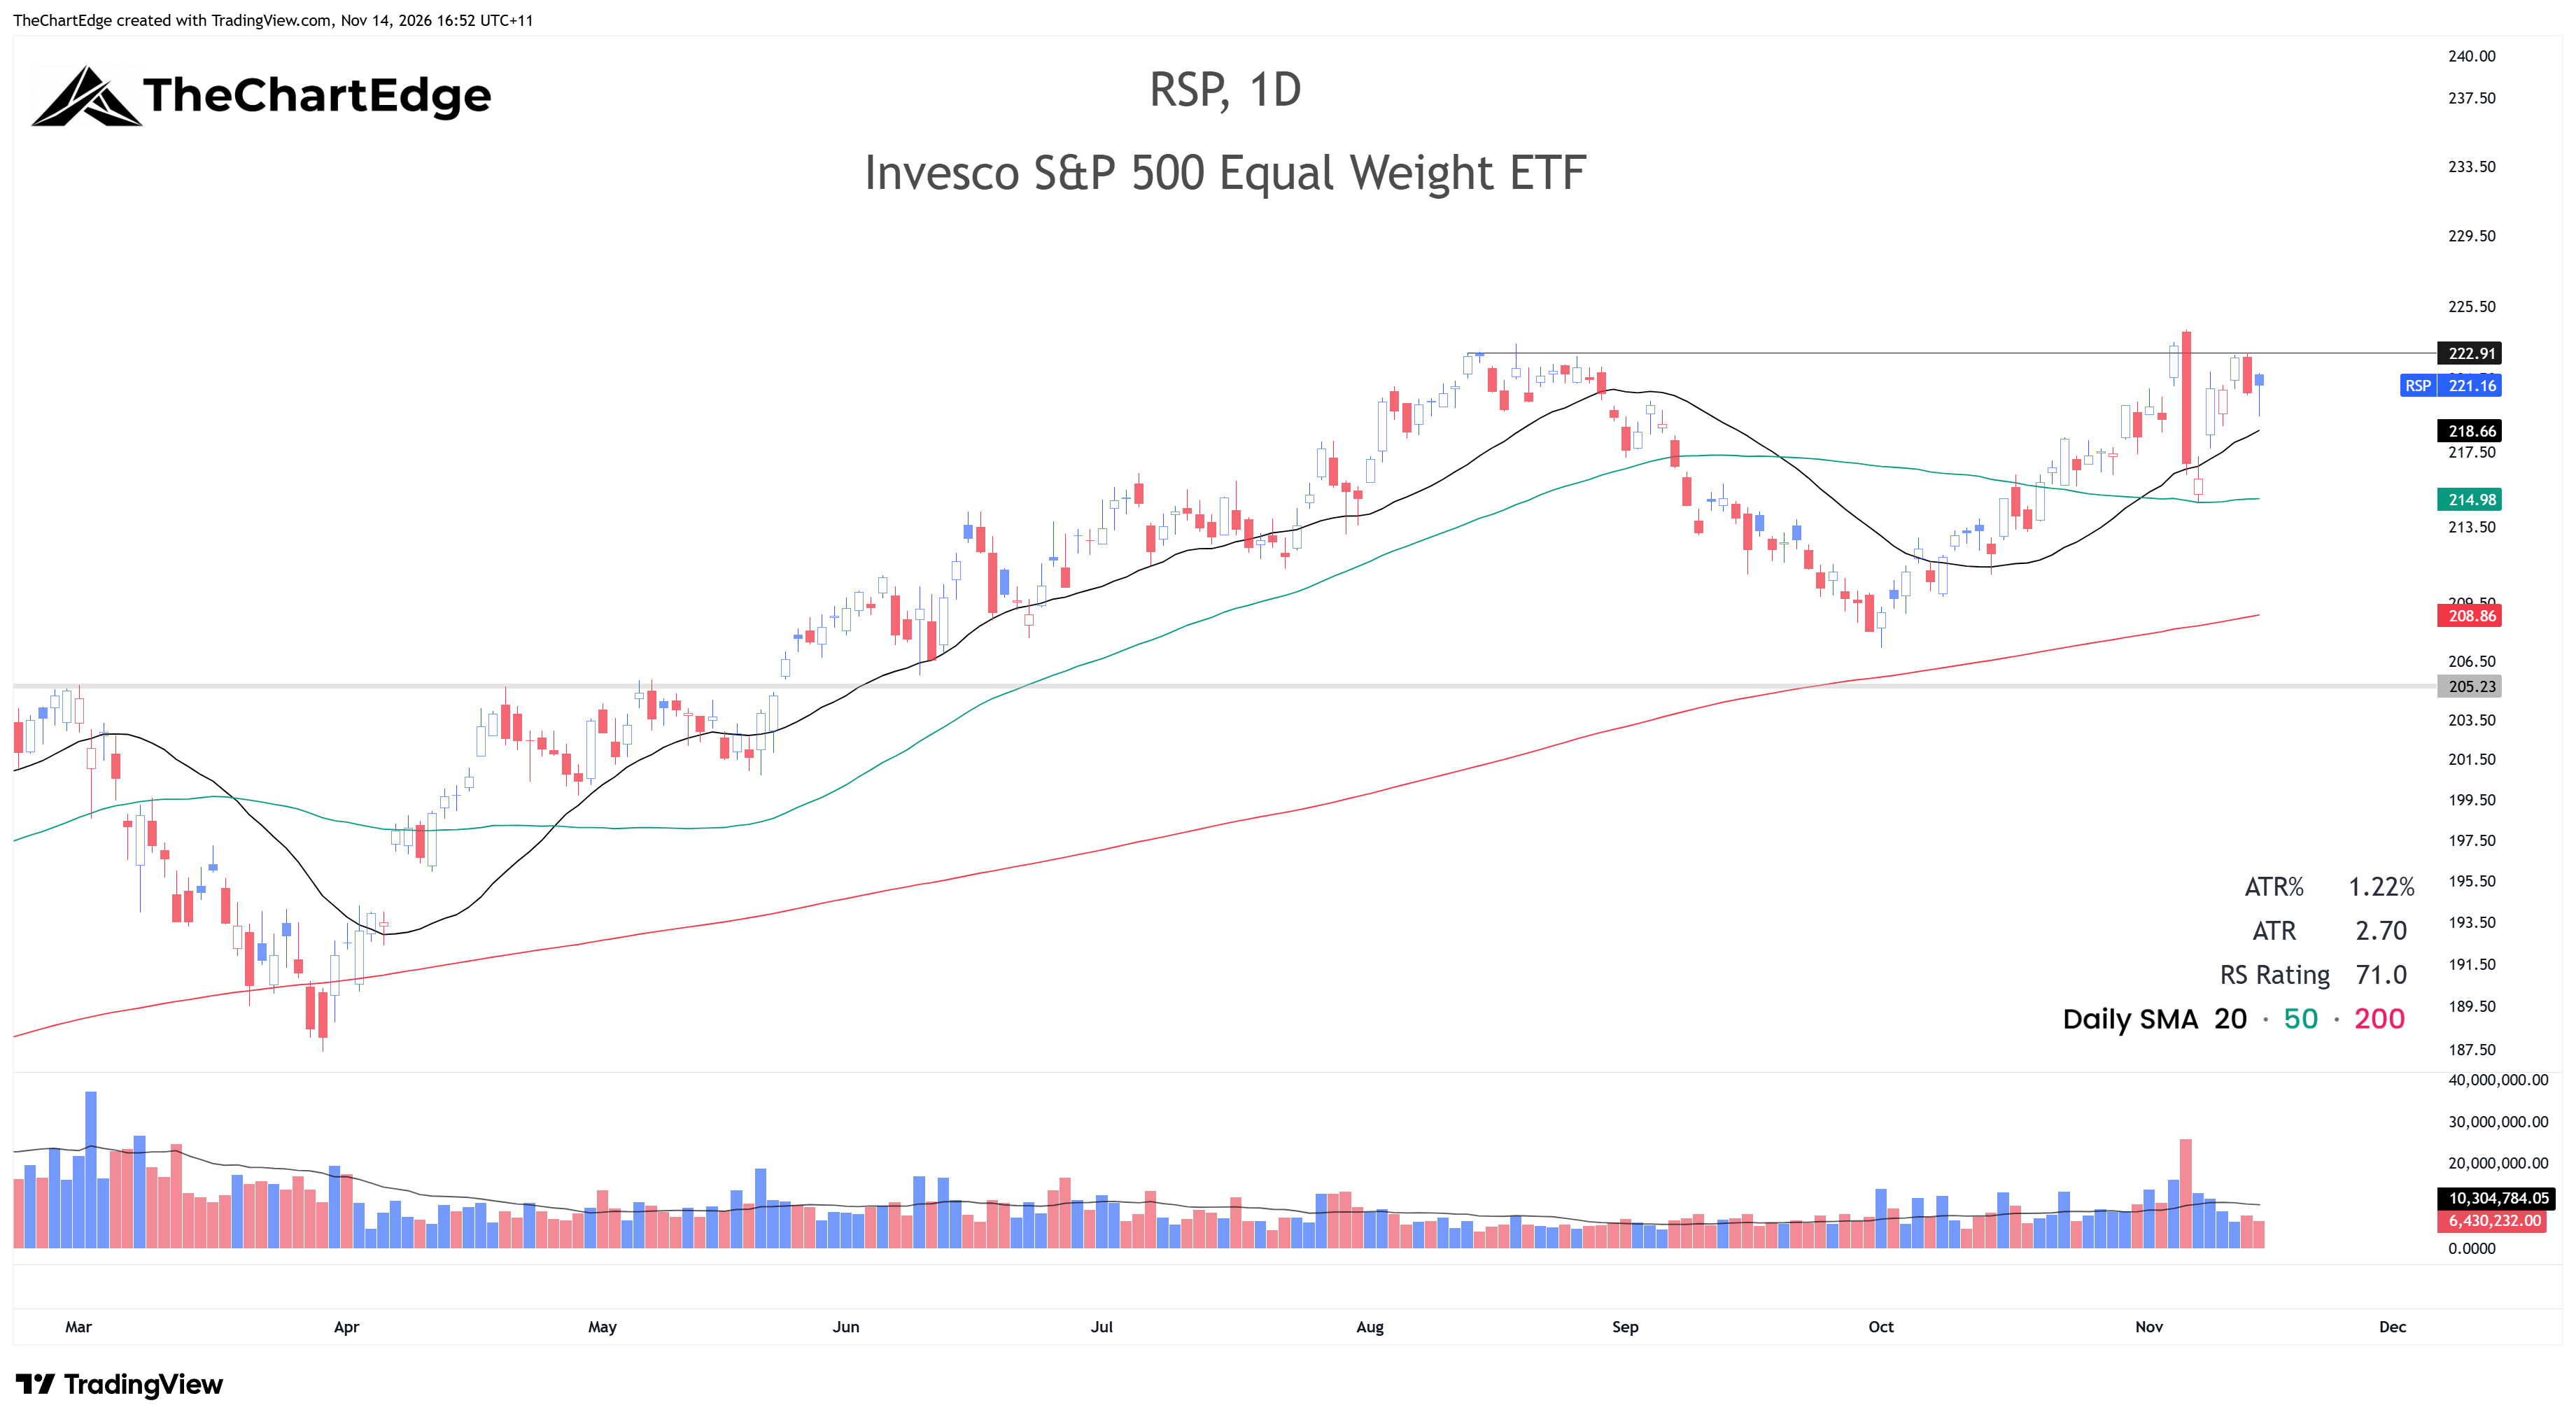
RSP closed at 221.16, moving up into a Strong Uptrend, as price reclaimed the 20-day SMA. It’s sitting just below the August and November highs around 223. It’s the best-looking chart of the indices. Even on Friday’s sell-off, it was able to reverse a lot of the damage by the end of the day. However, if the big cap-weighted indices are to recover, we will need participation from the mega caps and tech.
Market Temperature
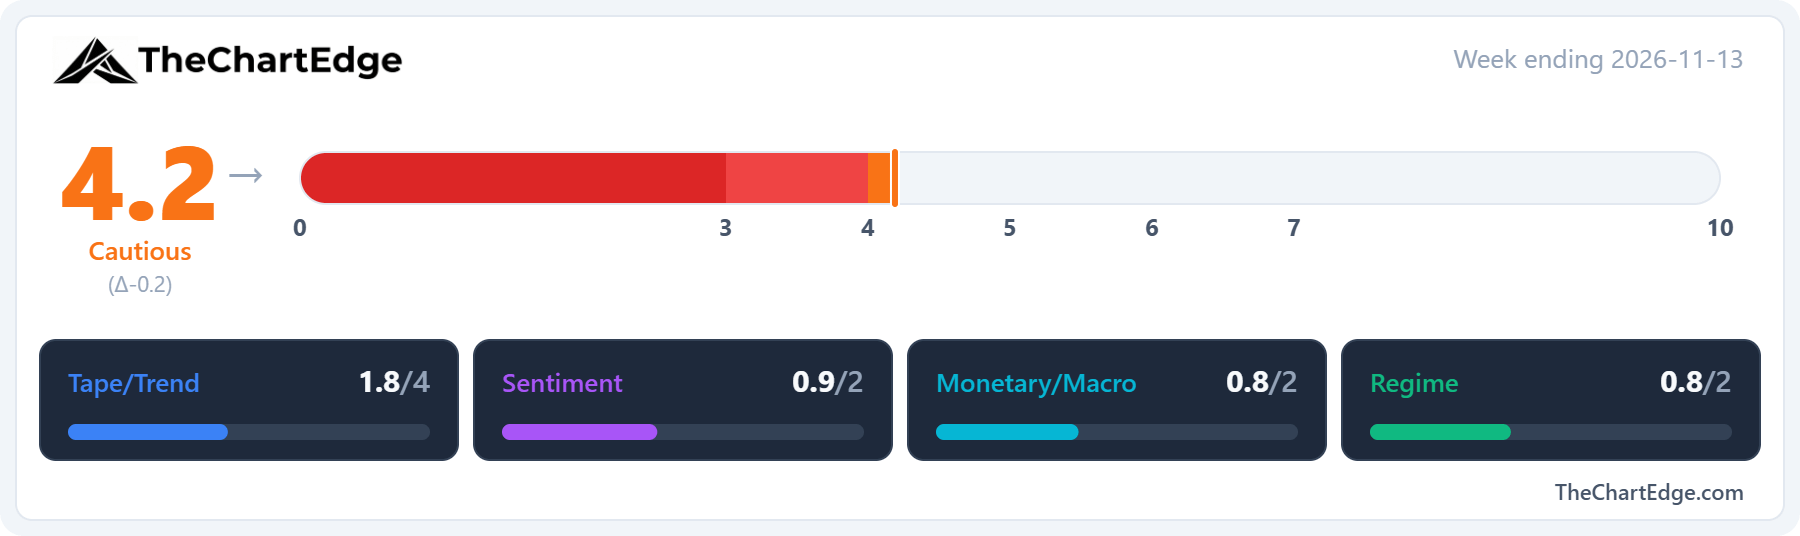
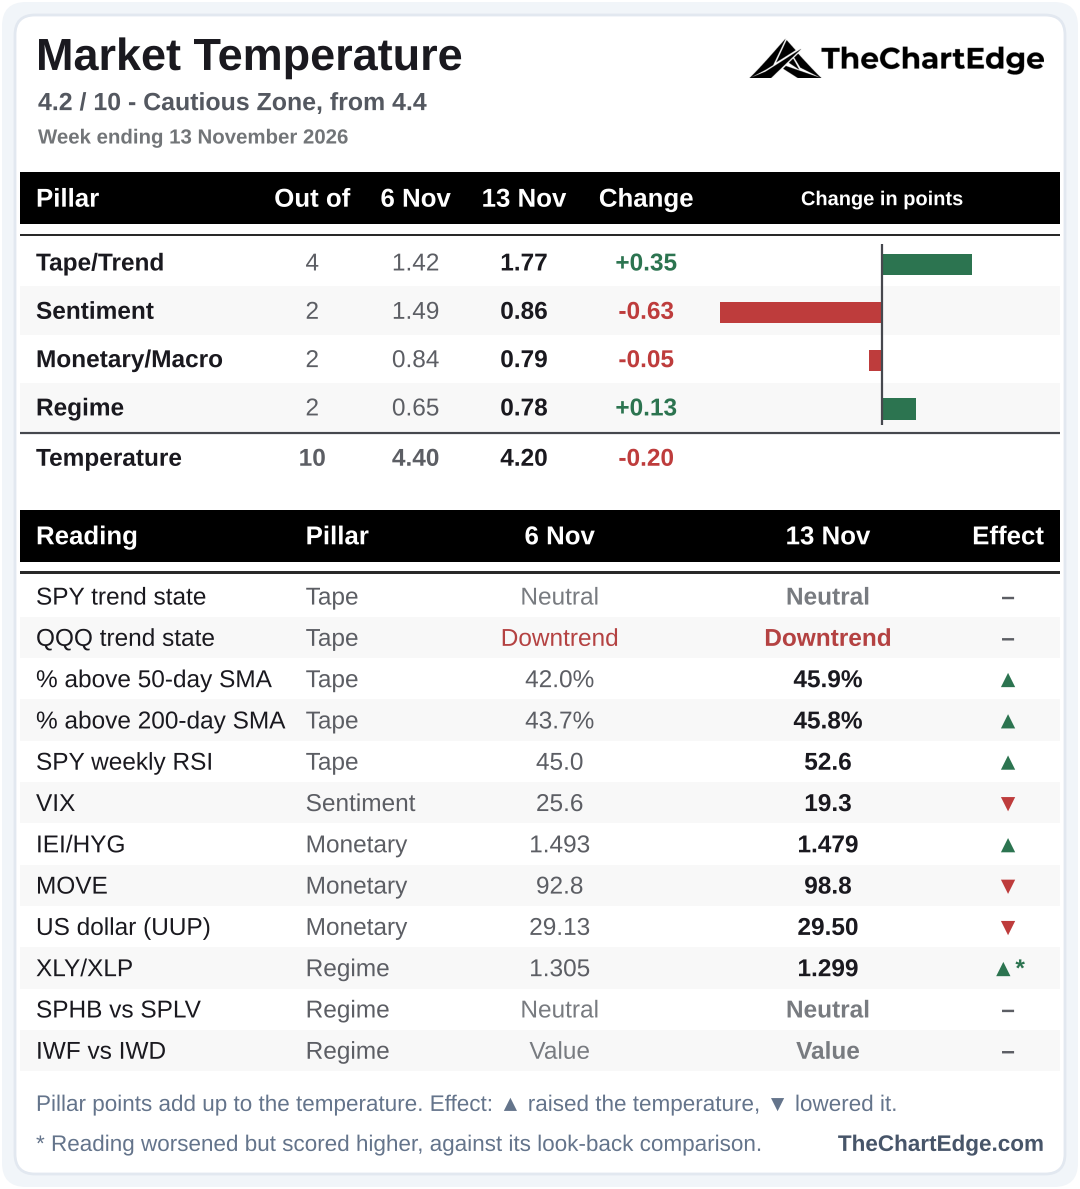
The Market Temperature came in at 4.2, down from 4.4, a 3rd week in the Cautious Zone.
It’s almost the mirror image of last week. The VIX fell back to 19.3 from 25.6, which the model reads as a contrarian negative, and the Sentiment pillar gave back almost exactly what it added last weekend. The Tape/Trend pillar recovered a little over half of last week’s fall, mostly from SPY’s weekly RSI rising back to 52.6.
GICS Sector Relative Strength
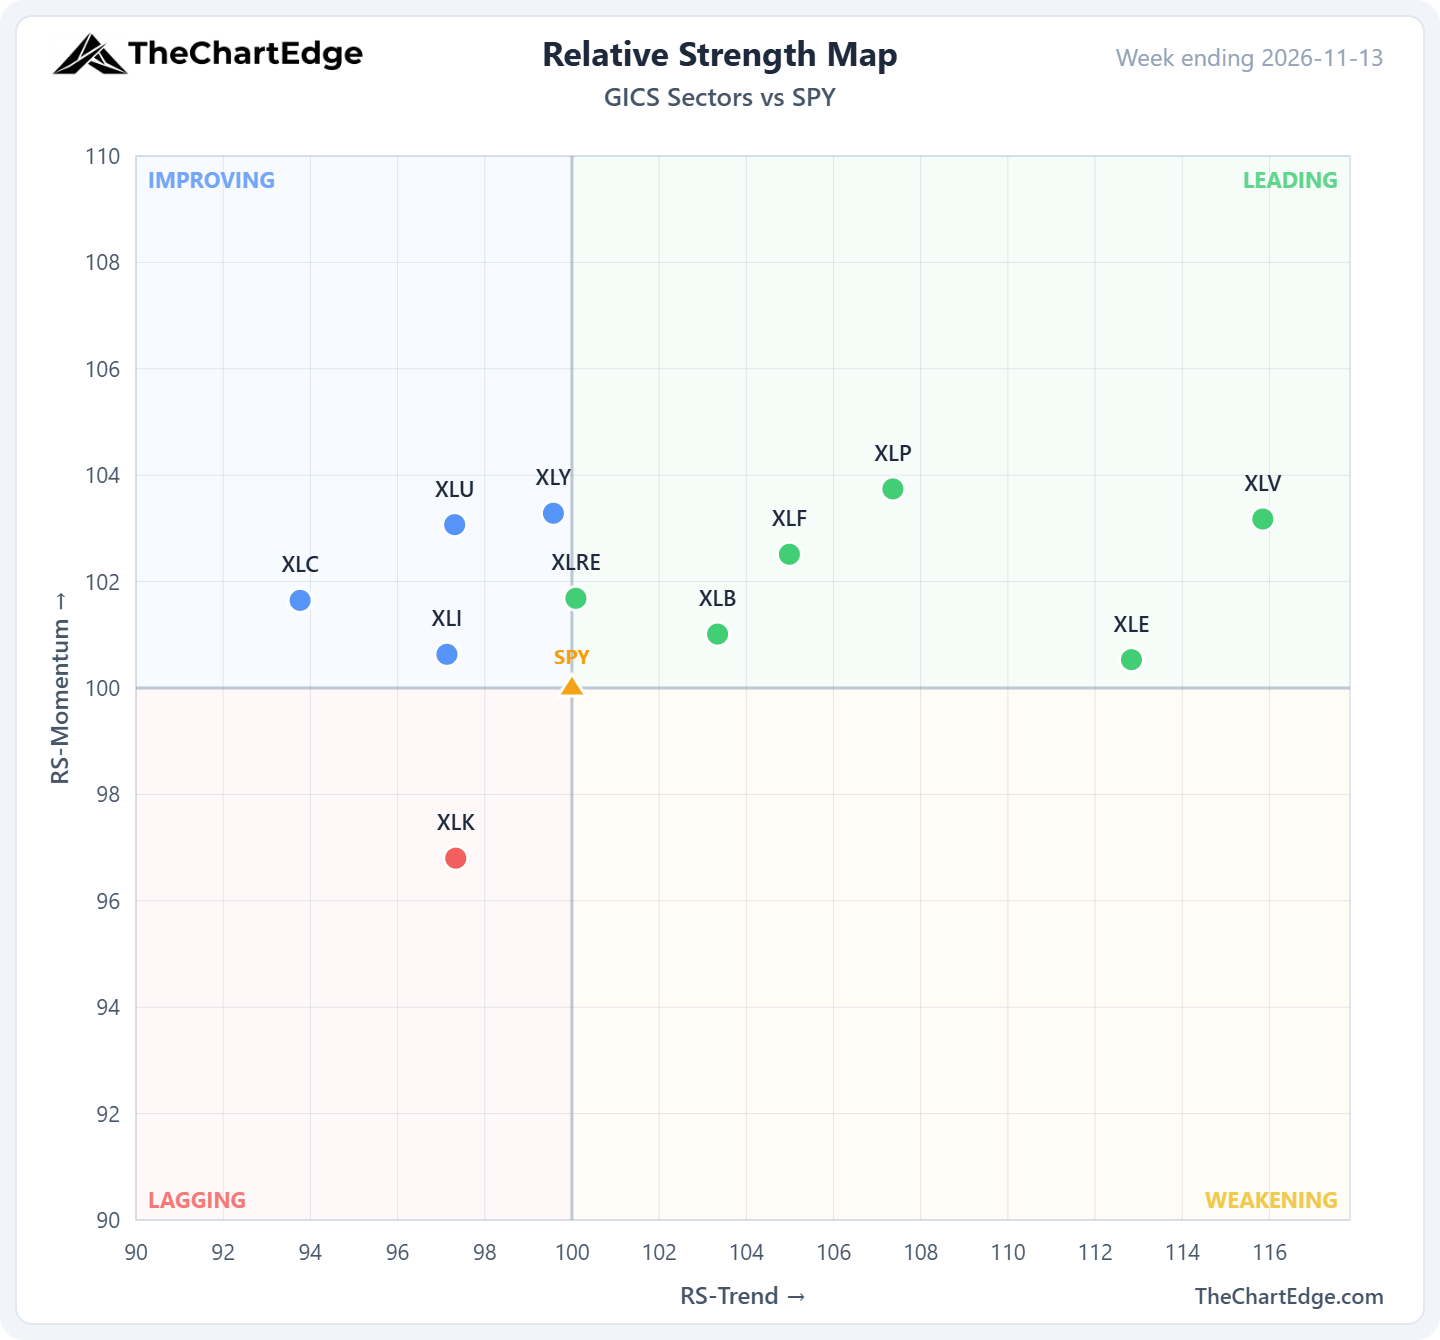
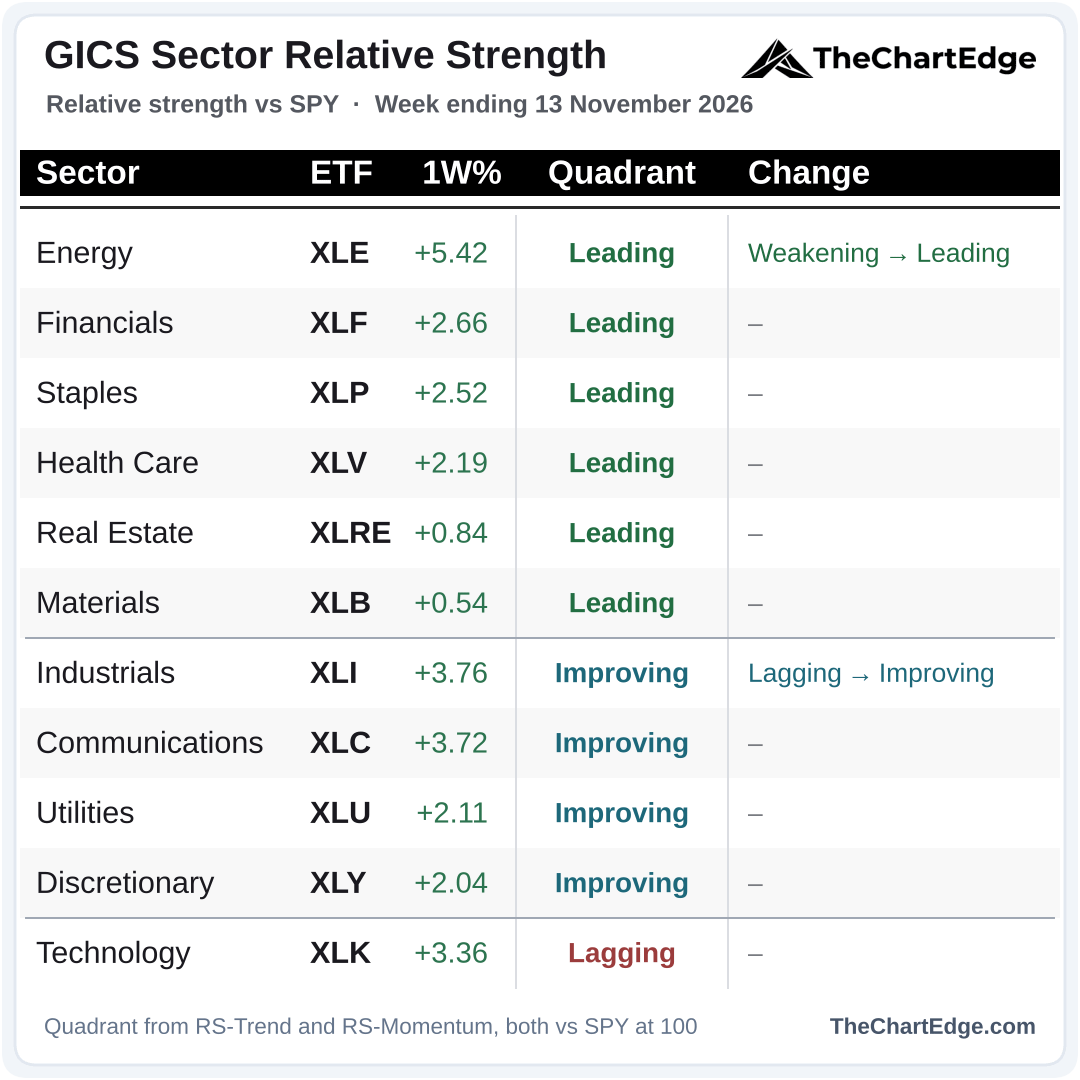
All 11 sectors finished higher, and 5 outperformed SPY - energy, industrials, communications, technology and financials. Energy led by a long way and moved from Weakening back into Leading. Industrials moved up from Lagging into Improving, leaving technology as the only sector in Lagging, and 6 of the 11 are now in Leading.
Momentum Leaderboard
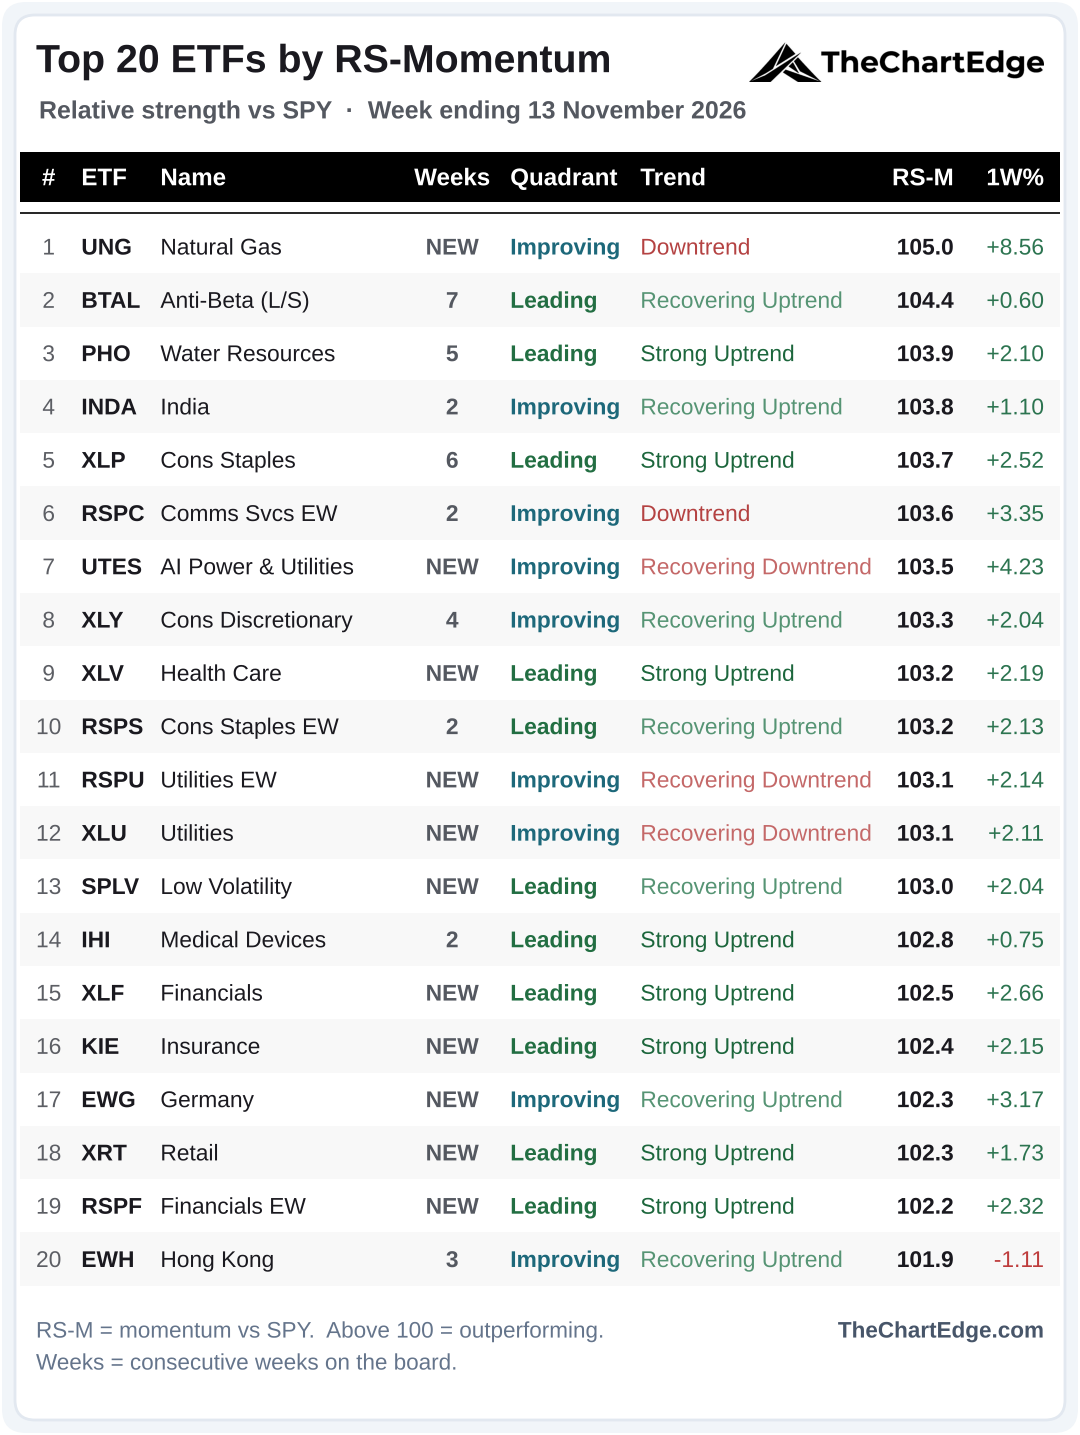
11 of the 20 are new, and it isn’t a risk-on board. Natural gas (UNG) takes number 1, although it’s in a Downtrend. The arrivals include 3 utilities names - XLU, equal-weight utilities (RSPU) and AI power & utilities (UTES) - plus health care (XLV), low volatility (SPLV), financials (XLF and RSPF), insurance (KIE), retail (XRT) and Germany (EWG).
The VIX (VIXY) drops off after 4 weeks, 2 of them at number 1, along with solar (TAN), China (KWEB and FXI), gold miners (GDX), home construction (ITB), Bitcoin (IBIT), Ethereum (ETHA), 20+ year Treasuries (TLT), equal-weight consumer discretionary (RSPD) and equal-weight real estate (RSPR).
Anti-Beta (BTAL) holds the longest streak at 7 weeks. 8 of the 20 are in Strong Uptrends, from 2 last weekend, and 5 are in downtrend states, from 7.
Trend States Across the Universe
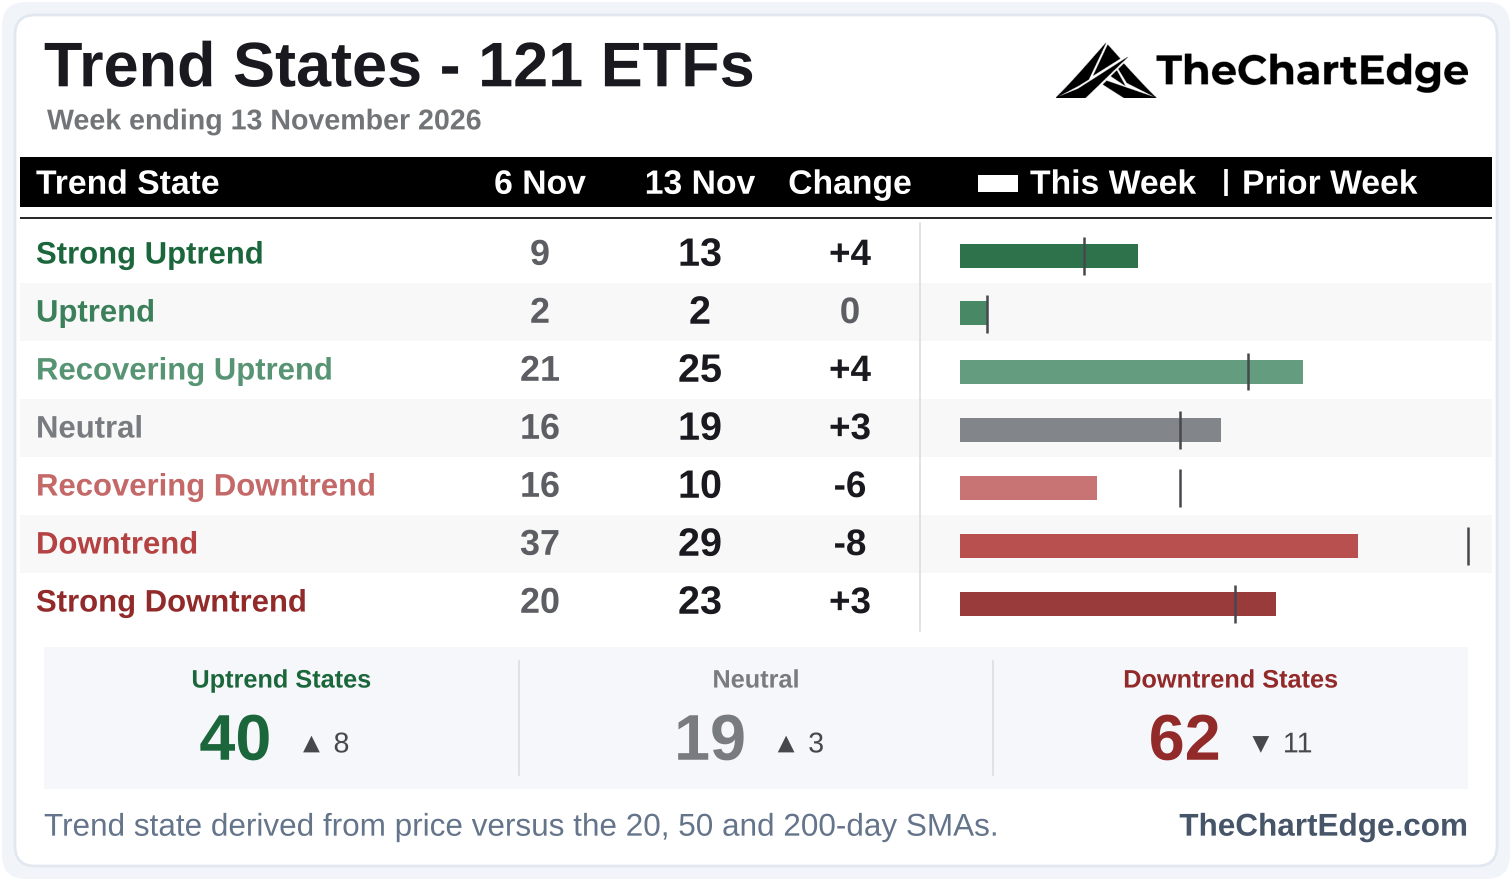
Uptrend states rose and downtrend states fell, but downtrend states still outnumber uptrend states by a wide margin.
Last week’s 10 best performers were all AI and semis - AI innovation (BAI), equal-weight semis (XSD), generative AI (CHAT), quantum & AI (QTUM) and Taiwan (EWT) - or energy - natural gas (UNG), equal-weight energy (RSPG), oil & gas E&P (XOP), oil services (OIH) and XLE. However, none of them are in an uptrend state, all 10 are still below their 50-day SMAs, and 6 are below their 200-day as well. The Strong Uptrends are the slower, lower-volatility names - mostly defensives like staples, health care and insurance, plus financials and equal weight.
The equal-weight S&P 500 (RSP), value (IWD) and the Dow (DIA) moved into Strong Uptrends, along with retail (XRT) and medical devices (IHI). QQQ, technology (XLK), semis (SMH) and growth (IWF) are all still in Downtrends, although 5 of last weekend’s 10 that dropped into Downtrends are back in Neutral - QQEW, FNGS, equal-weight technology (RSPT), AI (THNQ) and Taiwan (EWT).
Bonds went the other way, with 7 of the 9 bond ETFs slipping to a weaker trend state, and high yield (HYG) and EM bonds (EMB) dropping into Strong Downtrends.
Crypto, precious metals, China and solar had a bad week. Ethereum (ETHA), Bitcoin (IBIT), solar (TAN), China internet (KWEB), silver miners (SIL) and gold miners (GDX) were 6 of the 10 worst performers. ETHA and IBIT fell from Neutral into Downtrends, and the other 4 into Strong Downtrends.
Semis Struggle at Resistance
Semiconductors (SMH) Chart
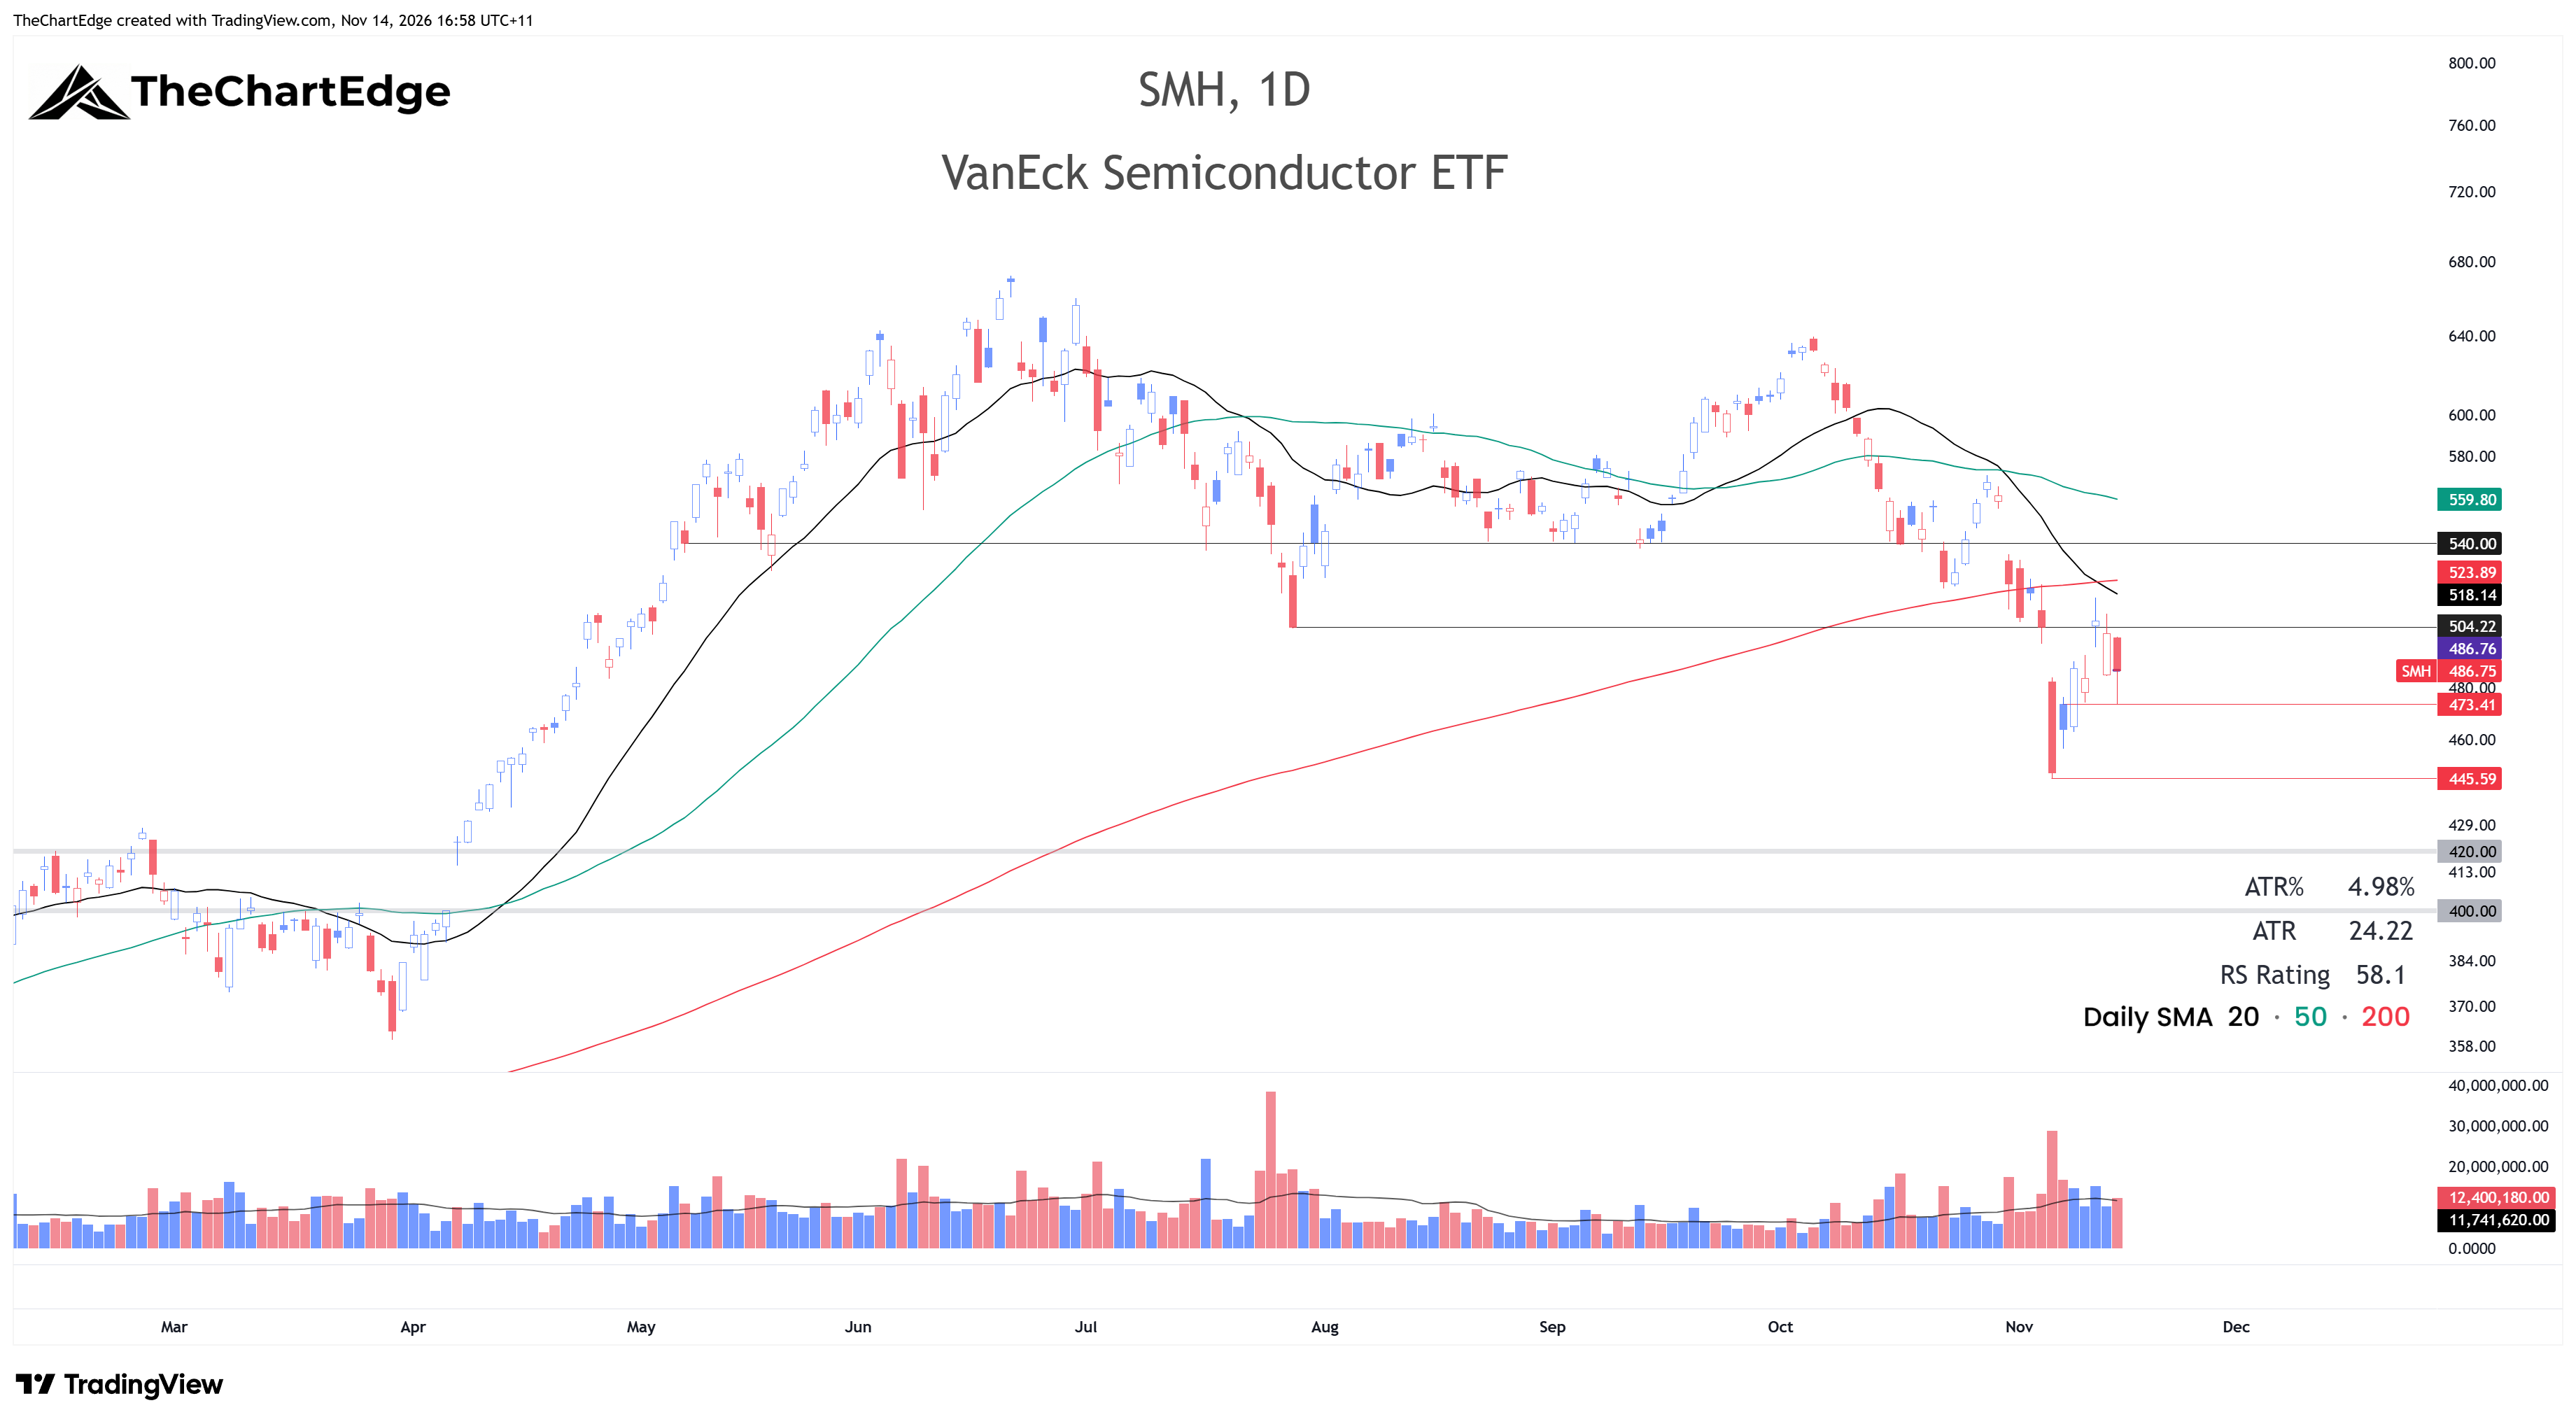
Last weekend I said I was watching 420 on the downside and around 504 above. SMH bounced like the indices, with pretty big up days on Monday and Wednesday. Wednesday even closed a smidge above 504 but never got above any of its SMAs. Thursday’s close after a gap down looked okay but failed to reclaim 504. During Friday’s sell-off it got as low as 473 intraday before closing about mid-range. But honestly, it still looks pretty weak. On the upside, if it can clear 504, I’d be looking at the 20 and 200-day SMAs around 518-524, and above that 540. On the downside, 445 was Thursday November 5’s low, and if we lose that we could see 420.
NVIDIA (NVDA) Chart
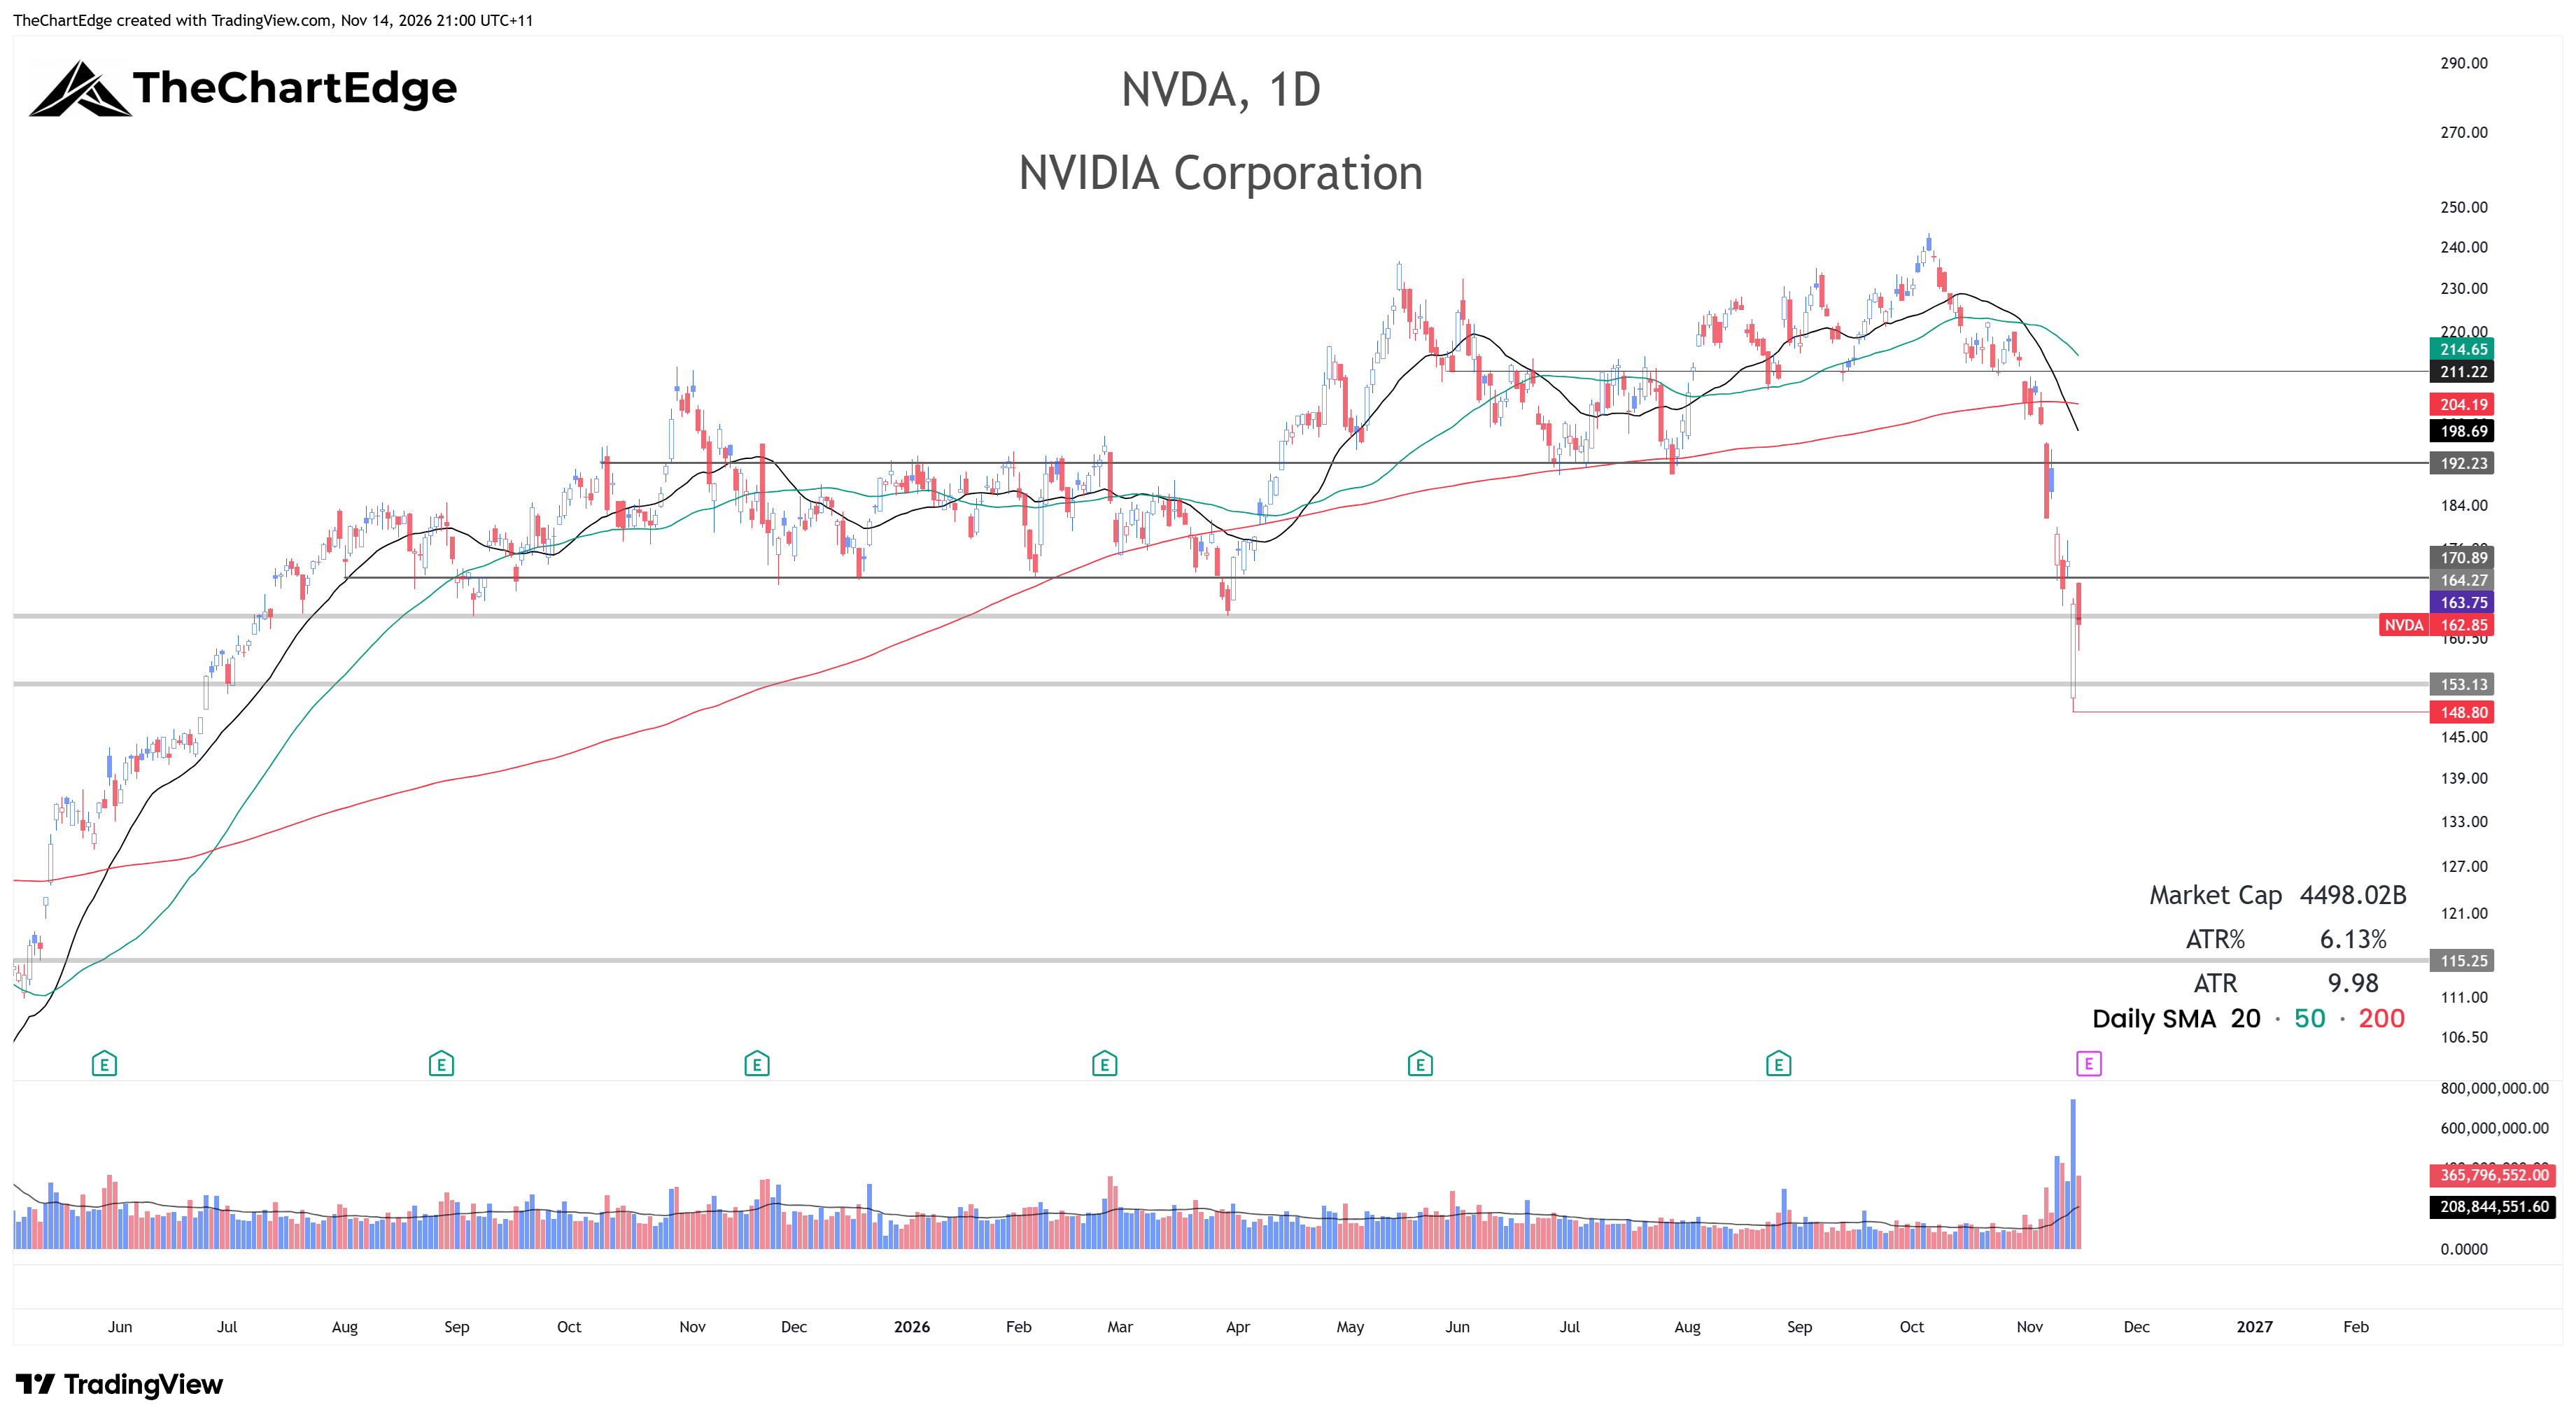
NVIDIA announced on Thursday that Jensen Huang had resigned as CEO, effective immediately, with CFO Colette Kress as interim CEO. NVDA gapped down hard on Thursday, getting as low as 148.80, but reversed to close well off the lows on very heavy volume. It opened higher on Friday but faded to close at 162.85, a little below Thursday’s close. If it breaks below Thursday’s low at 148.80 with force, it could head down to 130, or maybe even 115. NVIDIA reports on Tuesday after the close (Wednesday morning here in Australia).
Trades & Follow-Ups
Crude Oil Spot (USOIL) Chart
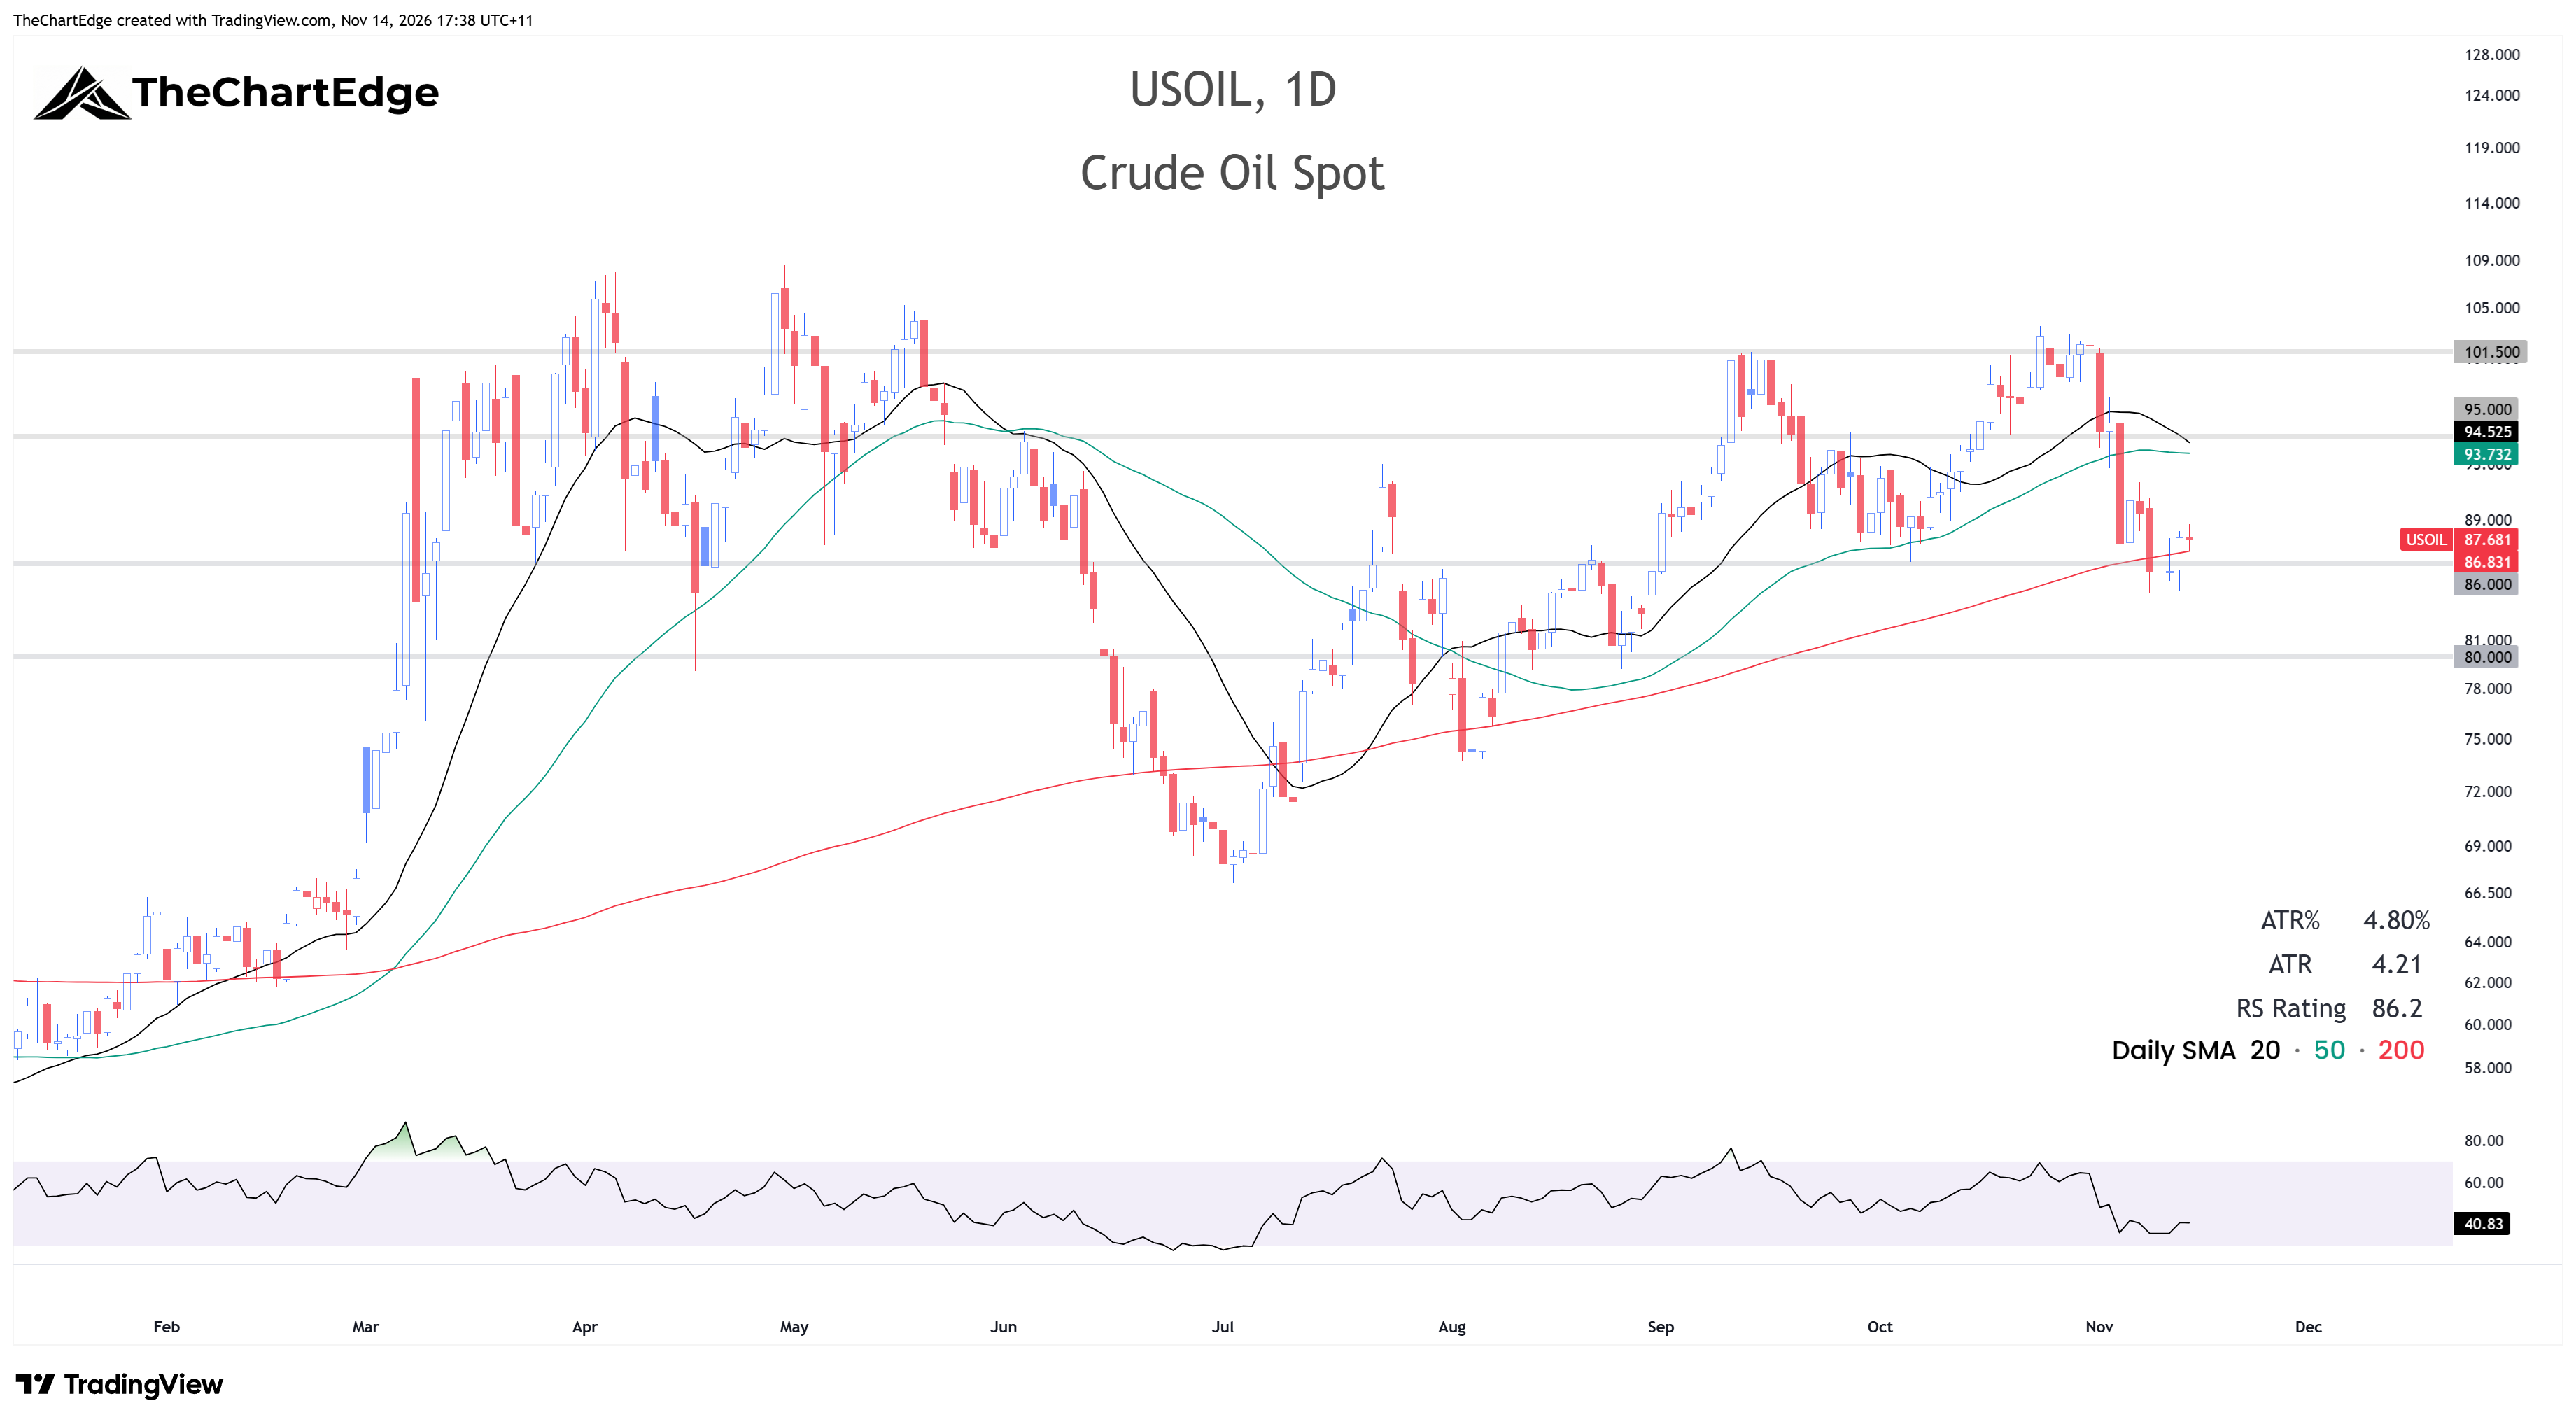
Last weekend I said a break below 86 would likely come on news of some negotiated breakthrough. Crude did undercut 86 during the week as markets priced in hopes of a diplomatic solution, but rallied back above it and the 200-day SMA, closing the week at 87.68. I don’t often buy weakness, but if I do, I like to see an undercut and reclaim of a support level, i.e. a failed breakdown.
I decided to go long on Friday (US time) at 87.85. However, with headline risk high in both directions over the weekend, I used a guaranteed stop - many CFD providers offer them, so even if price gaps down, they fill you at that level. There is a small premium if the stop is triggered, though, and a minimum stop distance depending on volatility. At the time I placed the order on Friday, 86.13 was the closest stop I could implement using the guaranteed stop.
When crude opened on Monday morning, Australian time, it gapped down slightly. I converted the guaranteed stop back to a regular stop, moved it up to 86.80, and was stopped out in the early afternoon.
Large-Cap Biotech (IBB) Chart
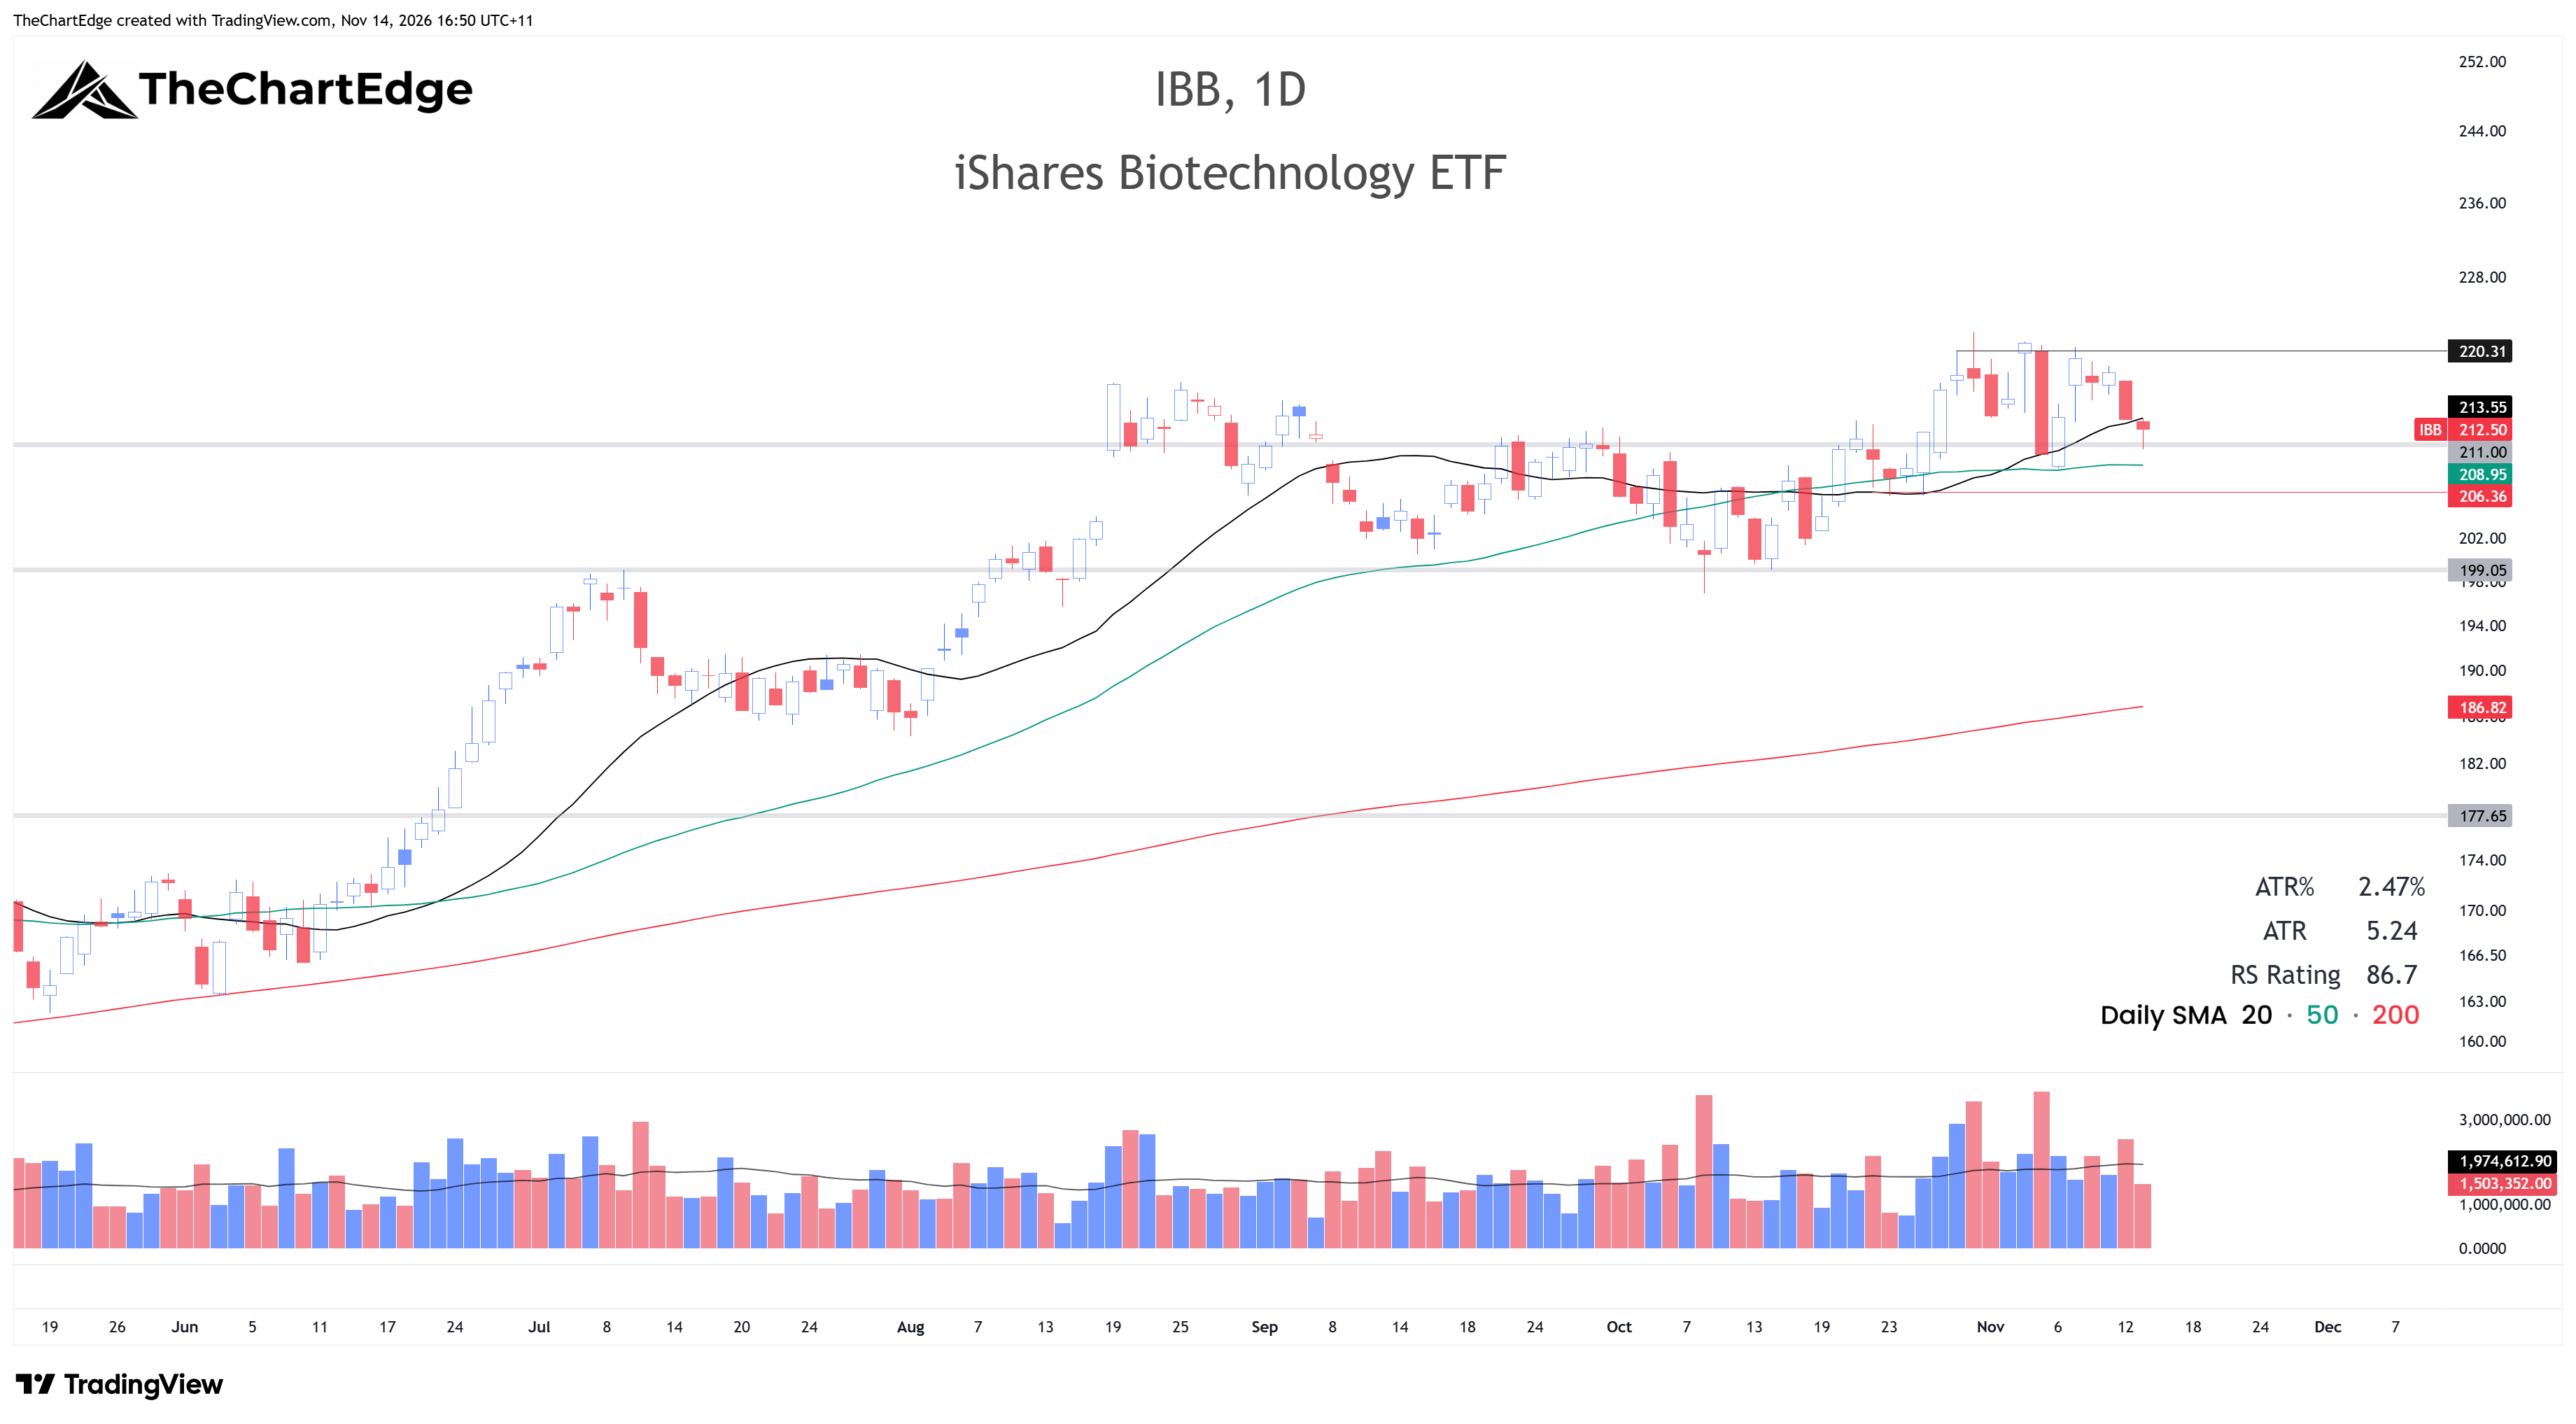
Last weekend I said I’d watch to see if IBB could consolidate and tighten up, but unfortunately, it didn’t. It gapped up on Monday, tightened up a little on Tuesday and Wednesday, then fell pretty hard again on Thursday. On Friday, it probed a little lower, testing the 211 area, finishing off the lows, but was still red for the day and below the 20-day SMA. If Friday’s candle had flipped green and closed above the 20-day, I might have bought it on Monday with a stop under the 50-day SMA, but it’s still a bit loose for me, so I’m not going to do anything yet. I’ll definitely keep it on the watchlist.
The Week Ahead
The Market Temperature slipped to 4.2, but the fall was due to the VIX - the rally itself was broad. However, semis struggled at resistance, and the stronger trends are in equal weight, financials and health care rather than the mega cap and tech names that drive the cap-weighted indices, even though tech bounced harder in percentage terms. NVIDIA’s results on Tuesday, with an interim CEO, will likely set the tone for semis and the Nasdaq. At this stage, I don’t plan to enter any new swing trades, nor do I have any on currently. I’ll do some shorter-term trading, though, most likely getting long crude and short the Nasdaq 100.
Stay open-minded and manage risk carefully.
Cheers,
Marcus Grant, CFTe
Disclaimer: The content provided in this newsletter is for informational and educational purposes only and should not be considered as financial, investment, or legal advice. It is general information only and does not take into account your objectives, financial situation or needs. The information shared is based on our research and analysis, but we are not a licensed financial advisor, nor can we guarantee its accuracy, completeness, or timeliness. Market conditions and financial instruments can change rapidly, and any opinions expressed may not be suitable for all investors. Any opinions expressed and/or securities mentioned do not constitute a recommendation to buy, sell, or hold that or any other security. You should conduct your own due diligence and consult with a licensed financial advisor or other professional before making any investment decisions. Past performance is not indicative of future results, and all investments carry the risk of loss. The authors and publishers of this newsletter are not responsible for any financial decisions made based on the content provided herein. By reading and/or subscribing to this newsletter, you acknowledge and agree that you are using the information at your own risk.