

Market Temperature Rises to 6.7 - Tech Continues to Dominate
QQQ and SPY at all-time highs, but extremely extended from their 50-day SMAs & 9 of 11 SPDR sectors Lagging

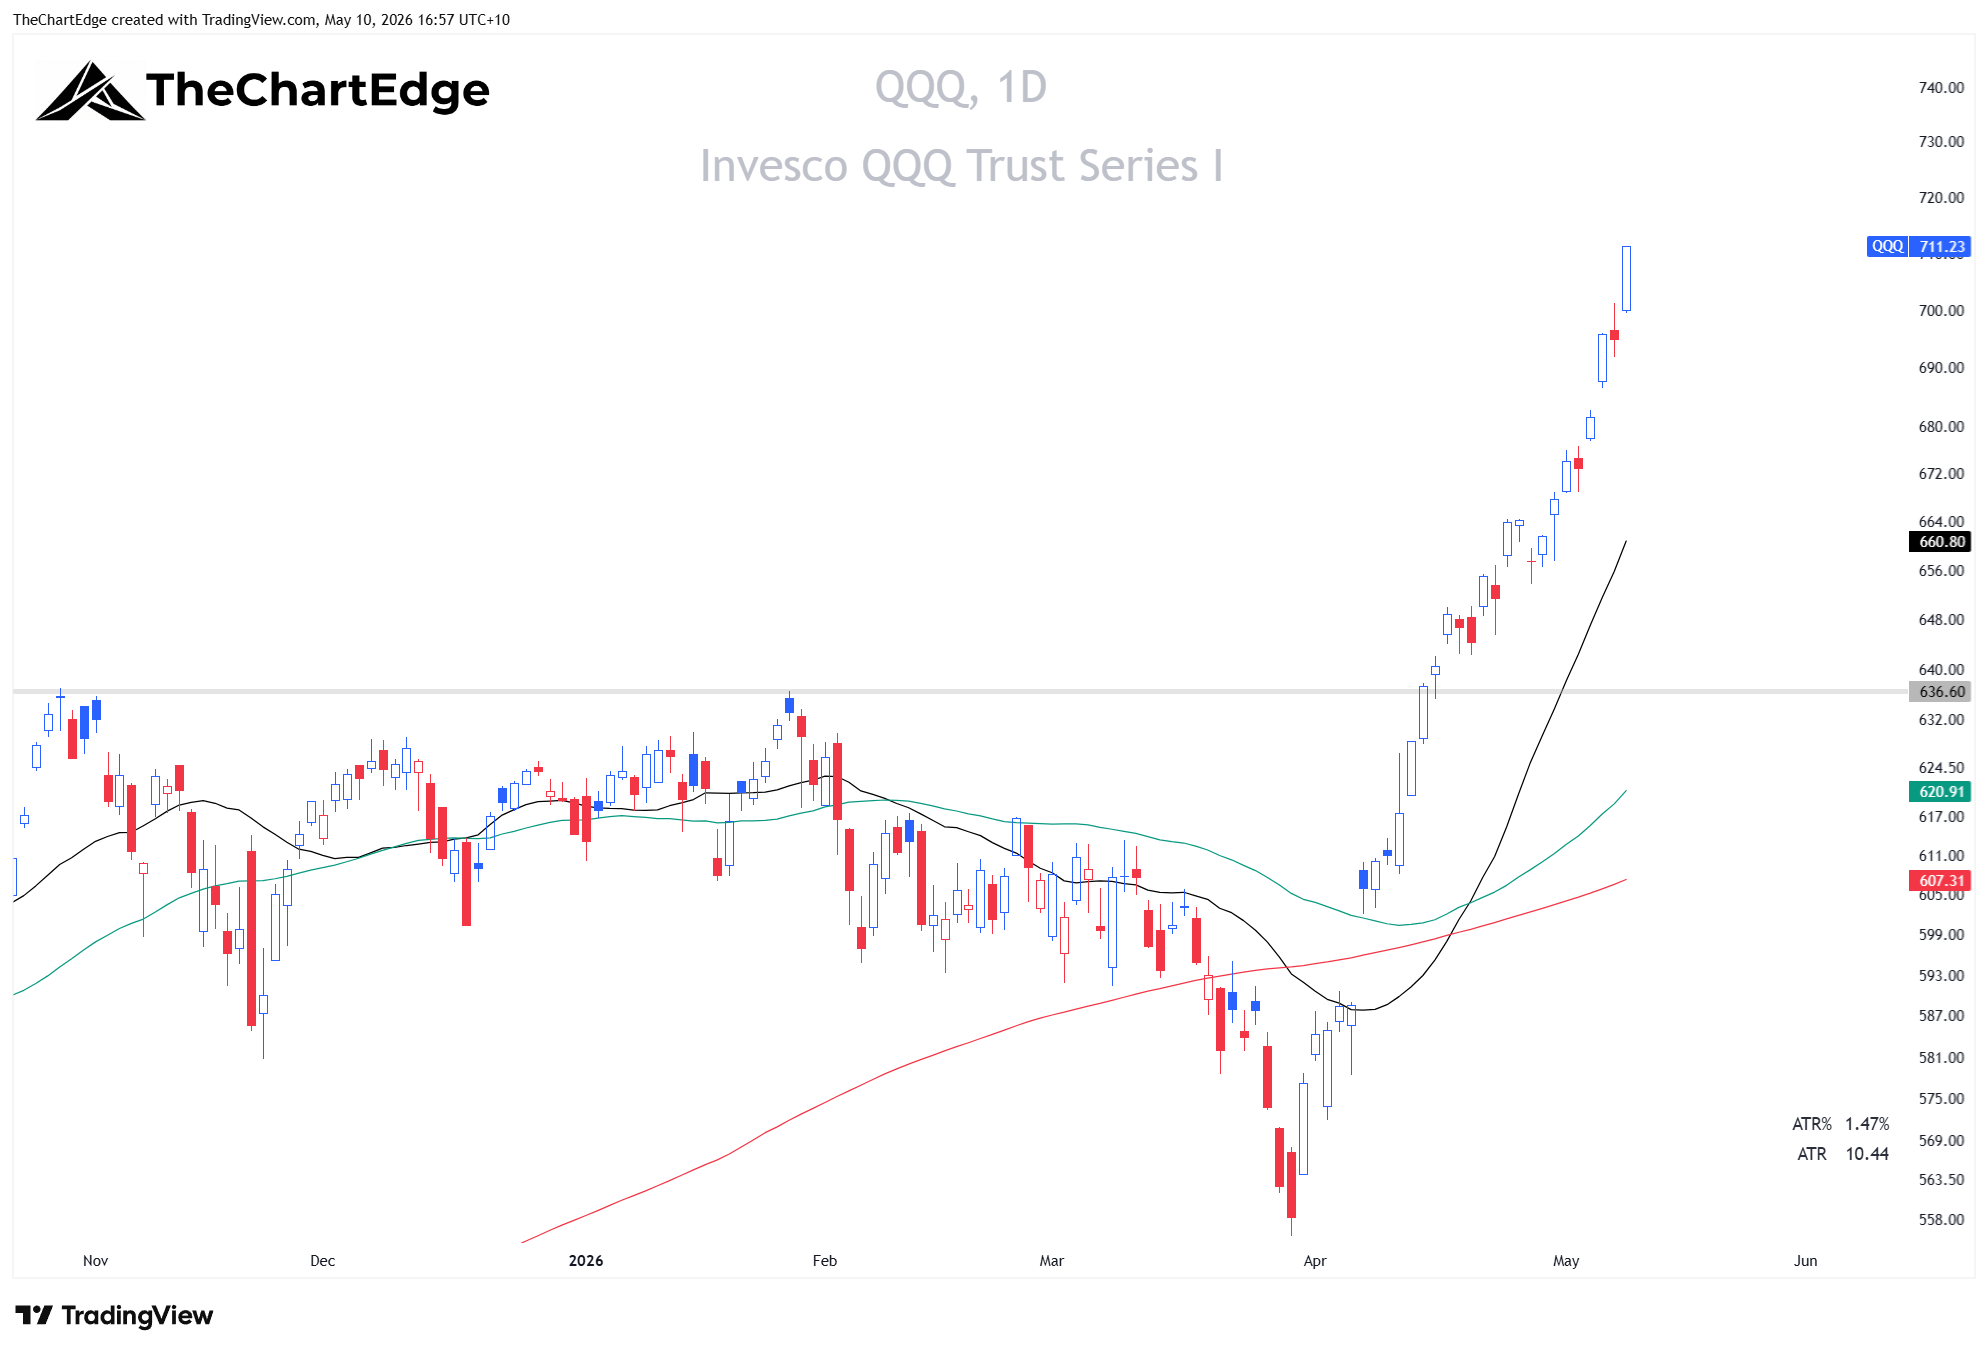
The Nasdaq 100 (QQQ) gained 5.50% last week (week ending May 8) and closed at a new all-time high. The S&P 500 (SPY) was up 2.35% and also closed at a new all-time high. The equal-weight S&P 500 (RSP) gained 0.63%. The Dow (DIA) was up 0.22%. The S&P MidCap 400 (MDY) added 1.64% and the Russell 2000 (IWM) gained 1.75%.
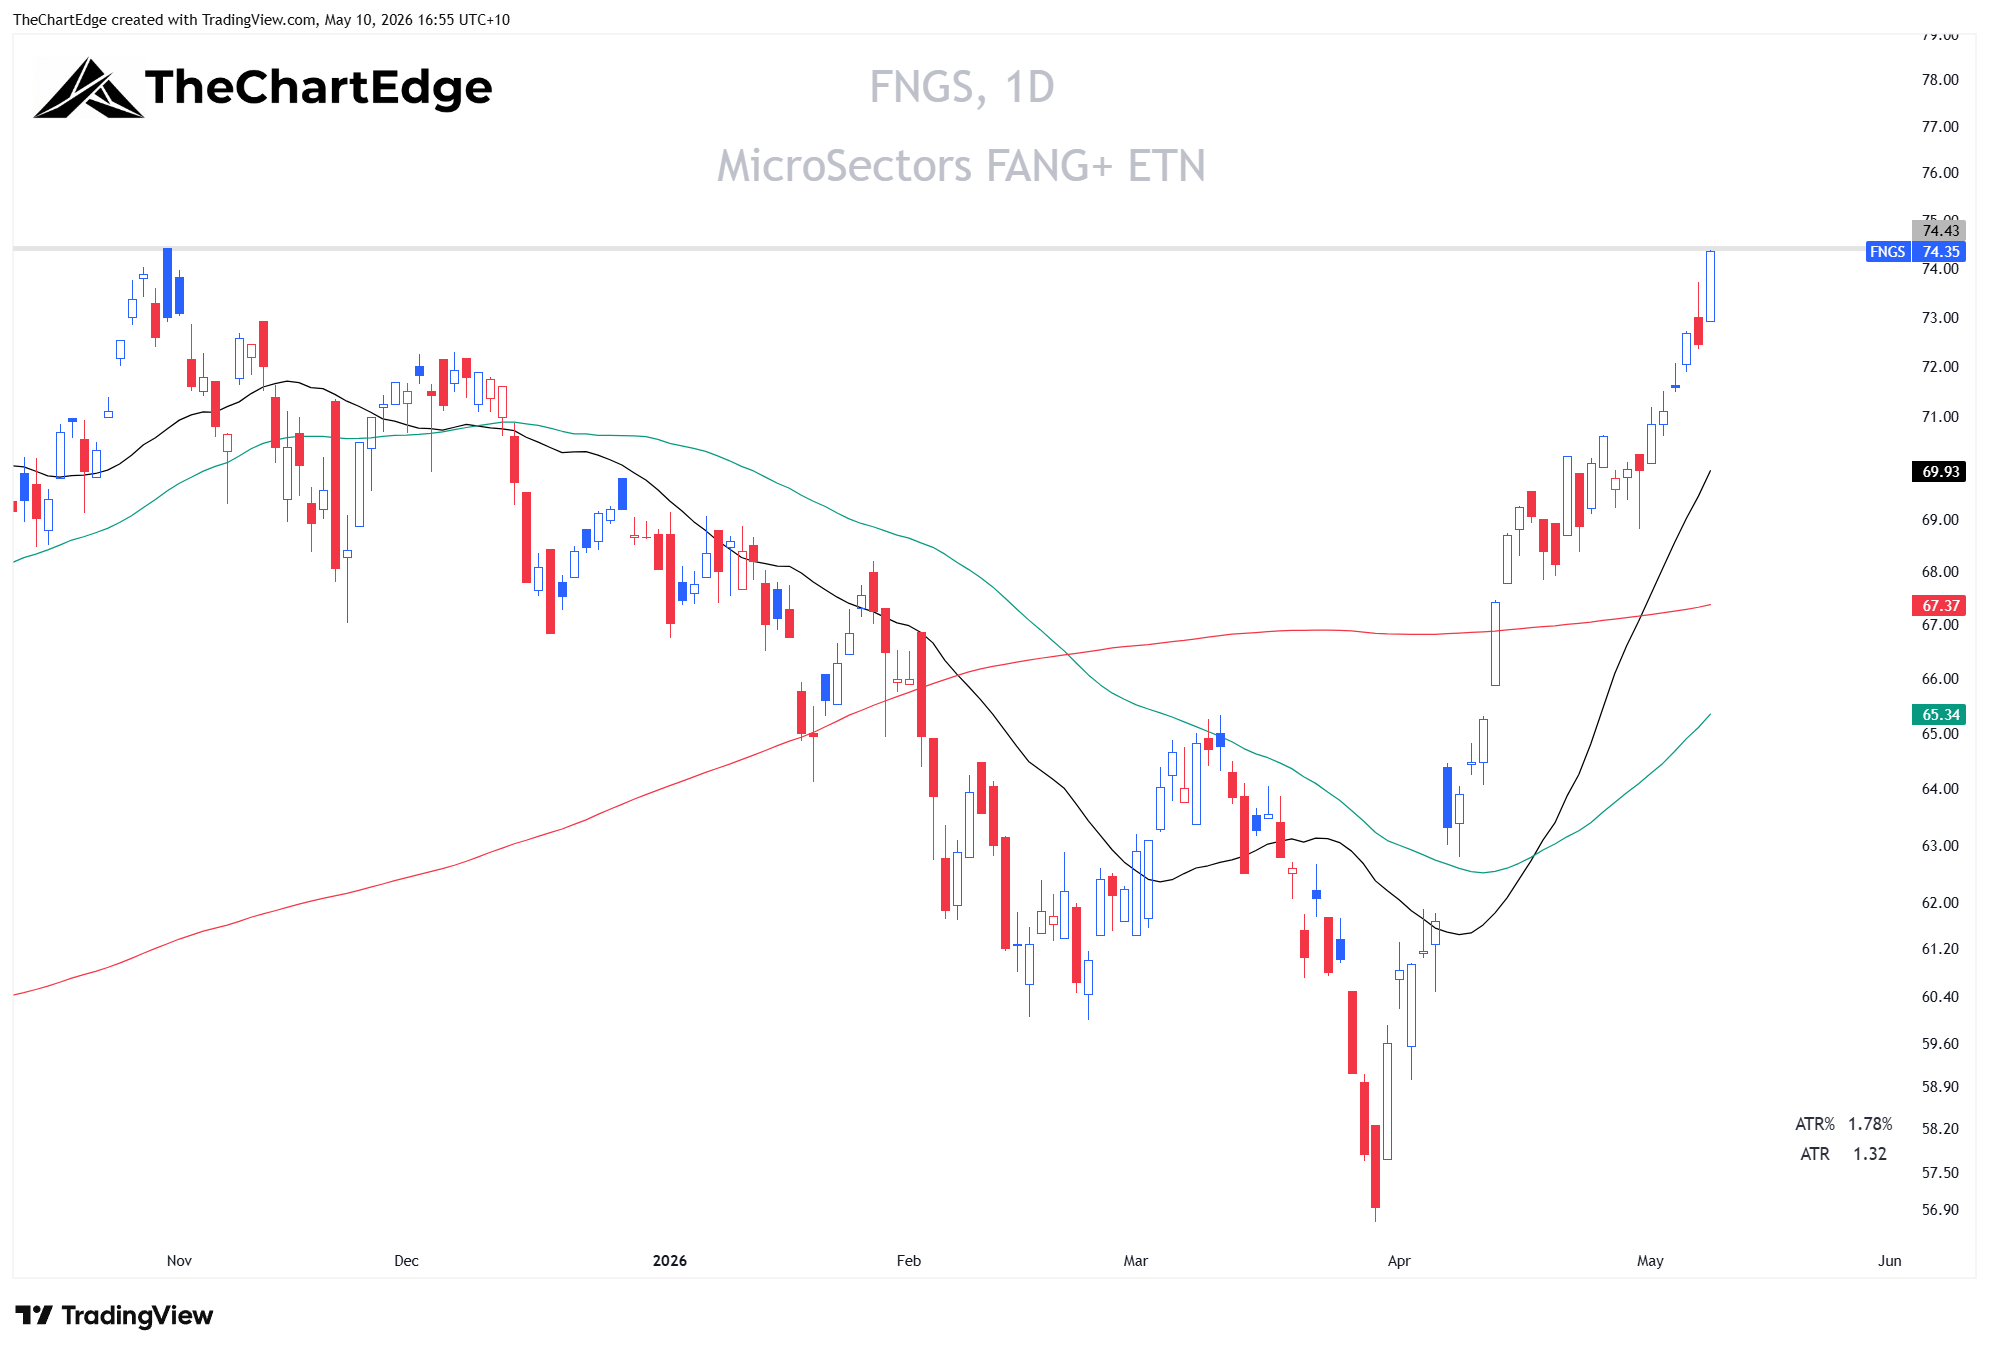
FANG+ (FNGS) gained 4.94% and moved back into the Leading quadrant after slipping to Improving the prior week. It finished the week at an all-time closing high for the first time since October 2025.
SPY Chart
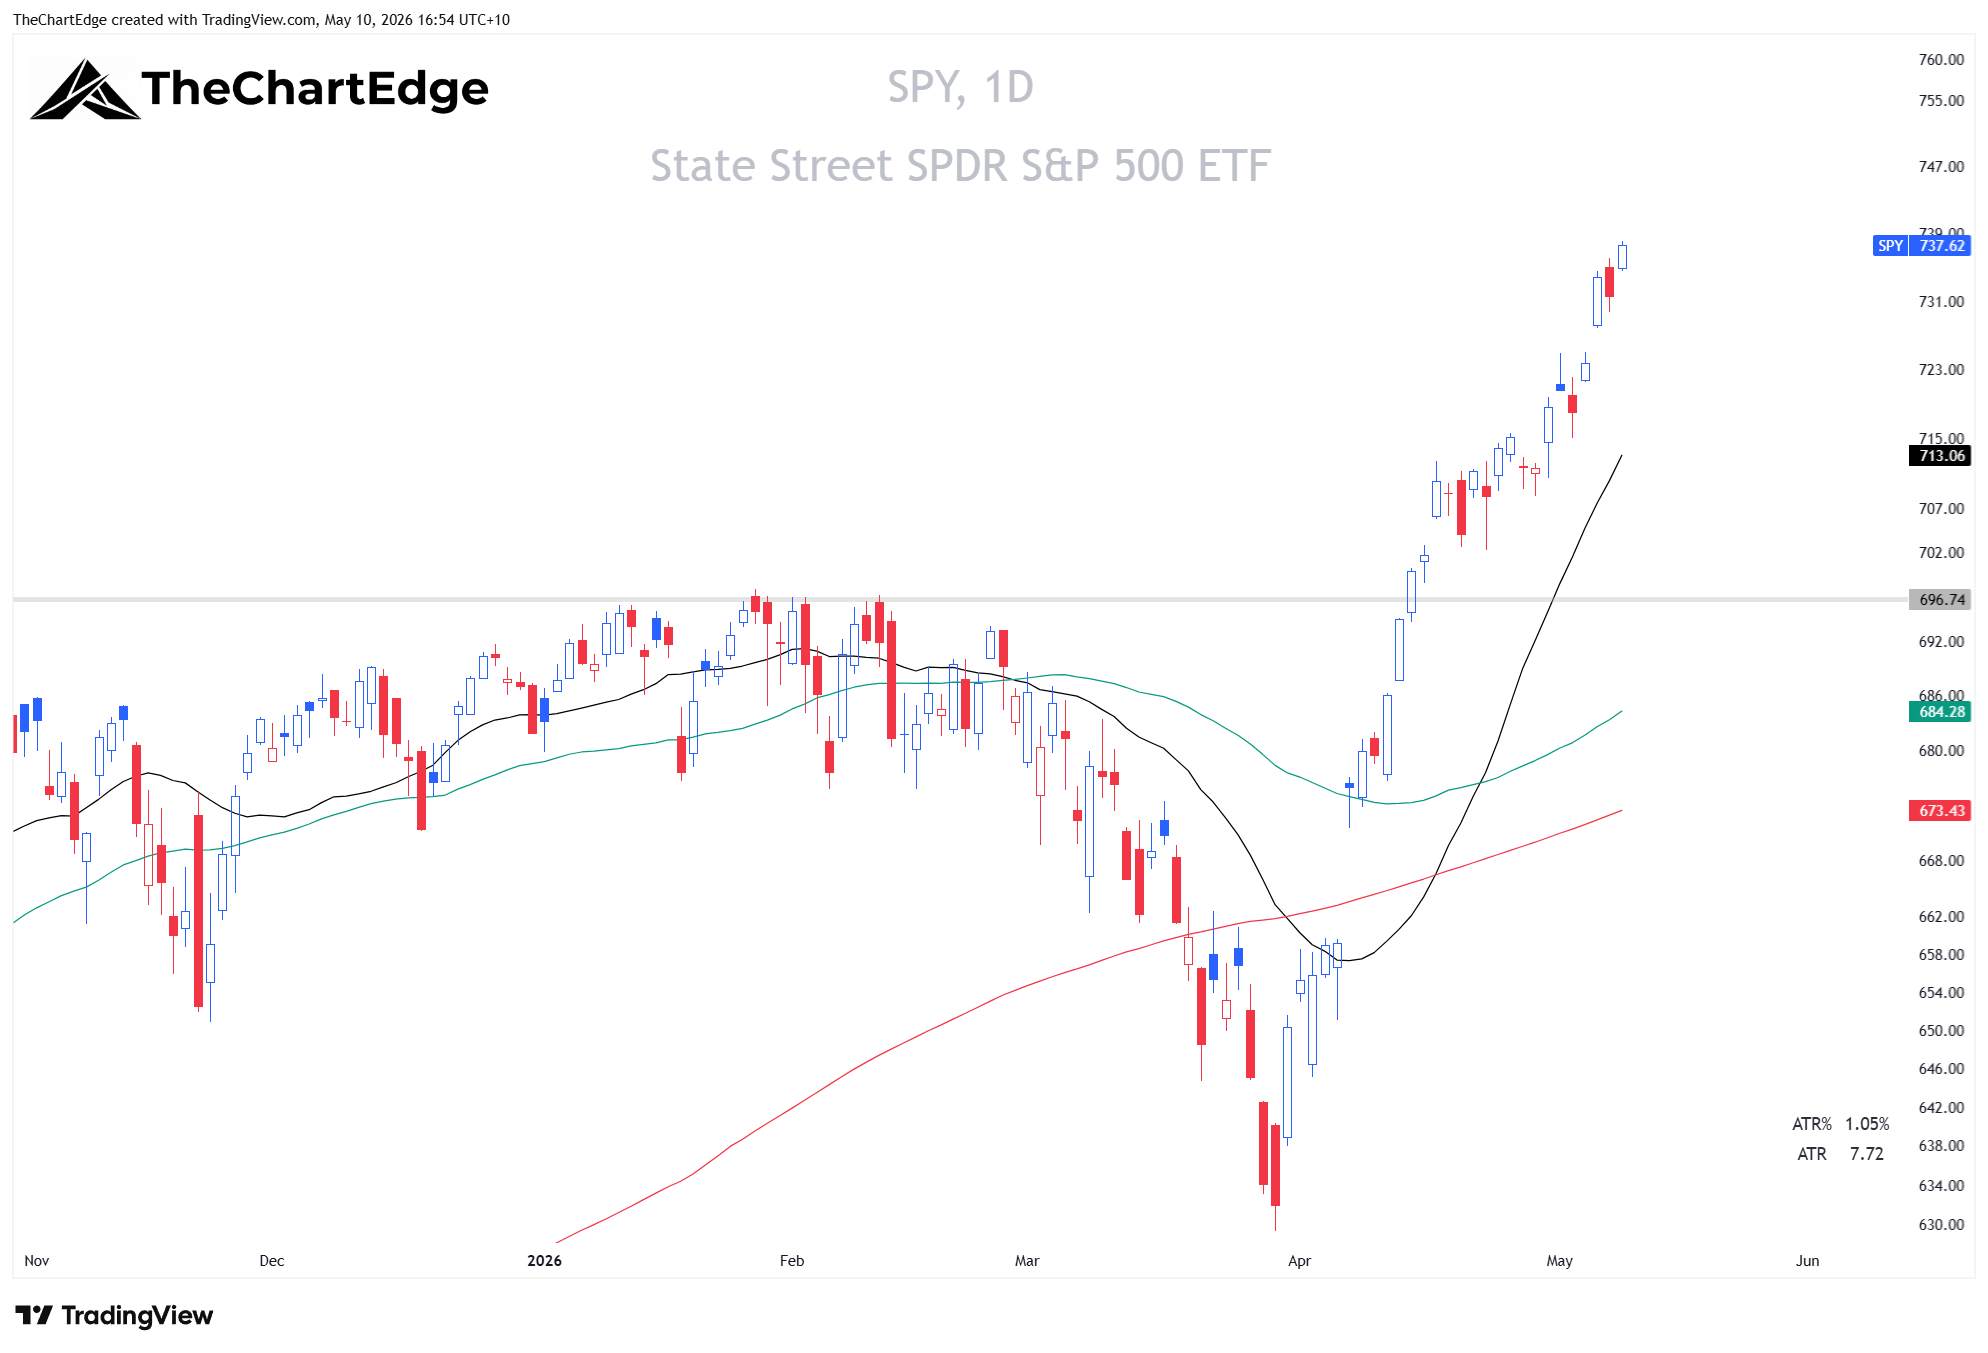
For all daily charts the black line is the 20-day SMA, the green is the 50-day SMA, and the red is the 200-day SMA.
QQQ Chart
FNGS Chart
Extensions
QQQ and SPY are getting to extreme levels of historical extension from their 50-day SMA. QQQ closed the week 14.55% above its 50-day (up from 10.04% last week). SPY was 7.80% above its 50-day (up from 5.94% last week). In our backtest from May 1999 to April 2026 (6,782 weekly observations for SPY and 6,774 for QQQ), QQQ is almost in the 99th percentile, with only just over 1.0% of observations (70 out of 6,774) at or above current levels. SPY is in the 99th percentile, with slightly less than 1.0% of all observations (67 out of 6,782) at or above this level.
The semiconductor ETFs are even more stretched in percentage terms. SMH (Semiconductors) is 30.37% above its 50-day. XSD (equal-weight semis) is 43.85% above its 50-day.
Market Temperature
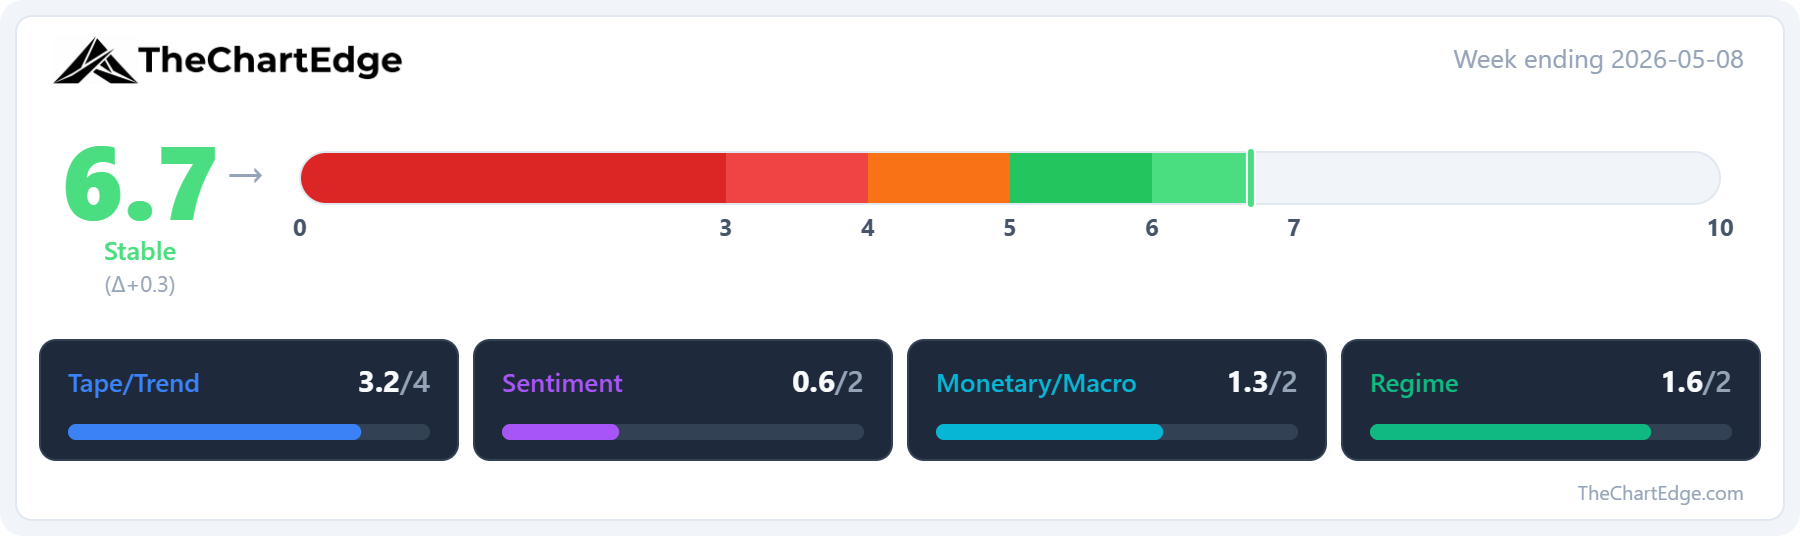
The Market Temperature rose slightly to 6.7 last week, up from 6.4 the prior week.
The Tape pillar improved (3.03 → 3.24 out of 4) driven by SPY’s weekly RSI pushing to 69.13 from 65.47.
The Monetary/Macro pillar score dropped (1.48 → 1.26) but the underlying readings were largely unchanged. MOVE actually fell from 70.41 to 67.25, but the model’s direction component scored lower because the 4-week comparison base rolled forward from the April 3 stress peak (84.41) to the April 10 reading (72.15). The rate of improvement slowed, not the conditions themselves. UUP was essentially flat (27.41 → 27.34) but scored slightly lower for the same reason - the more favourable 4-week comparison is fading, as the April 3 stress peak rolled off.
The Sentiment pillar was basically unchanged, with a tiny tick up in the VIX week over week.
The Regime pillar score was up 0.33, due to the IWF/IWD ratio (growth vs value) component flipping from negative to neutral.
Fixed Income Update
In last weekend’s note I flagged equity vol falling while rate vol rising was a divergence worth watching. That resolved last week - MOVE dropped from 70.41 to 67.25 while VIX ticked higher (16.99 → 17.19). Fixed income ETFs bounced slightly - TLT +0.55%, LQD +0.55%, IEF +0.23% - but all remain Lagging with downtrend trend states. LQD was the only one to see its trend state improve (Strong Downtrend → Downtrend). TIP continues to be the outlier, holding a Recovering Uptrend and the only fixed income ETF positive YTD (+1.27%).
SPDR Sector Relative Strength
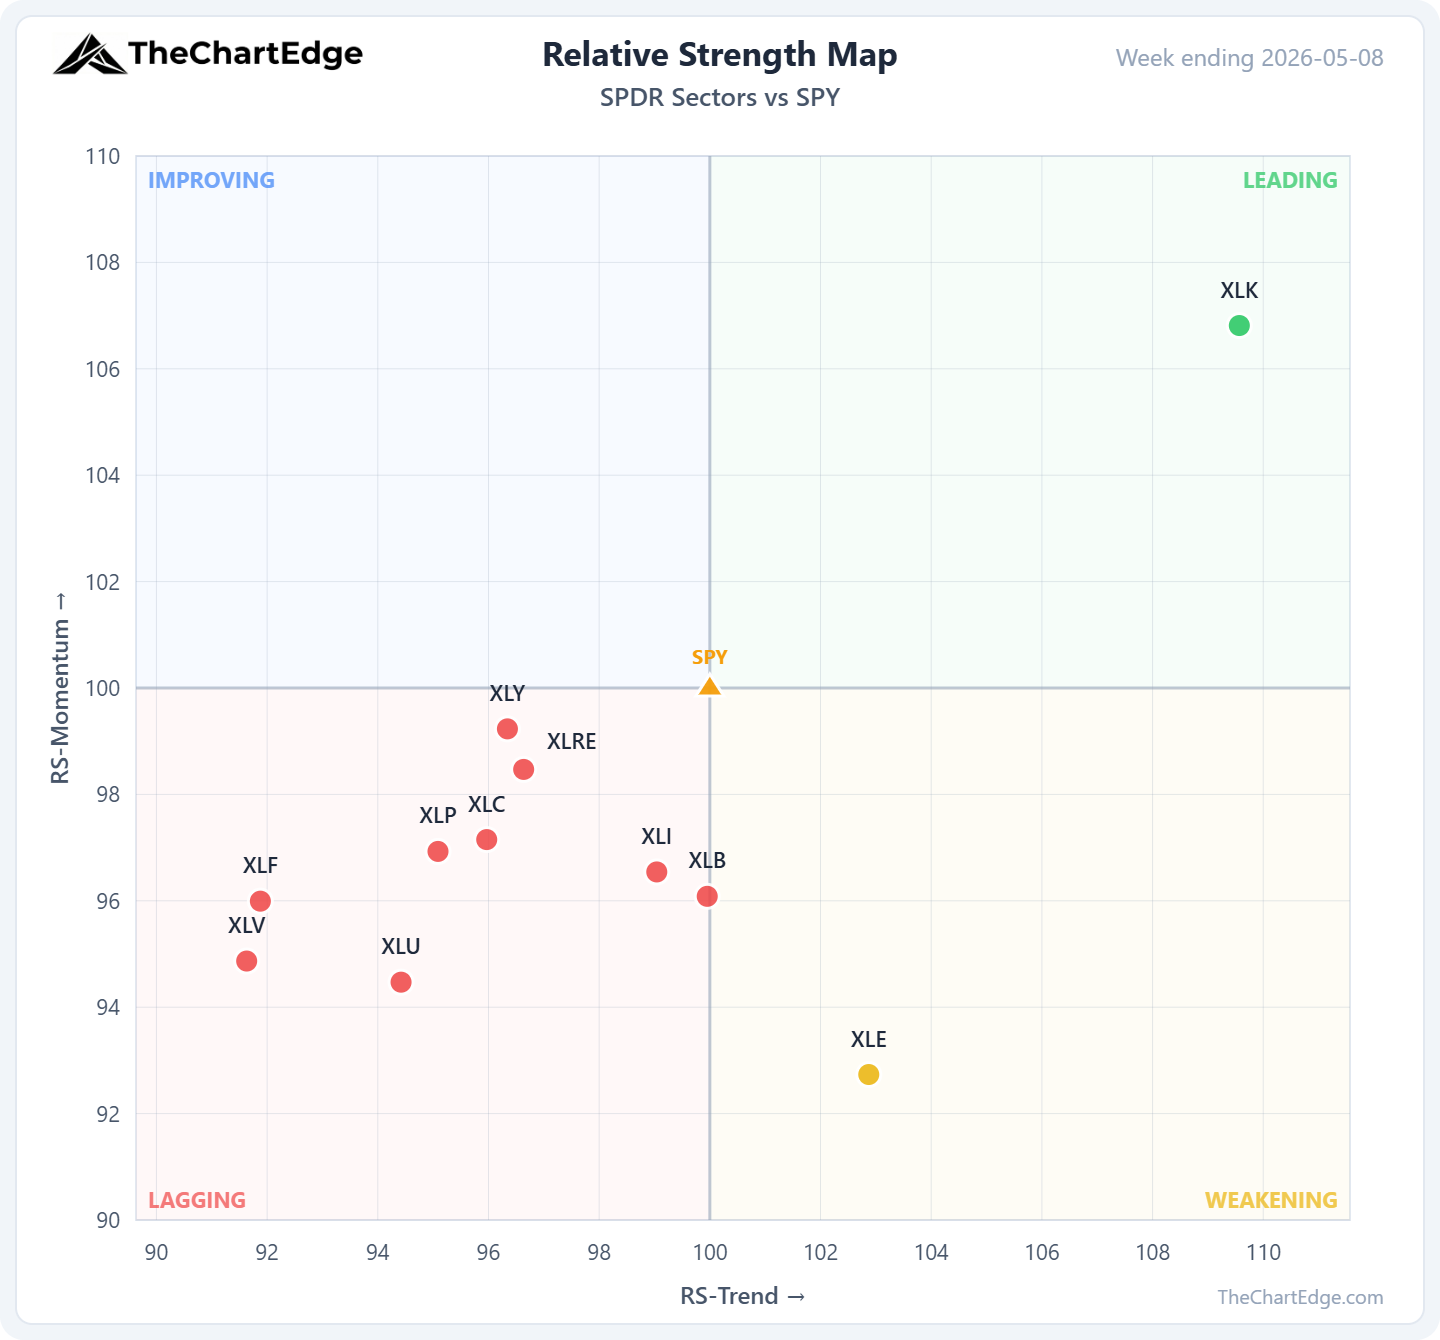
XLK (Technology) is the only SPDR sector in the Leading quadrant. Nine of the eleven SPDR sectors are now Lagging, up from six last week. XLI (Industrials), XLB (Materials), and XLRE (Real Estate) all dropped into Lagging last week. The only sector not Lagging besides XLK is XLE (Energy), which sits in Weakening after a tough week.
Semiconductors and AI
Semiconductors and AI continue to lead. SMH gained 11.13% for the week and is up 33.88% over the past month. XSD (equal-weight semis) gained 11.18% and is up 54.19% over the past month. Both closed at all-time highs. Thirteen ETFs in our universe currently have RS-Momentum above 105, and all thirteen are tech, semiconductor or AI related names, if you include WGMI (Crypto Miners), EWY (South Korea) and EWT (Taiwan) – which I believe you should given their components.
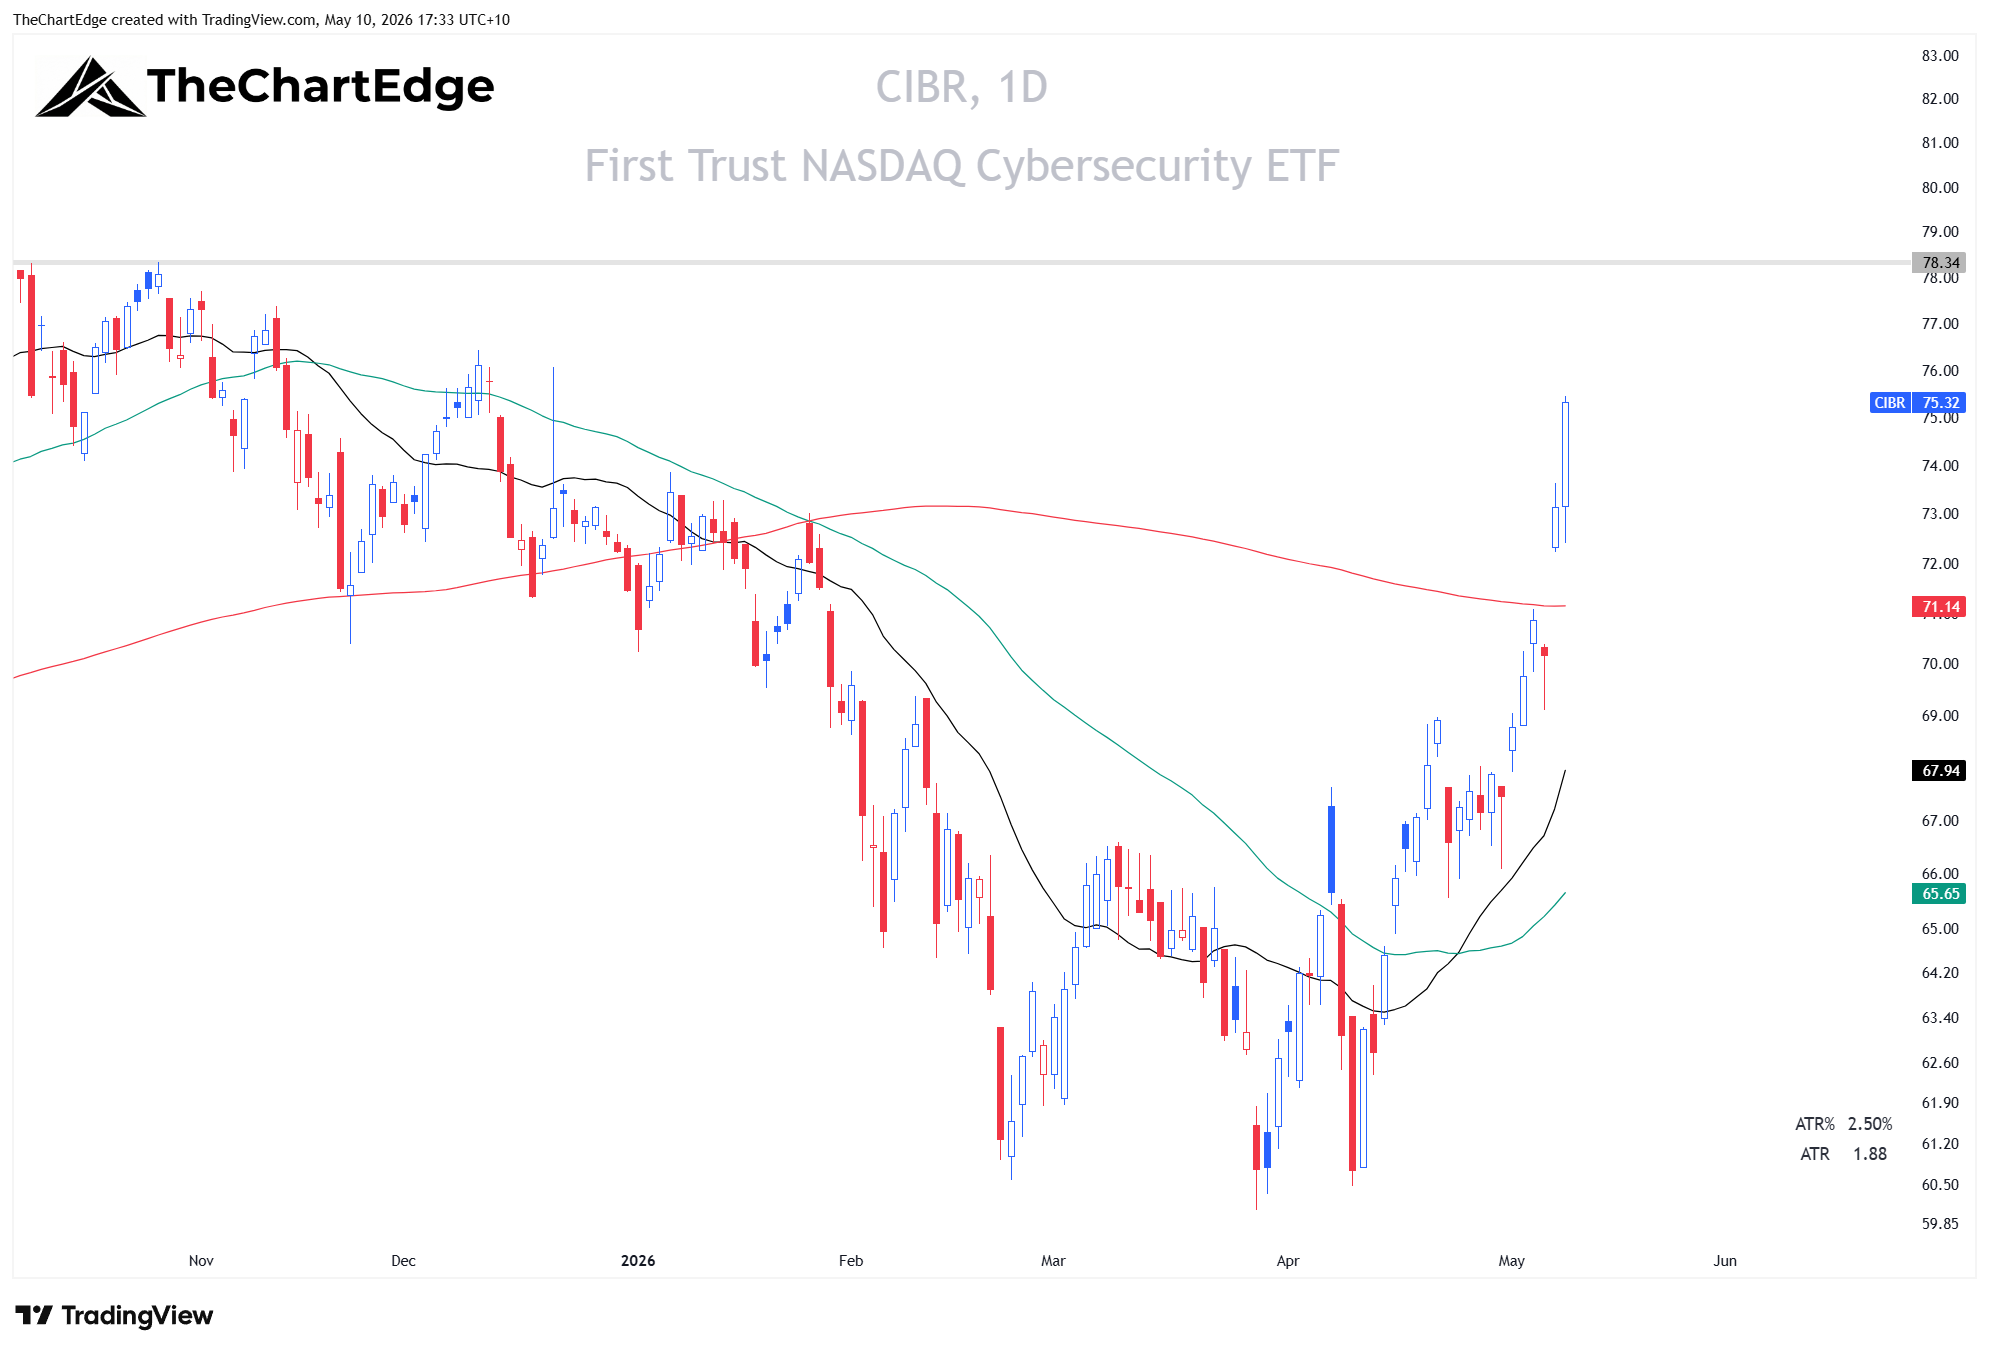
CIBR (Cybersecurity)
CIBR gained 9.54% last week and its RS-Trend jumped from 92.15 to 97.15. It remains in the Improving quadrant with RS-Momentum at 105.60. The trend state flipped from Recovering Downtrend to Recovering Uptrend and is now 3.85% off its all-time high.
ARKQ
ARKQ (Autonomous Tech) moved from Weakening to Leading last week, gaining 4.72%. RS-Trend at 109.09, RS-Momentum at 100.50. Strong Uptrend and up 15.73% YTD.
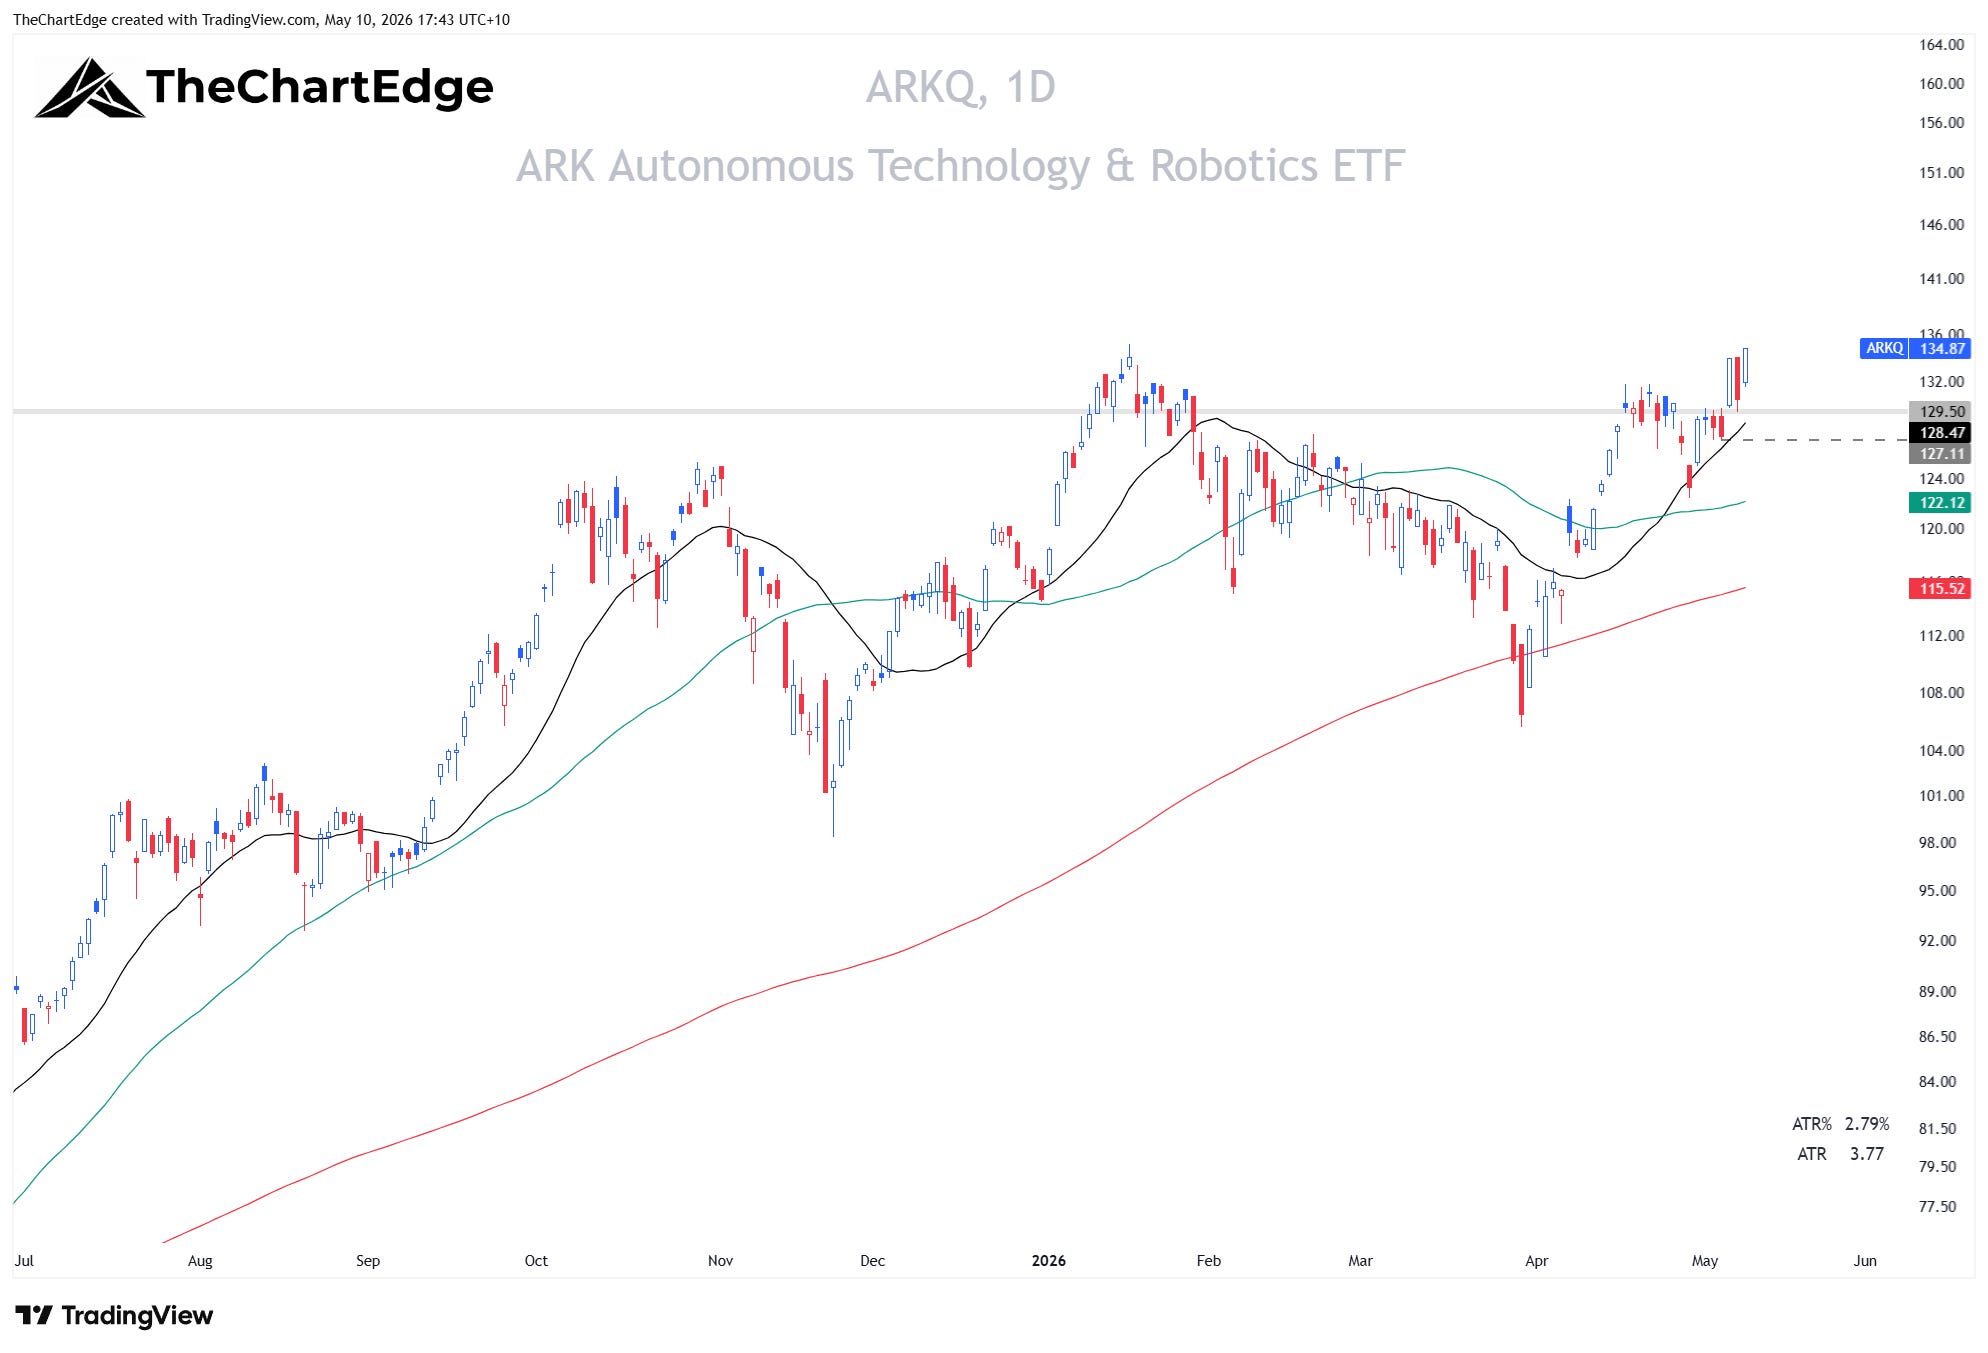
I’m considering a new position in ARKQ, with a stop under $127 (could use $129.50 for a tighter or multi-level stop).
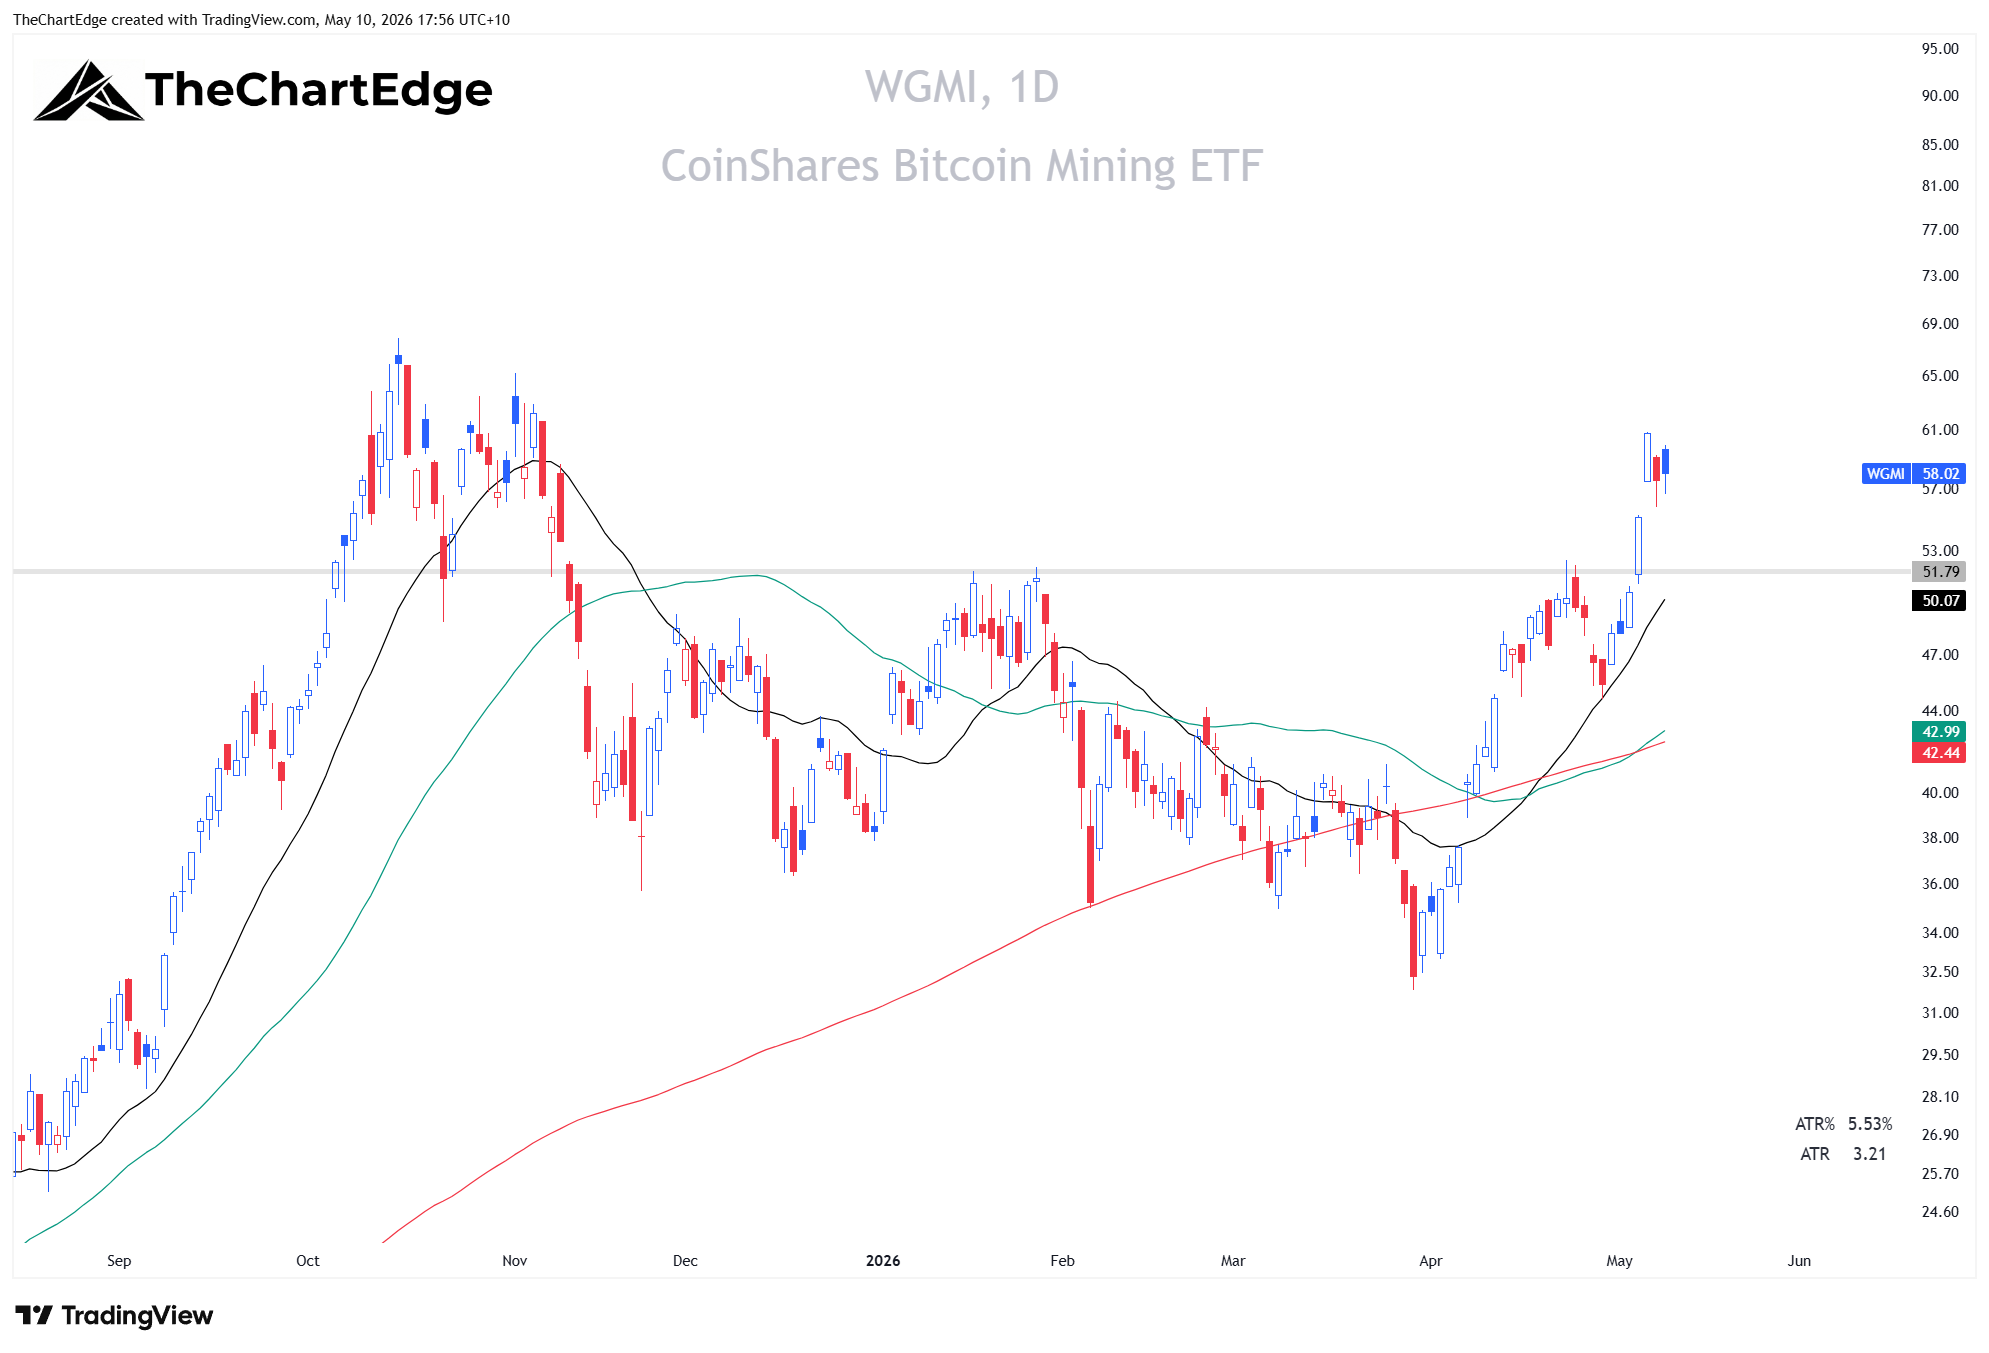
Crypto
WGMI (Crypto Miners) gained 20.40% and jumped from Weakening to Leading. RS-Momentum surged to 116.85 - the highest in our entire ETF universe. RS-Trend at 134.31. Strong Uptrend and up 48.24% YTD.
IBIT (Bitcoin) was up 2.20% and remains in Improving. RS-Trend improving steadily (84.79 → 90.32) but still well below 100 and still in a Recovering Downtrend.
ETHA (Ethereum) moved from Lagging to Improving, but only gained 0.34% - underperforming Bitcoin.
IBIT Chart
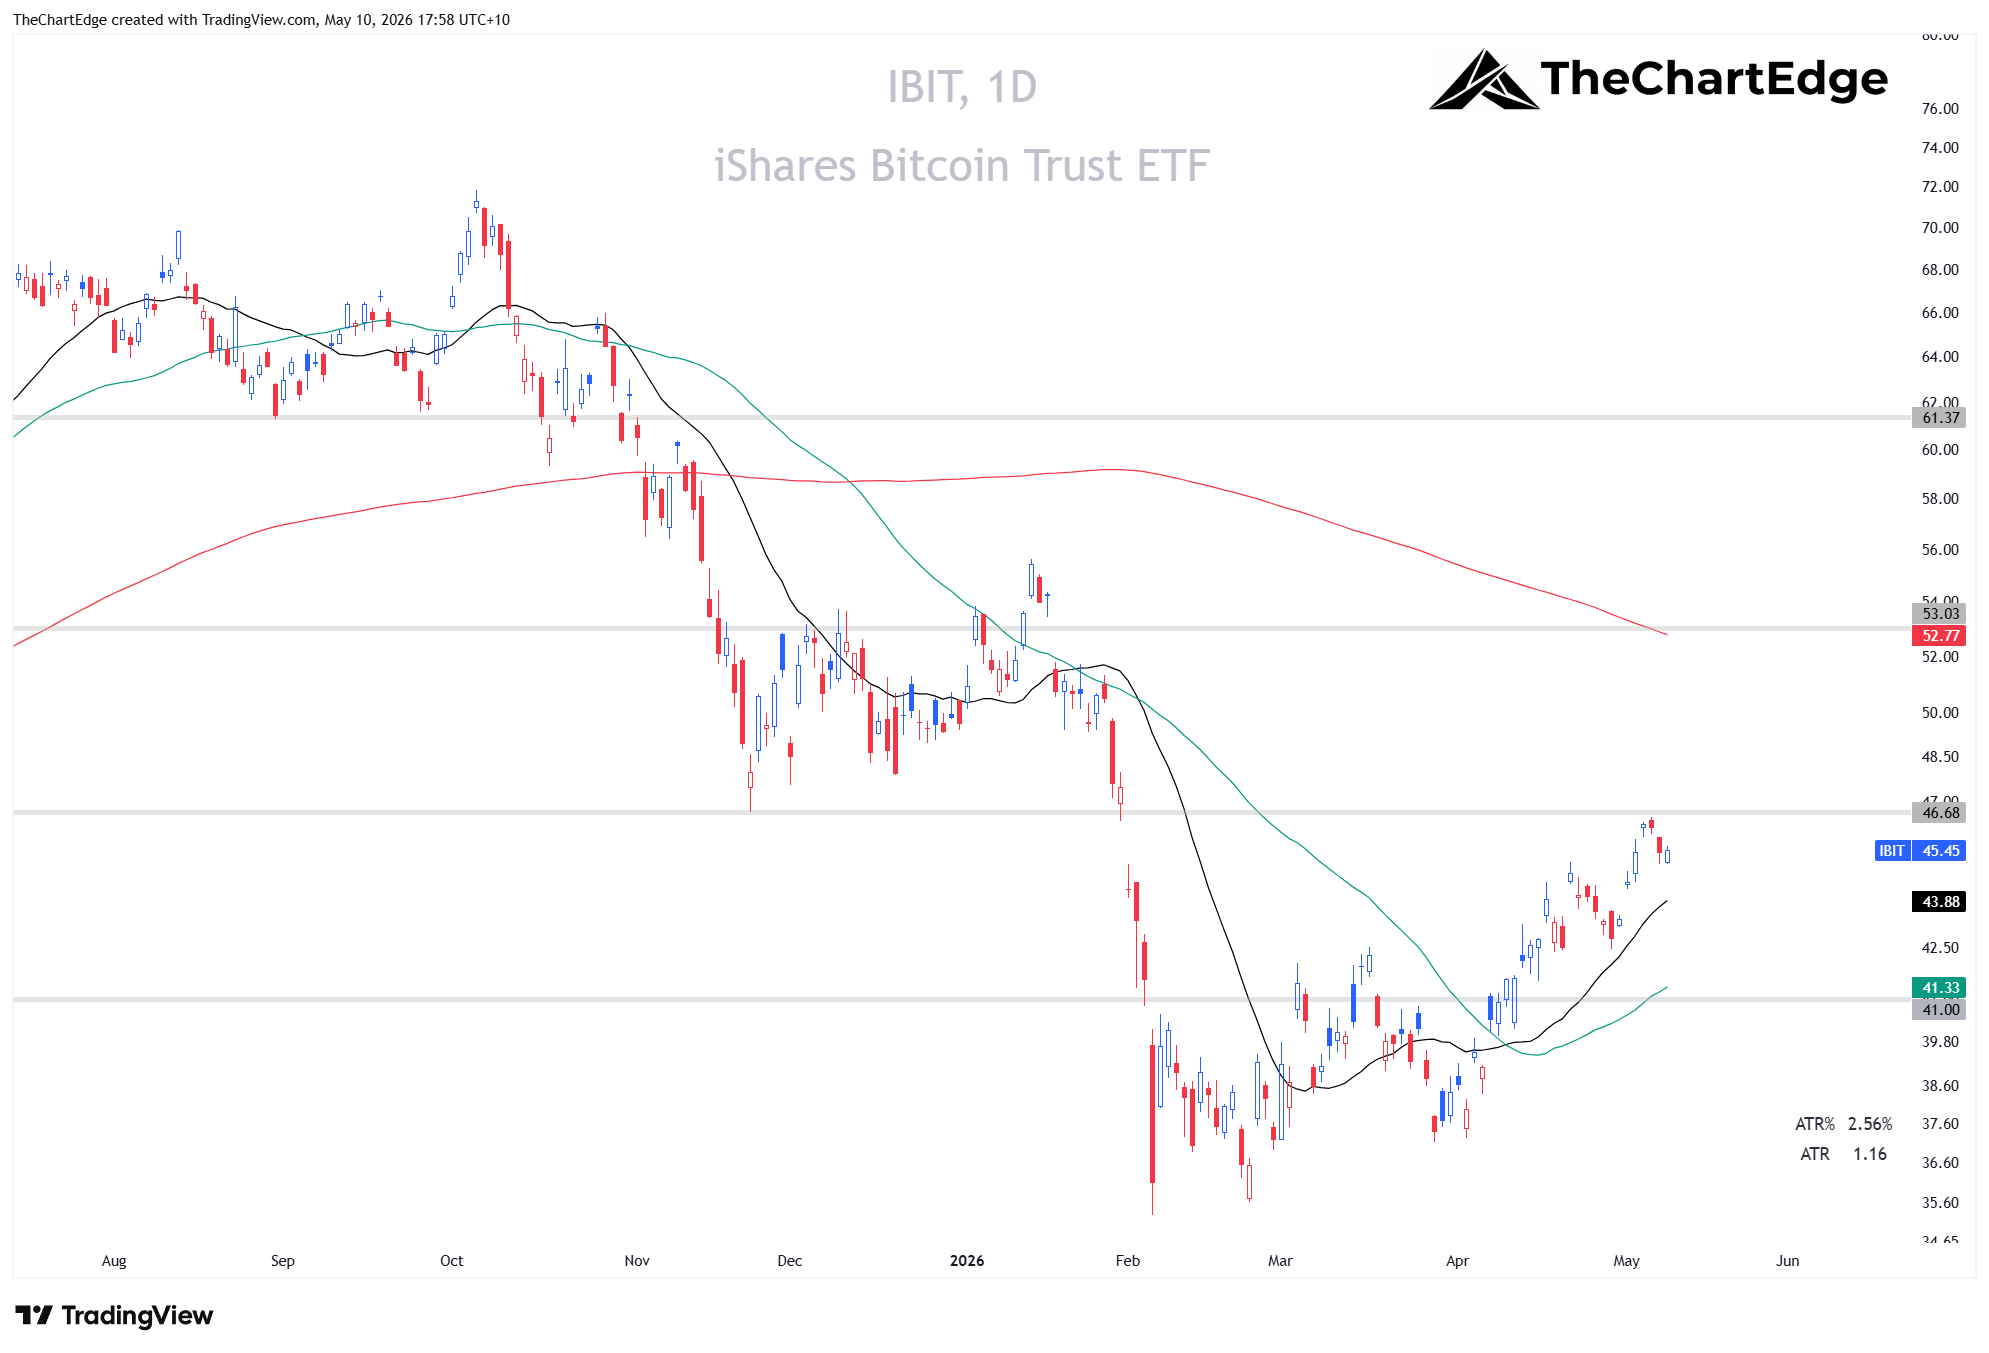
I don’t usually trade laggards below their 200-day SMAs, but I’m willing to make an exception for Bitcoin. However, personally, I prefer the 24/7 liquidity of the underlying to avoid the gap risk associated with the ETF.
BTC Chart
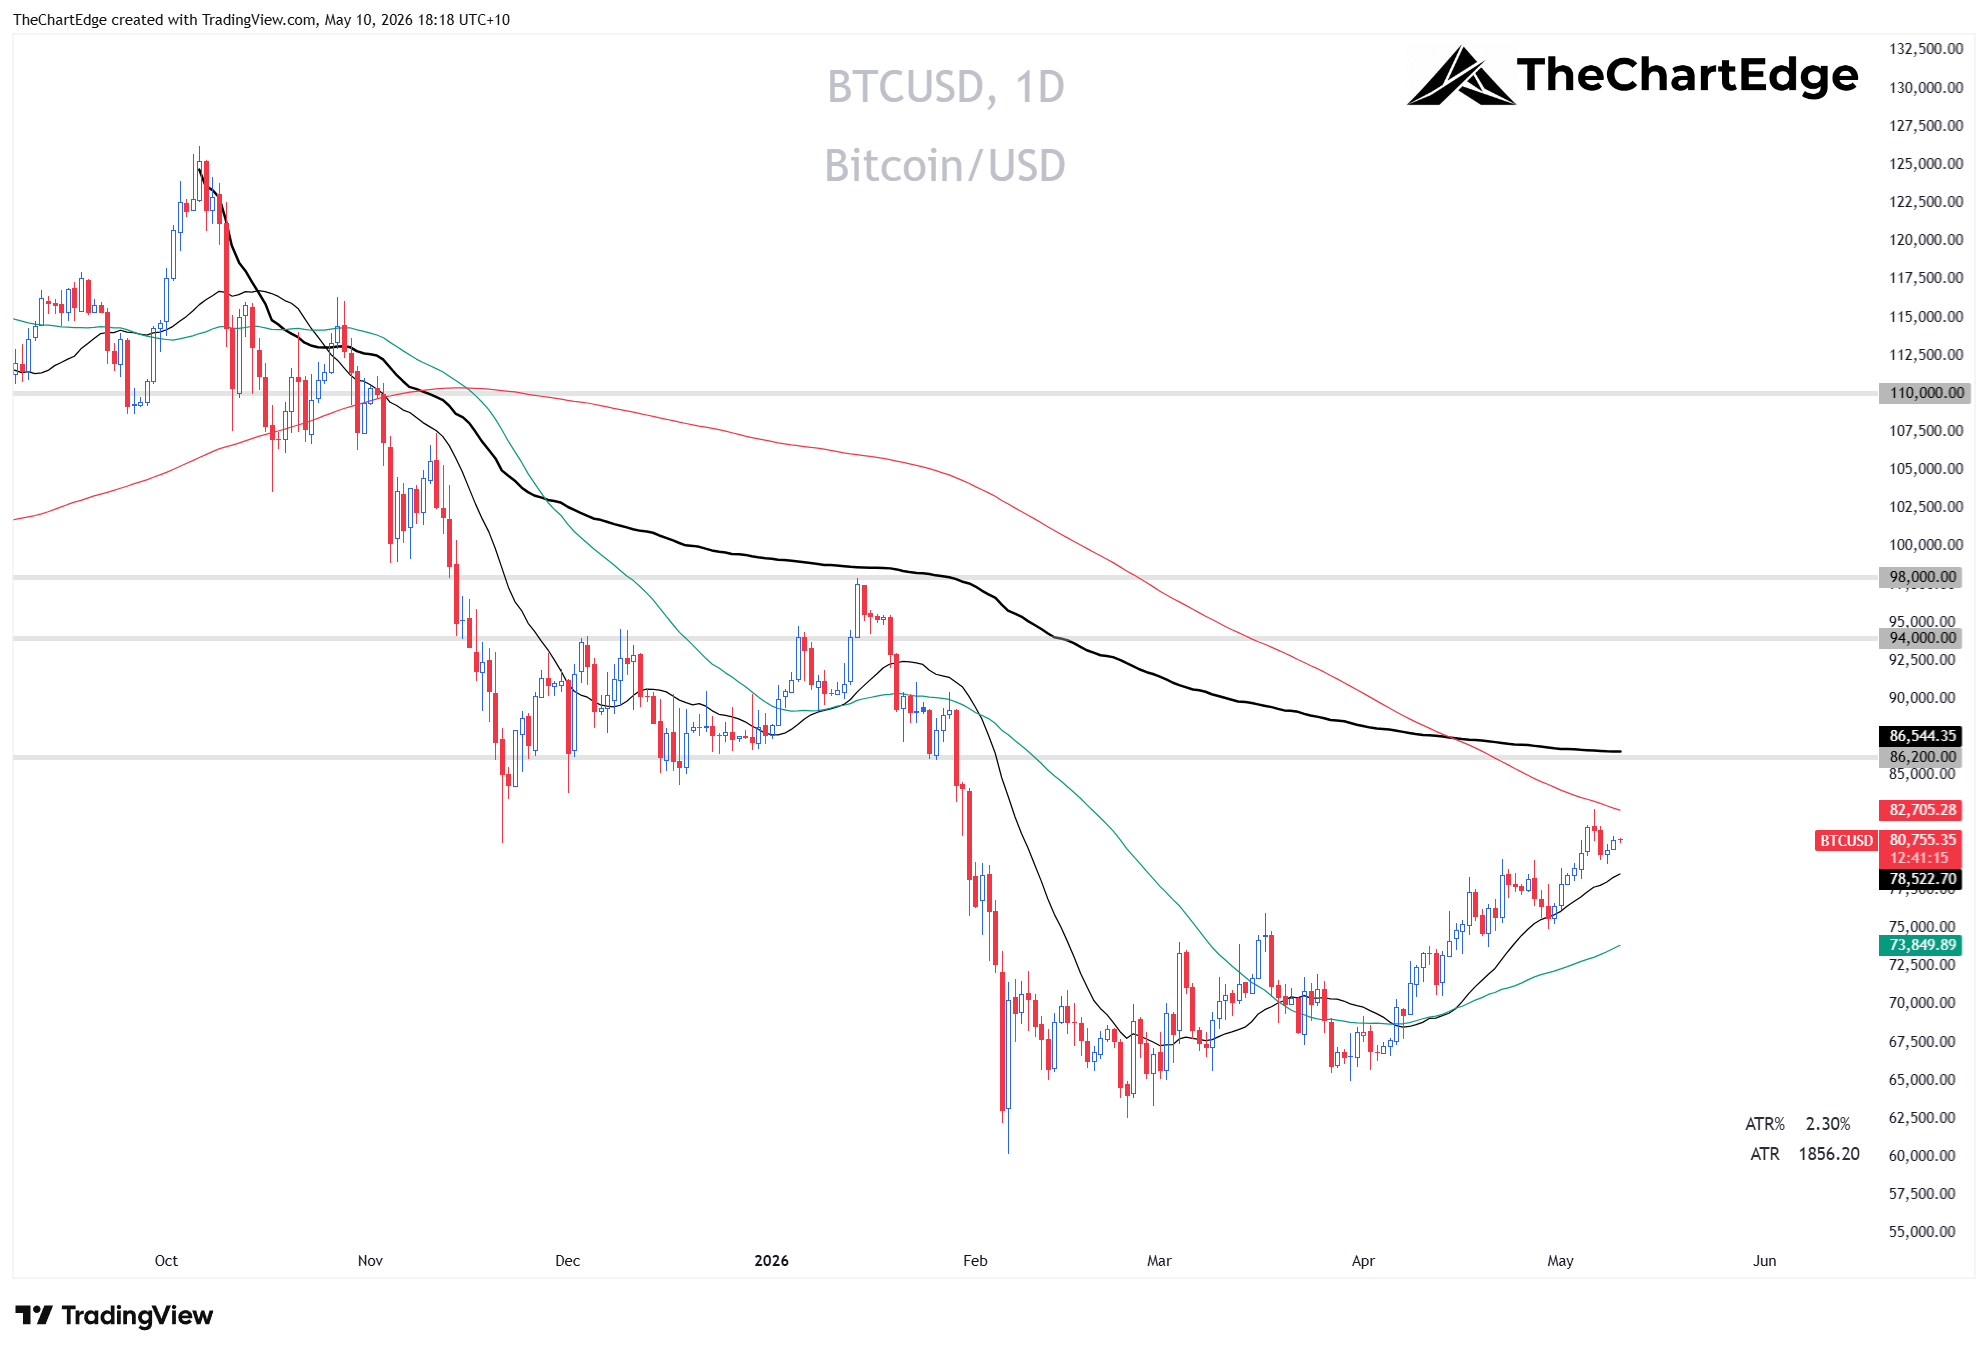
If BTC continues higher and can consolidate for 2-4 weeks between about $83K-86K and then breakout, that would be an ideal entry. I’ll be watching closely but not planning on buying now with the 200-day SMA (red line) and AVWAP from the all-time high (black line) just overhead. It may just rip through all that potential resistance but that’s OK, and if it does it will offer another better lower risk entry in the future.
Energy
Energy pulled back hard across the board last week. XLE was down 5.35%, XOP -6.51%, OIH -5.37%, USO -6.45%, and RSPG -5.99%. XOP, USO, and RSPG all dropped from Leading to Weakening. RS-Momentum fell sharply across all five names.
OIH and USO charts look the best of the bunch and are sitting right around their 20-day SMAs (OIH -0.87% below, USO -0.01%). XLE, XOP, and RSPG have pulled back below their 50-day SMAs (XLE -3.84% below its 50-day, XOP -3.23%, RSPG -2.93%).
OIH Chart
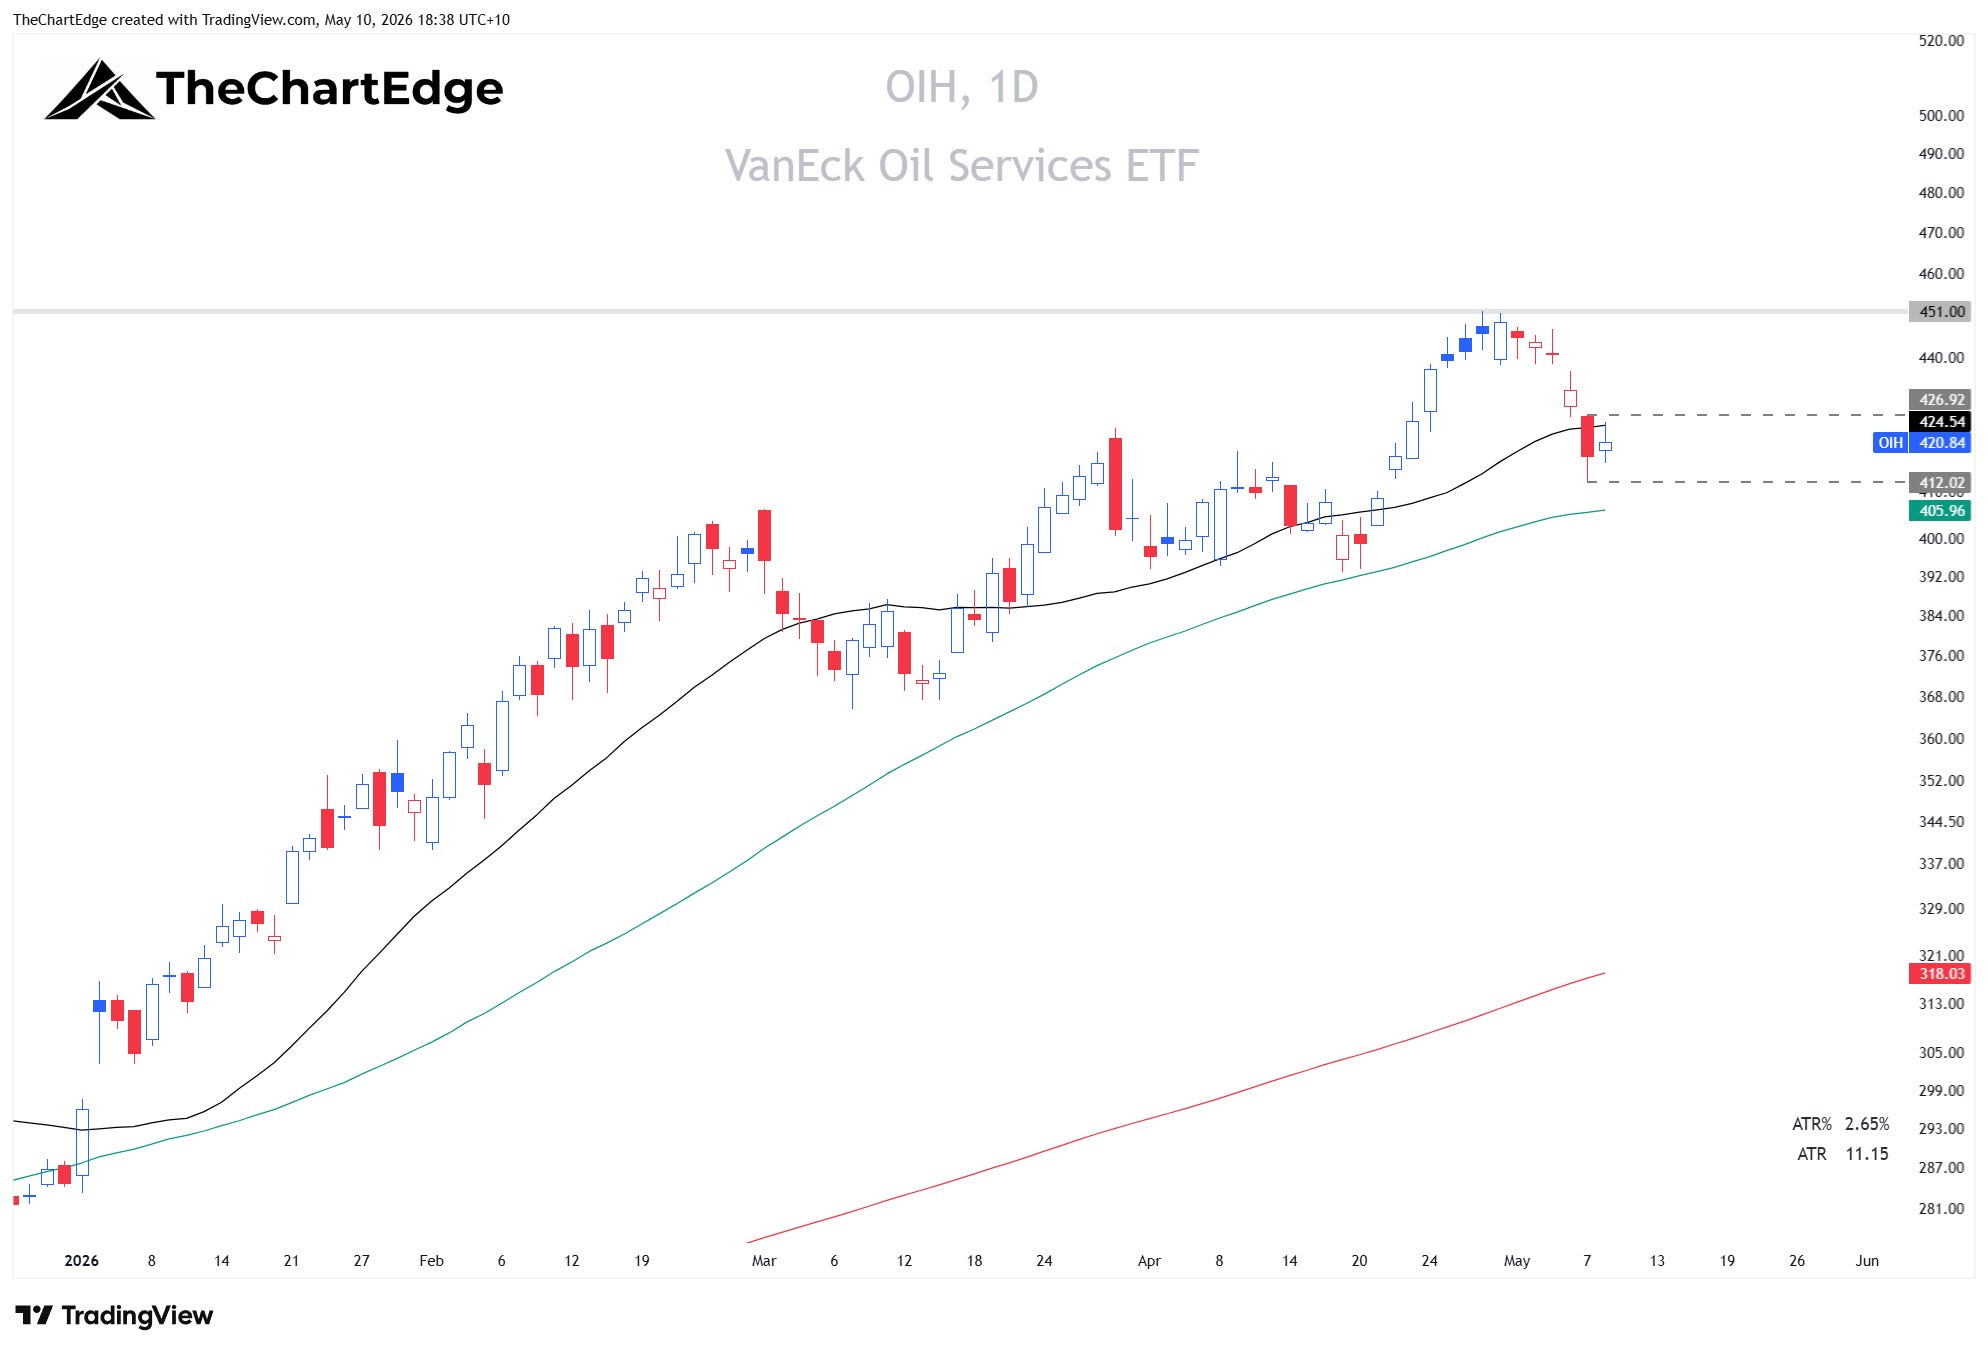
I’m considering a new trade in OIH, but would enter on strength above Thursday’s (May 7) high, with a stop under the low from the same day.
TAN
TAN (Solar) gained 4.50% and is sitting just 0.27% off its 52-week high. RS-Momentum at 99.44, just below the 100 line. Strong Uptrend and up 23.02% YTD.
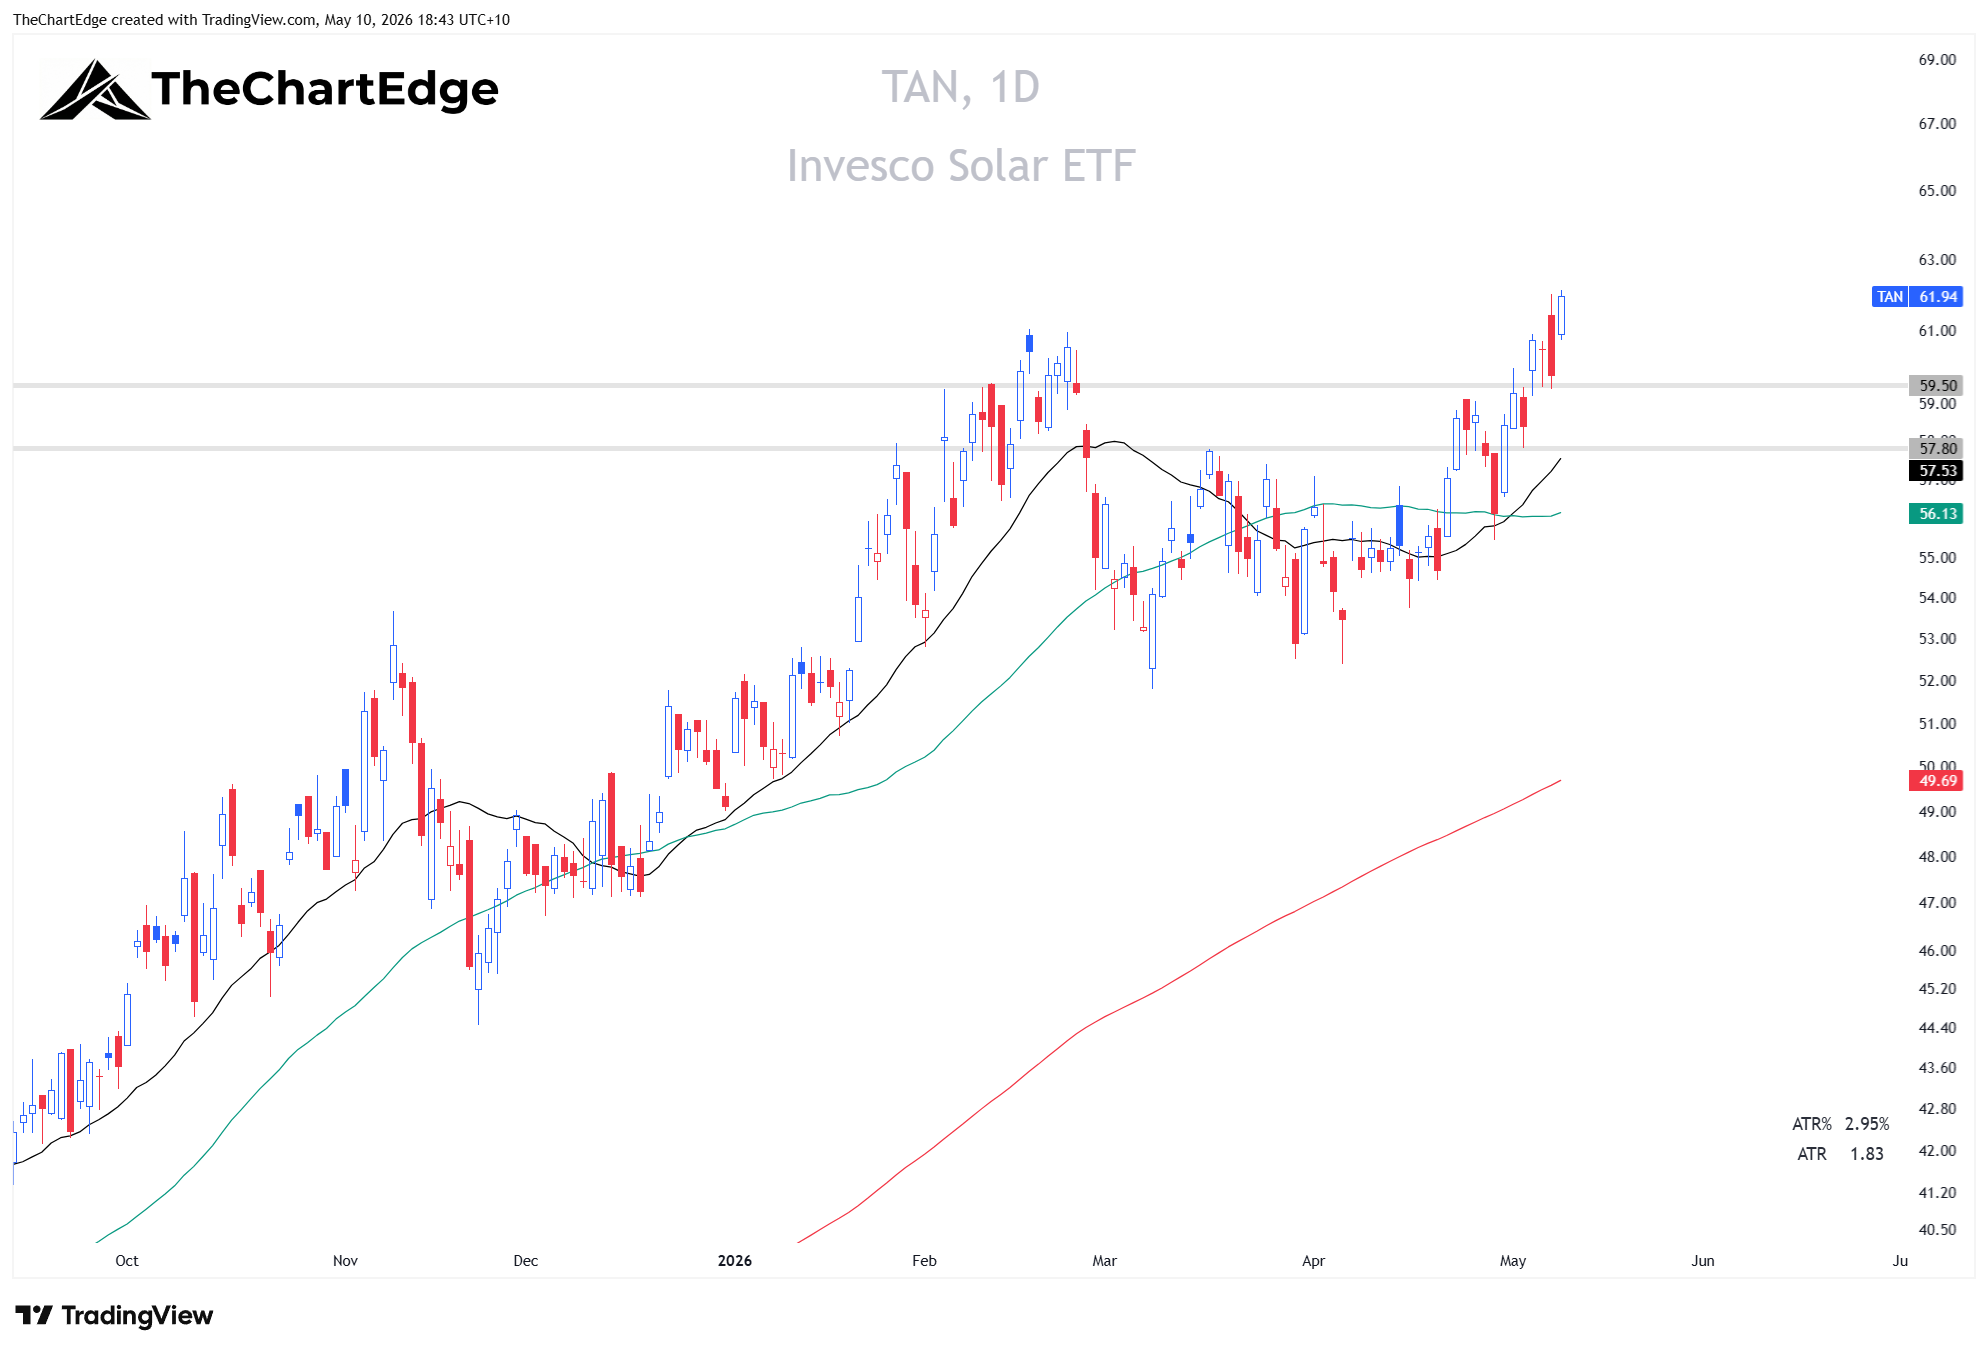
Watching TAN for an entry. Ideally would like a pullback toward $59.50 and see some support/signs of strength around the 20-day SMA which should keep rising towards that level over the next week or two.
COPX (Copper Miners)
COPX had a strong week, up 8.75%. The trend state flipped from Neutral to Strong Uptrend and RS-Momentum jumped from 88.17 to 97.46. Still in Weakening but accelerating. Still 14.02% from its 52-week high.
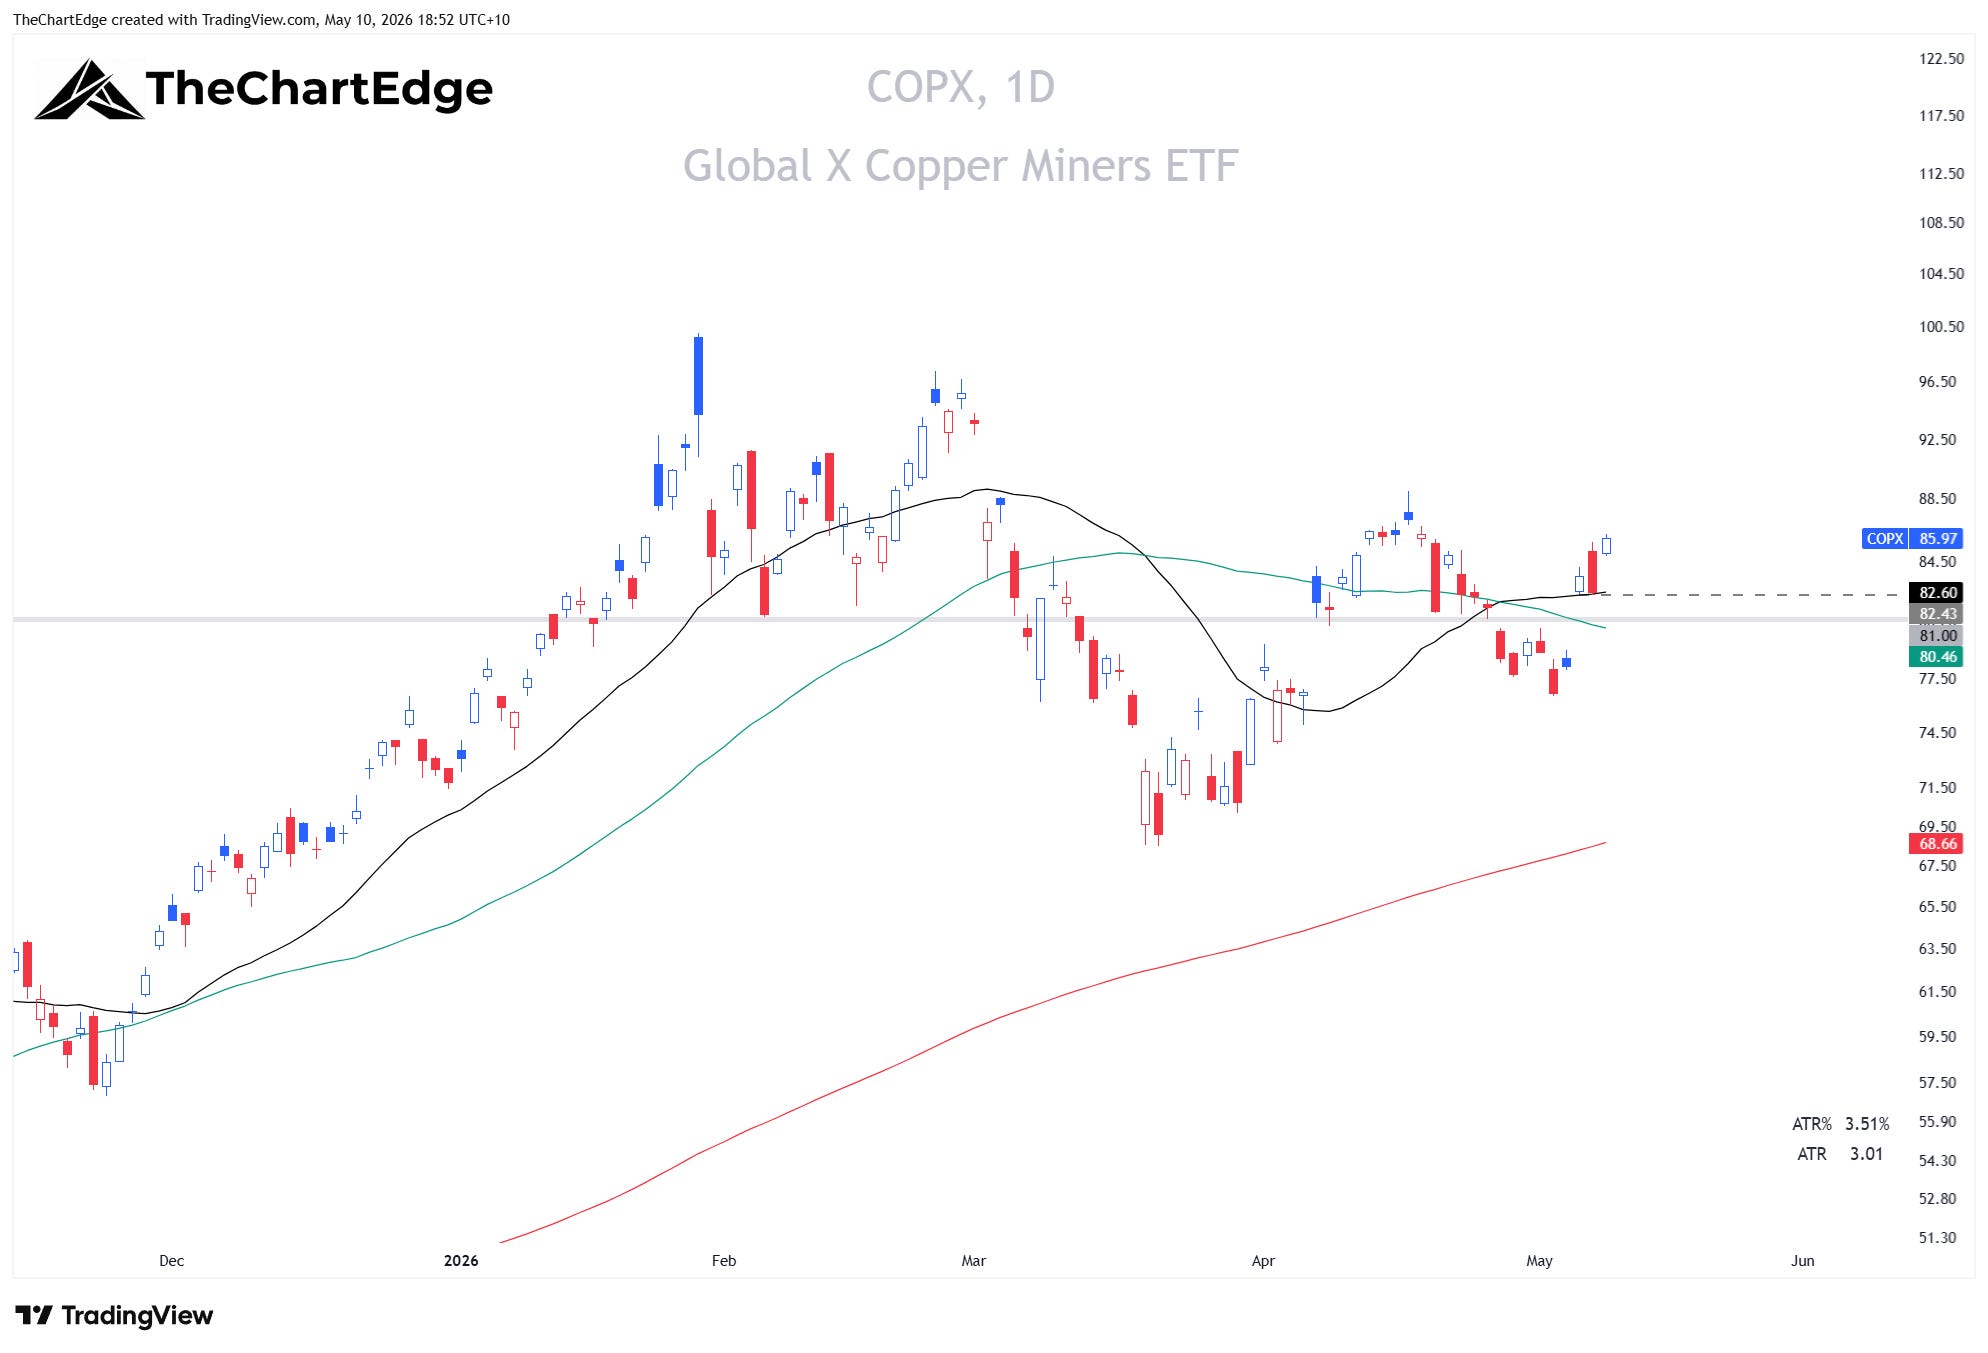
I am also considering taking a position in COPX. Would look to buy strength above Friday’s (May 8) high, with a stop under the low of the 6th, or maybe under $81 to give it a little more breathing room.
With the QQQ and SPY massively extended, driven by tech, semis and AI names, the question becomes how will this resolve itself in the near-term? Will we see a continuation of this explosive performance leading to a massive “blow-off” top, a sharp mean-reversion move in the leaders or just a mild pullback or consolidation while money rotates into some of the laggards. Unfortunately, I don’t have a crystal ball, but in my opinion, given the level of extension in the leaders, it’s prudent to take at least some partial profits on big winners and/or tighten your trailing stops. I won’t be deploying a lot of new capital here, but considering small positions in TAN on a pullback, COPX and OIH on strength, and ARKQ, which just rotated into the Leading quadrant.
Stay open-minded and manage risk tightly.
Cheers,
Marcus Grant, CFTe
Disclaimer: The content provided in this newsletter is for informational and educational purposes only and should not be considered as financial, investment, or legal advice. The information shared is based on our research and analysis, but we are not a licensed financial advisor, nor can we guarantee its accuracy, completeness, or timeliness. Market conditions and financial instruments can change rapidly, and any opinions expressed may not be suitable for all investors. Any opinions expressed and/or securities mentioned do not constitute a recommendation to buy, sell, or hold that or any other security. You should conduct your own due diligence and consult with a licensed financial advisor or other professional before making any investment decisions. Past performance is not indicative of future results, and all investments carry the risk of loss. The authors and publishers of this newsletter are not responsible for any financial decisions made based on the content provided herein. By reading and/or subscribing to this newsletter, you acknowledge and agree that you are using the information at your own risk.