


Everything below is as of Friday September 25 close.
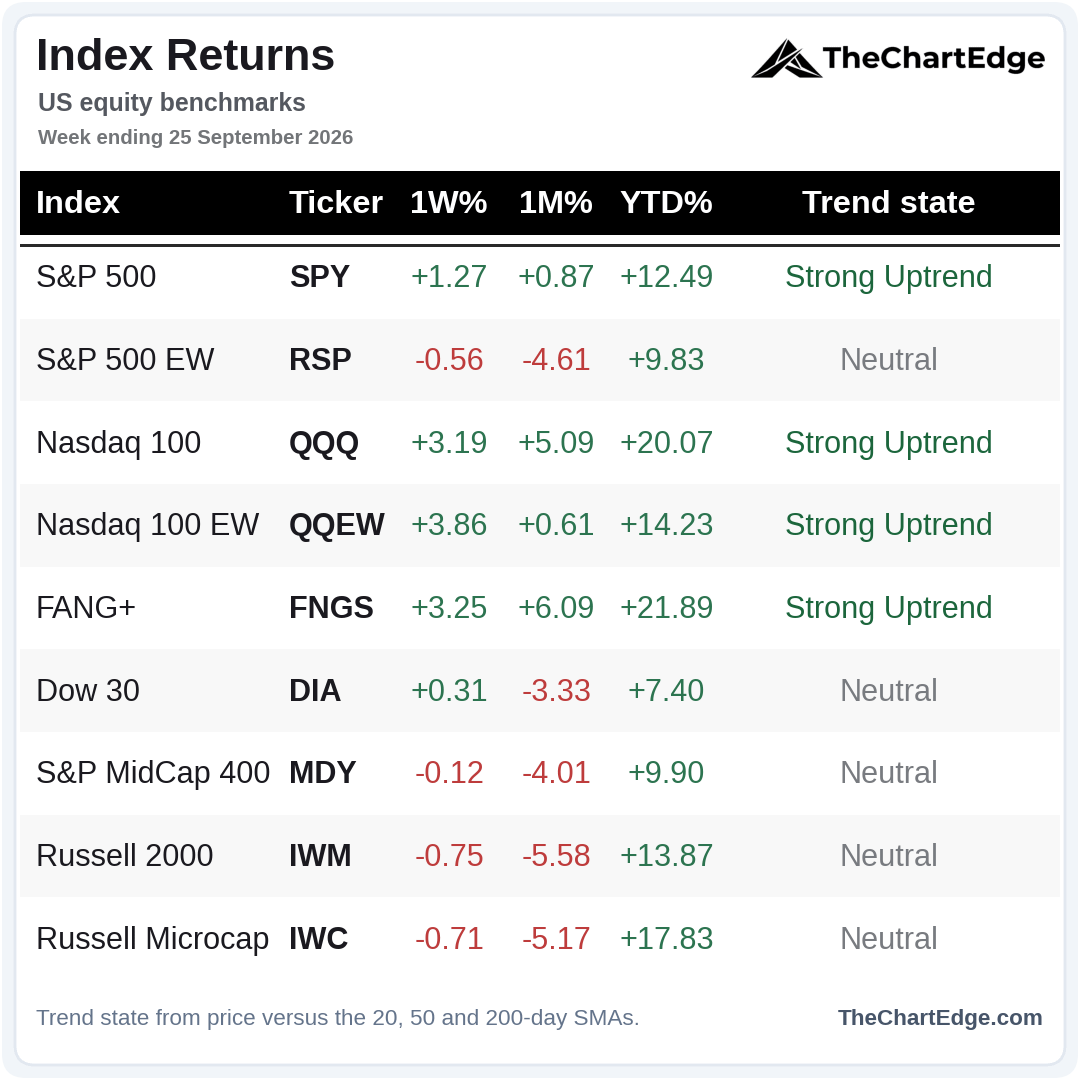
Of the major indices I track, 5 of the 9 finished the week higher, led again by tech and mega-caps. The equal-weight S&P 500, mid-caps, small caps and micro-caps all finished lower and remain under declining 20 and 50-day SMAs.
S&P 500 (SPY) Chart
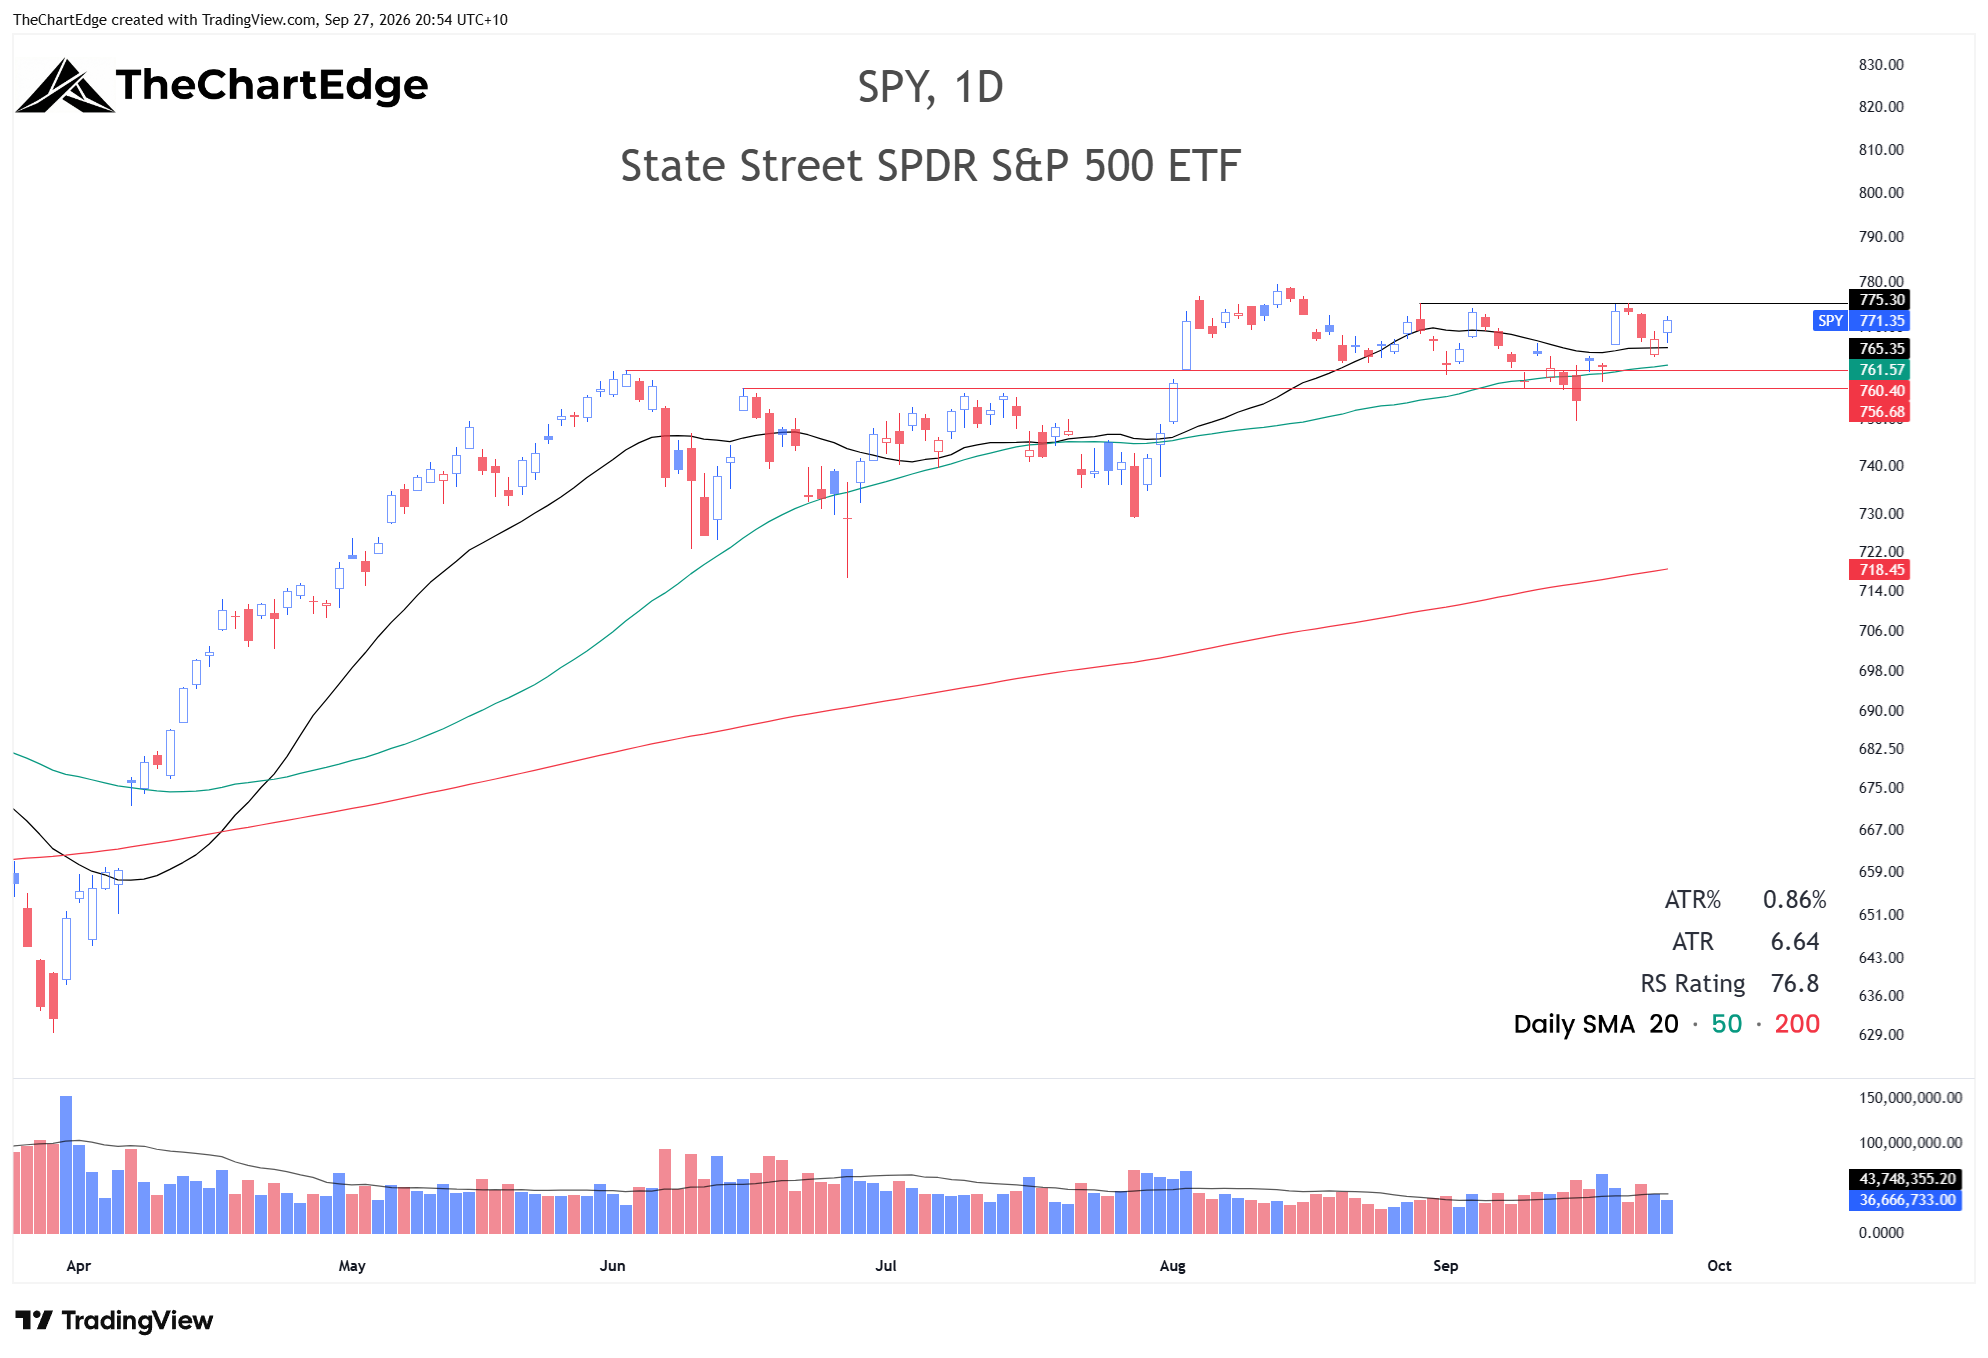
SPY closed at 771.35, back above its 20-day SMA and back in the Strong Uptrend state, just 1.0% below its all-time high. After a big gap up and push higher on Monday, SPY held above its 20-day on a closing basis all week. It dipped below the 20-day intraday on Thursday - undercutting Monday’s low and partially filling the gap - but reclaimed it by the close and finished the week strongly. For now, the sideways action continues - I’m watching 775 on the upside and 760 on the downside.
Nasdaq 100 (QQQ) Chart
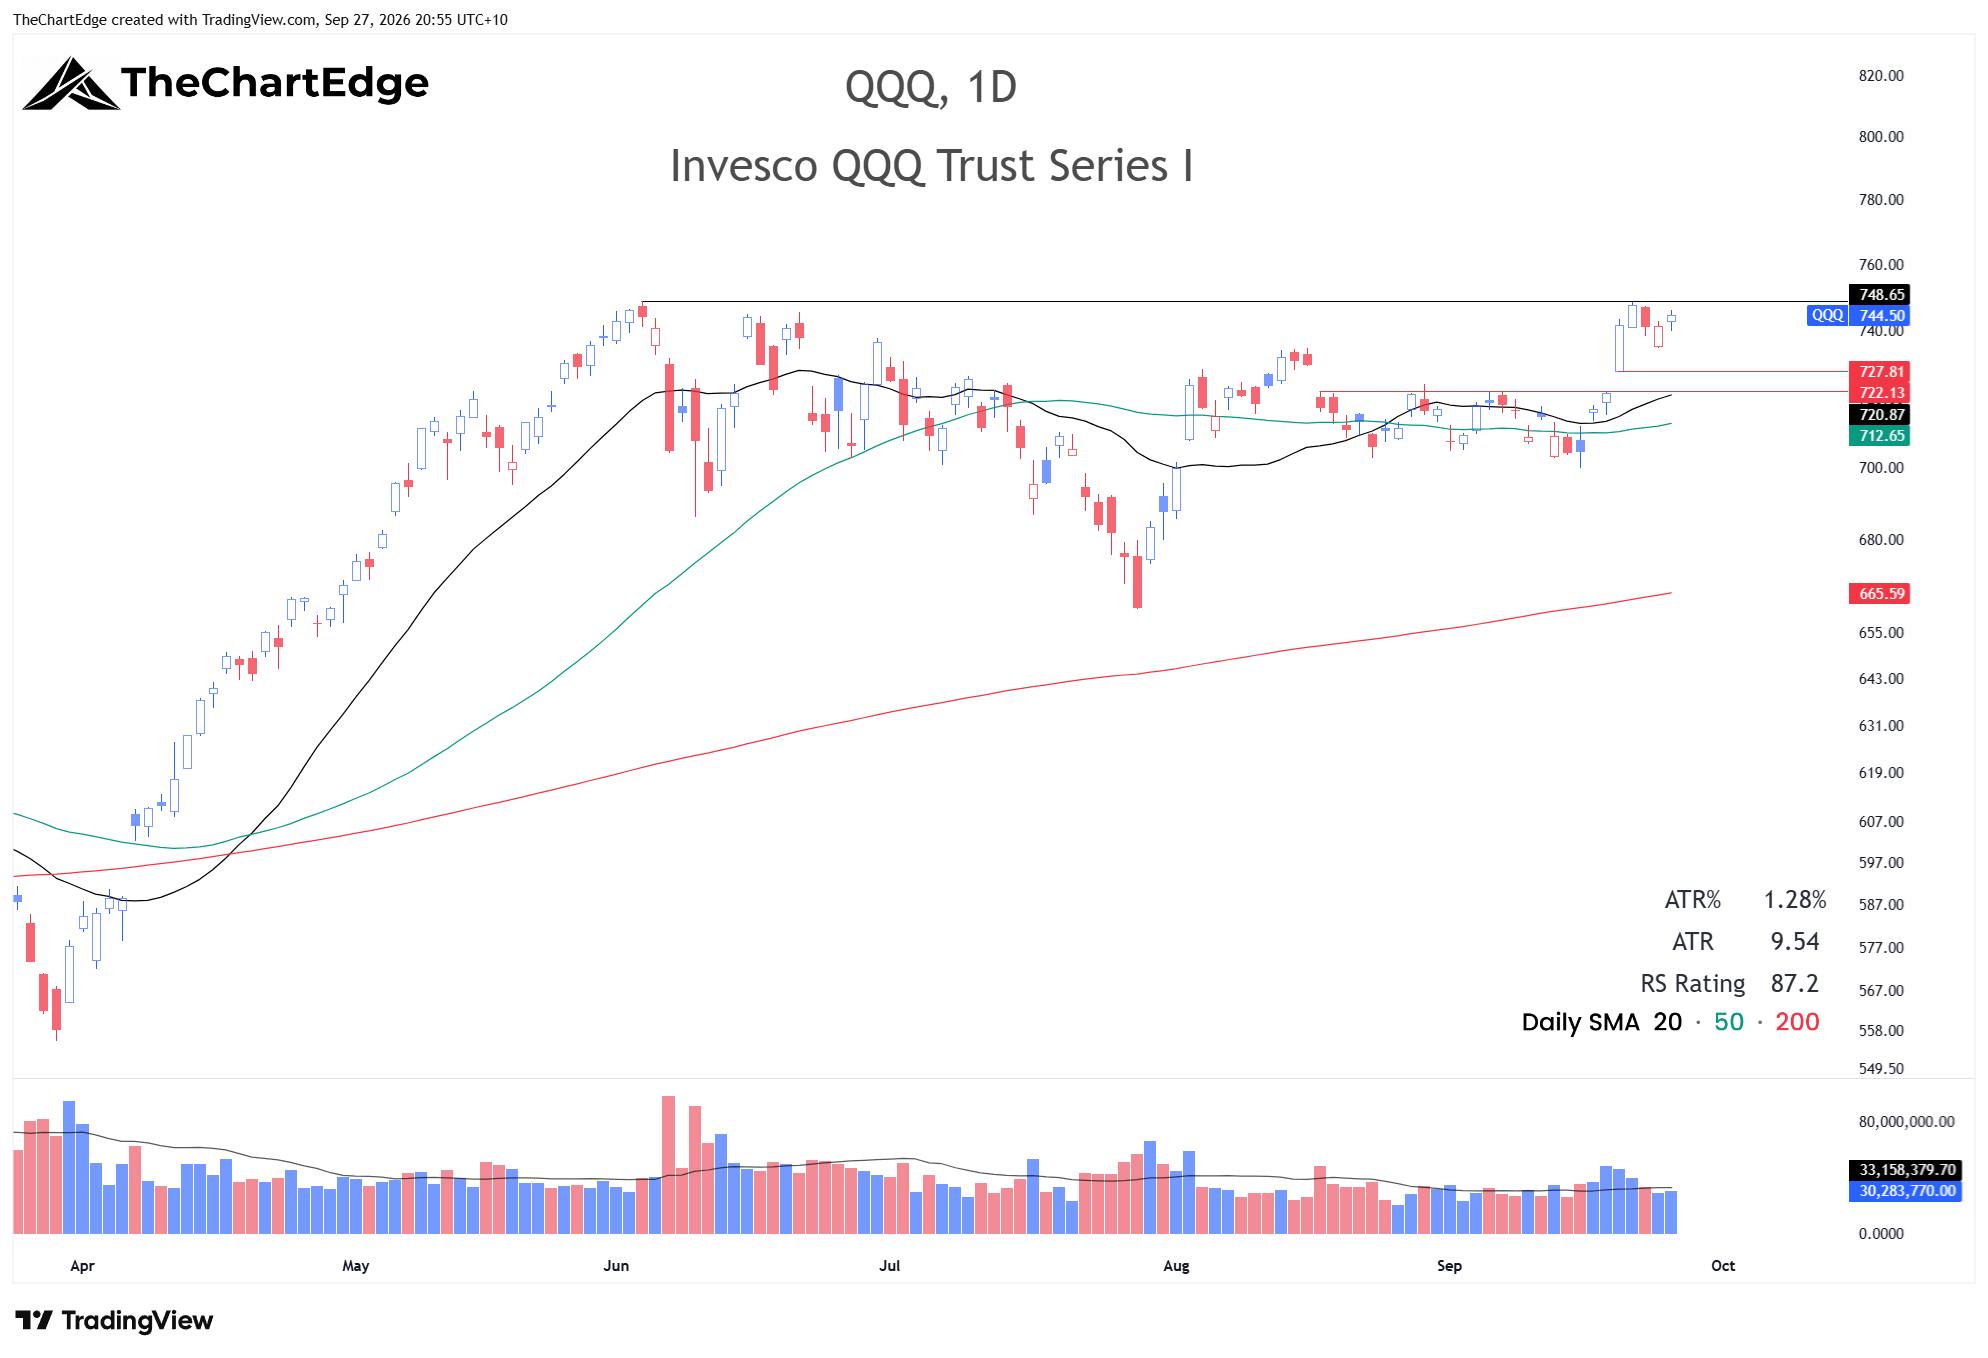
QQQ had a strong week, finishing at 744.50 - an all-time weekly closing high. After Monday’s gap up, it never tested Monday’s low, let alone its 20-day SMA. I am in wait and see mode now and would likely only take a position if it sets a higher low above the 20-day on a mild pullback or if it can trade tightly under all-time highs for a week or two, allowing the 20-day to catch up to price.
FANG+ (FNGS) Chart
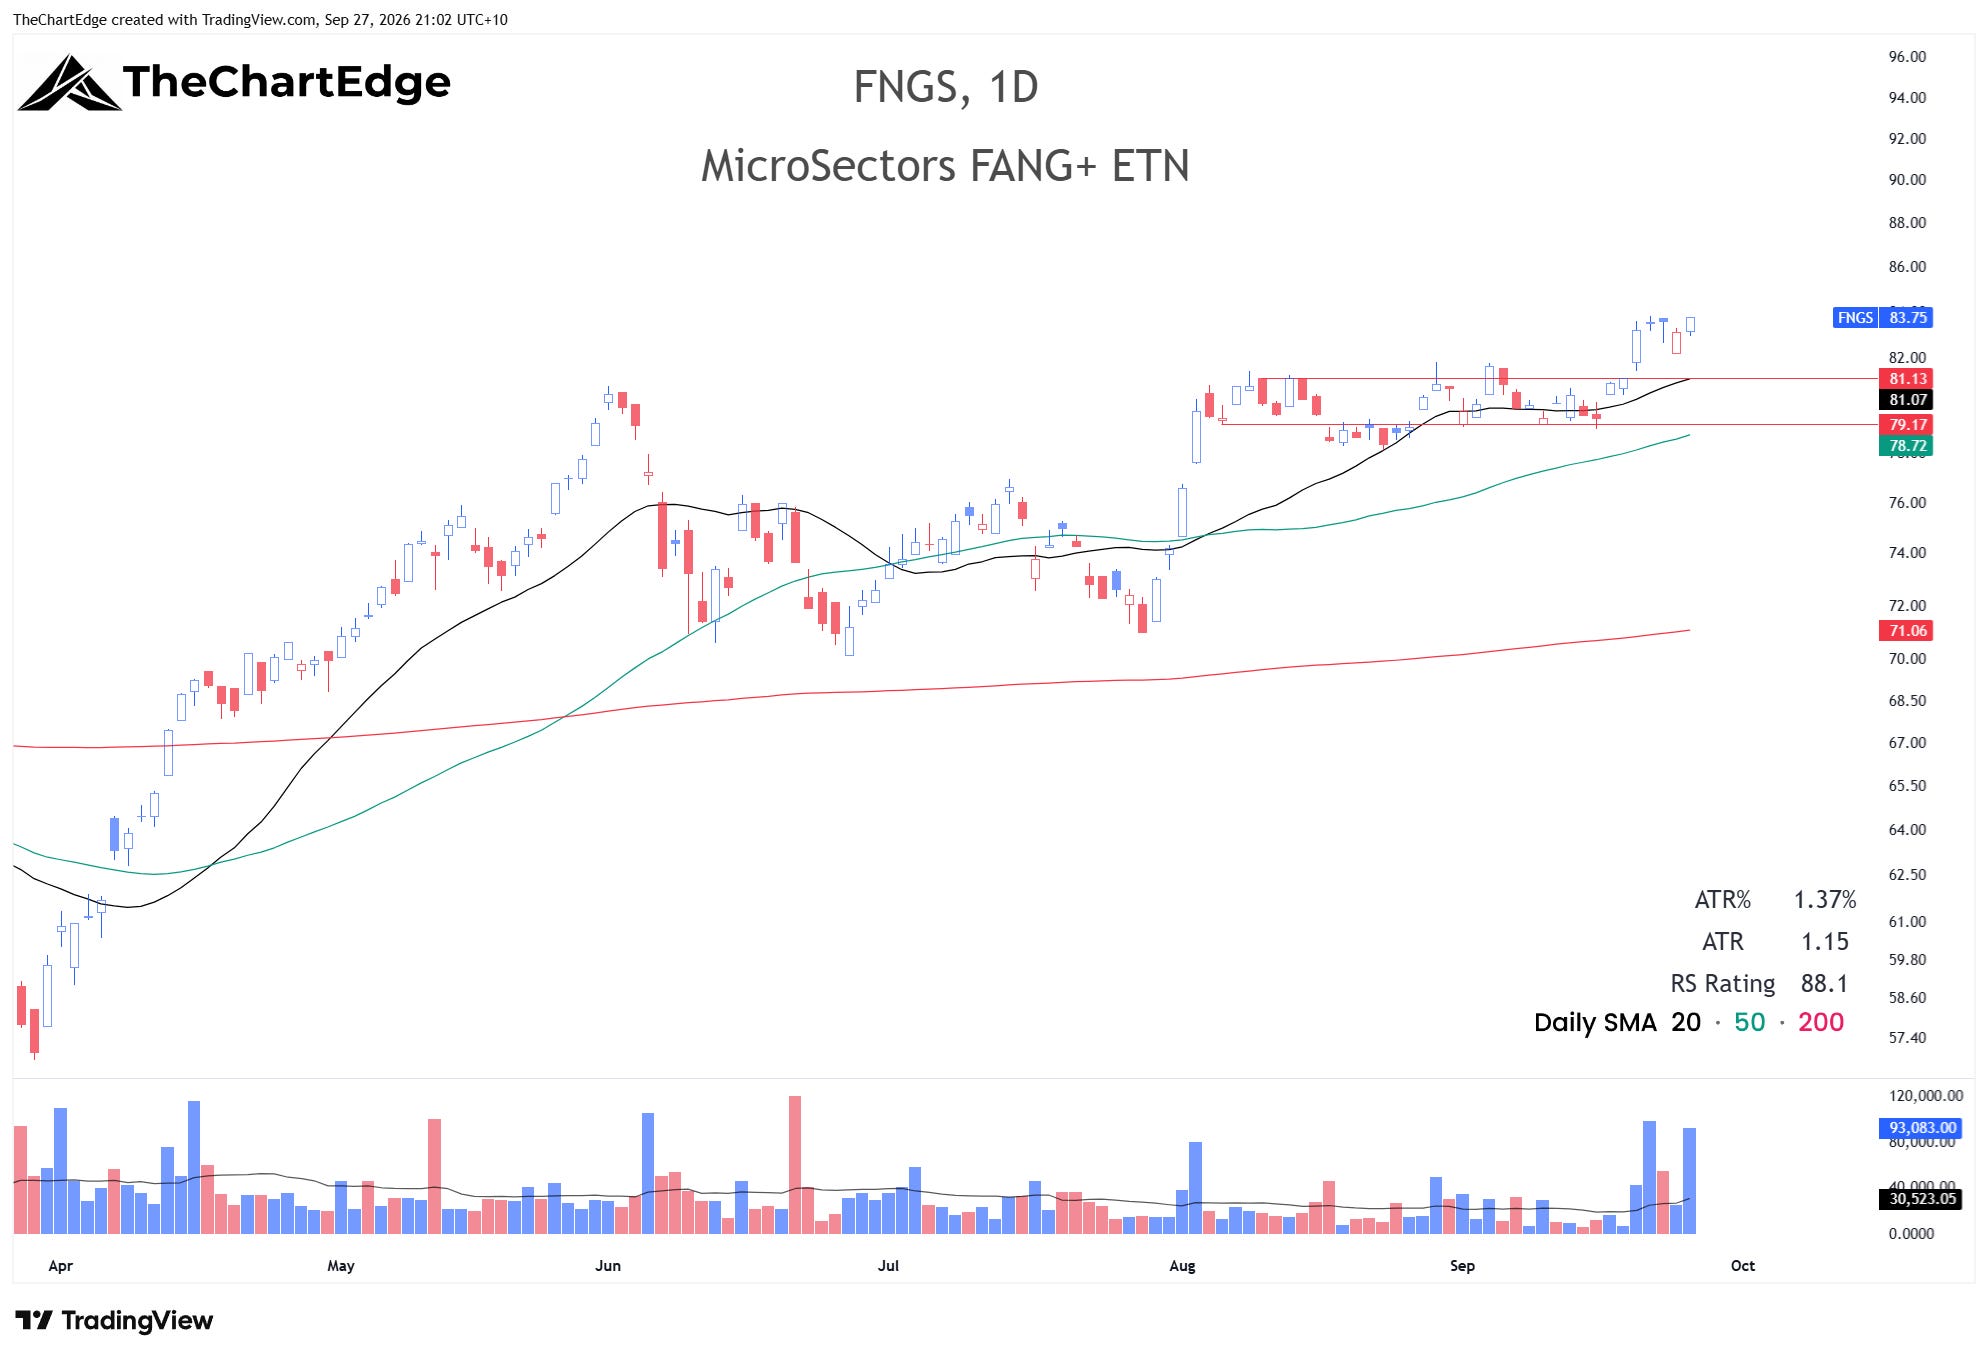
FNGS finished the week at 83.75, a closing all-time high. The tight action I was hoping for to provide a low-risk entry did not occur, as it also gapped up on Monday with SPY and QQQ.
Market Temperature
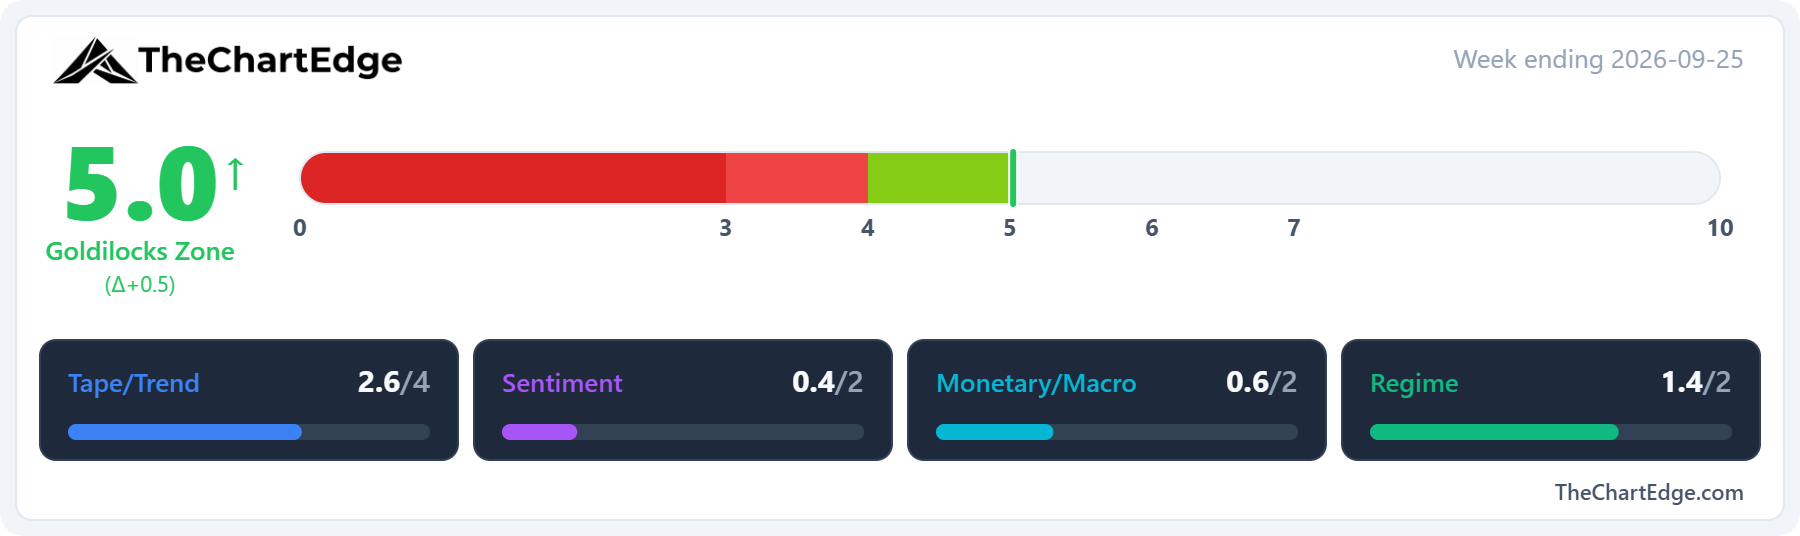
The Market Temperature came in at 5.0, up from 4.5, and is back in the Goldilocks Zone, but only just.
Most of the Tape/Trend gain came from SPY moving back into a Strong Uptrend and its weekly RSI rising to 63.2 from 60.1. However, breadth deteriorated again - only 30.2% of US stocks finished above their 50-day moving average, from 34.0% last weekend and 39.7% two weeks ago. The 200-day measure fell to 45.8% from 48.0% last weekend and 51.7% two weeks ago. Both scored slightly better than last weekend though, as the two-week look-back now compares against a lower reading.
The Regime pillar rose almost entirely due to growth (IWF) outperforming value (IWD), which the model now reads as neutral rather than value-led.
The Monetary/Macro pillar fell, mostly due to the MOVE index jumping to 96.0 from 80.6, against a four-week comparison near 71. Credit spreads also weighed a little, with high yield (HYG) falling more than Treasuries (IEI) last week.
The Sentiment pillar was unchanged to one decimal place, with the VIX at 14.9 from 14.8.
GICS Sector Relative Strength
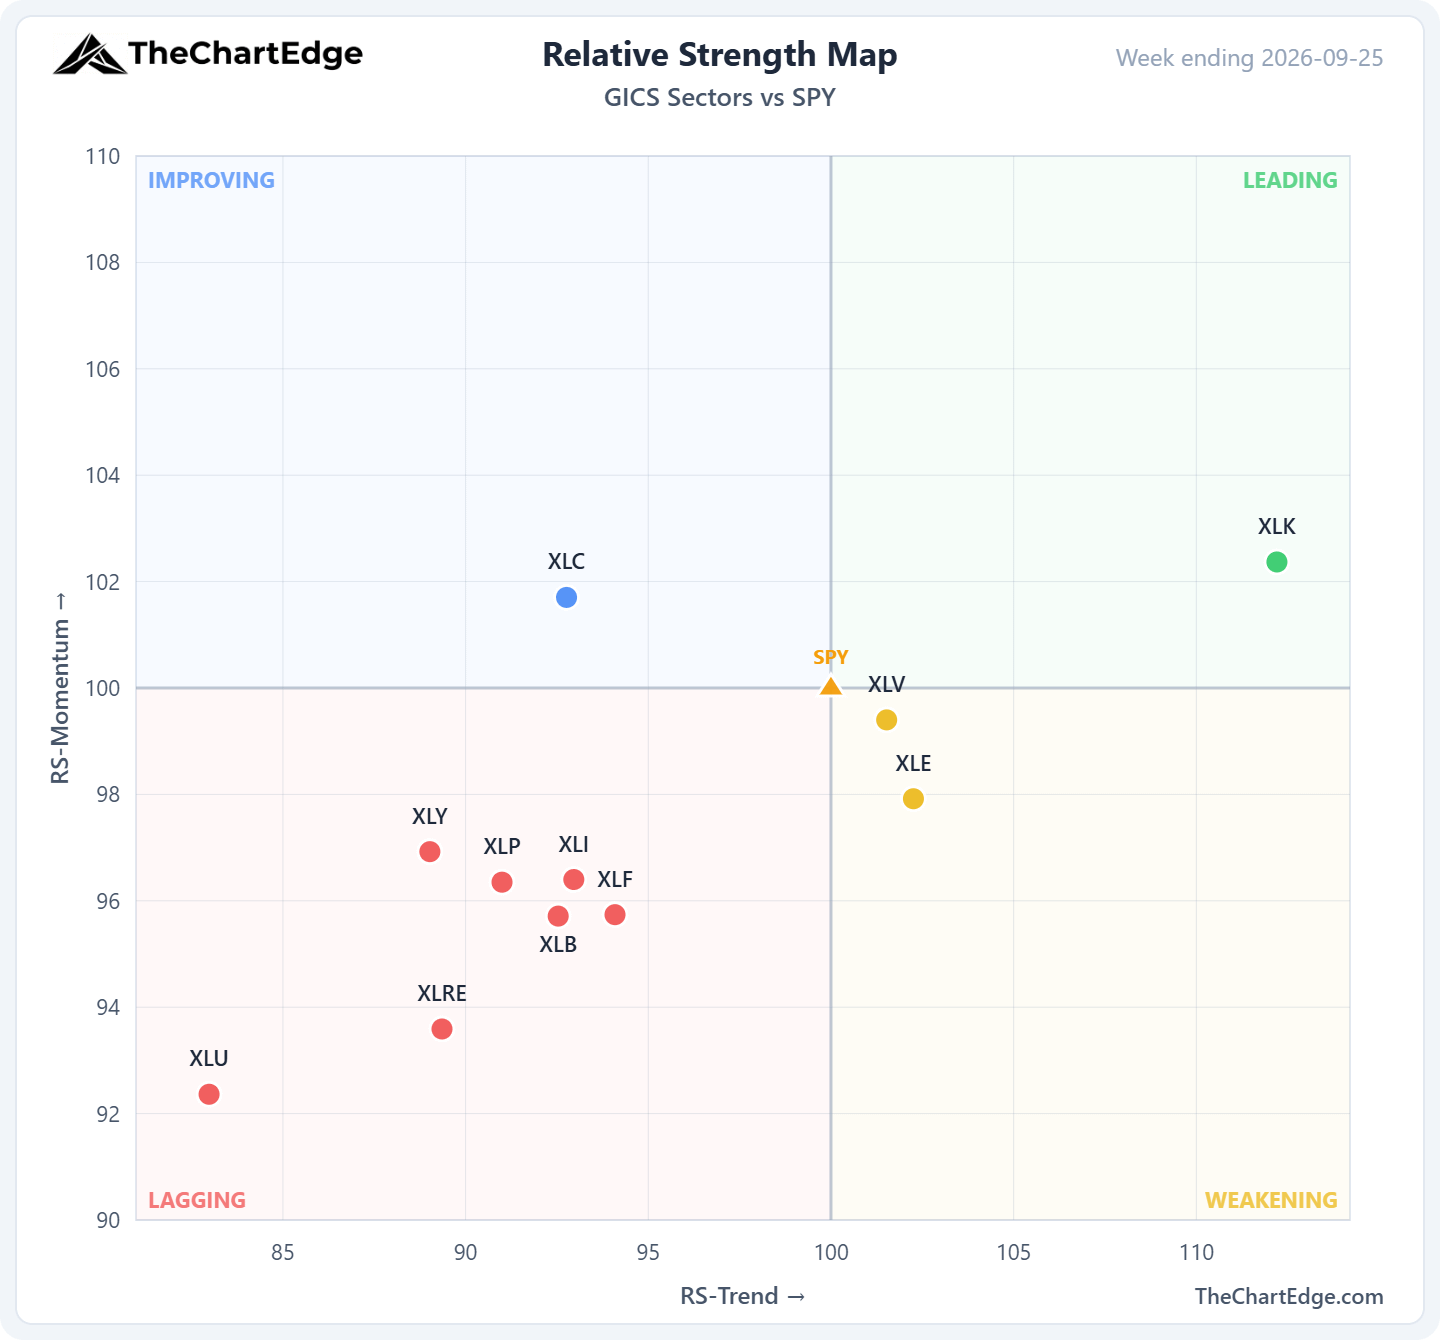
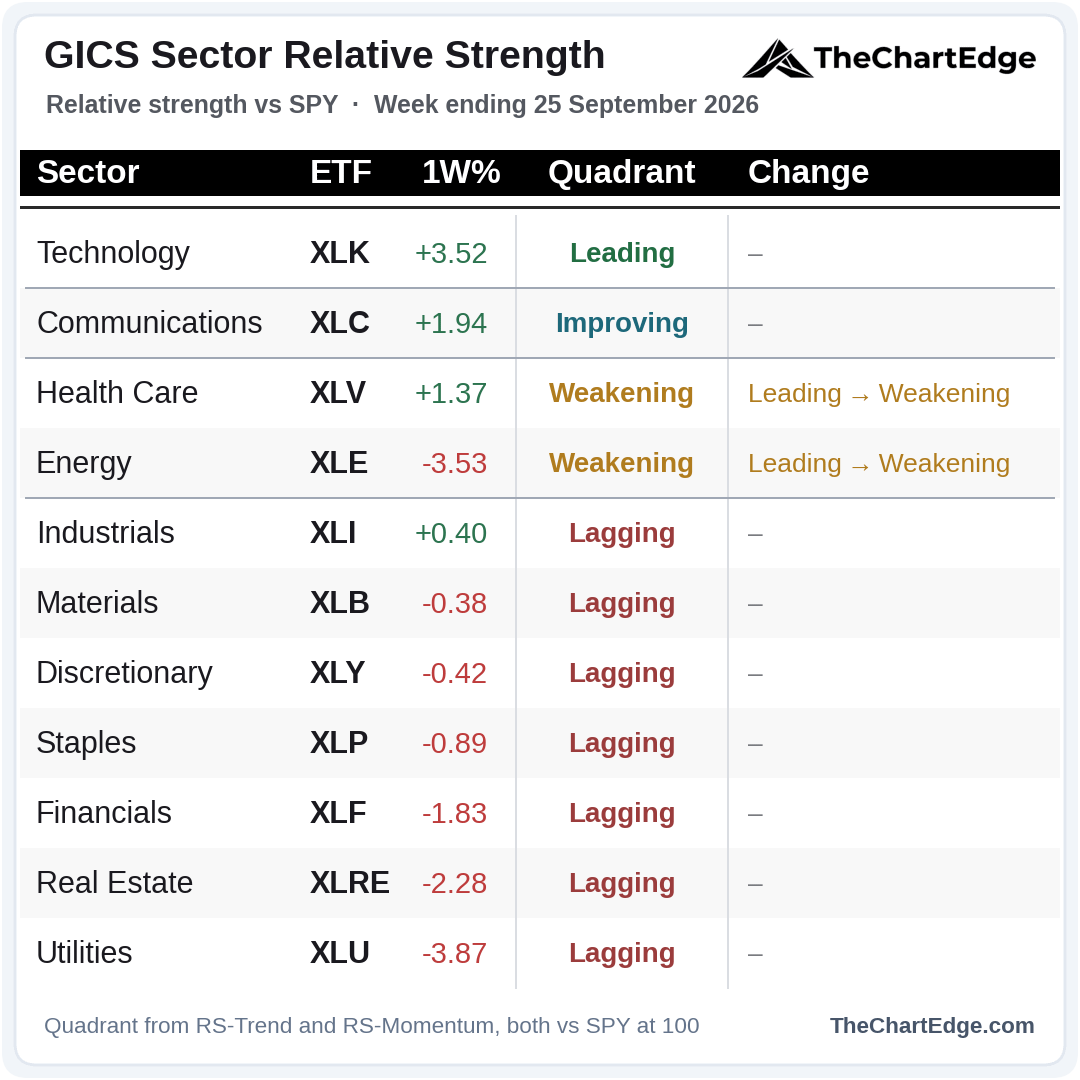
Technology, communications, health care and industrials were the only sectors to finish higher. Technology is now the only sector in Leading, as health care and energy both moved into Weakening - despite health care finishing higher.
Momentum Leaderboard
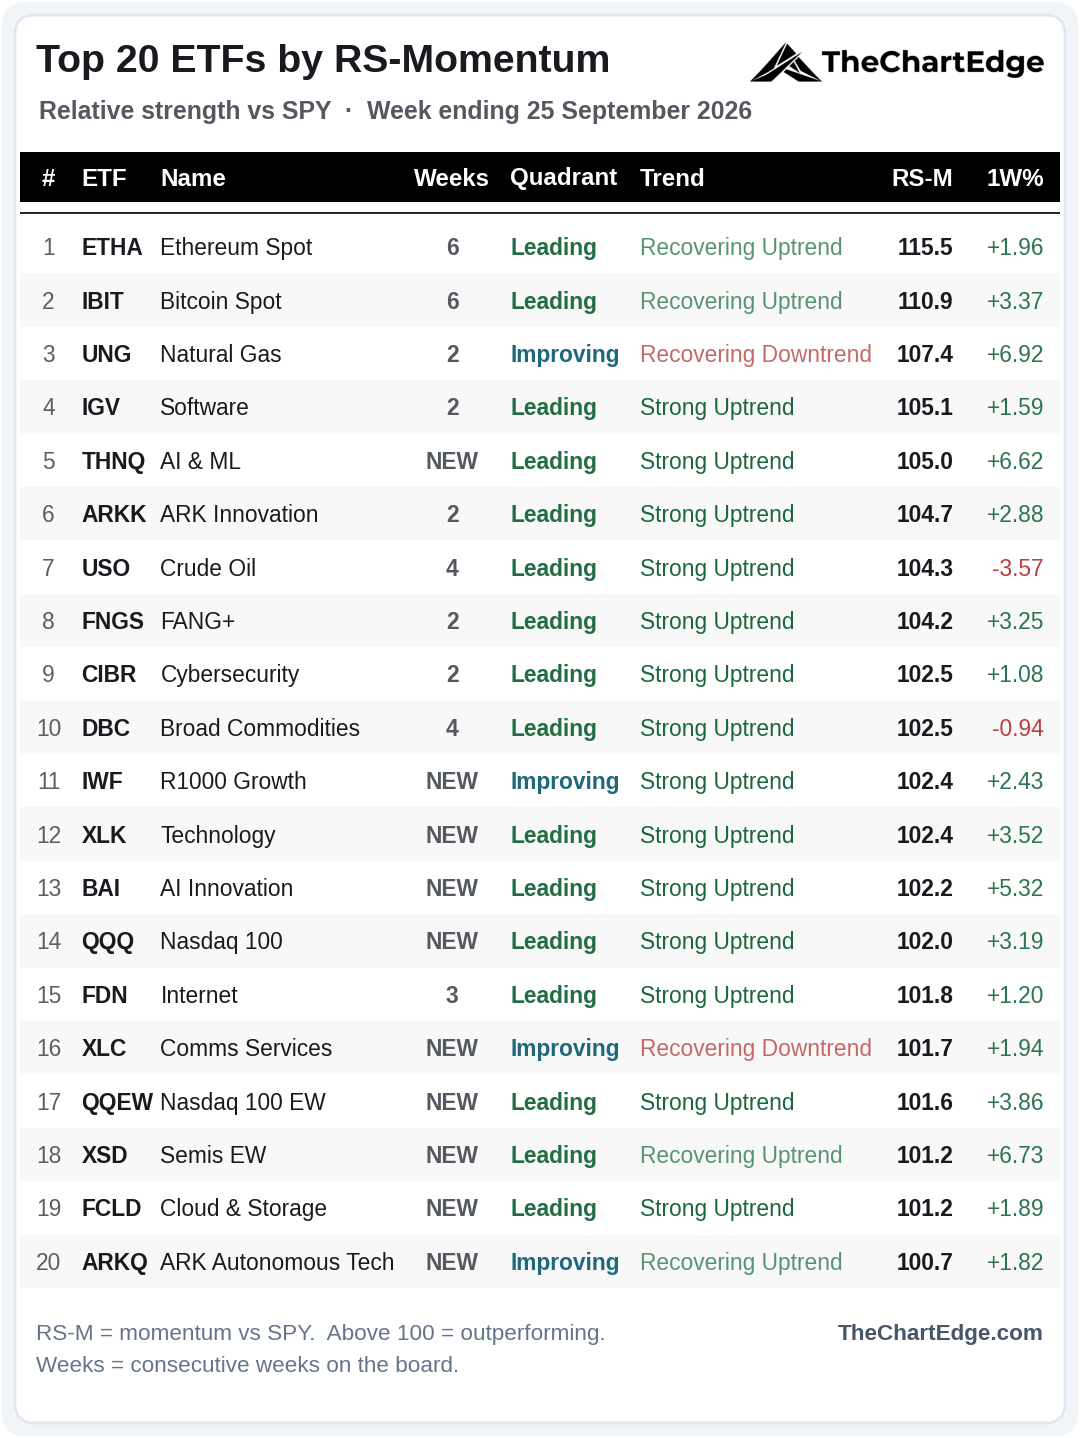
10 of the 20 are new this weekend, and they’re almost all tech and growth: AI (THNQ and BAI), technology (XLK), equal-weight semis (XSD), the Nasdaq 100 (QQQ and QQEW), growth (IWF), cloud computing (FCLD), communications (XLC) and ARK Autonomous Tech (ARKQ).
Anti-Beta (BTAL) and the US dollar (UUP) are gone, along with Silver (SLV), Platinum (PPLT), Brazil (EWZ), Crypto Miners (WGMI), equal-weight software (XSW), the health care pair of RSPH and XLV, and Genomics (ARKG).
Ethereum (ETHA) holds number 1 for a sixth straight week (I undercounted this in the last two posts) and shares the longest streak on the board with Bitcoin (IBIT).
14 of the 20 are in Strong Uptrends, from 6 last weekend.
Trend States Across the Universe
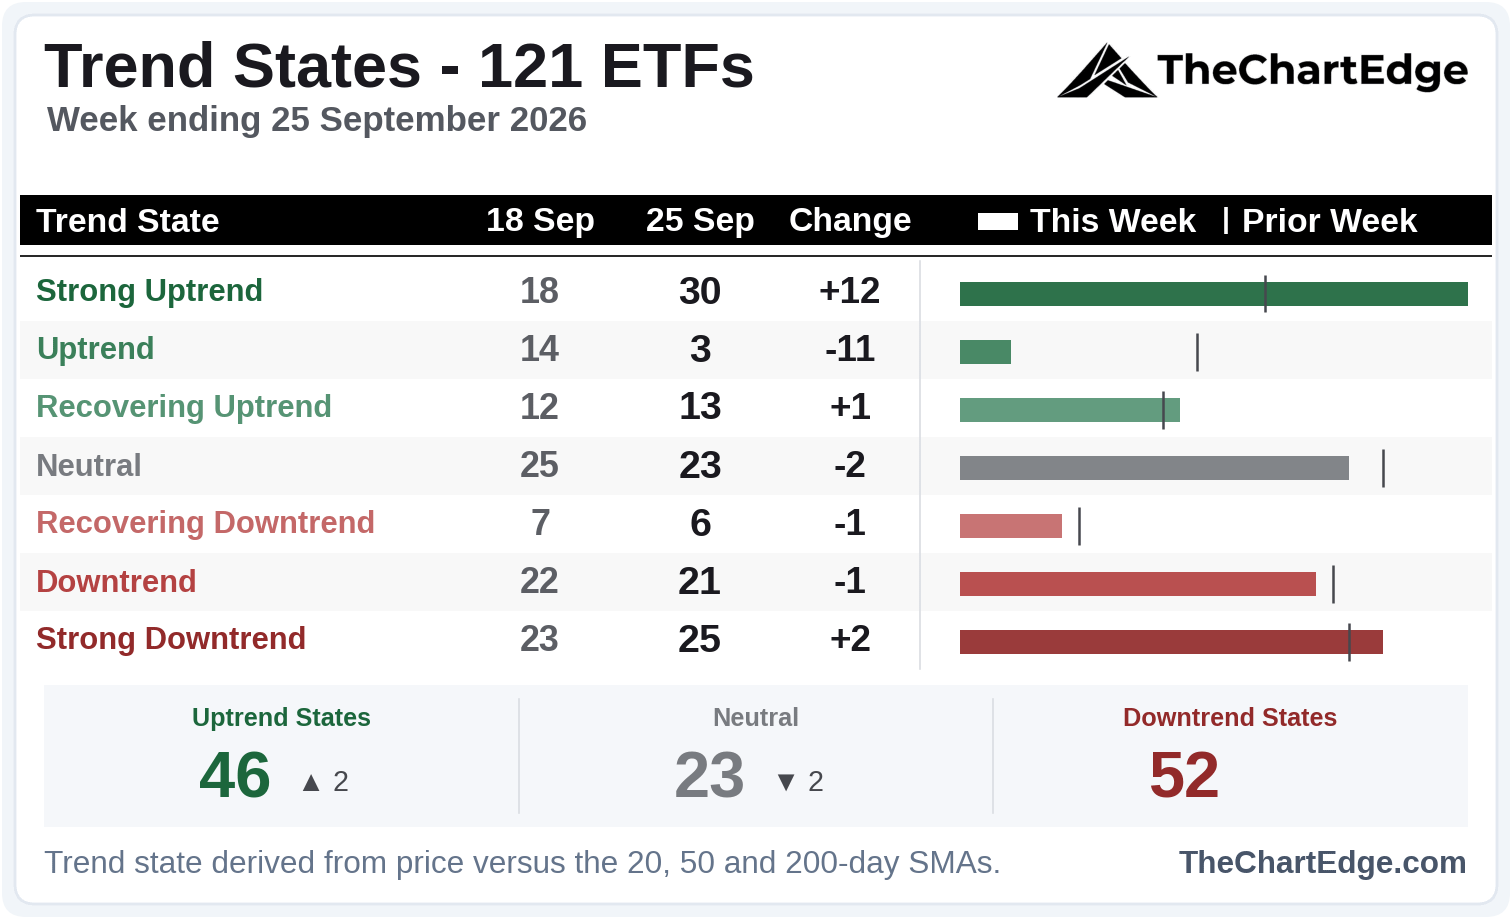
The jump in Strong Uptrends was mostly names moving up within their uptrends - SPY, software (IGV), internet (FDN), XLV and IBB came up from Uptrend, and SMH, AI Innovation (BAI) and Quantum & AI (QTUM) from Recovering Uptrend. Only 2 more ETFs are in uptrend states in aggregate and are still outnumbered by those in downtrend states.
Industry Breadth - Leading Stocks
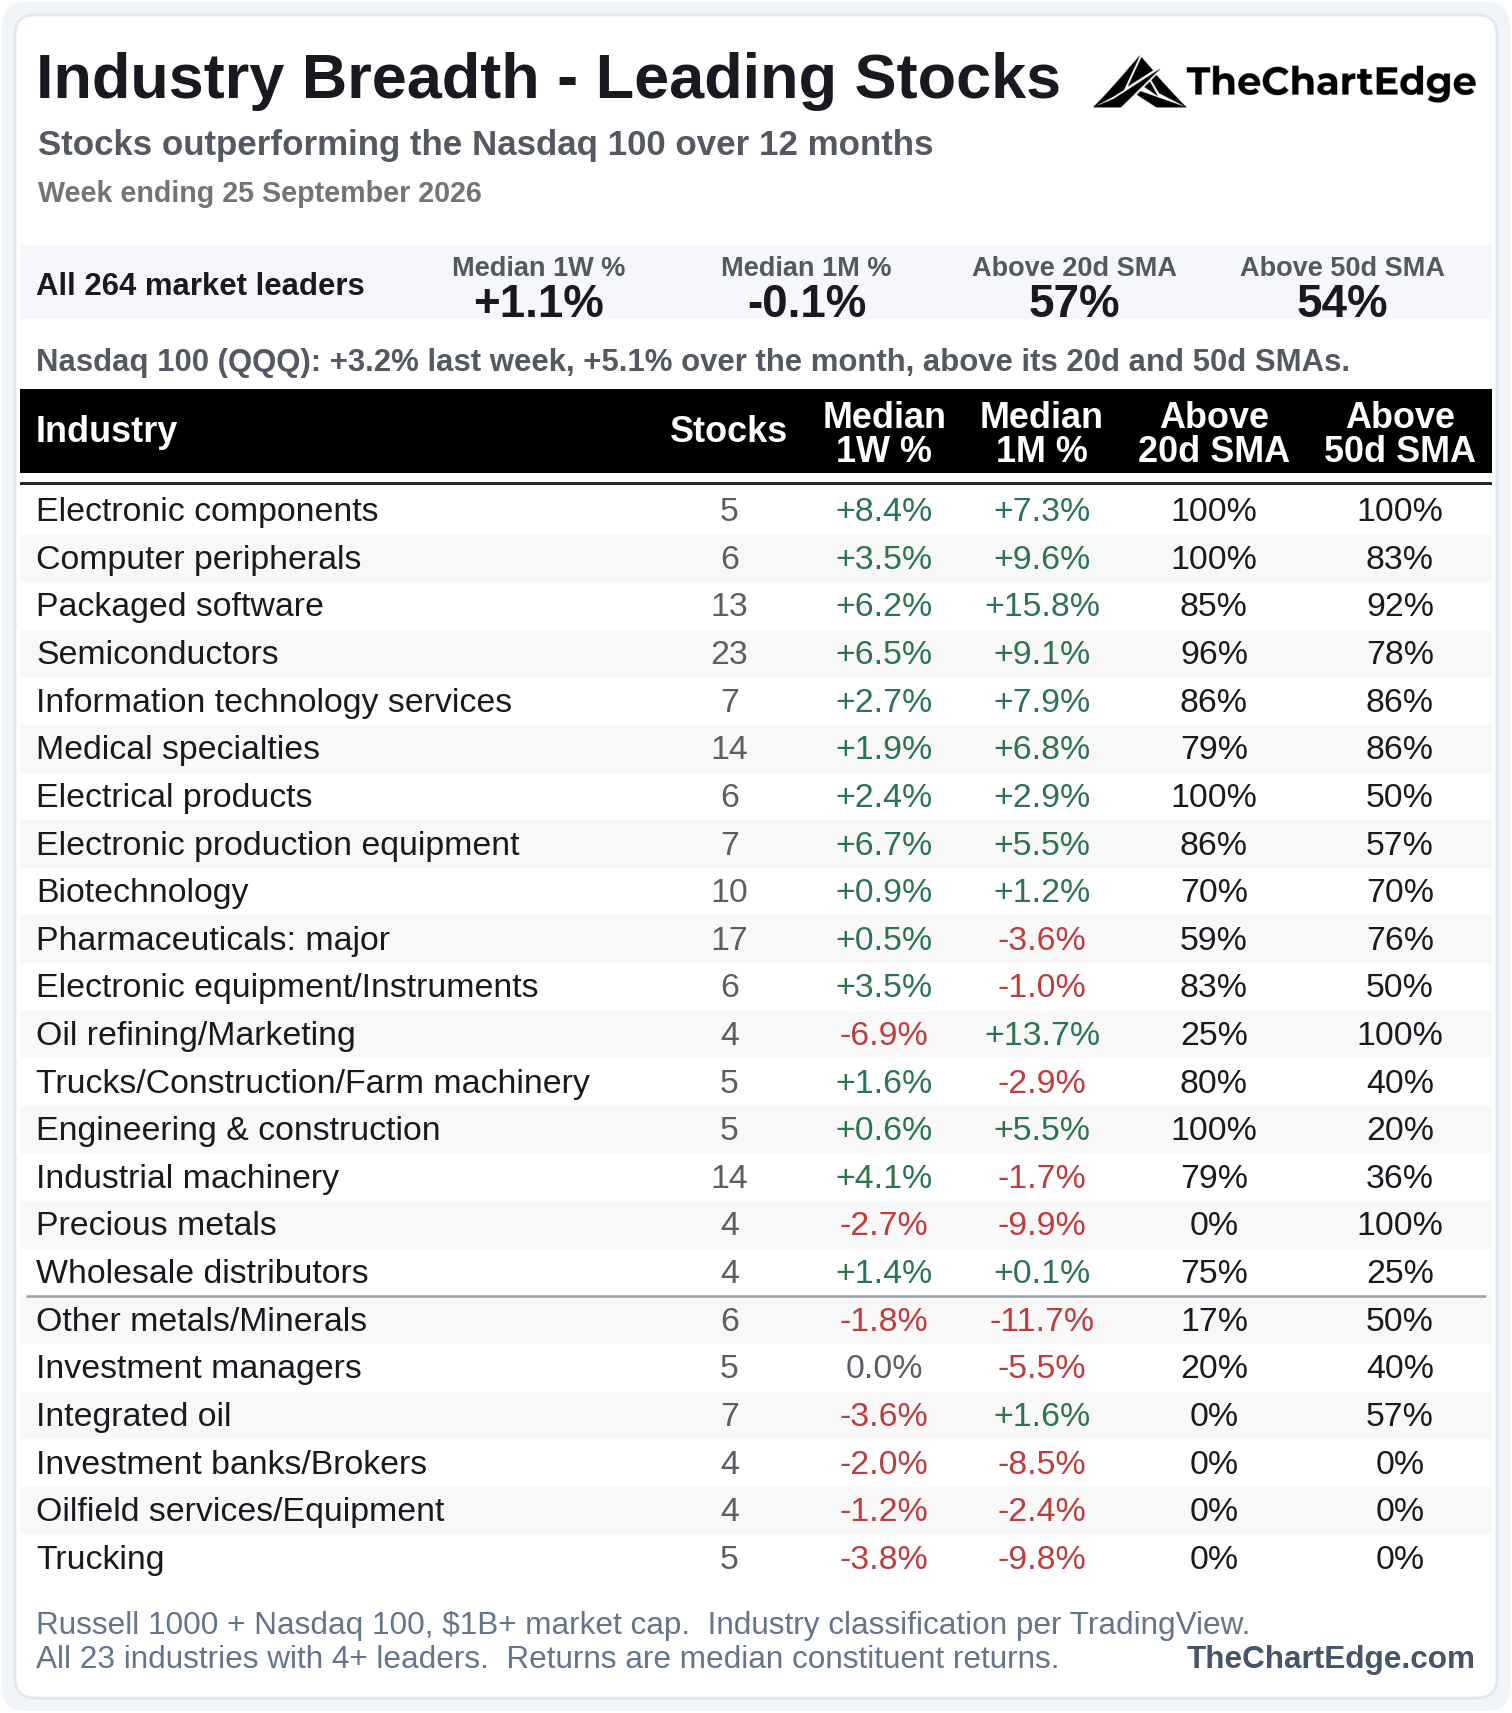
The rotation back into tech, semis and hardware showed up clearly on this board. The top 5 industries are all tech. Electronic components jumped from 16th to 1st, ahead of computer peripherals, packaged software, semiconductors and IT services.
Energy went the other way - oil refining fell from 1st to 12th and integrated oil dropped below the 50% line.
Health care improved too, with major pharmaceuticals back above the line alongside medical specialties and biotechnology.
Precious metals stayed split for a third week - no names above the 20-day SMA, all of them above the 50-day.
The universe shrank by 25 names as QQQ’s own 12-month return rose, but on the names that were in it both weeks, the share above the 20-day SMA still rose to 56% from 42%.
Semis & AI
Semiconductors (SMH) Chart
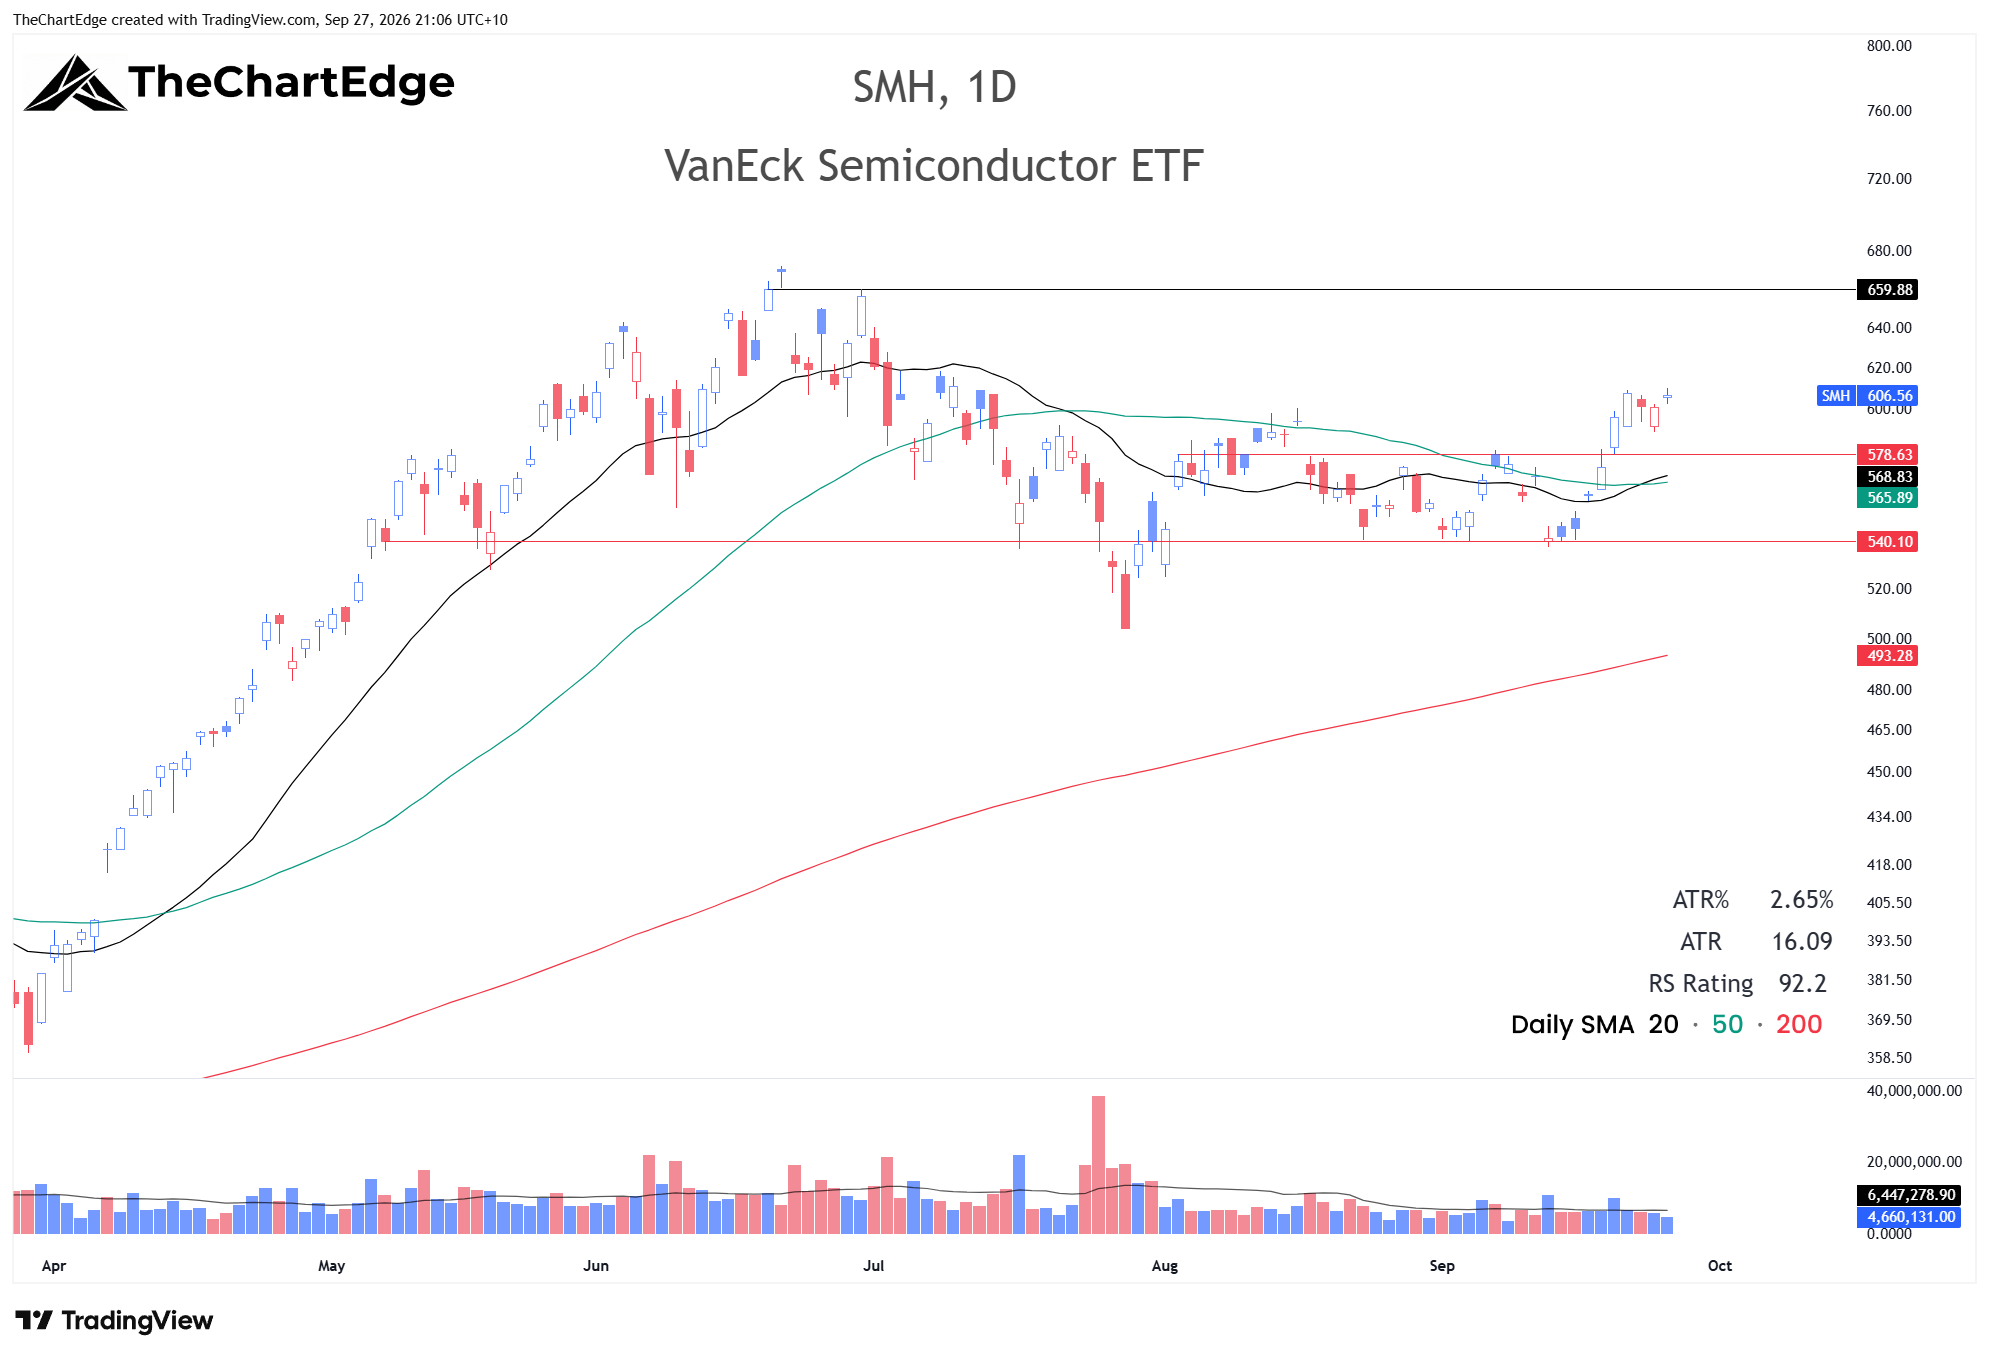
SMH broke above the 592-600 area I was watching and closed the week at 606.56 - back in a Strong Uptrend and in Leading. The 20-day SMA is above the 50-day. Now I’d like to see a pullback that sets a higher low above the rising 20-day before getting involved.
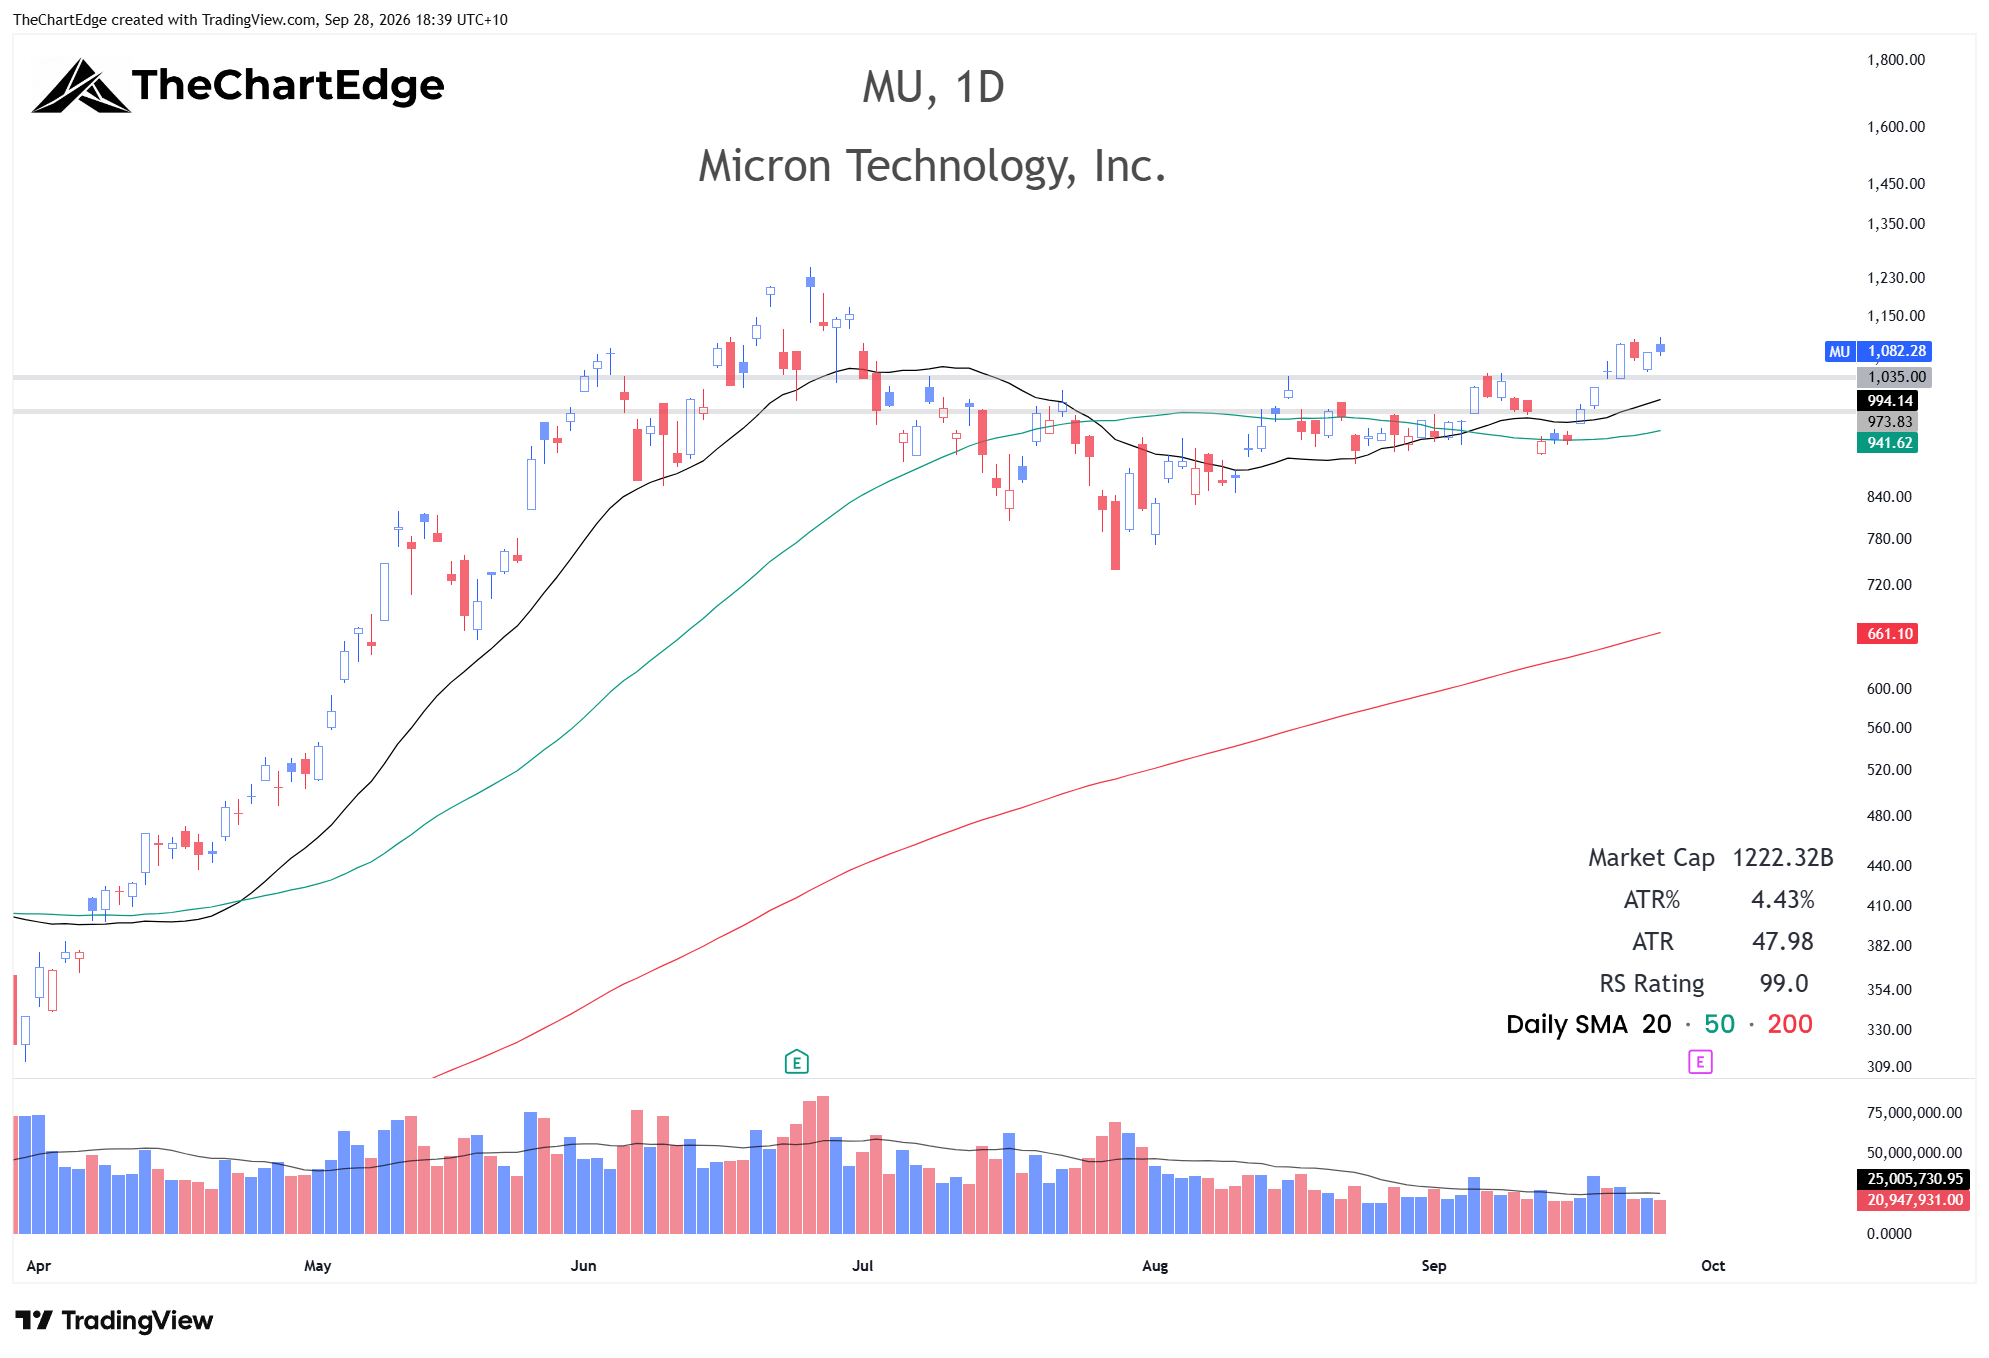
I’ve included some charts of individual names on my watchlist below. Note, however, that Micron has earnings after the close on Wednesday. Also, I don’t currently plan to take new positions in any of these this coming week, but they are names I am watching due to their relative strength and potential for entries in the future.
Micron (MU) Chart
Snowflake (SNOW) Chart
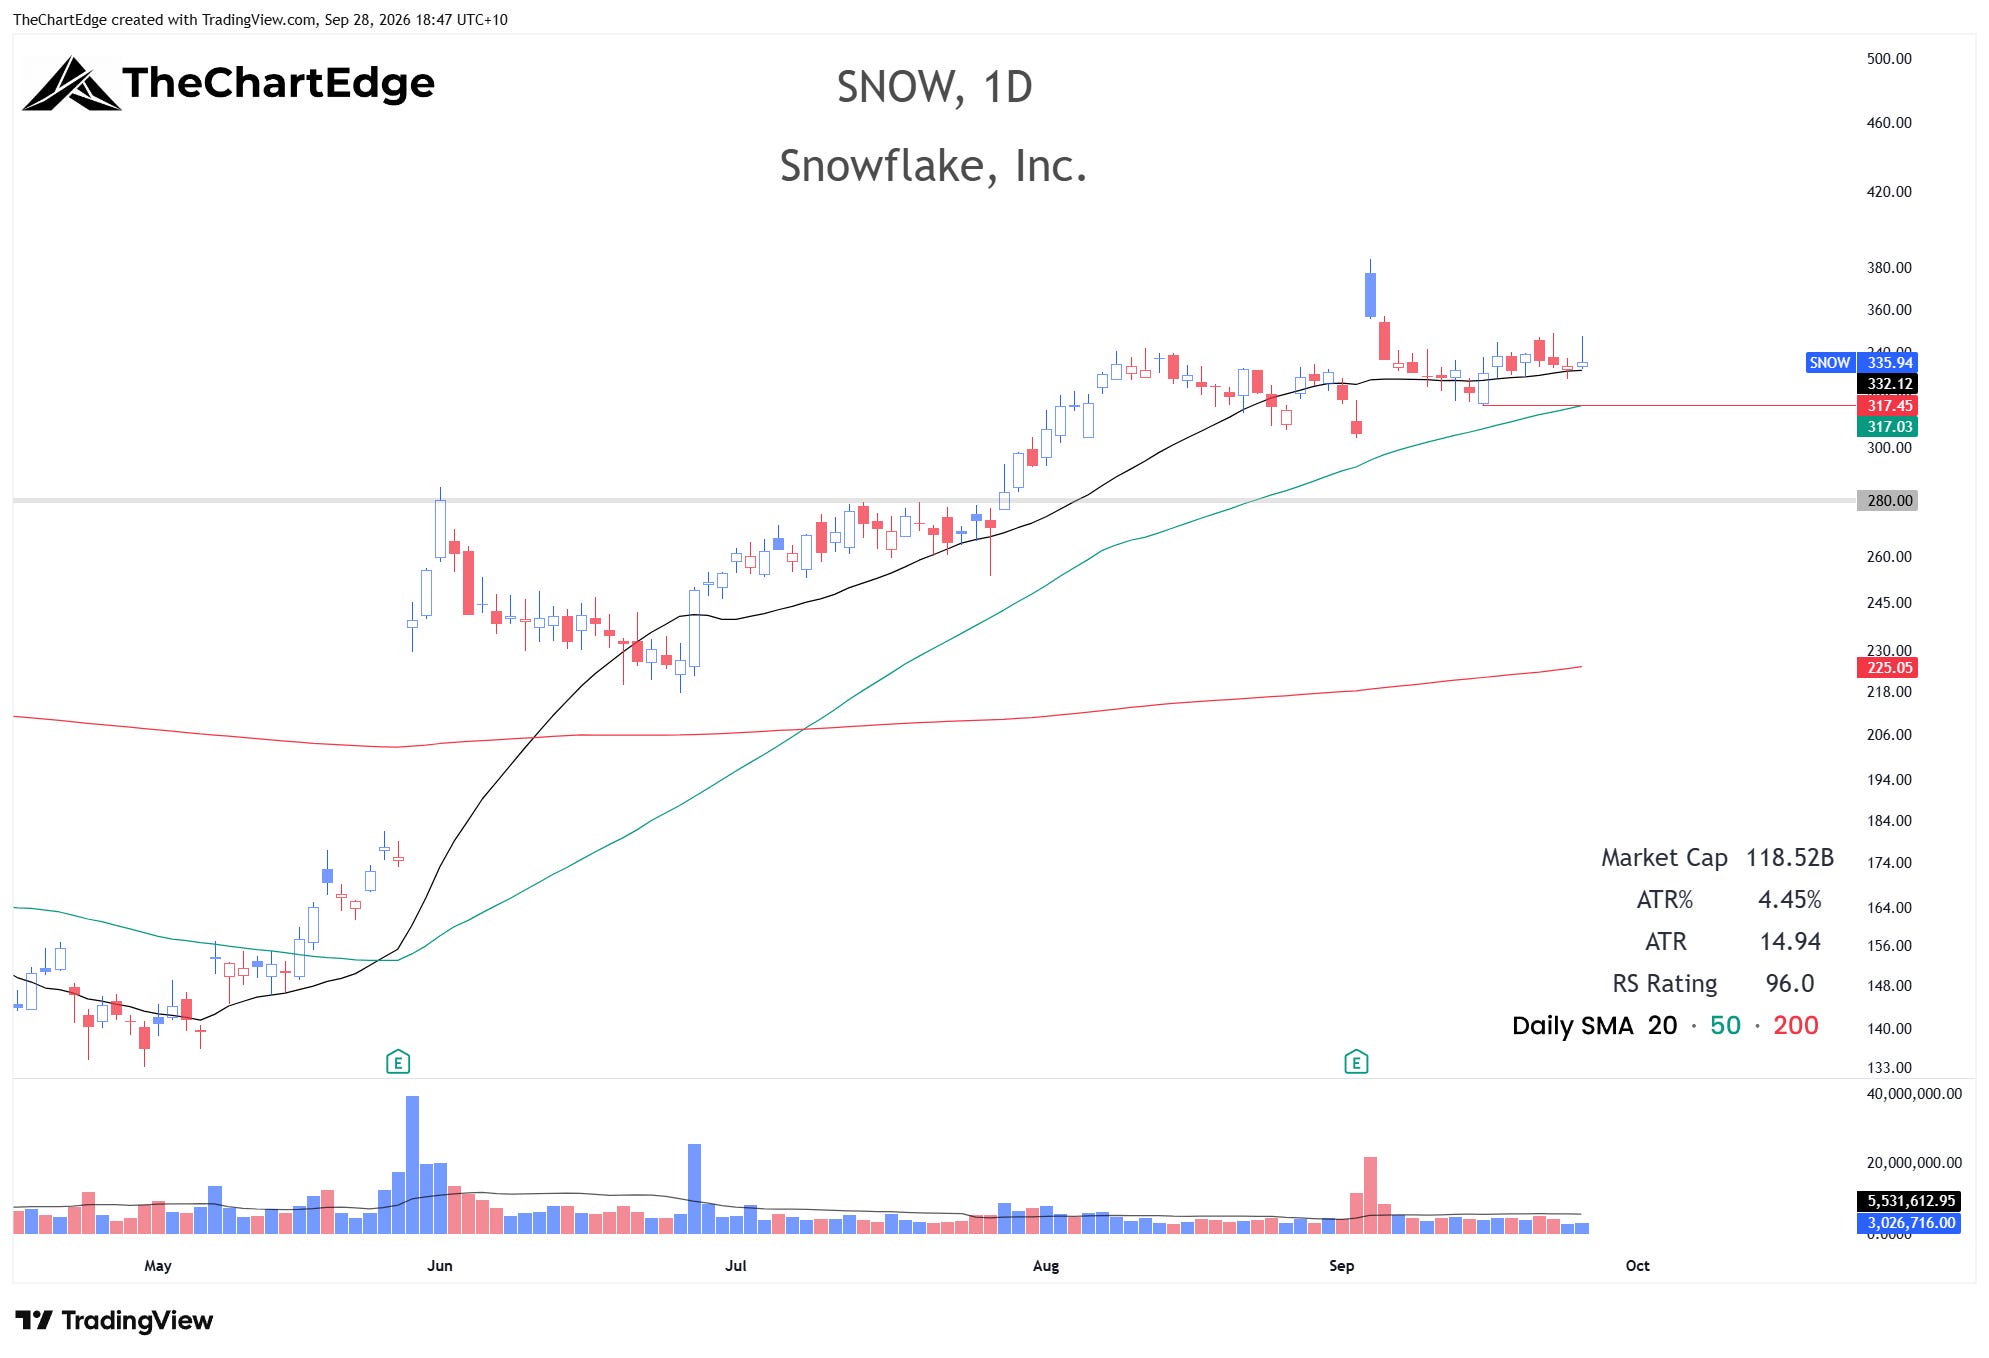
SNOW doesn’t tend to trend smoothly - but it has been trading in a tight range recently. If it can break out to the upside, it could provide a low-risk entry.
Marvell (MRVL) Chart
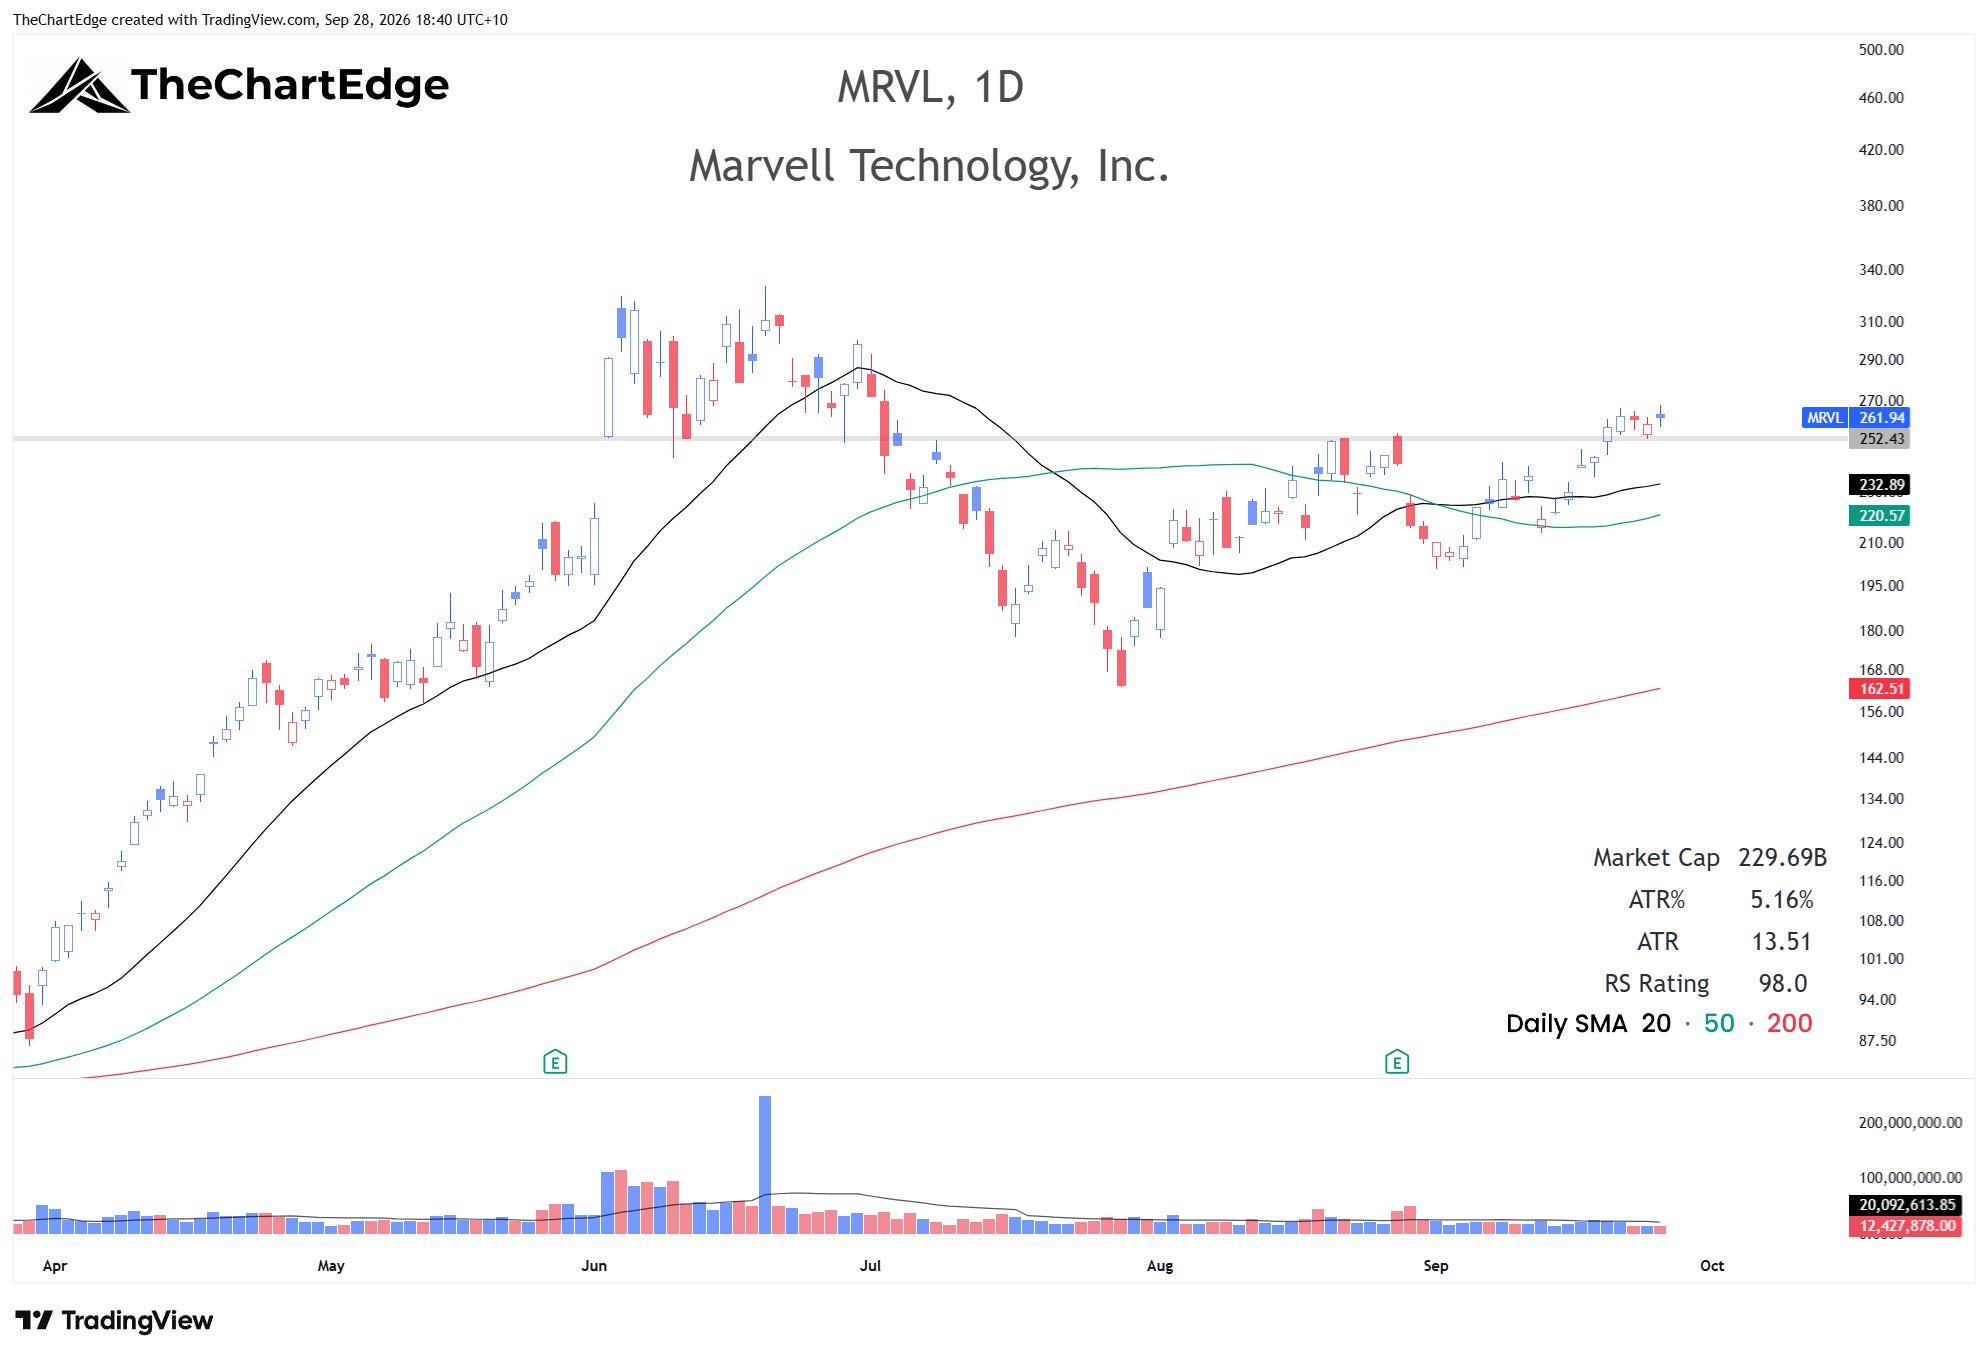
MRVL also traded in a tight range last week. If this continues and the 20-day SMA catches up a bit, it could provide a good entry on a break higher.
Bloom Energy (BE) Chart
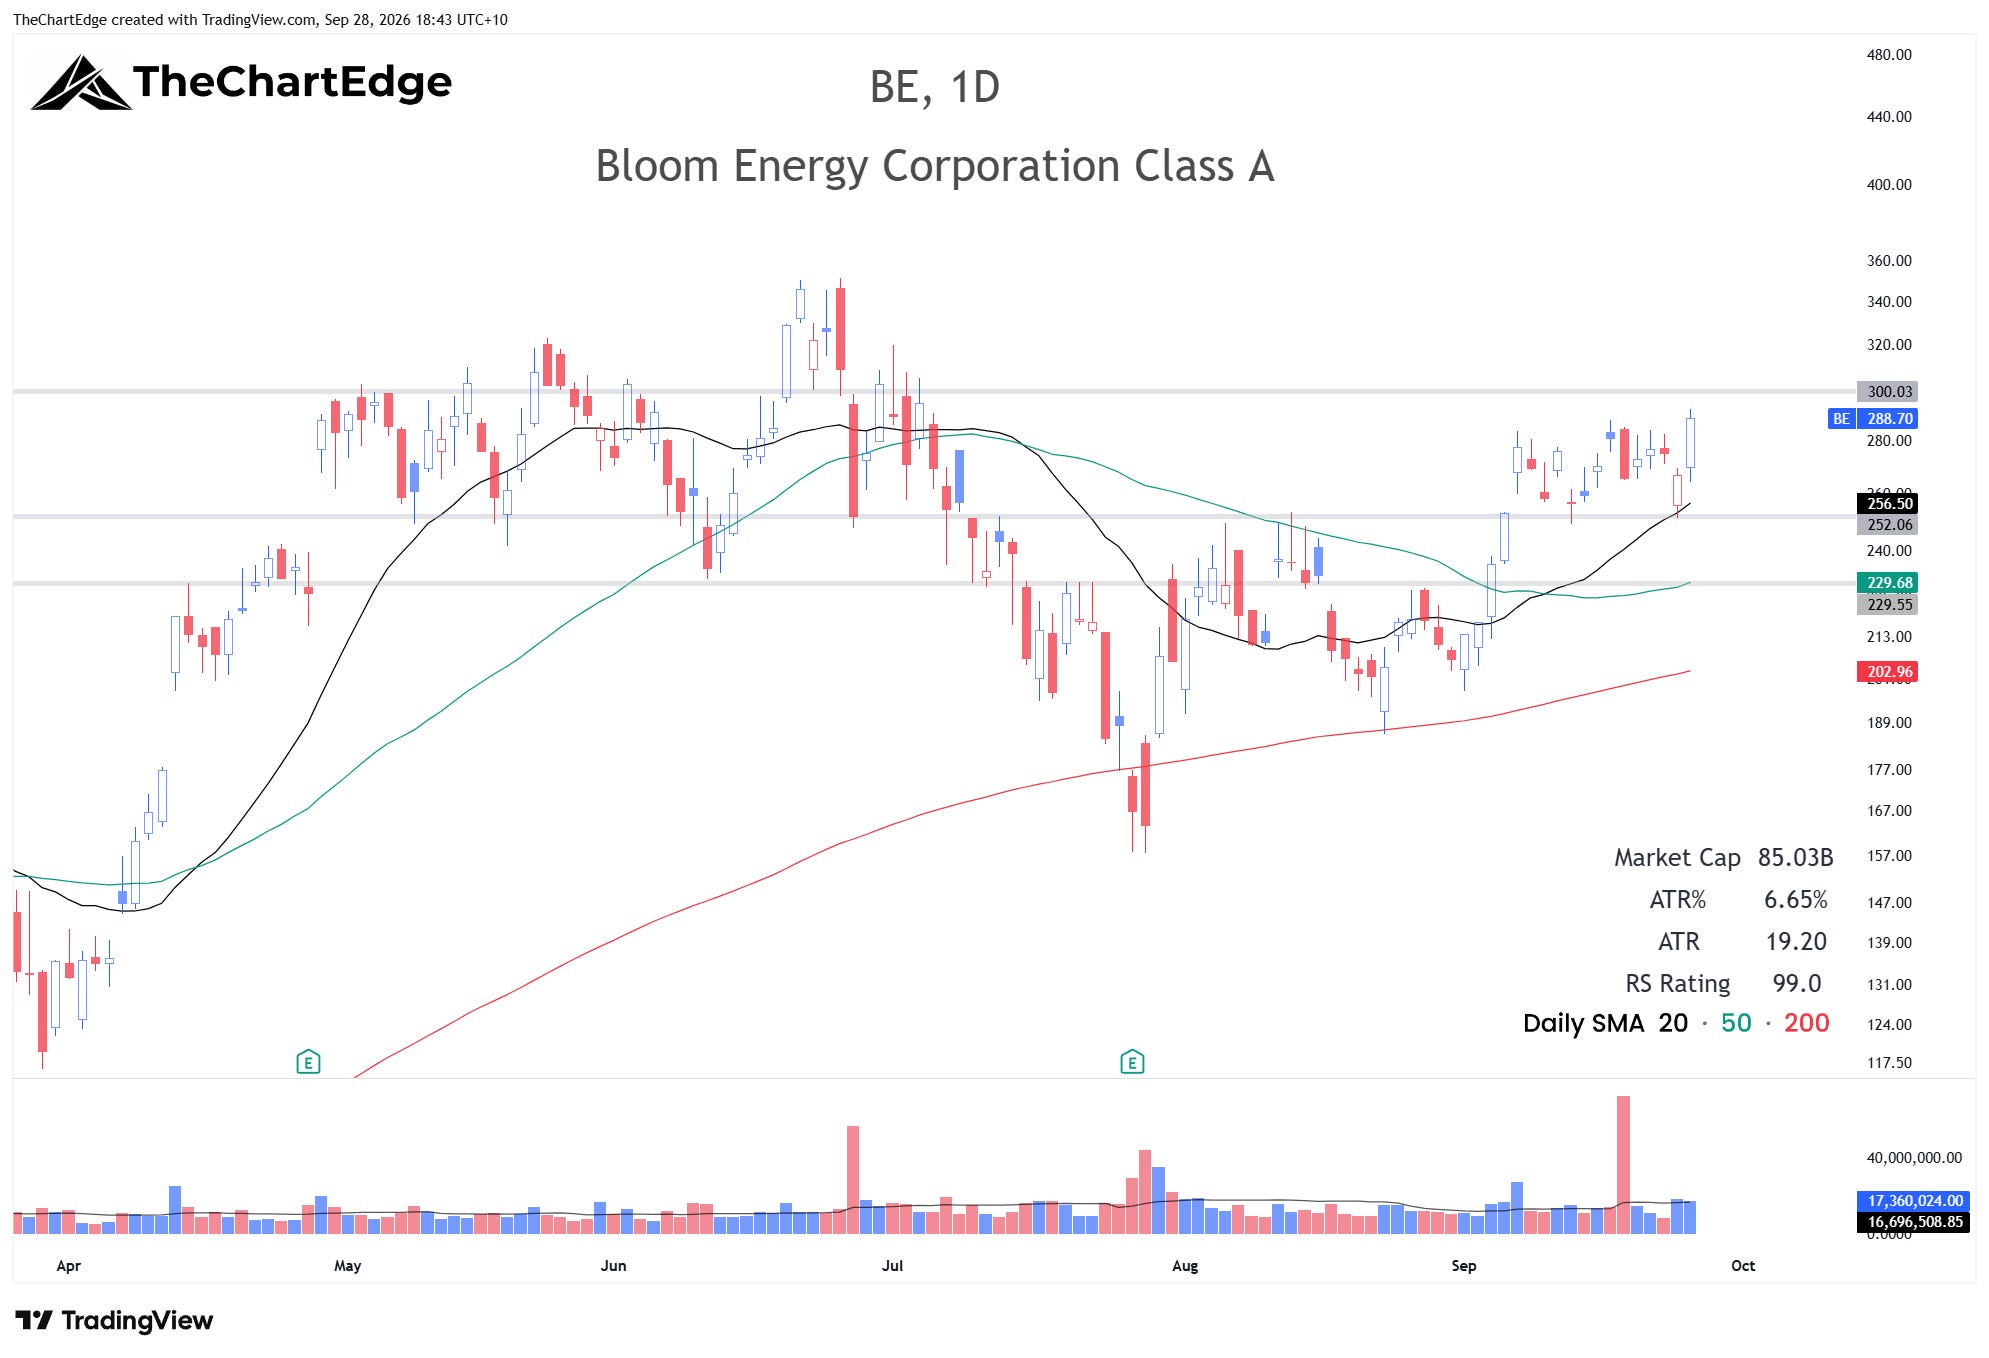
BE is trading a bit loose currently but could provide a potential entry if it tightens up under 300.
Semtech (SMTC) Chart
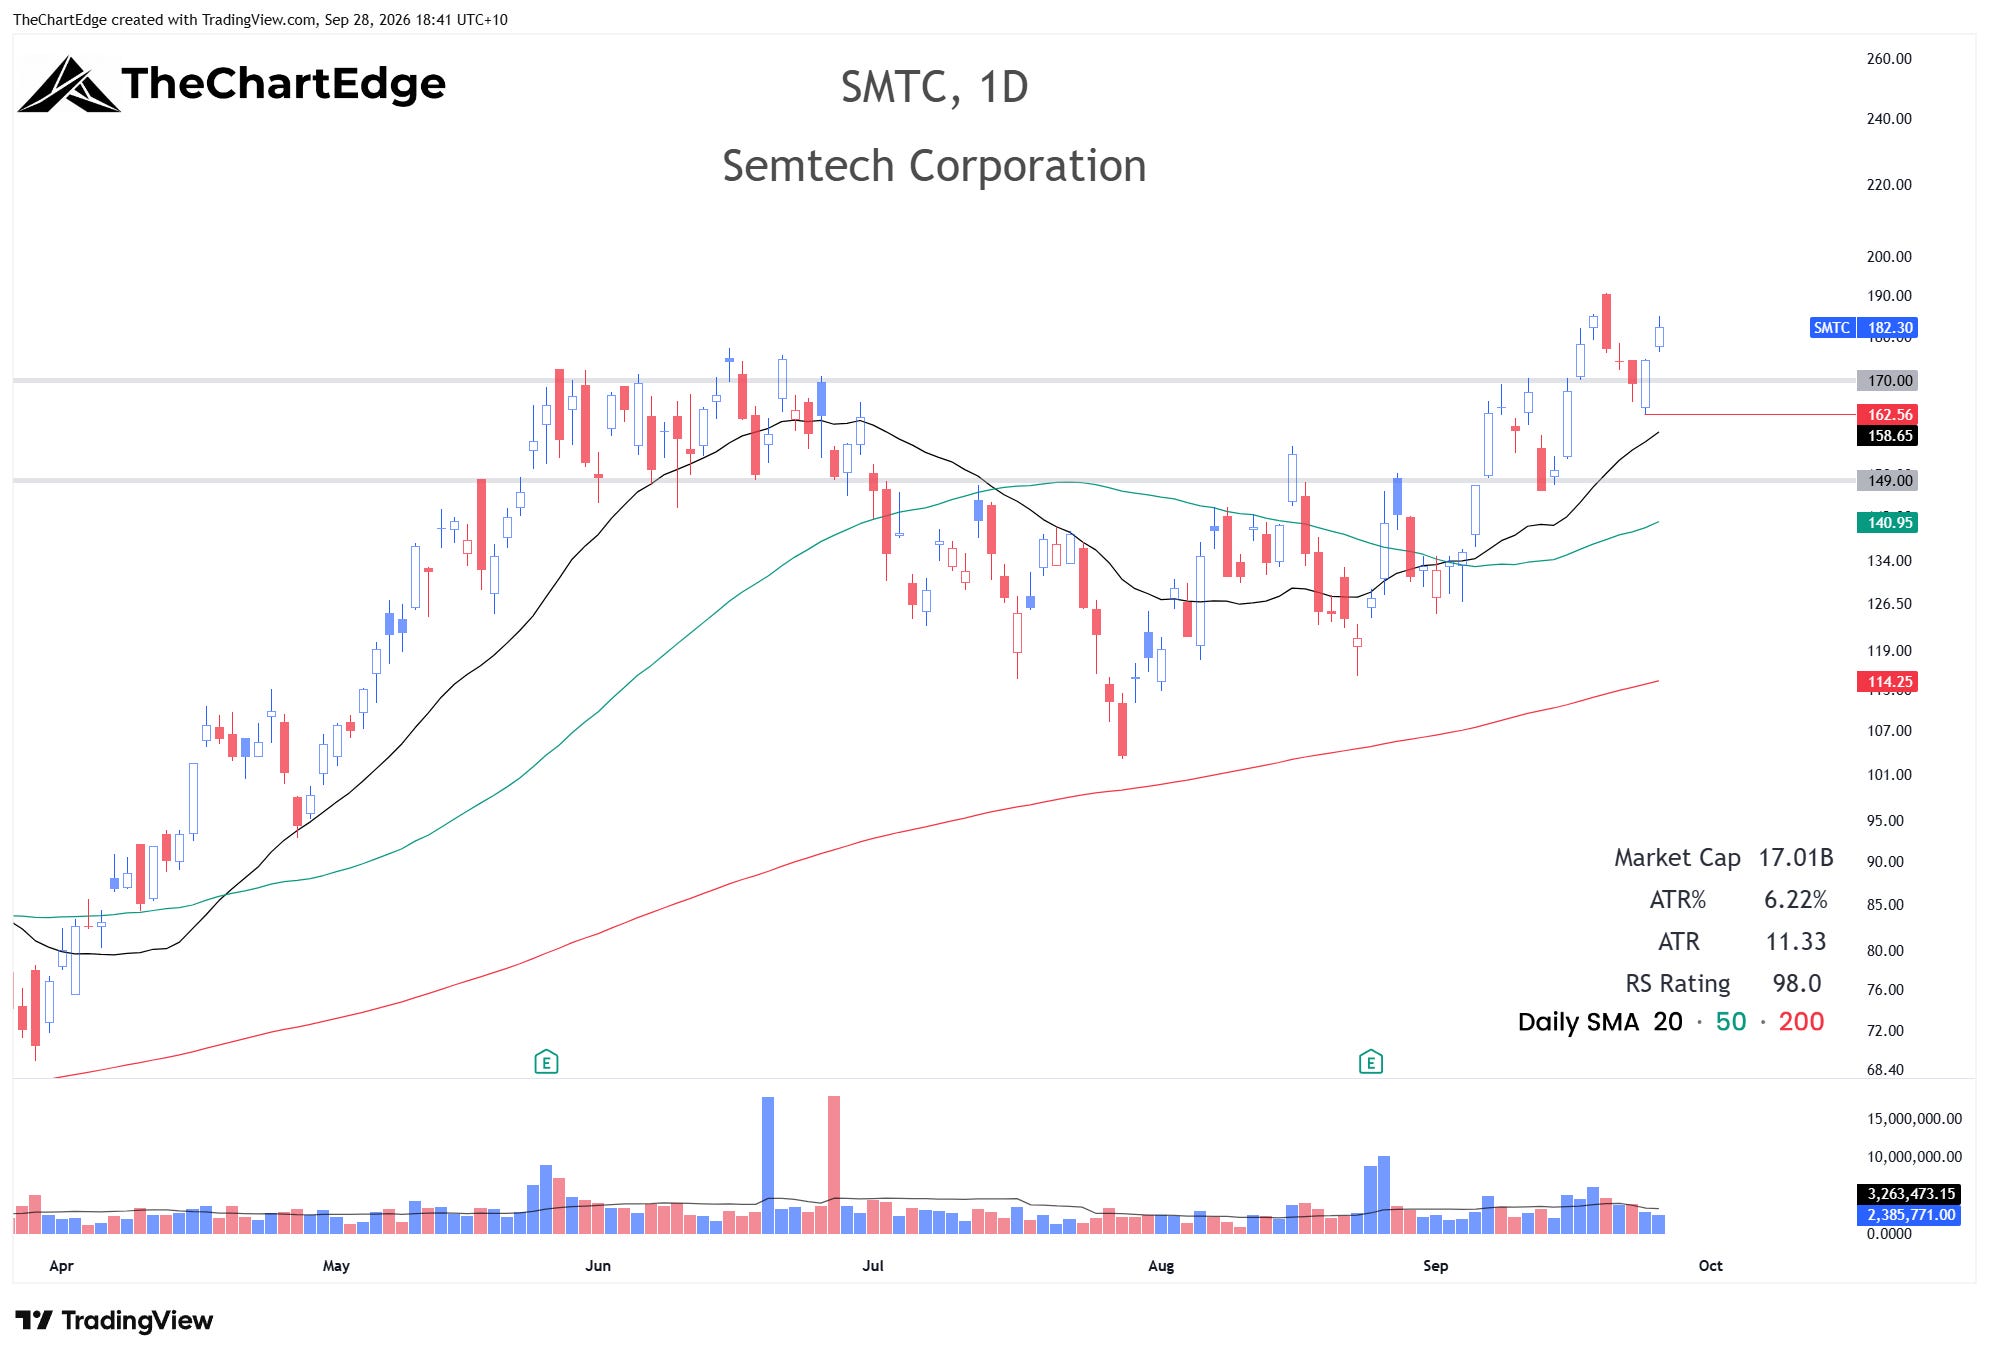
SMTC is trading near all-time highs. If it can consolidate here for a while, it may provide a good entry.
Trades & Follow-Ups
I didn’t add any new swing trades last week, and FCLD is still my only position.
Cloud Computing (FCLD) Chart
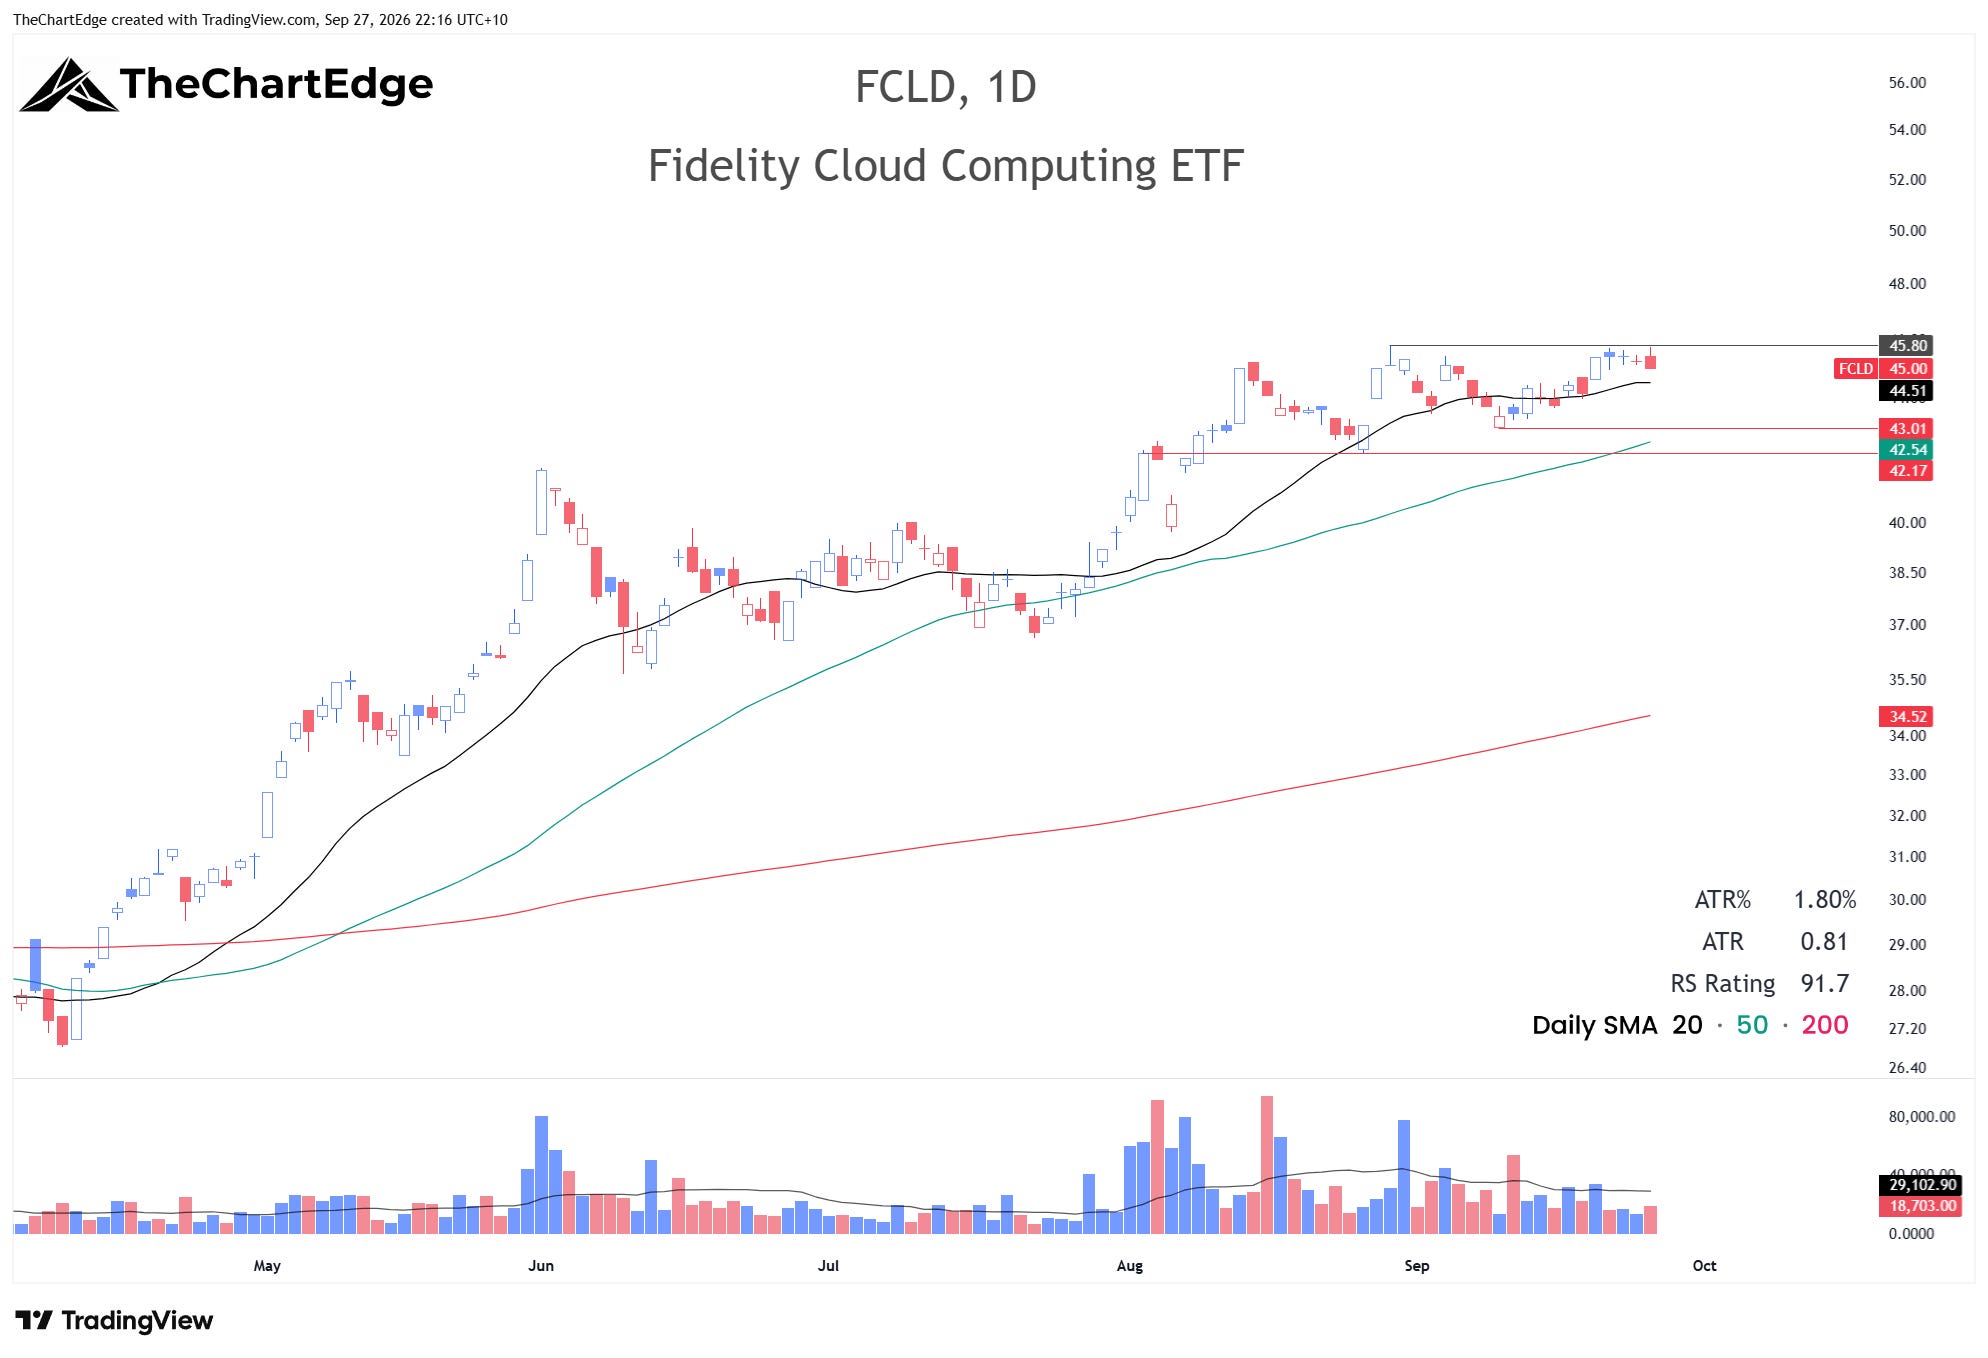
FCLD closed at 45.00 - 1.8% below its all-time high and back on the Momentum Leaderboard. My stop is still at 42.90. If it can break out to new all-time highs, I will raise my stop close to breakeven.
Ethereum Chart
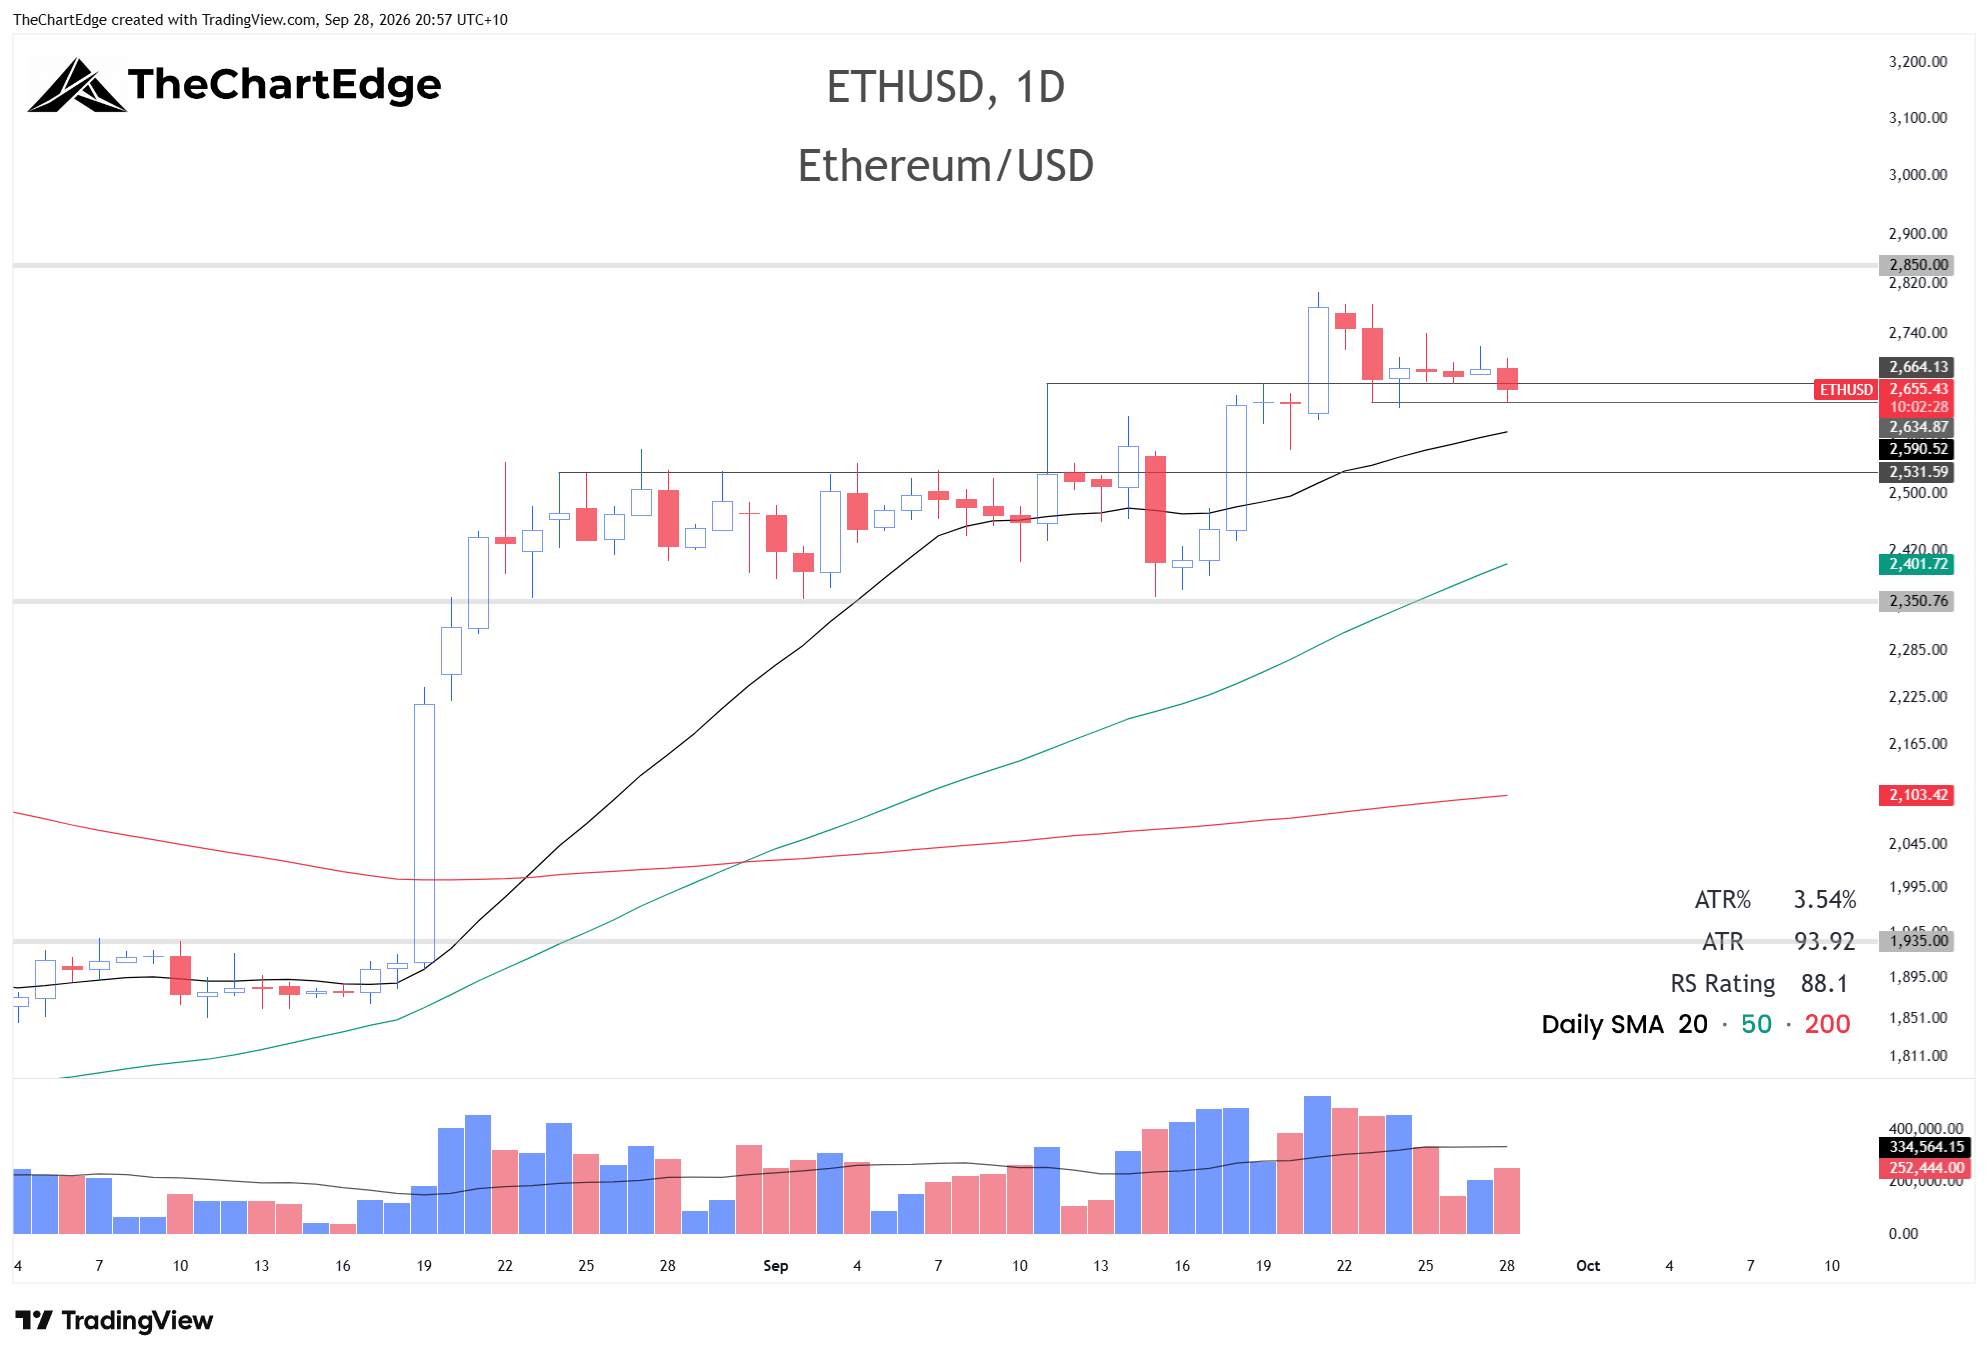
ETH broke higher on Monday but has been pulling back since. It has been relatively orderly so far, but I wouldn’t be surprised to see a deeper pullback to 2530 or even further towards 2350-2400. I’m just watching for now and don’t have a specific entry strategy in mind. It’s currently trading around 2655, on Monday evening Melbourne time.
Yields
The 10-year yield finished the week at 5.18% and the 30-year at 5.50%, up from 5.00% and 5.33%. Bond volatility, as measured by the MOVE index, jumped with them, while the VIX barely moved. For now, higher rates aren’t affecting the large-cap indices, but I’ll continue to keep an eye out for any change in this regard.
The Week Ahead
The Market Temperature is just back in the Goldilocks Zone, but strength is concentrated in mega-caps and tech. 52 of the 121 ETFs I track finished higher, from 42 last weekend. However, breadth outside tech remains weak. The spike in bond volatility also makes me slightly cautious. I am not in a hurry to add new swing positions yet. Let’s see what the coming week brings.
Stay open-minded and manage risk carefully.
Cheers,
Marcus Grant, CFTe
Disclaimer: The content provided in this newsletter is for informational and educational purposes only and should not be considered as financial, investment, or legal advice. It is general information only and does not take into account your objectives, financial situation or needs. The information shared is based on our research and analysis, but we are not a licensed financial advisor, nor can we guarantee its accuracy, completeness, or timeliness. Market conditions and financial instruments can change rapidly, and any opinions expressed may not be suitable for all investors. Any opinions expressed and/or securities mentioned do not constitute a recommendation to buy, sell, or hold that or any other security. You should conduct your own due diligence and consult with a licensed financial advisor or other professional before making any investment decisions. Past performance is not indicative of future results, and all investments carry the risk of loss. The authors and publishers of this newsletter are not responsible for any financial decisions made based on the content provided herein. By reading and/or subscribing to this newsletter, you acknowledge and agree that you are using the information at your own risk.