


Everything below is as of Friday October 30 close.
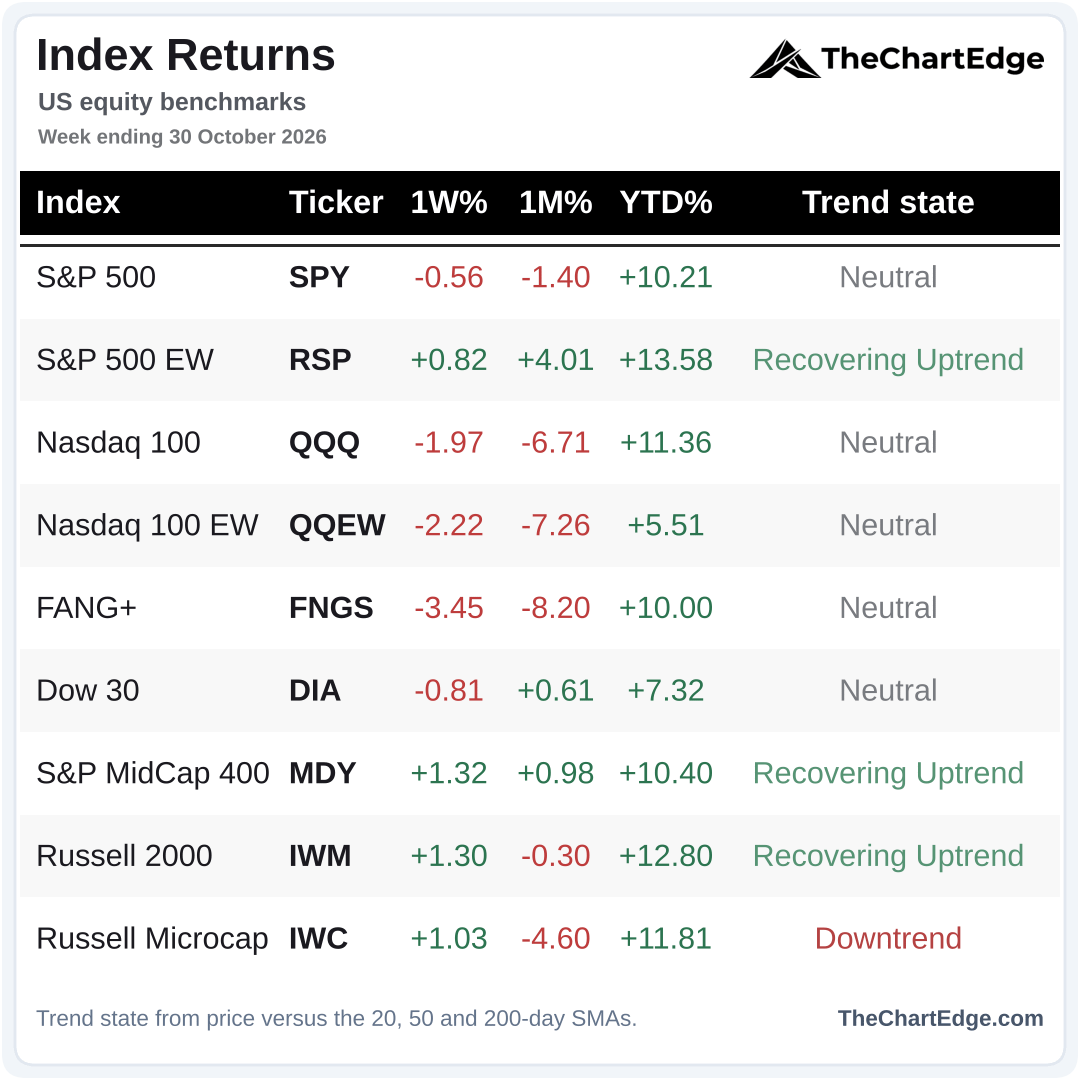
Of the major indices I track, 4 of the 9 finished the week higher - the equal-weight S&P 500 (RSP), mid-caps (MDY), small caps (IWM) and micro-caps (IWC). FANG+ (FNGS) and the Nasdaq 100 (QQQ and QQEW) were the weakest. RSP now has the highest year-to-date return.
S&P 500 (SPY) Chart
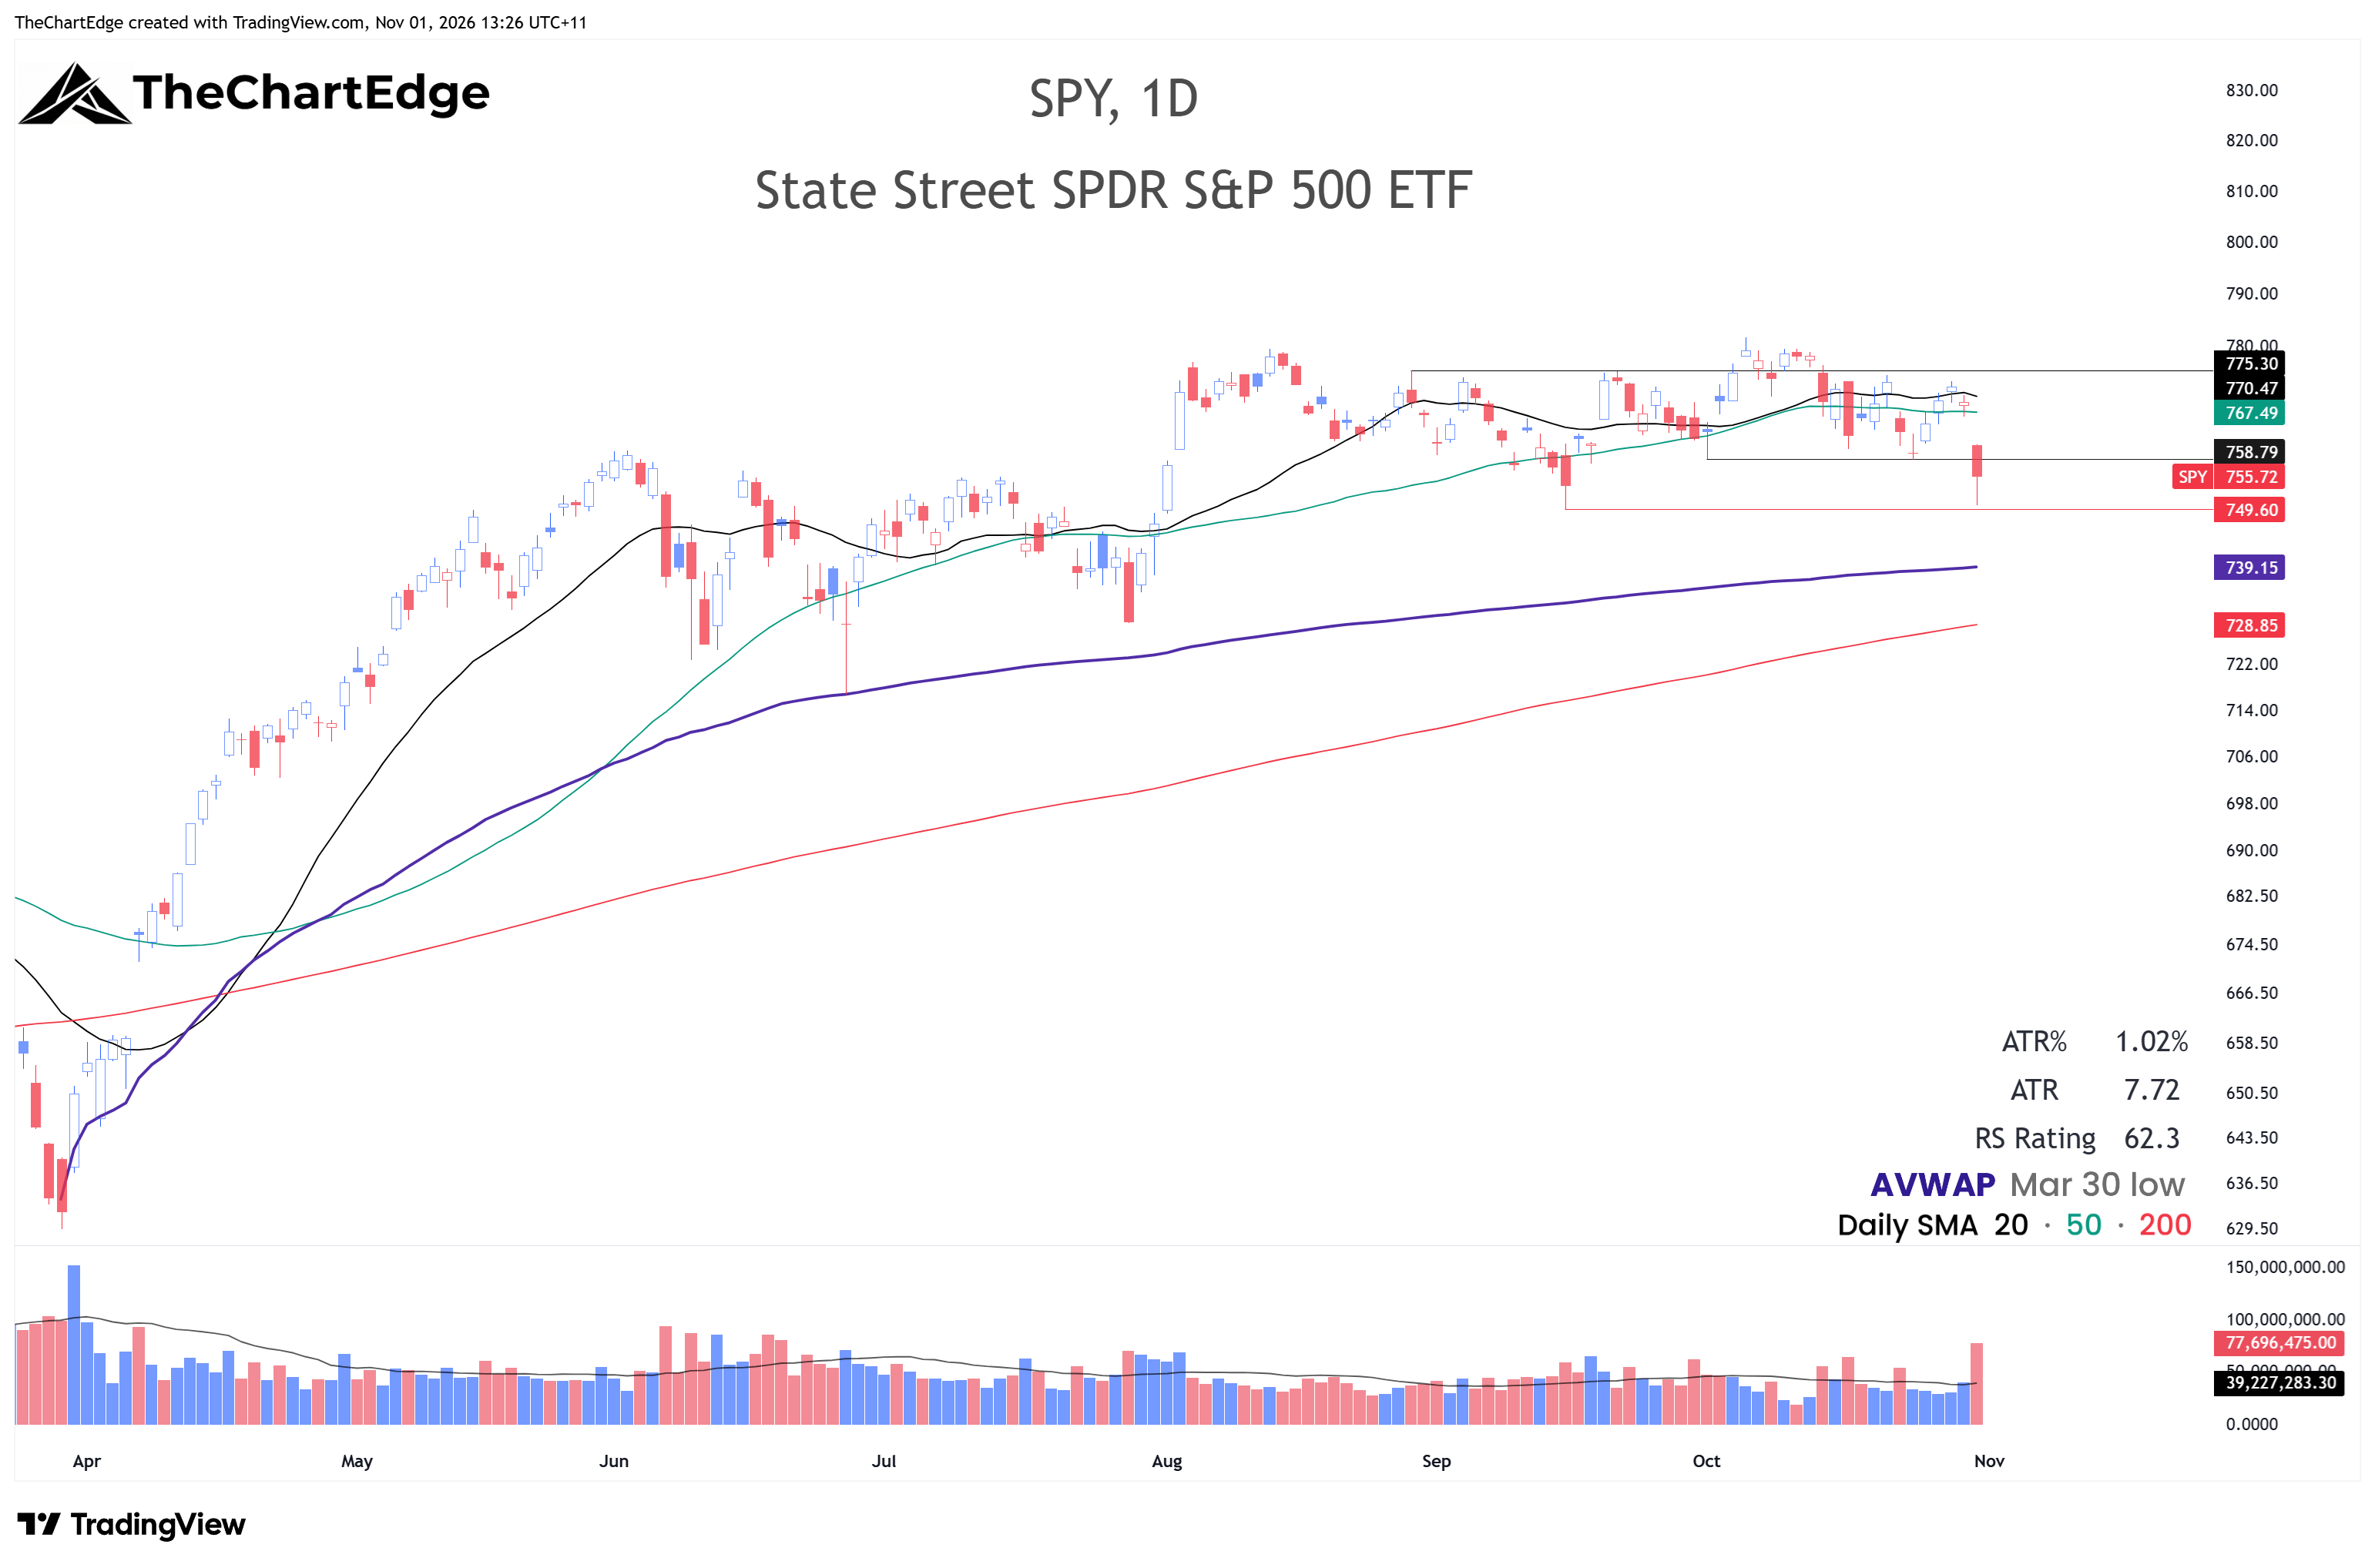
SPY closed at 755.72, still in the Neutral trend state. It broke below the October 1 low of 758.79 on Friday and continued lower, testing the September low at 749.60 before bouncing slightly at the end of the day. If 749.60 doesn’t hold, the AVWAP from the March 30 low is around 739 and the 200-day SMA below that around 729. Bulls want to see it reclaim 758.79 and the high of Friday’s candle at 761.38 early in the coming week. Even if that occurs, it may prove to be a short-lived bounce before another leg down. The chart looks more bearish than bullish to me, and I may even consider a short position on a bounce to somewhere around 765-770.
Nasdaq 100 (QQQ) Chart
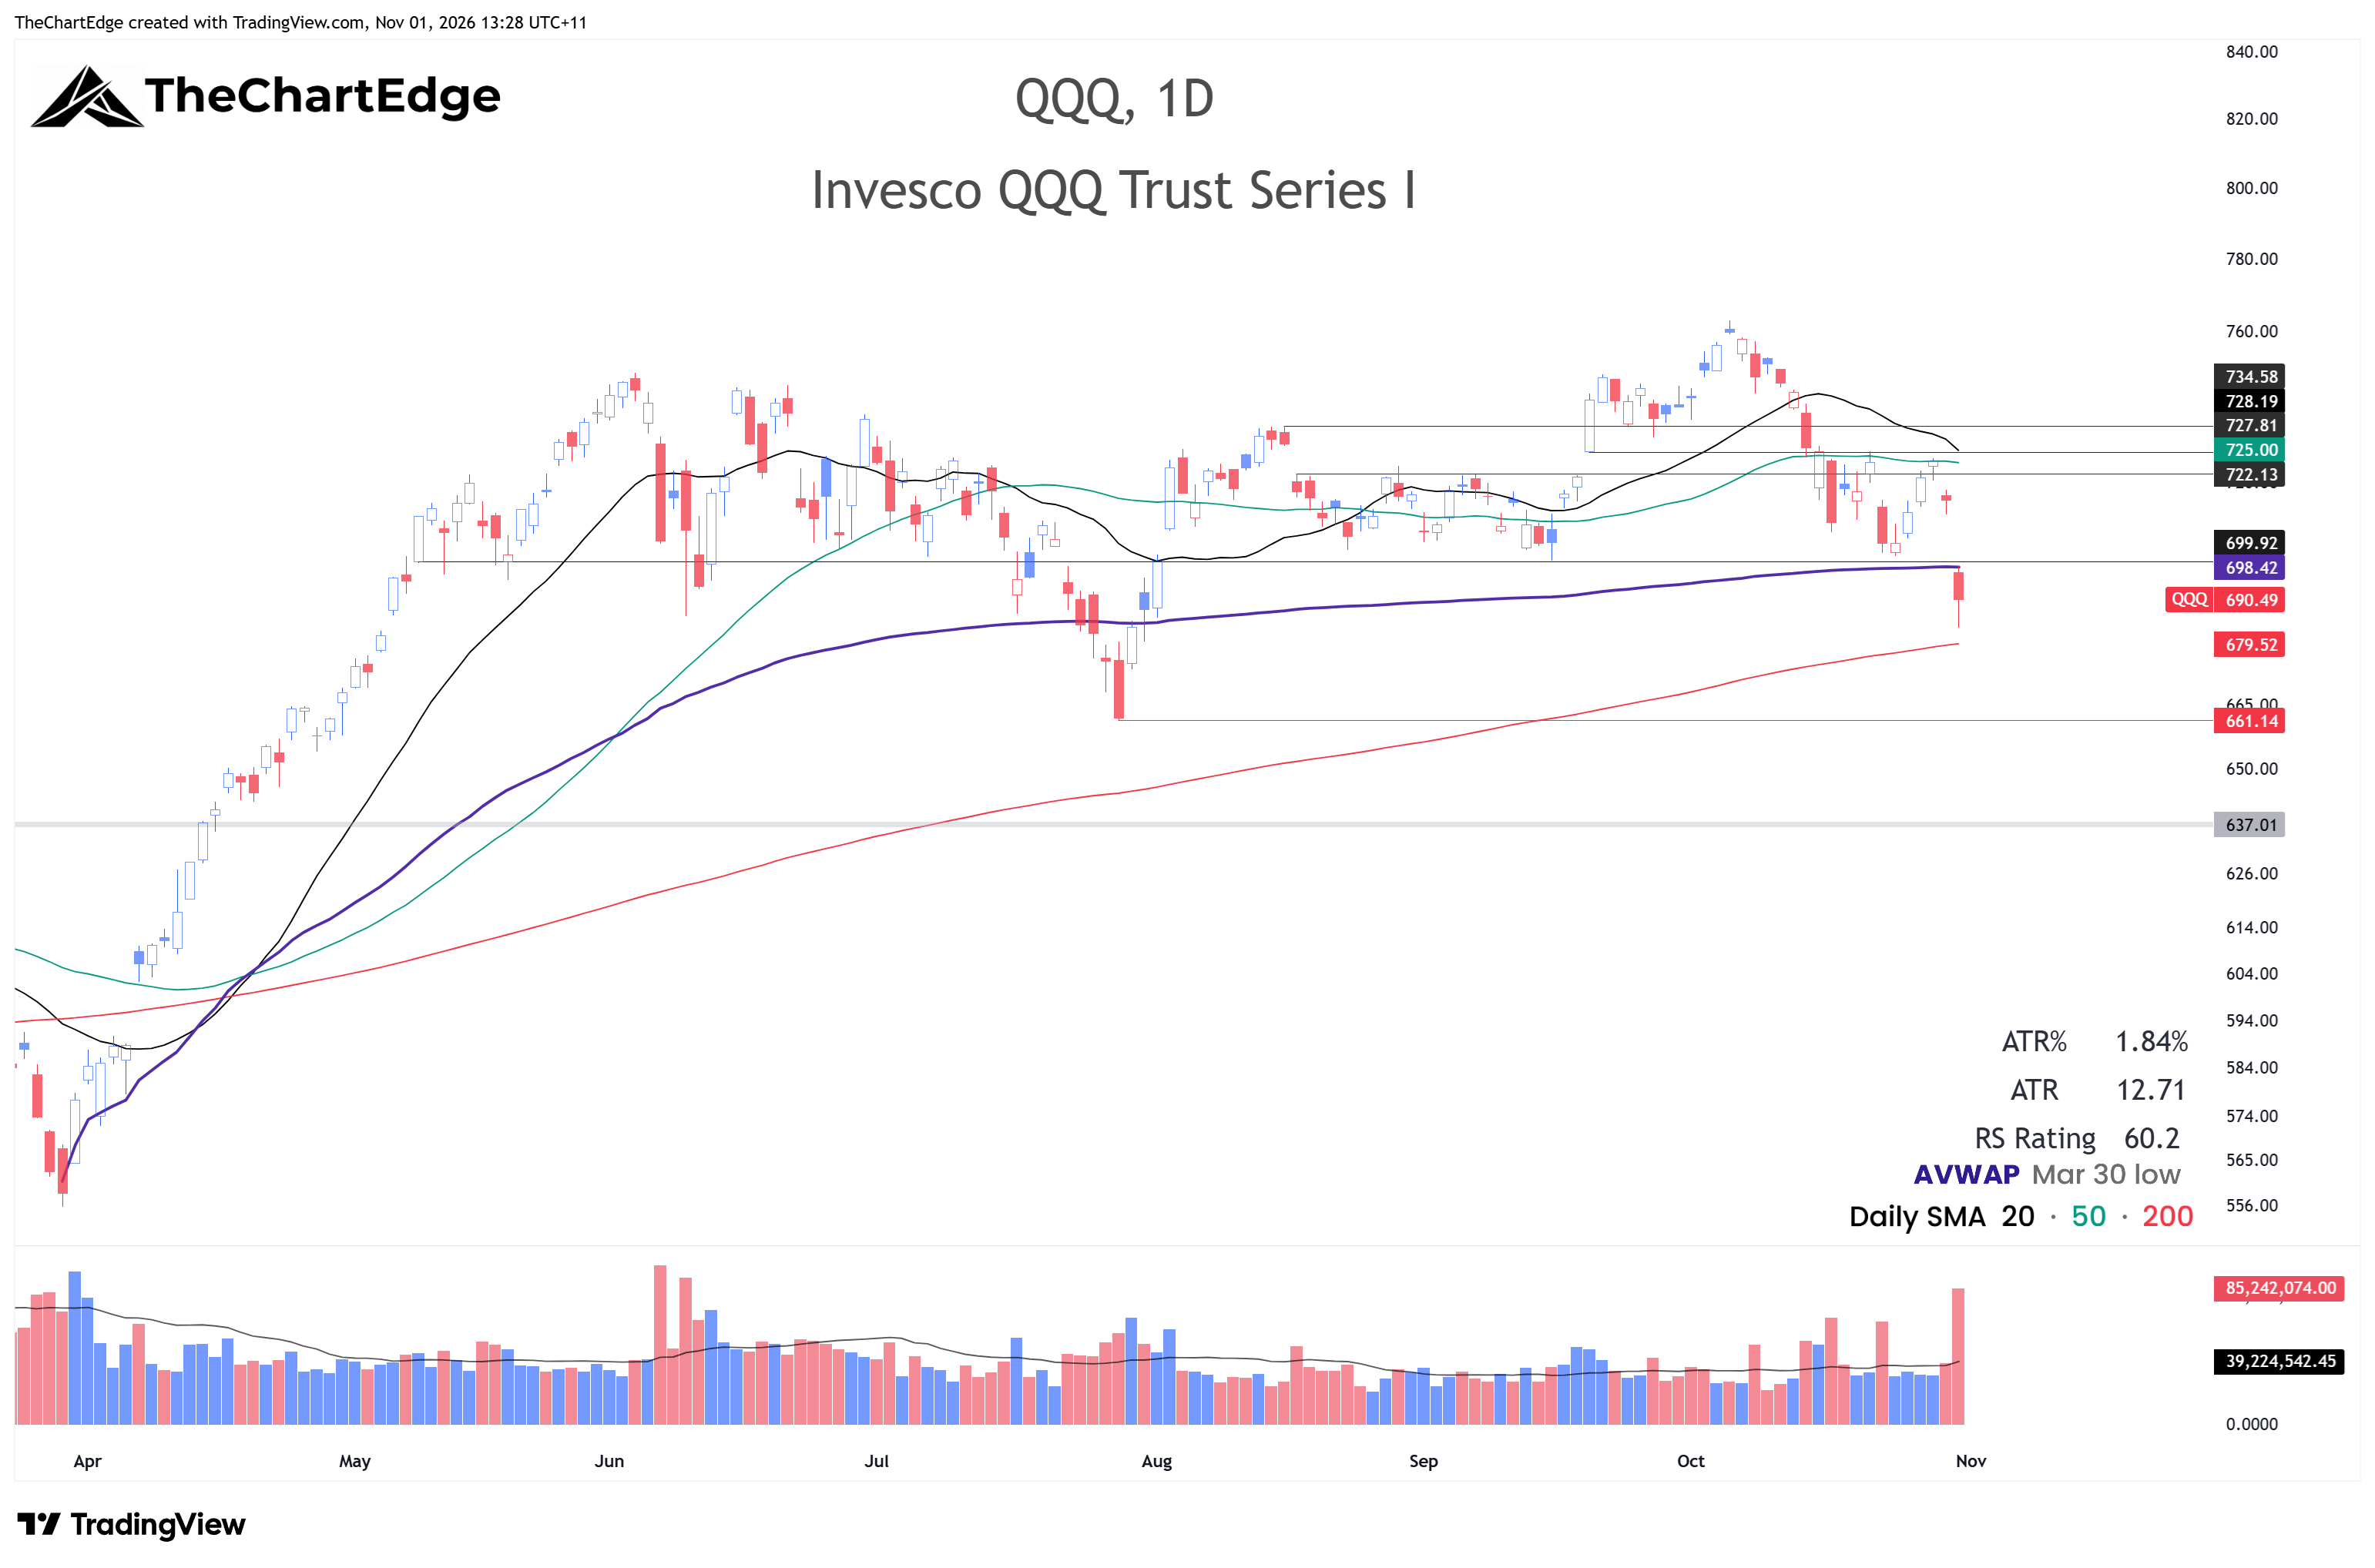
QQQ closed at 690.49, also still Neutral, now below 700, which I thought was an important level it wanted to hold. Friday’s volume was about double the average, but it still doesn’t quite feel like capitulation to me. An undercut of the 200-day followed by a powerful reversal on even higher volume or a big gap down that reverses and turns green is what I’m looking for before trying any longs. If we can’t hold the 200-day SMA around 679.50, we look set to test the late July low at 661.14. I wouldn’t be placing new shorts at current levels though, except for day trades.
FANG+ (FNGS) Chart
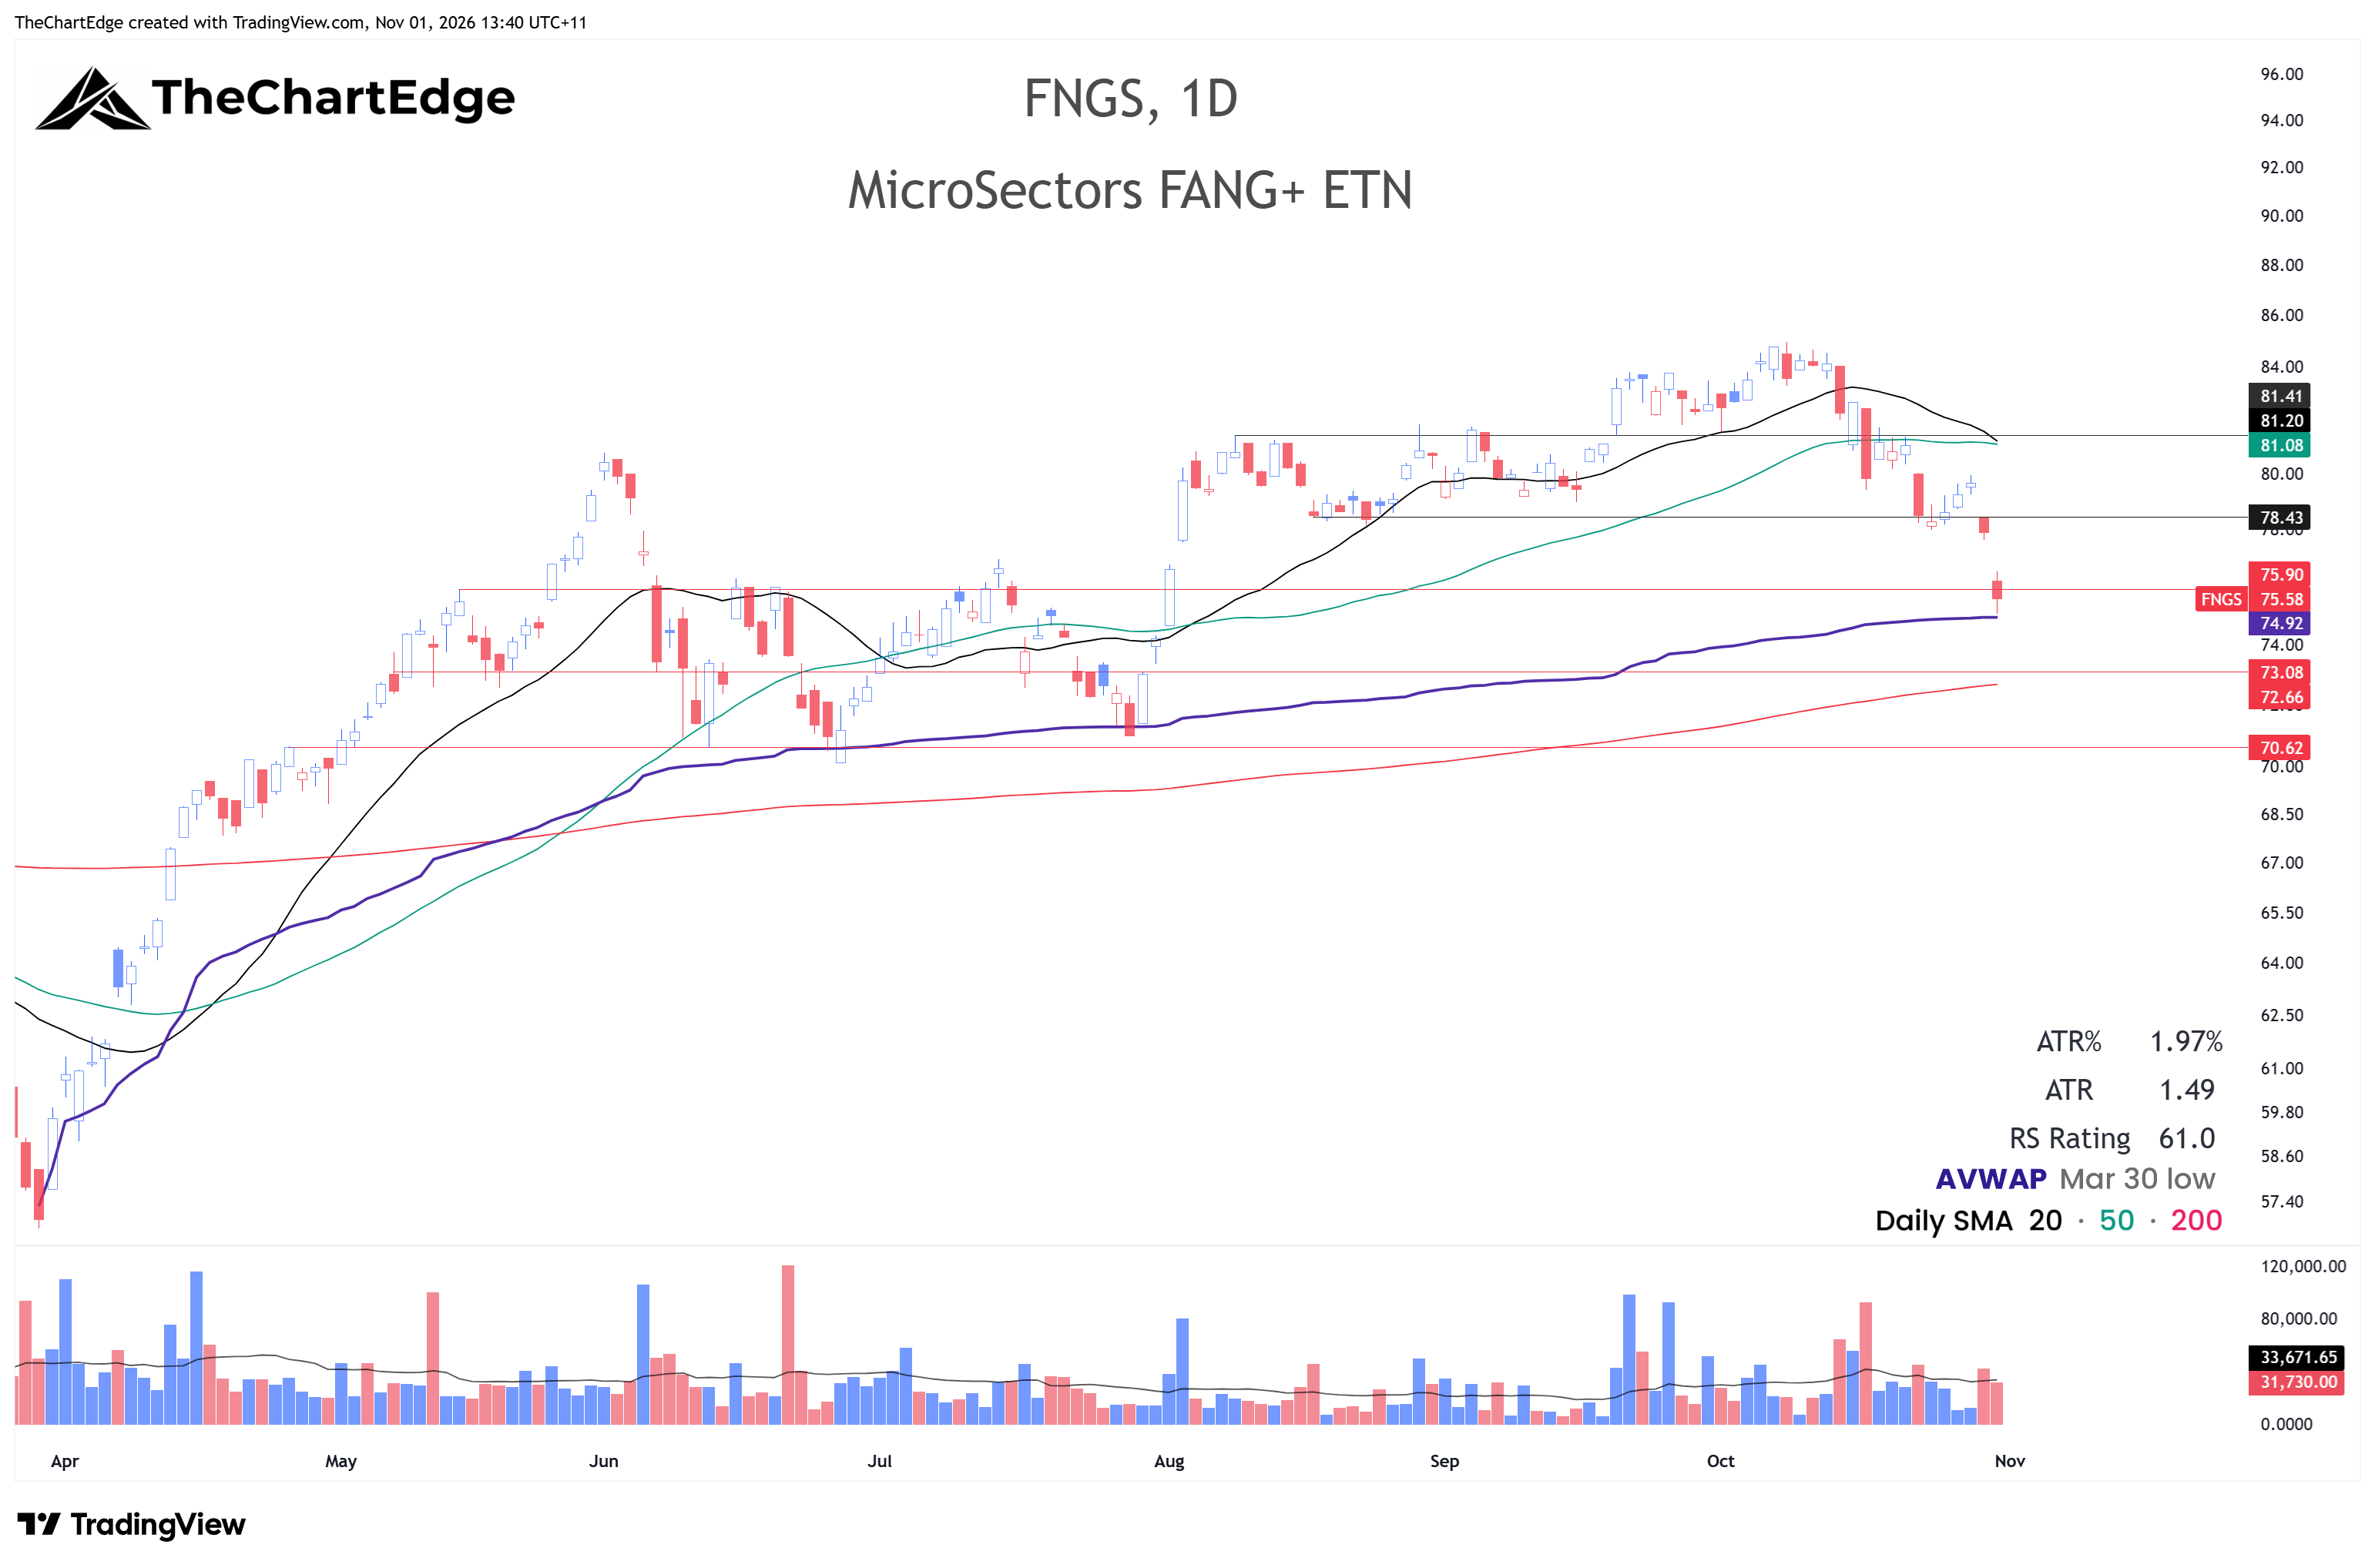
FNGS had another bad week, closing at 75.58. The AVWAP from the March 30 low sits just below at 74.92, and the 200-day SMA at 72.66.
S&P 500 Equal Weight (RSP) Chart
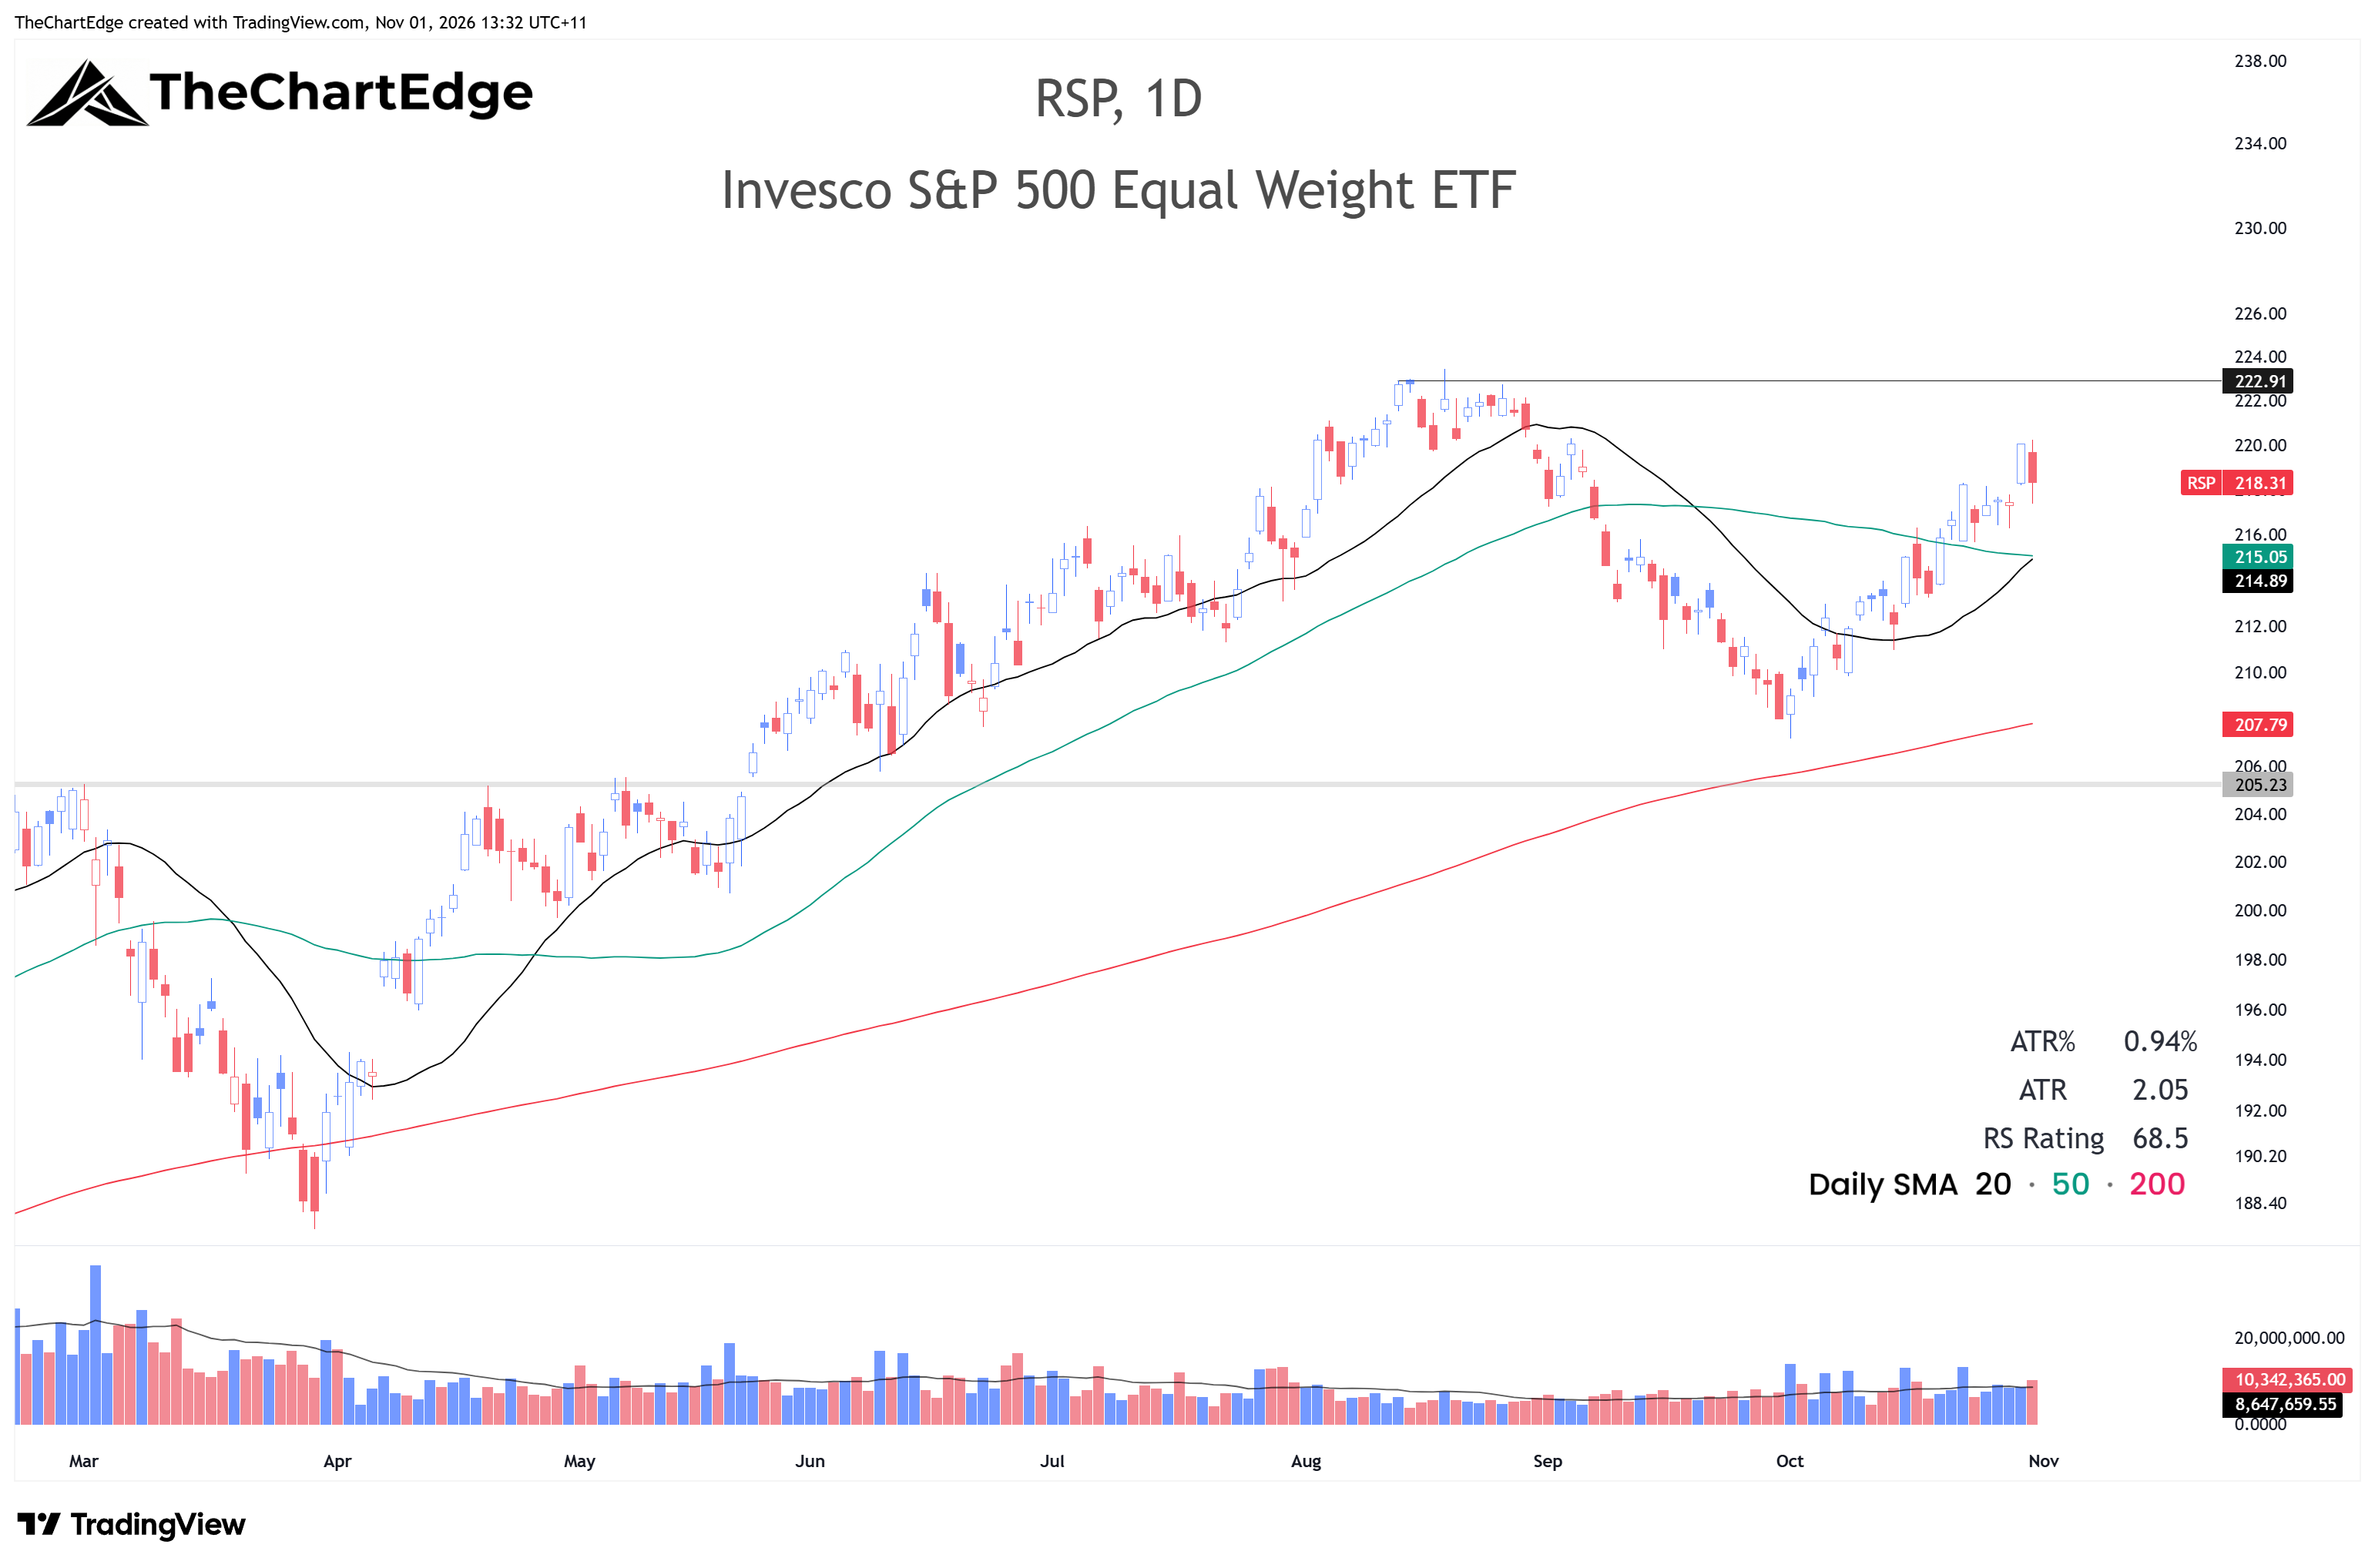
RSP is the best-looking index chart right now. It closed at 218.31, above its 20 and 50-day SMAs, with the 20-day about to cross back above the 50-day. It’s roughly 2% below the August all-time high, but it can’t hold the cap-weighted indices up if tech and the mega-caps keep falling.
Market Temperature
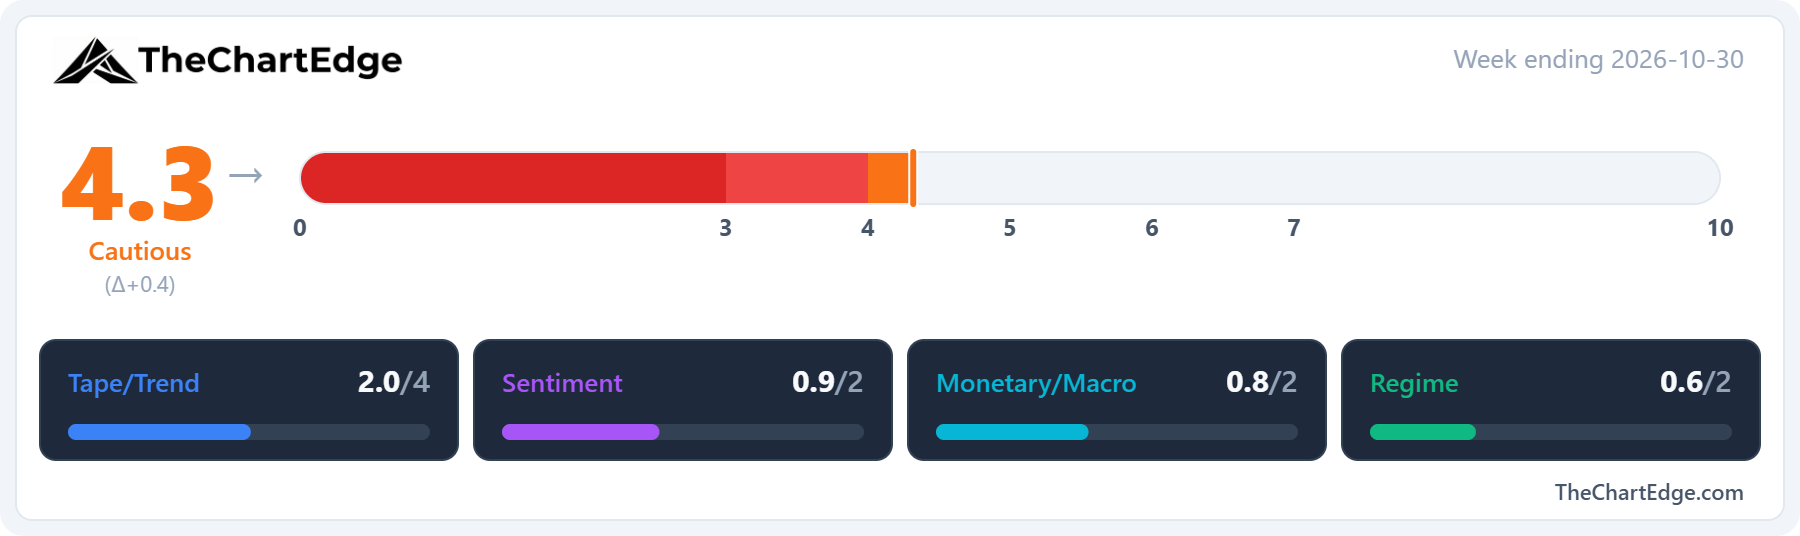
The Market Temperature came in at 4.3, up from 3.9, and is back in the Cautious Zone after 2 weeks in High Risk.
The Tape/Trend and Monetary/Macro pillars contributed almost equally. Breadth improved a little - the share of US stocks above their 50-day moving average rose to 41.6% from 38.2%, and 28.3% two weeks ago, and the 200-day measure to 45.1% from 43.9%. SPY’s weekly RSI slipped to 53.6 from 55.6 but scored better as the two-week comparison dropped to 57.2 from 65.1.
Most of the Monetary/Macro gain came from the model’s look-back again. The MOVE index eased to 100.2 from 103.3, but its four-week comparison also jumped to 107.3 from 96.0. UUP and IEI/HYG were both up slightly but scored better against their higher four-week comparisons. The 10 and 30-year yields finished at 4.93% and 5.31%, from 4.99% and 5.32%.
The Sentiment and Regime pillars were unchanged to one decimal place.
GICS Sector Relative Strength
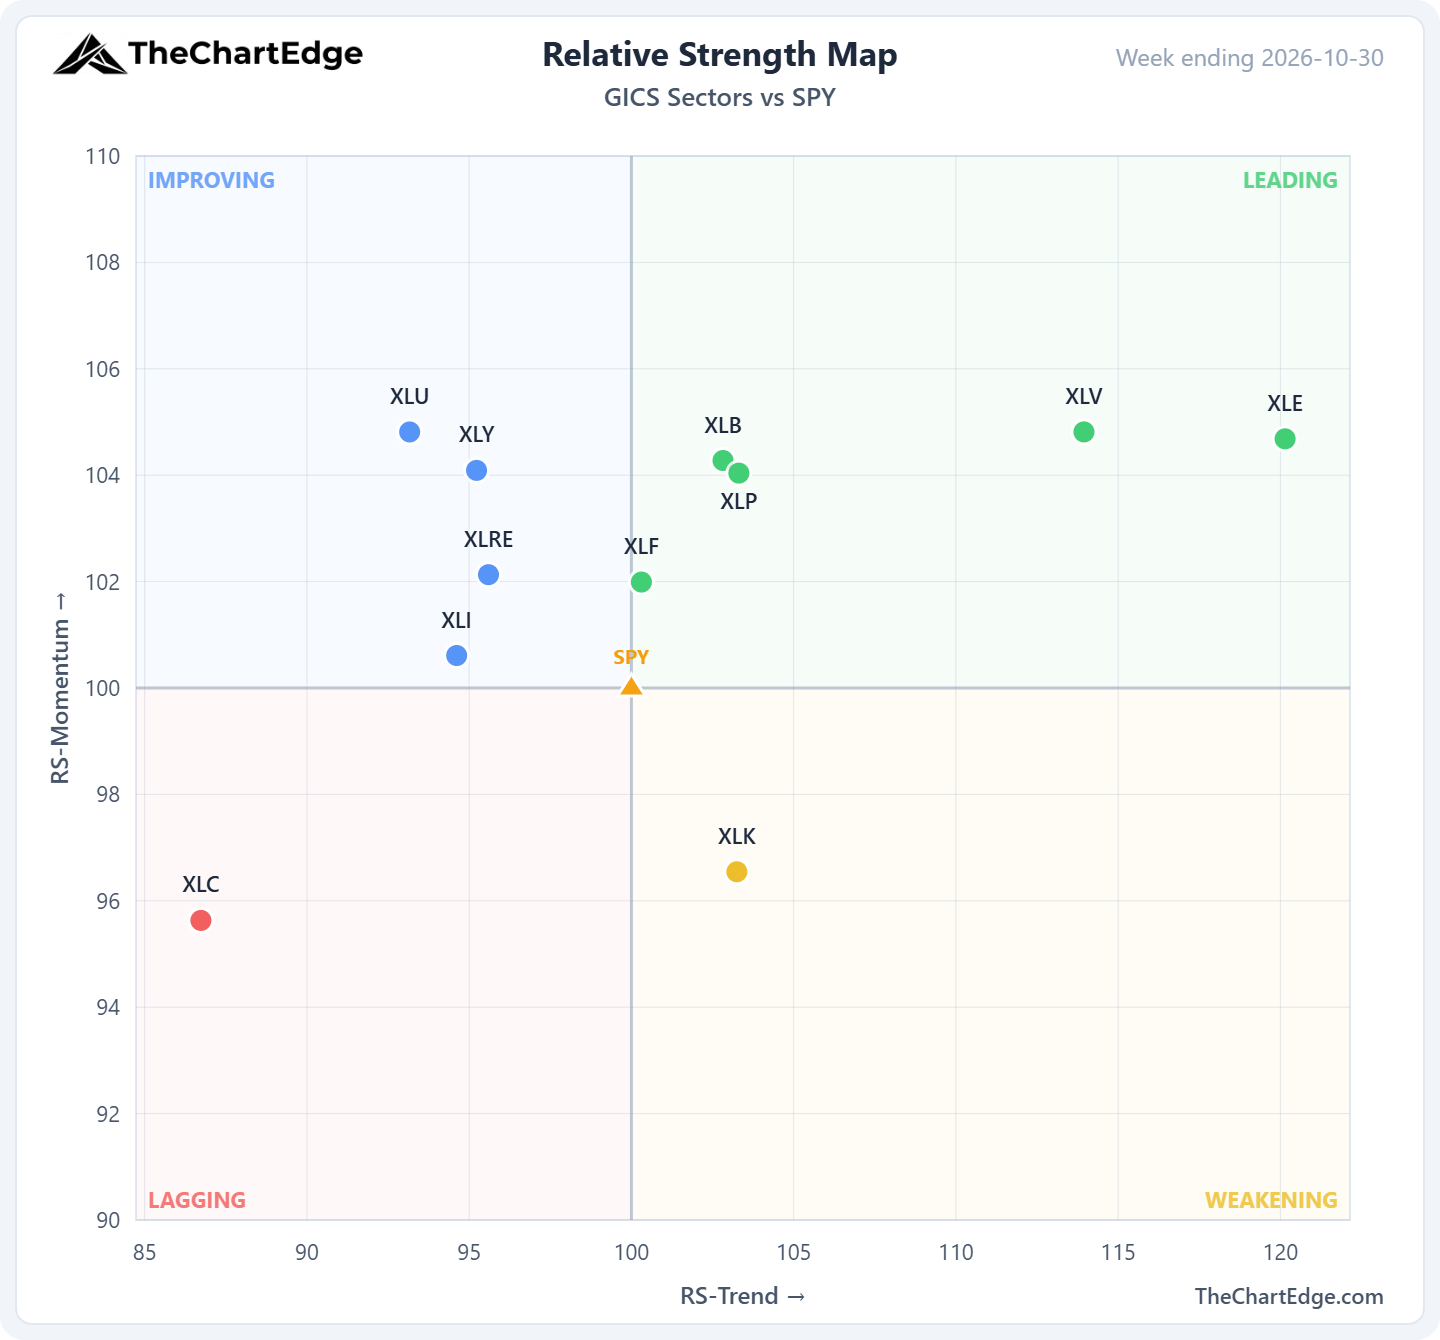
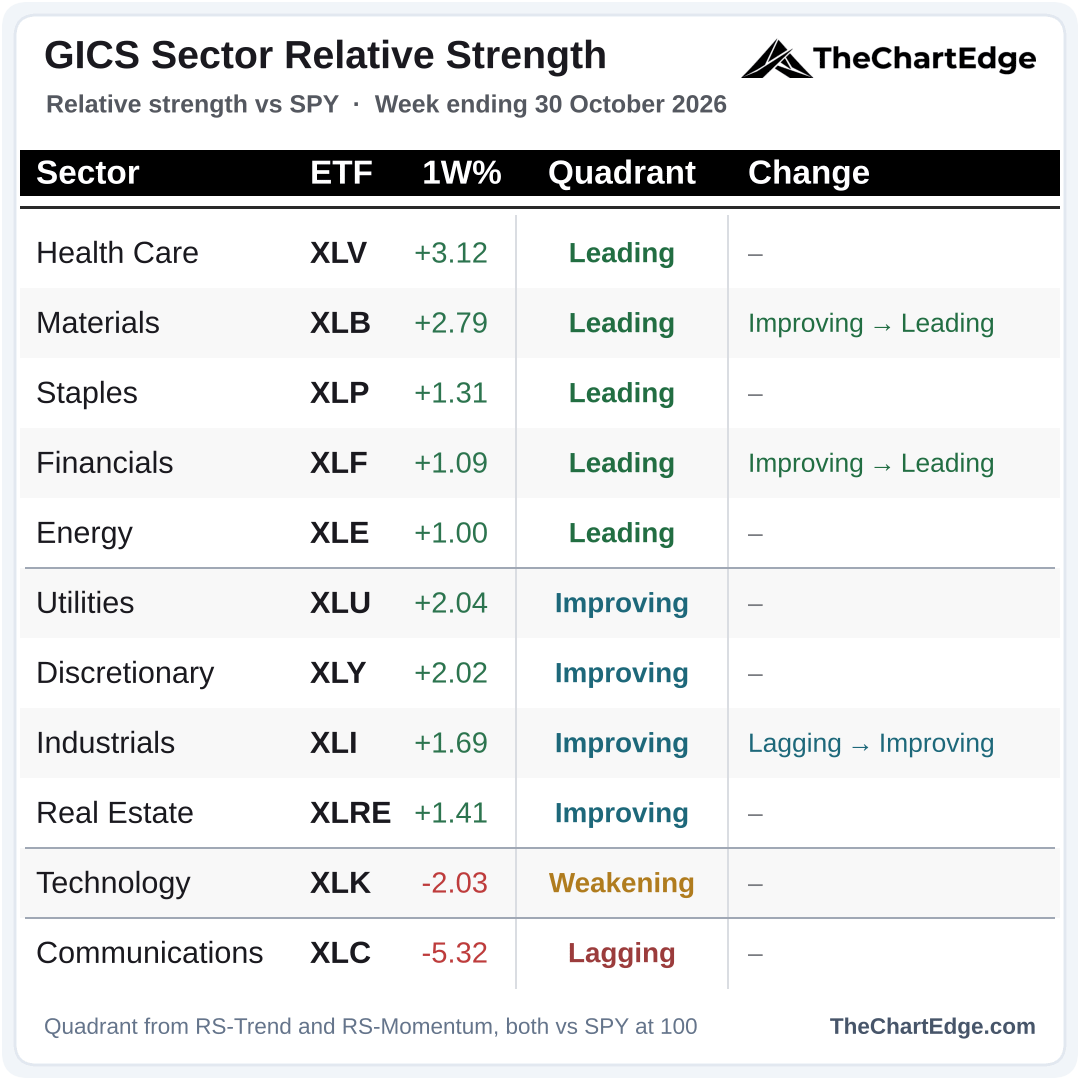
9 of the 11 sectors outperformed SPY - technology and communications underperformed. Health care, materials and utilities led. Materials and financials both moved into Leading, joining health care, staples and energy, making 5 sectors now in Leading. Industrials moved up into Improving, leaving communications as the only sector in Lagging.
Momentum Leaderboard
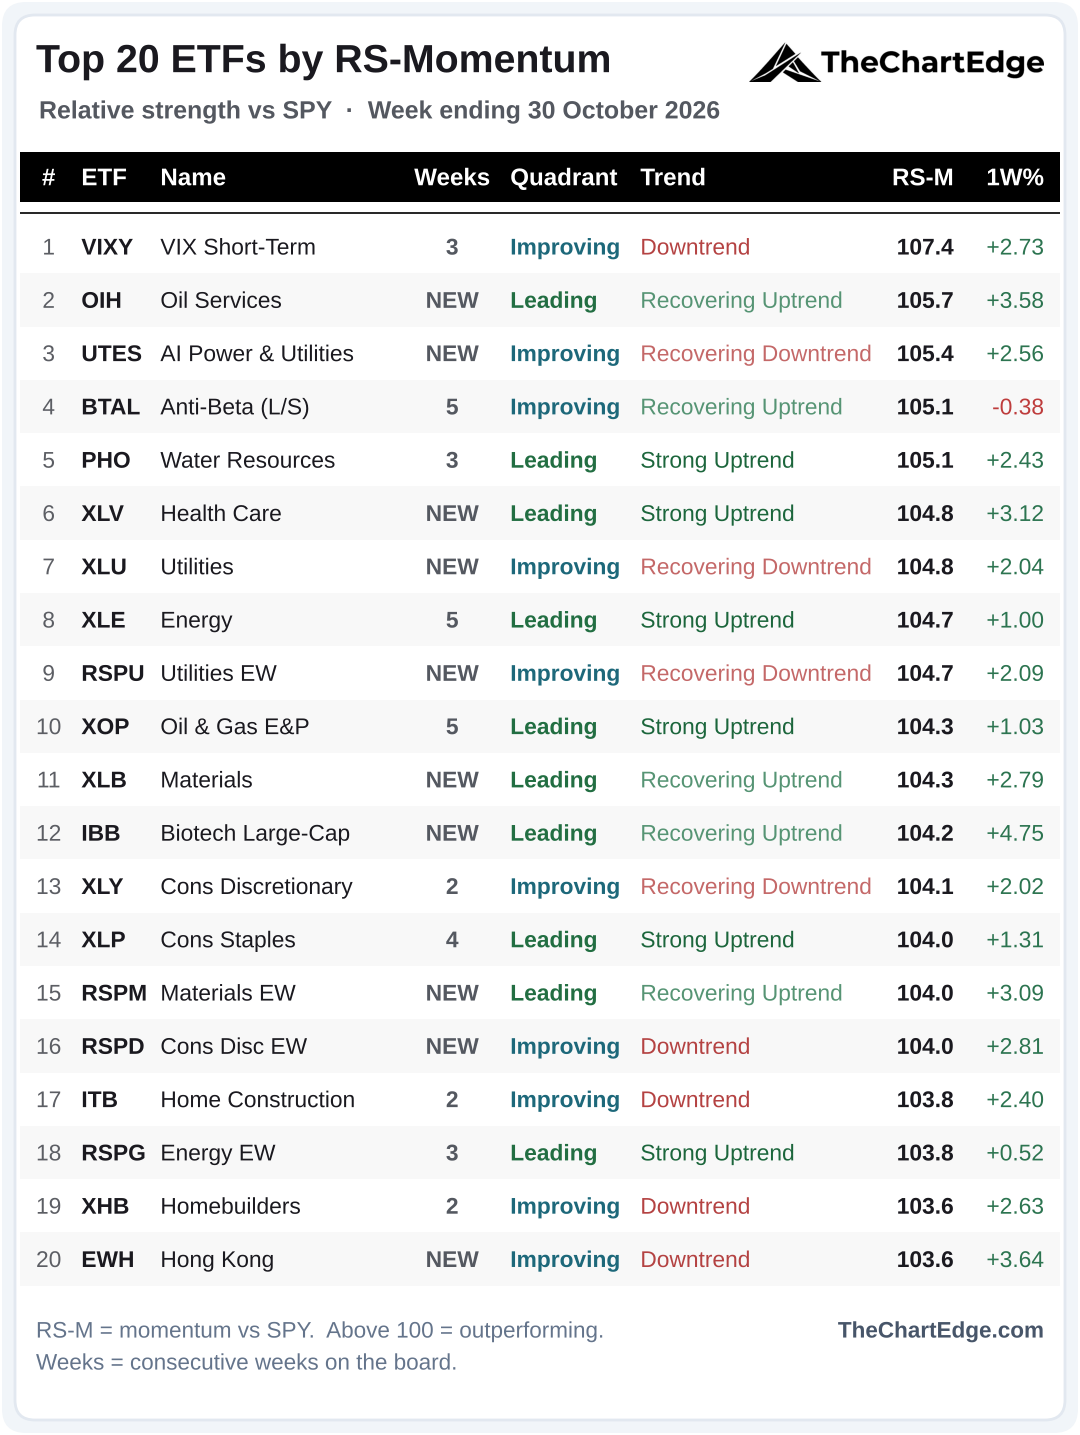
10 of the 20 are new, and the board has a defensive tilt again. The VIX (VIXY) takes number 1, with Anti-Beta (BTAL) at number 4. The arrivals include 3 utilities names - XLU, equal-weight utilities (RSPU) and AI power & utilities (UTES) - plus health care (XLV), large-cap biotech (IBB), materials (XLB and RSPM), oil services (OIH), equal-weight consumer discretionary (RSPD) and Hong Kong (EWH).
Software couldn’t hold its spot, with equal-weight software (XSW), software (IGV) and cybersecurity (CIBR) all dropping off. Brazil (EWZ), Bitcoin (IBIT), Ethereum (ETHA), crude (USO), medical devices (IHI), equal-weight staples (RSPS) and equal-weight health care (RSPH) also fell off.
IBIT’s streak ends at 10 weeks, and BTAL, energy (XLE) and oil & gas E&P (XOP) now share the longest streak at 5.
The board isn’t looking healthy, with 9 of the 20 in downtrend states.
Trend States Across the Universe
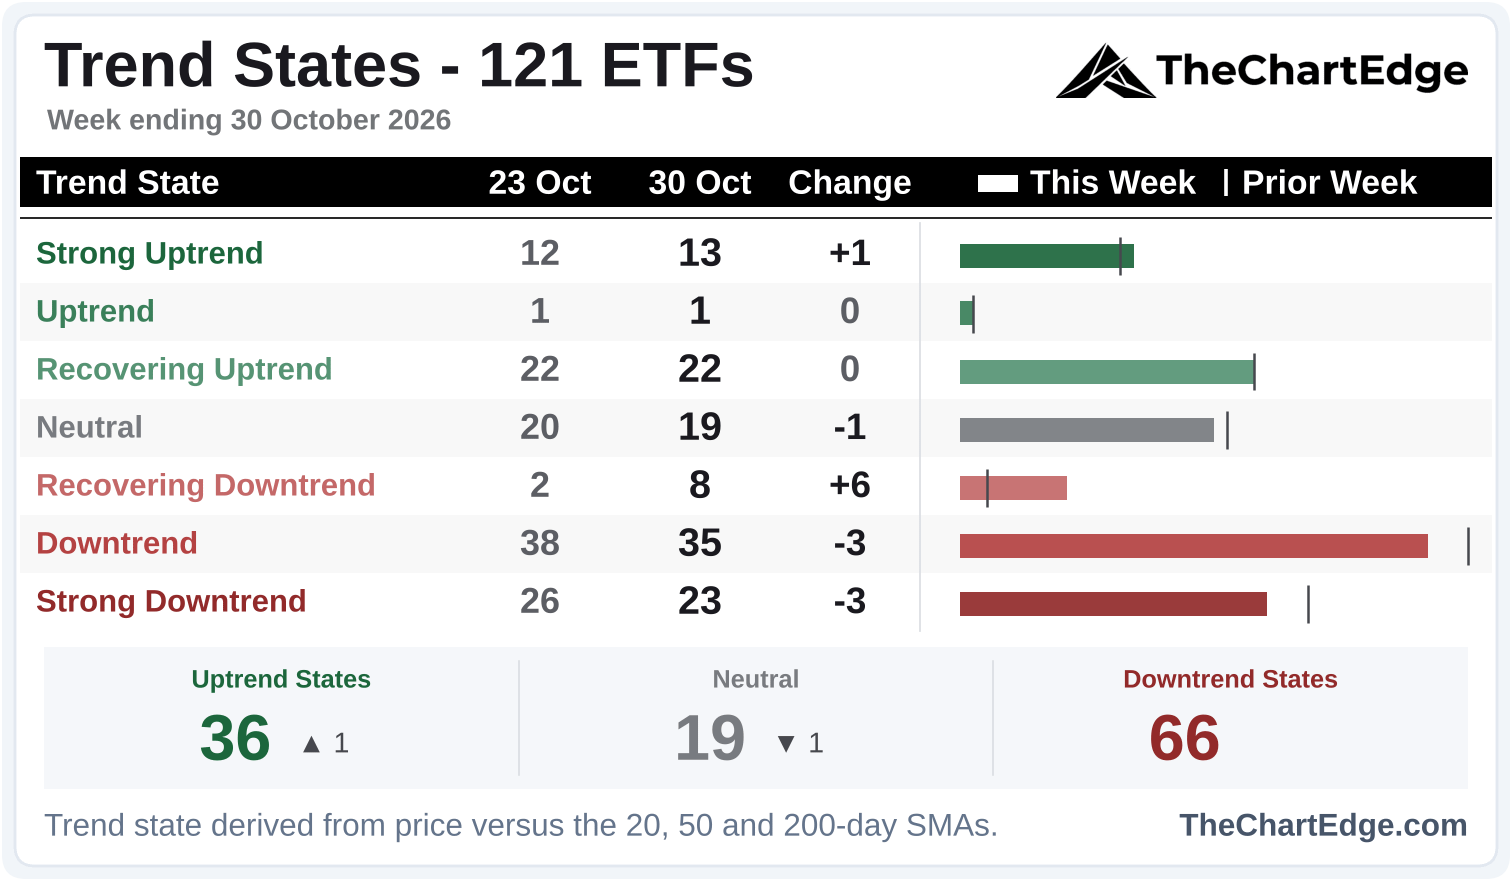
Uptrend states barely moved in aggregate, but some names improved their trend state - small caps (IWM), mid-caps (MDY) and capital markets (KCE) went from Downtrends to Recovering Uptrends, and all 6 that moved into Recovering Downtrends came up from Downtrends, including utilities (XLU and RSPU) and consumer discretionary (XLY).
Software (IGV) and cybersecurity (CIBR) dropped straight from Strong Uptrends to Neutral, and Brazil (EWZ) went from a Strong Uptrend to a Downtrend in one week, falling 23.8% after Lula’s runoff win.
Industry Breadth - Leading Stocks
I’ve left this board out this weekend. The universe is stocks that have outperformed QQQ over 12 months, and QQQ’s own 12-month return dropped to 9.2% from 16.5%. That lowered the bar to 10% and grew the universe to 489 names from 350 - roughly half of the Russell 1000, which isn’t really a list of leaders anymore. Of the names in it both weeks, not much changed.
Earnings
Microsoft (MSFT), Alphabet (GOOGL) and Amazon (AMZN) all reported last week. Alphabet was hit hardest, down 12.6% for the week, with Amazon down 3.1% and Microsoft 0.5%.
This week, Apple (AAPL) and Palantir (PLTR) report on Monday, AMD (AMD) and Arista (ANET) on Tuesday, and Qualcomm (QCOM) and Arm (ARM) on Wednesday, all after the close.
Software Pulls Back
Equal-weight Software (XSW) Chart
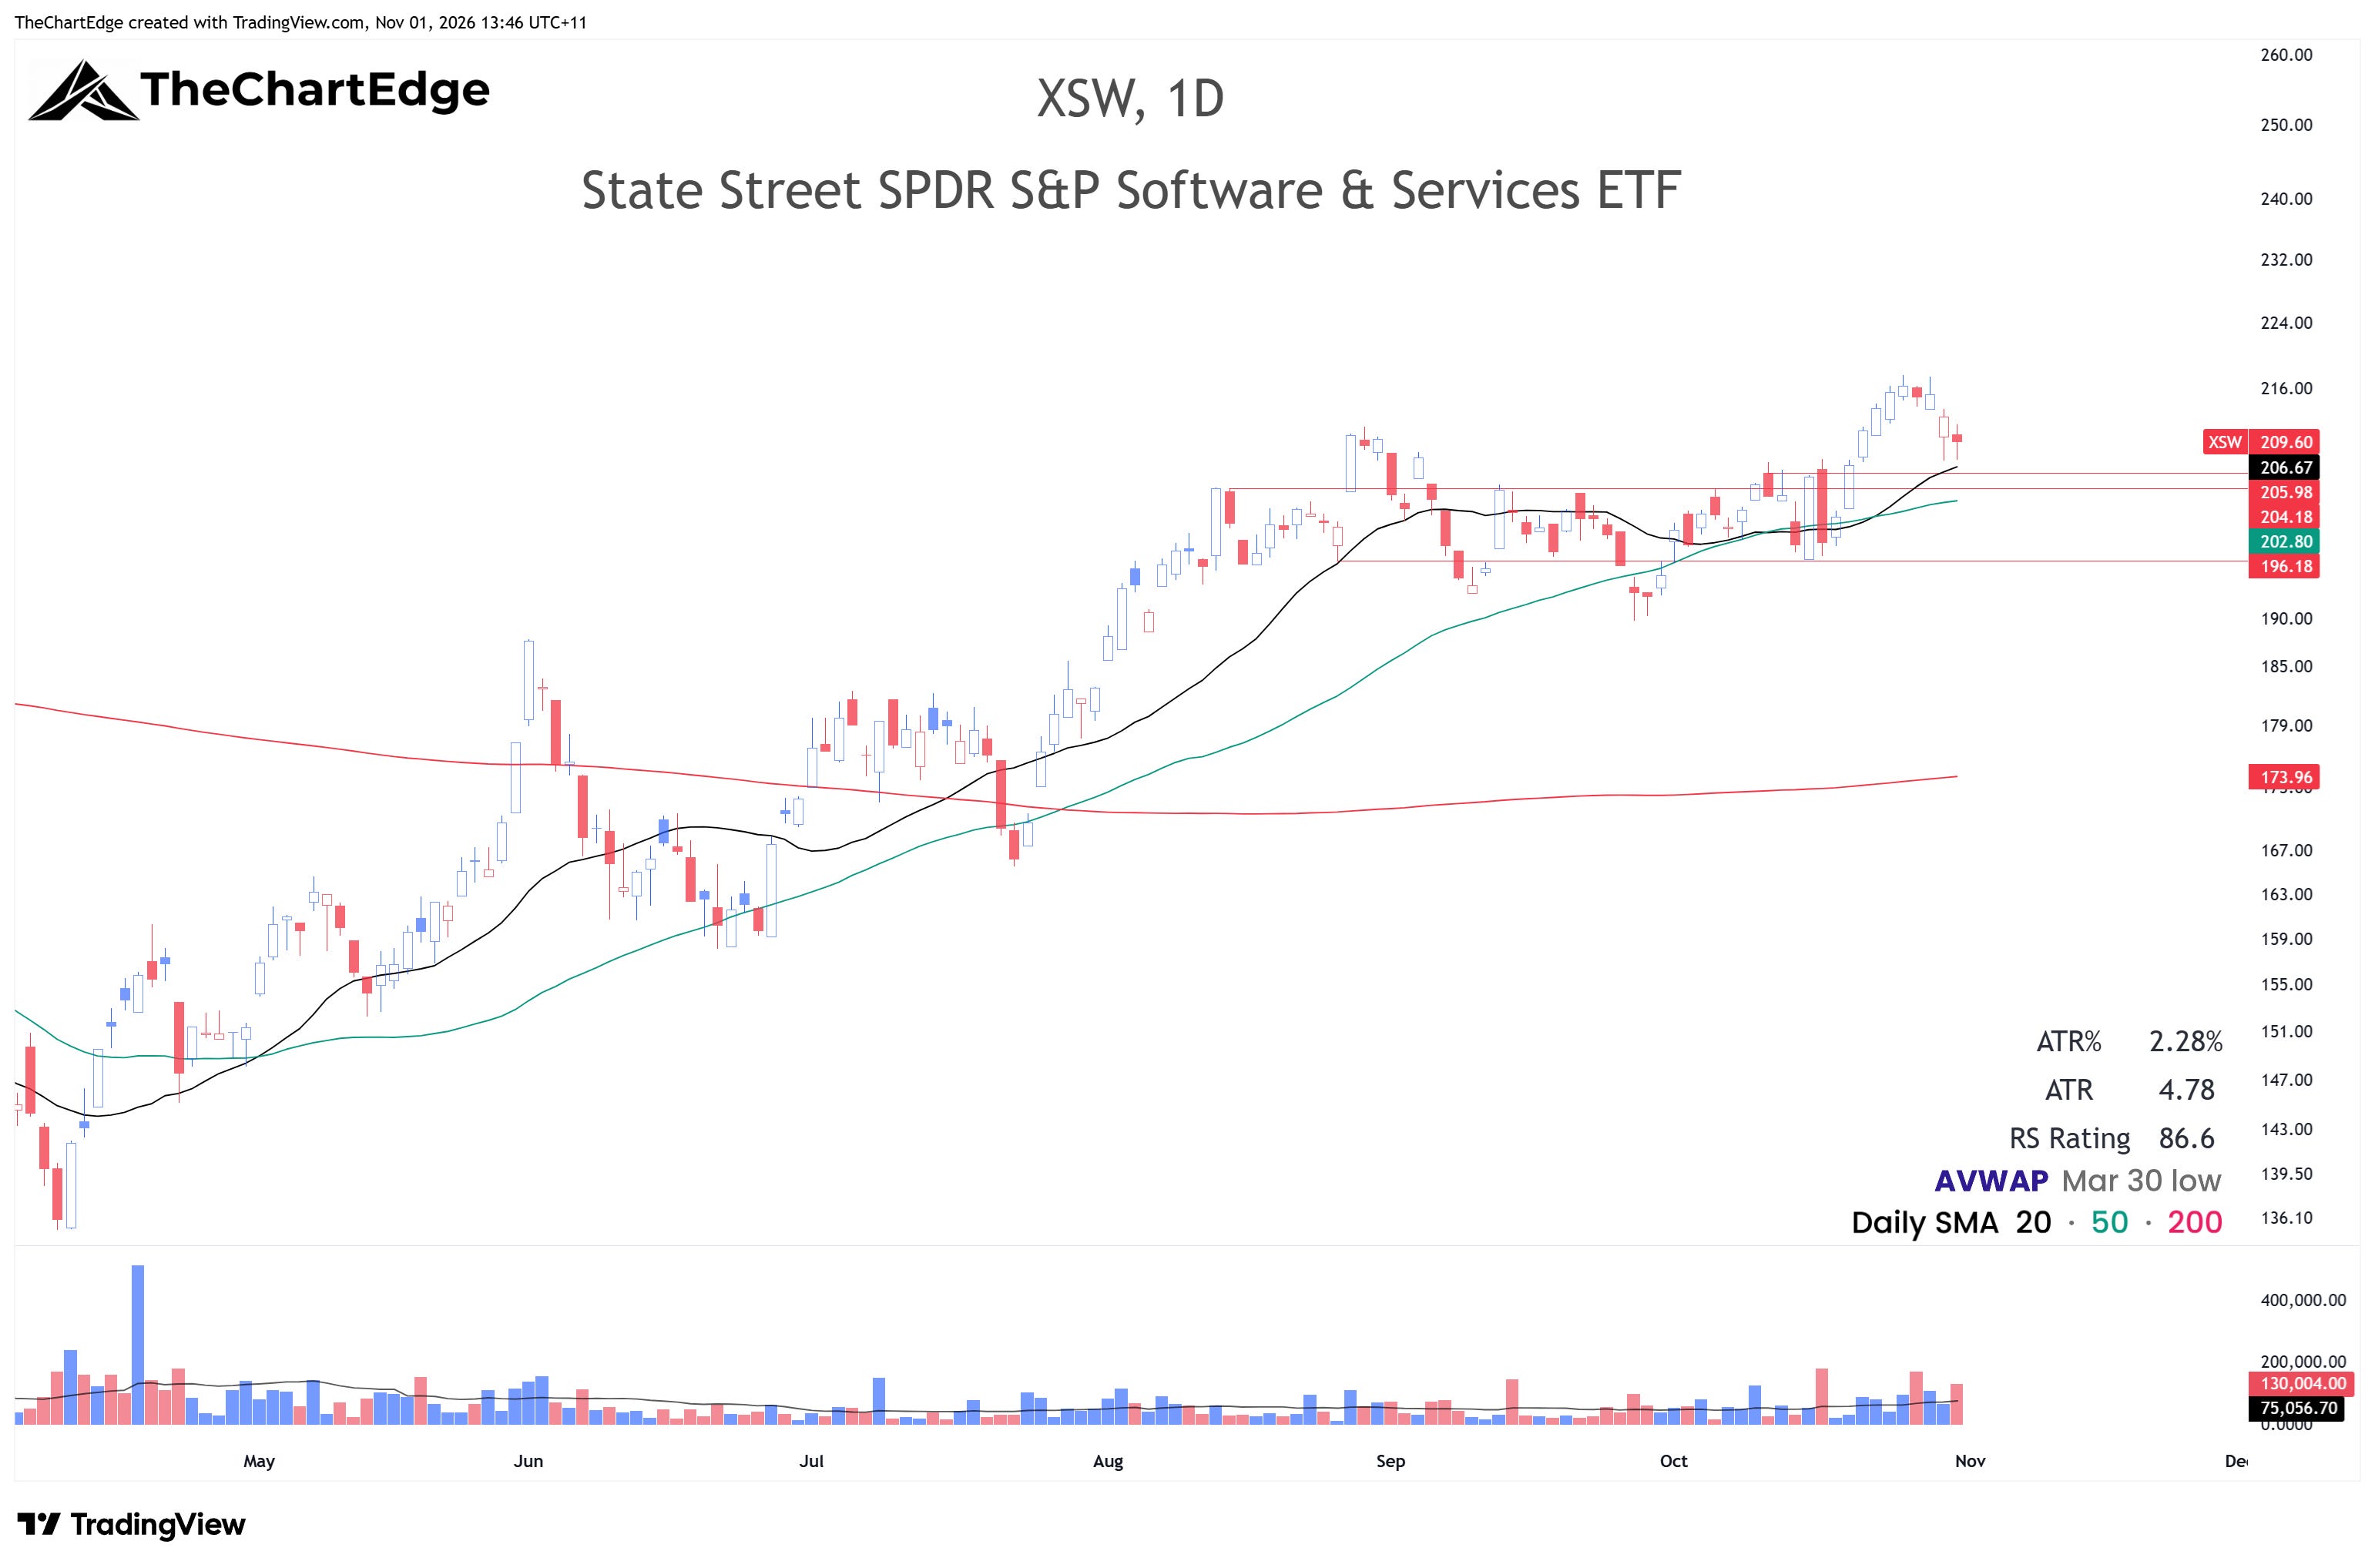
XSW set another all-time high early in the week but pulled back to close at 209.60. It’s still in a Strong Uptrend but would want to hold the old highs around 204 to 206, otherwise it could become another failed breakout.
Software (IGV) Chart
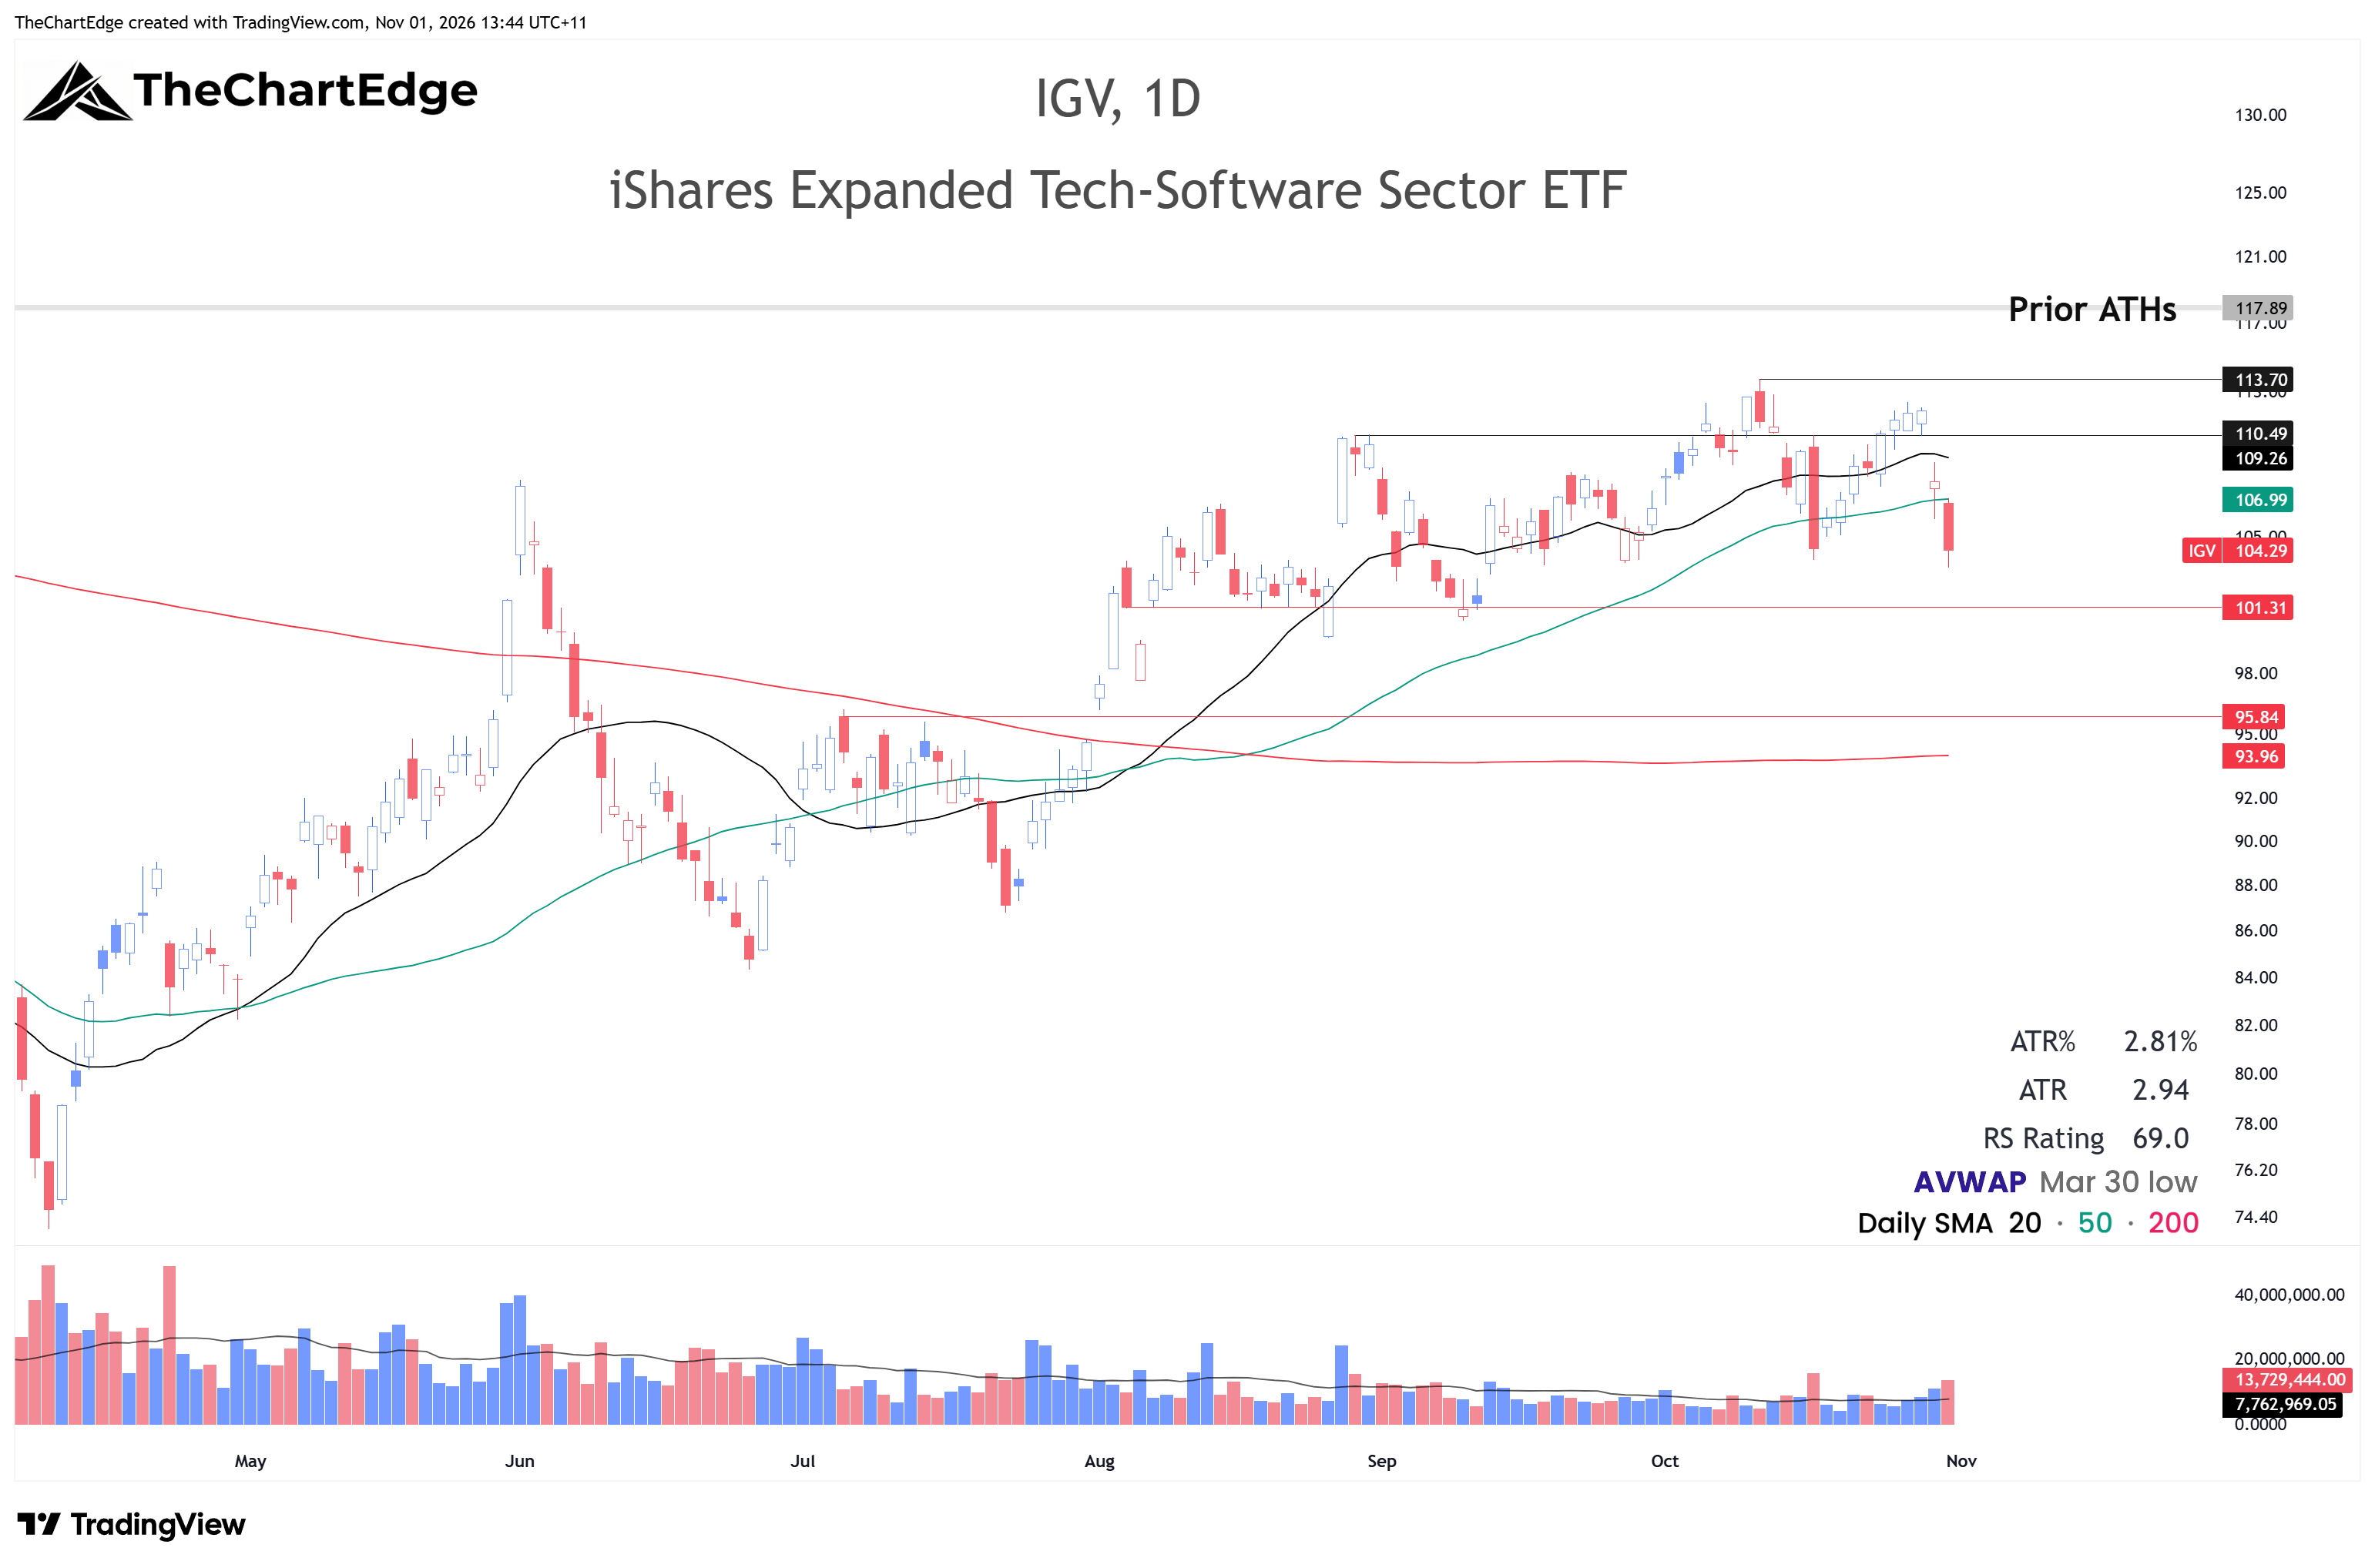
IGV failed again at the 110.50 to 113.70 area and closed at 104.29, below both its 20 and 50-day SMAs.
GitLab (GTLB) Chart
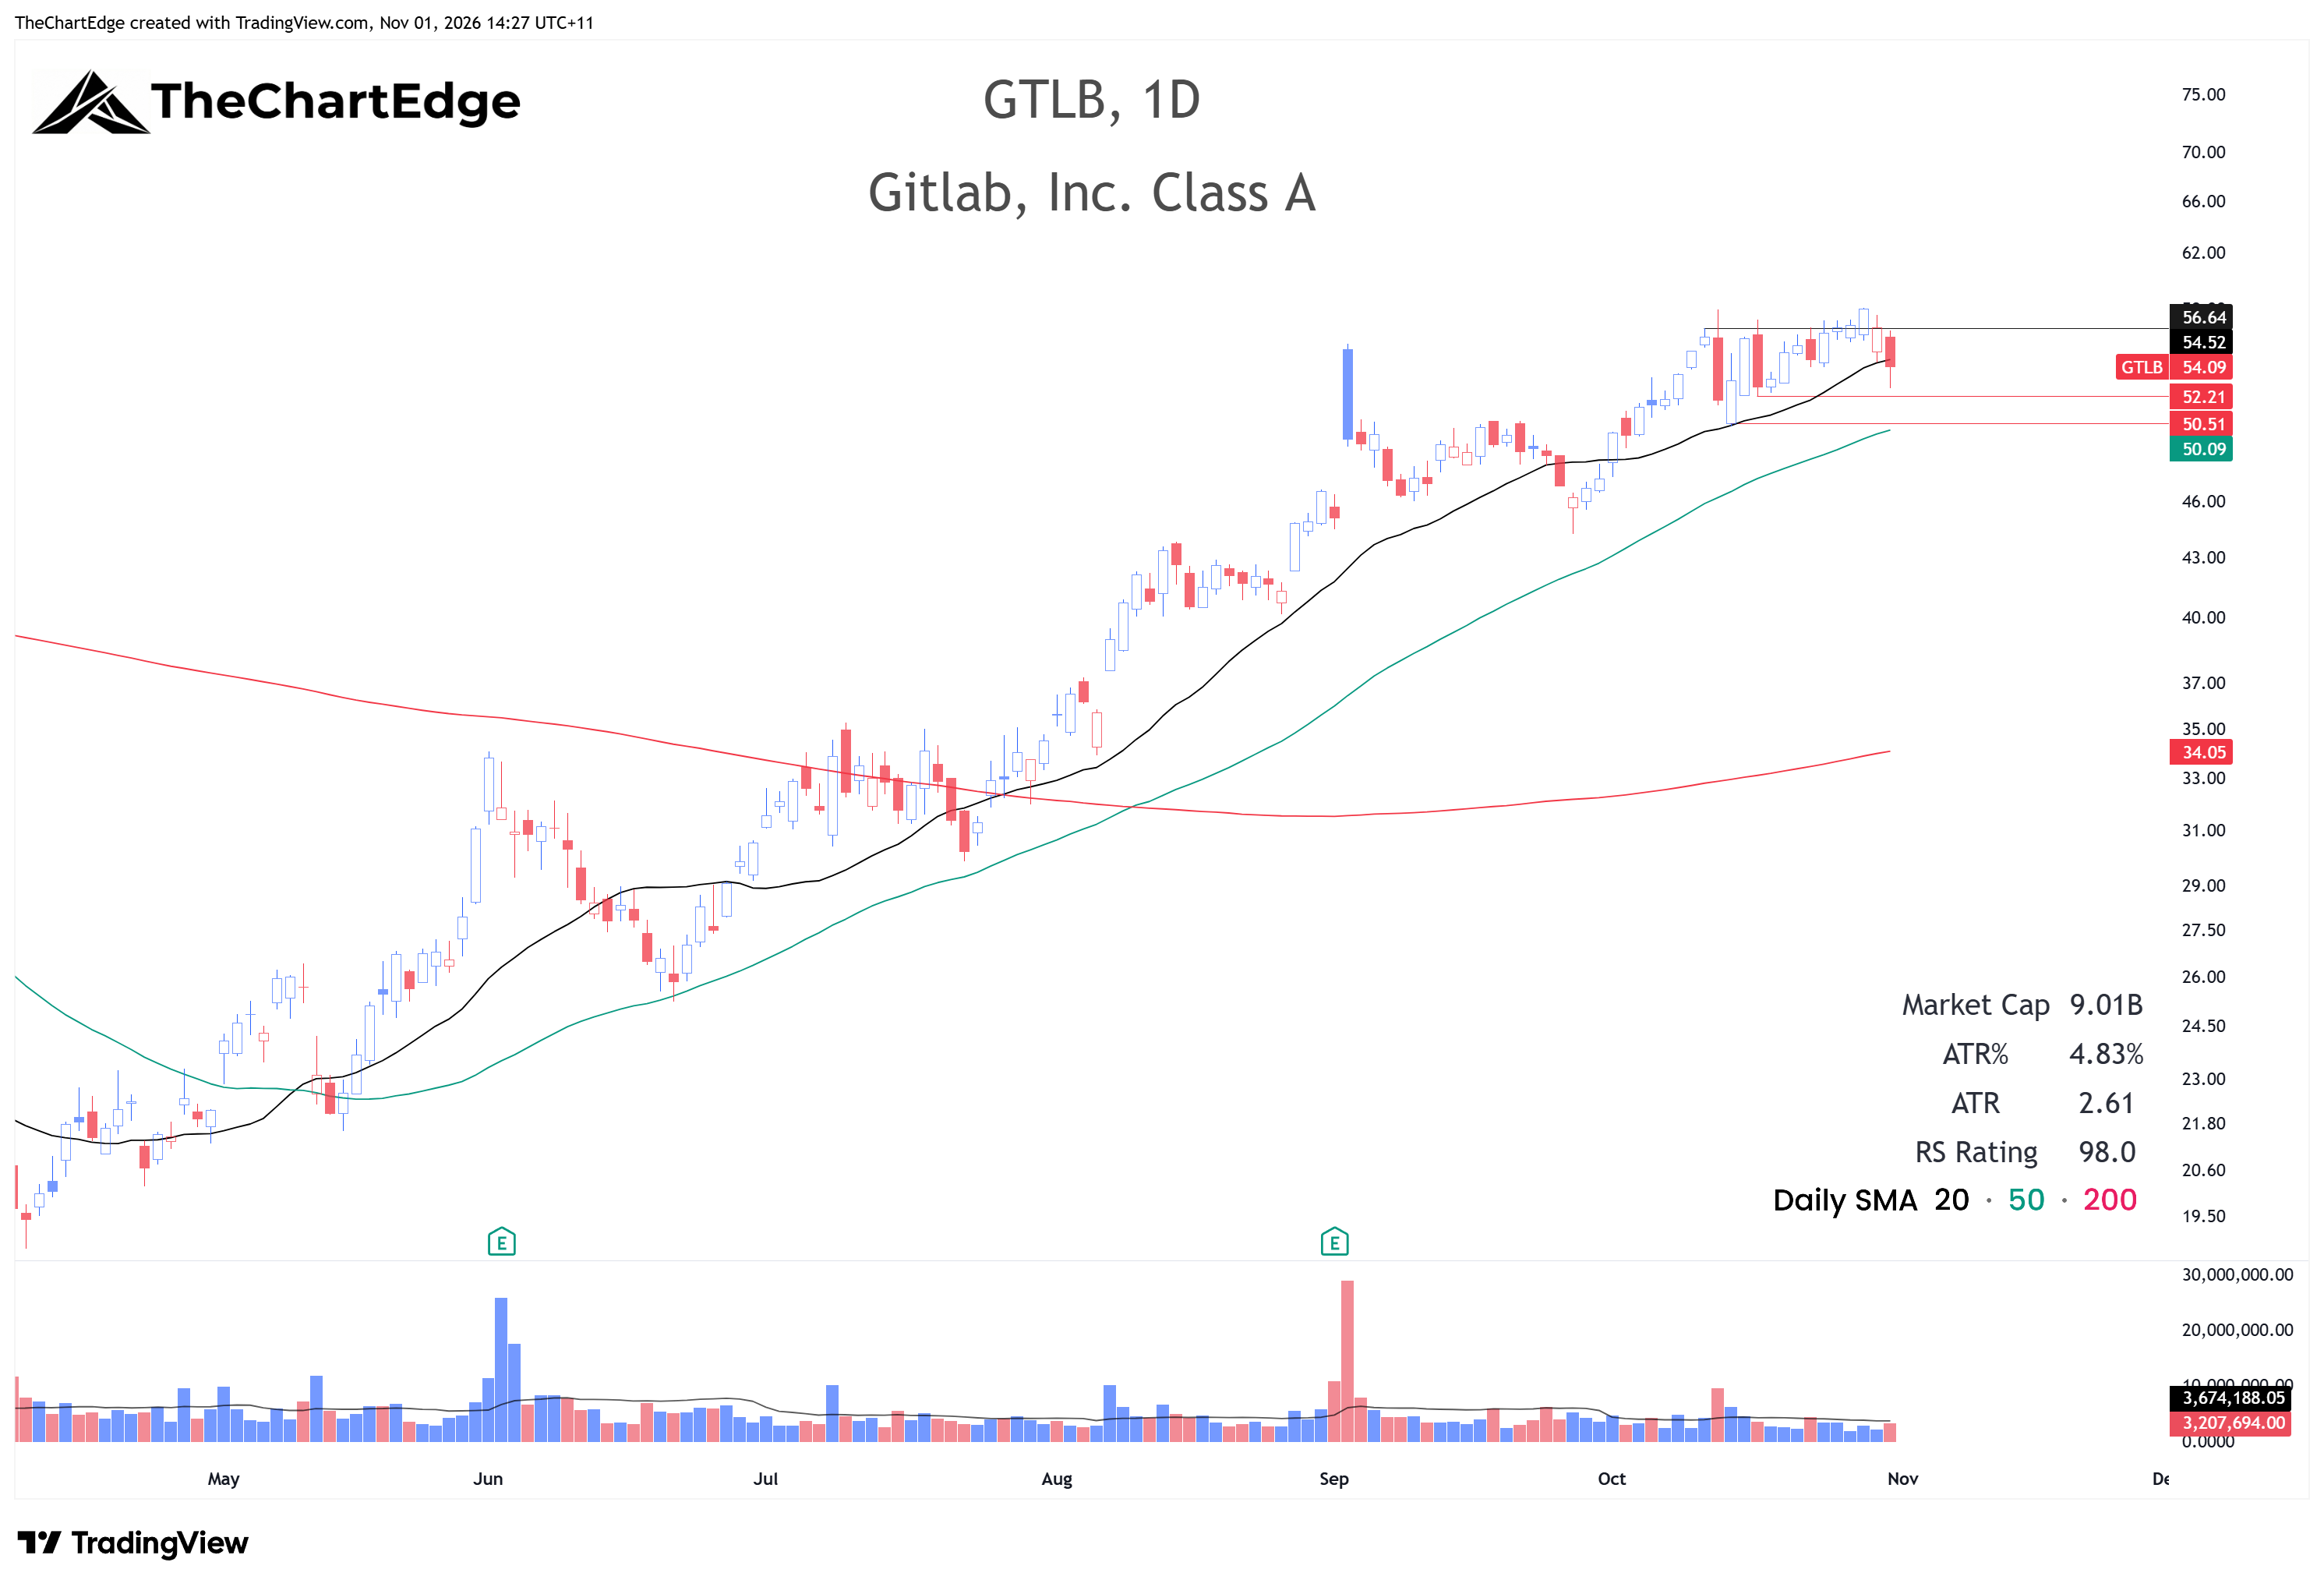
GTLB fell 3.9% to 54.09, just under its 20-day SMA. It poked up to new 52-week highs on Wednesday but fell back into its recent range between 52.21 and 56.64. I’m still watching this one and may take a long position if it can make a decisive breakout above the recent highs.
Semi Indices Down Big on Friday
Semiconductors (SMH) Chart
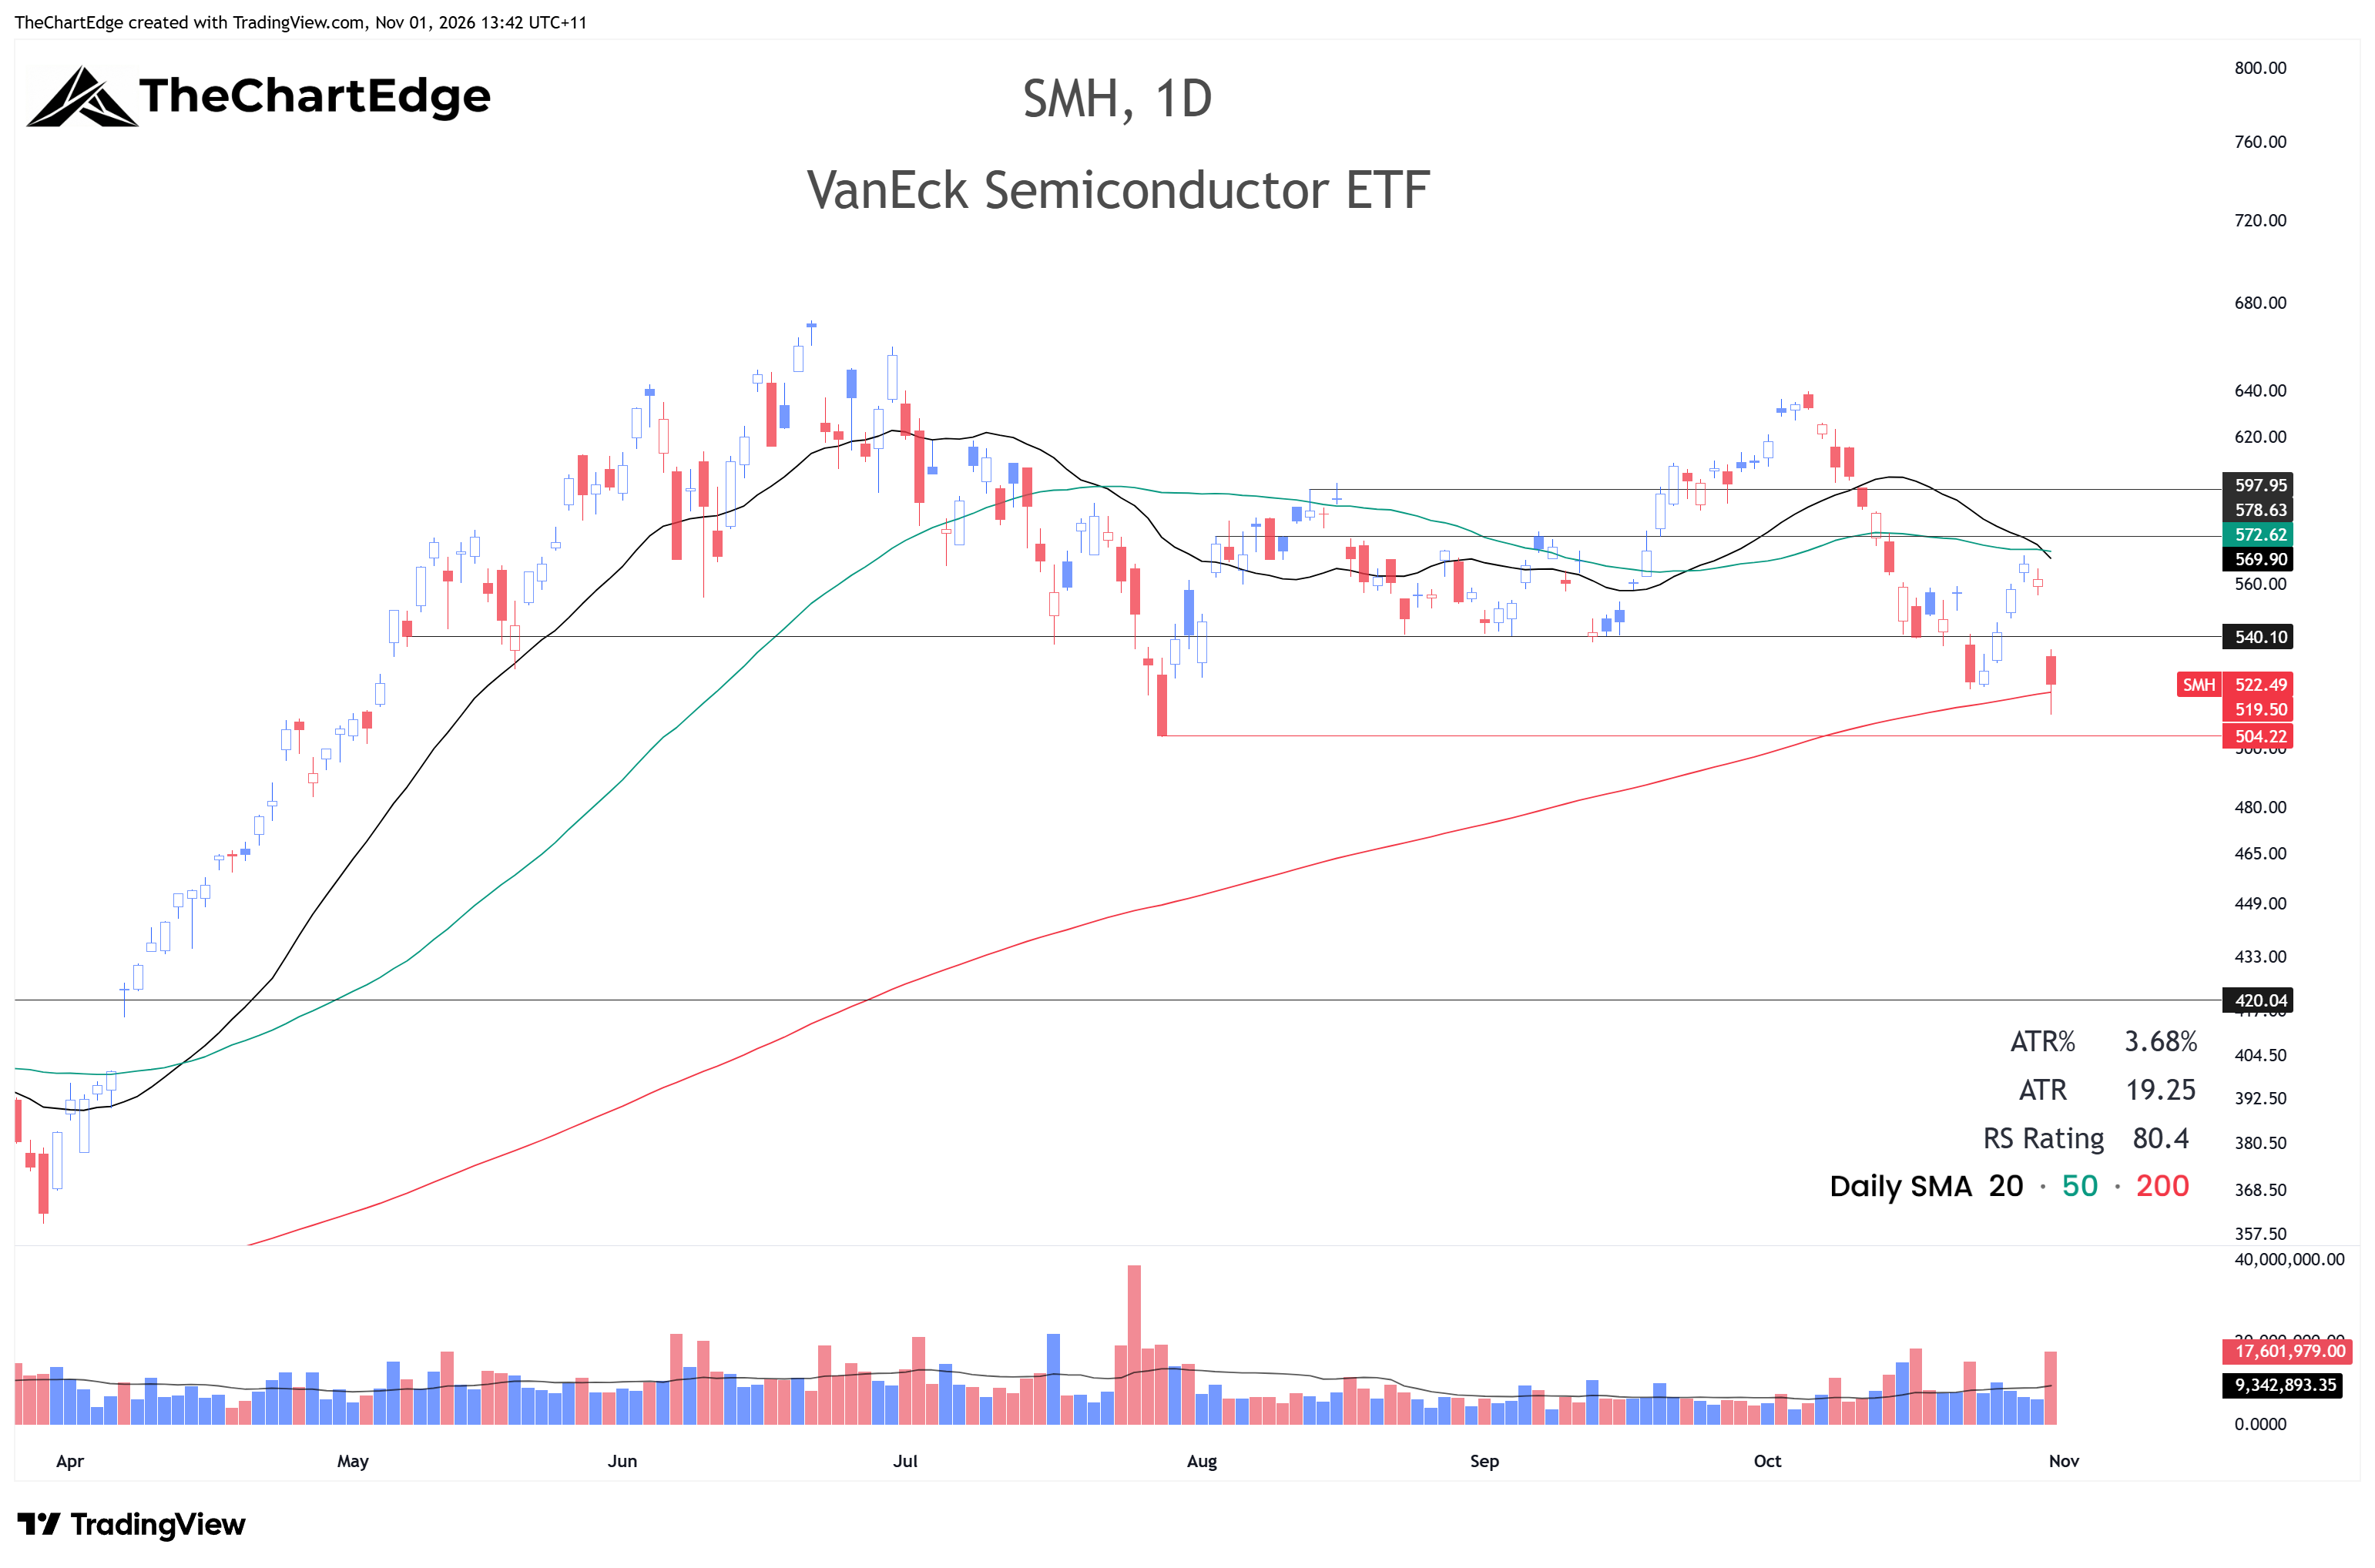
Last weekend I said an undercut and reclaim of the 200-day SMA could offer a good risk/reward entry, but I’d treat it as a bounce trade until proven otherwise. SMH did undercut and reclaim the 200-day on Friday but not in a way that looks particularly positive to me. Friday was a large gap down and the bounce off the lows was weak. I’ll just watch for now and possibly play the long side through either the stocks below or maybe the Nasdaq 100 CFD.
Analog Devices (ADI) Chart
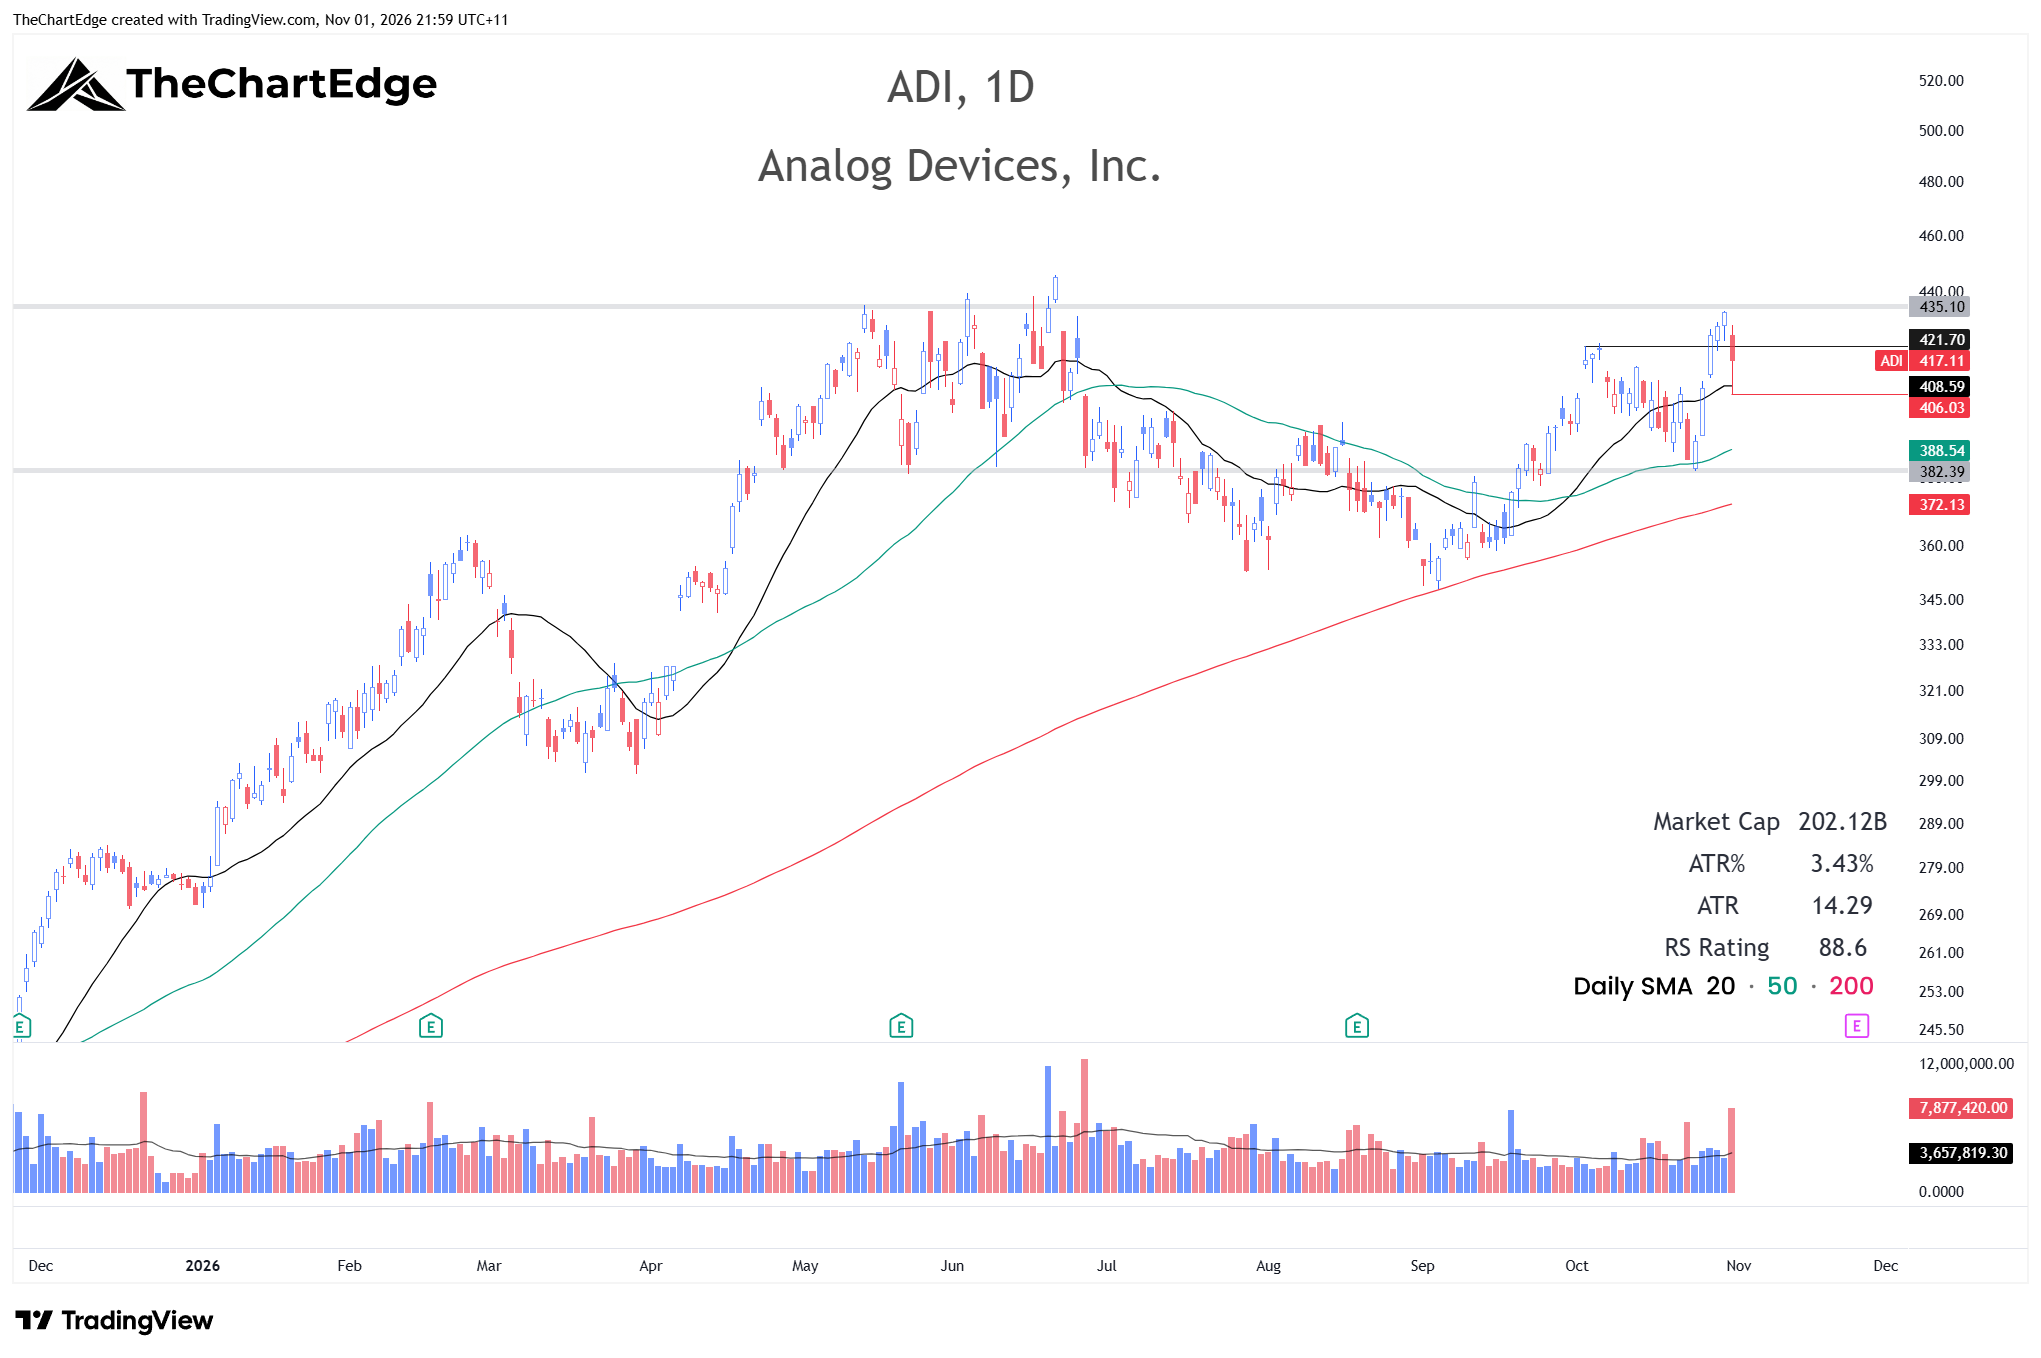
ADI rose 6.7% last week and is in a Strong Uptrend. It closed at 417.11, 6.5% below its all-time high around 445.92. If it can tighten up here between the 20-day SMA and 435, it could provide a good risk/reward entry.
Texas Instruments (TXN) Chart
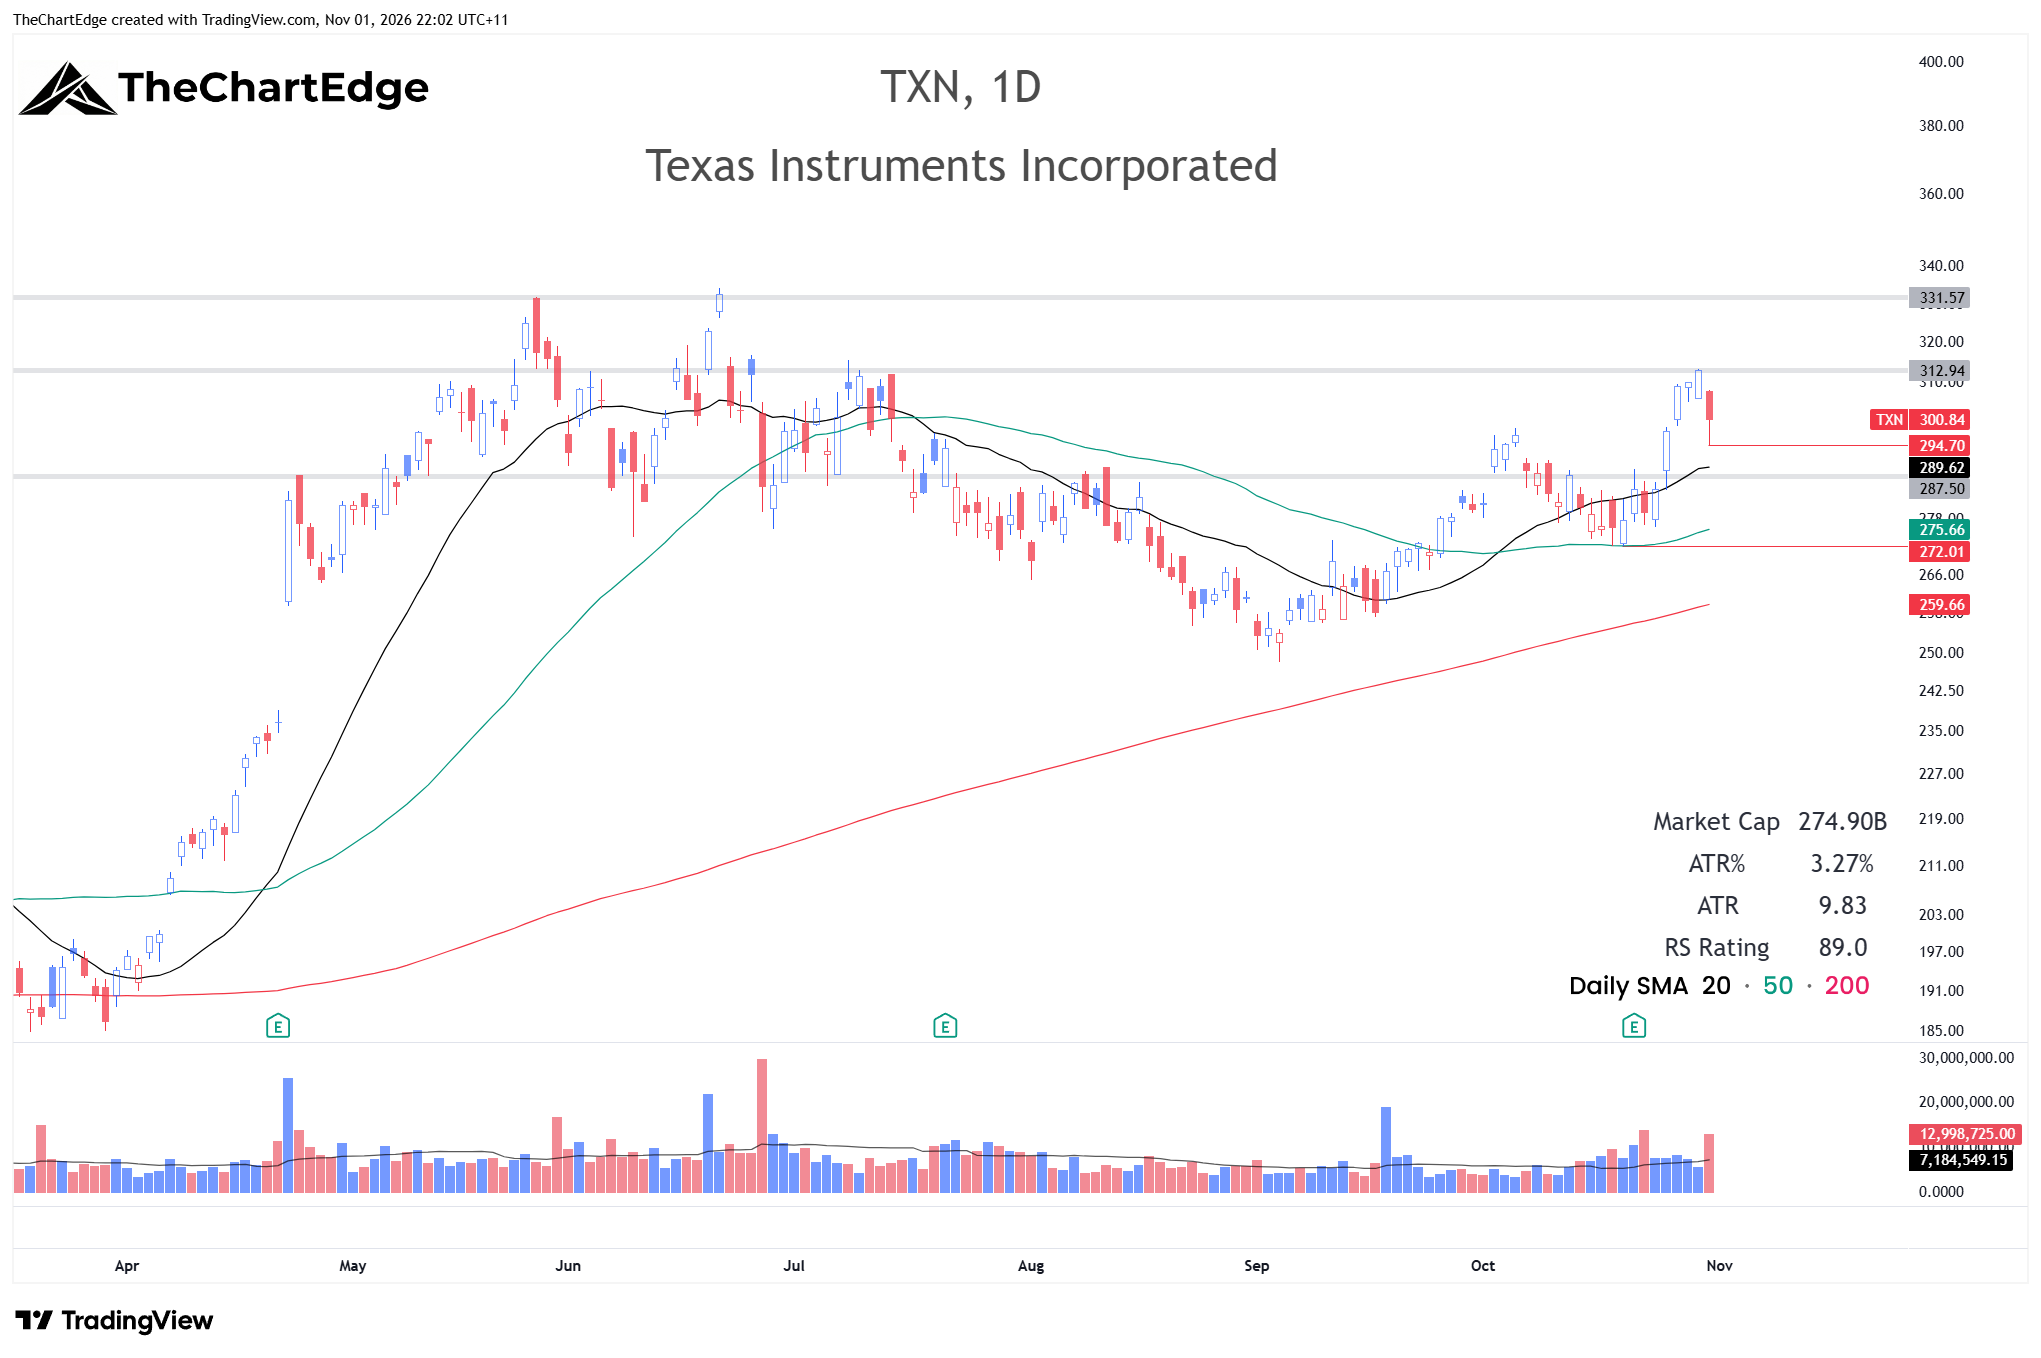
TXN rose 5.7% and is also in a Strong Uptrend. It closed at 300.84, 9.9% below its all-time high. Like ADI it needs to tighten up a bit here, but if it can consolidate for a while between the 20-day SMA and 313, it too could provide a good low-risk entry into a semi stock not far from all-time highs - of which there are currently very few.
Biotech & Health Care Showing Strength Again
Genomics (ARKG), large-cap biotech (IBB), biotech (XBI), pharmaceuticals (XPH) and health care (XLV) were 5 of the 9 best performers of the 121 ETFs I track last week.
Large-Cap Biotech (IBB) Chart
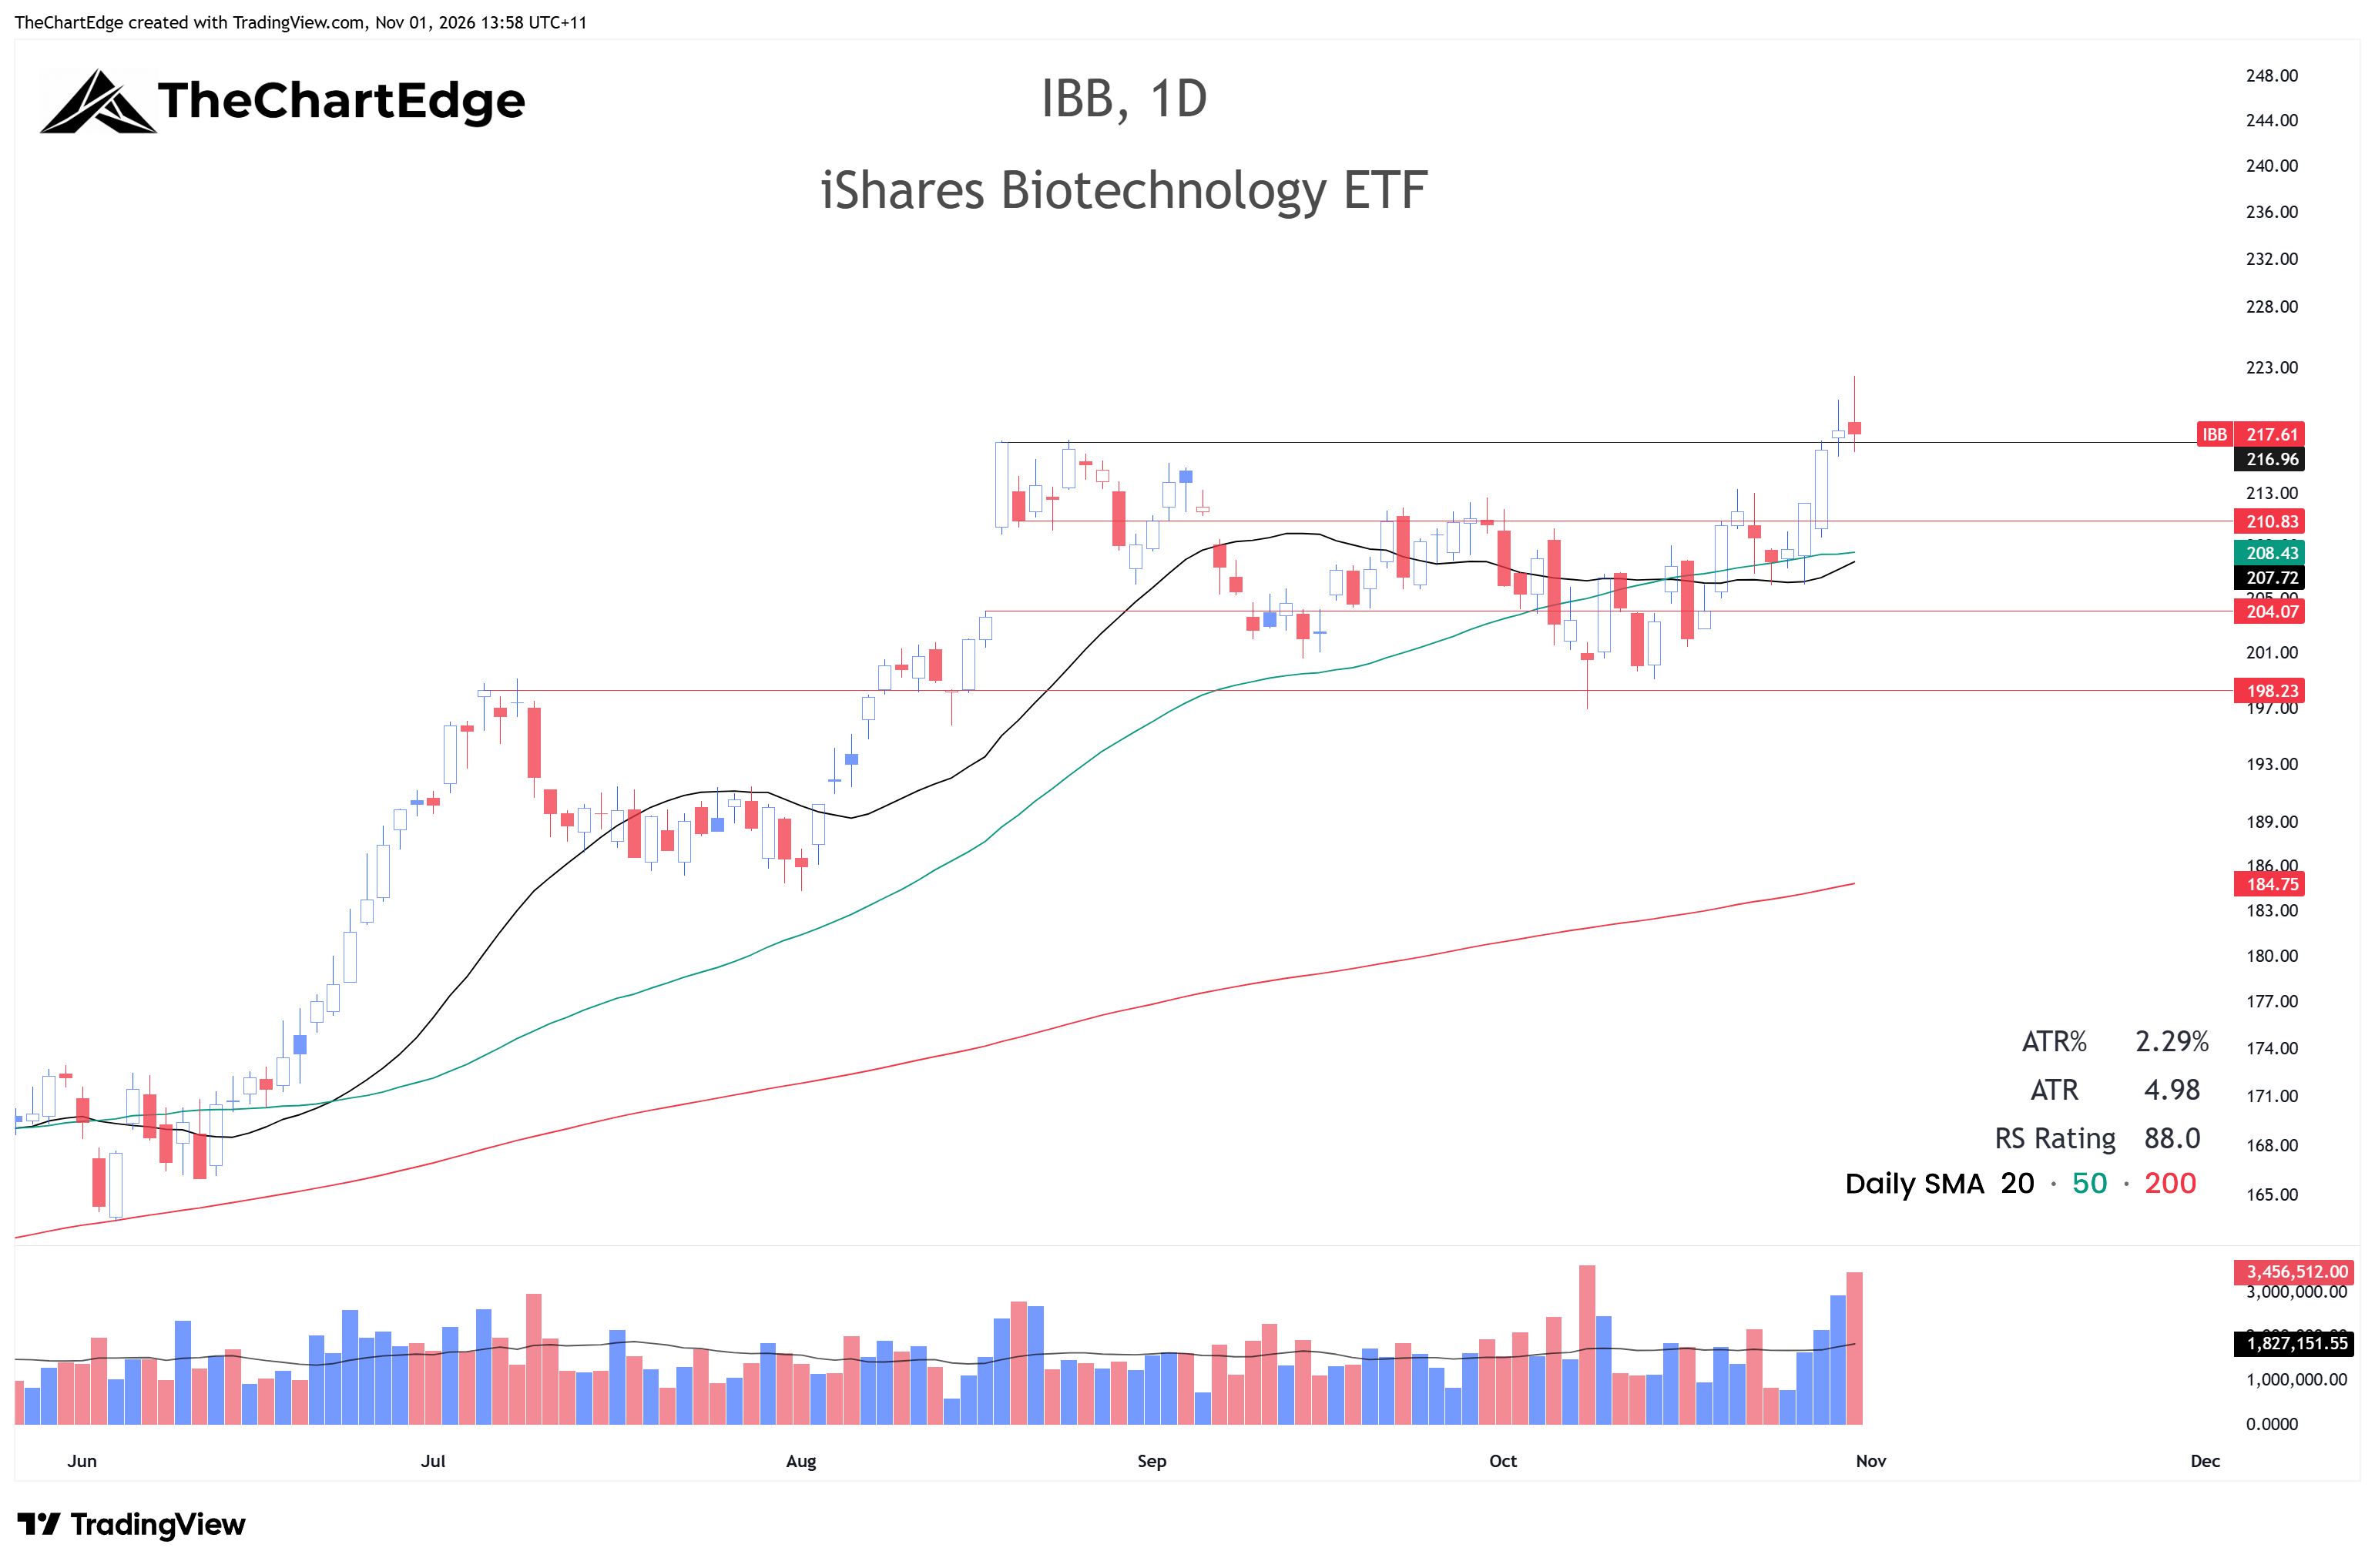
IBB broke out above its August highs around 216.96 on Thursday, making a closing all-time high. It continued to push higher on Friday to a new intraday high around 222, but faded to close at 217.61. I will be watching to see if it pulls back to the 212-213 area. If it has a reasonably gentle pullback, the 20-day SMA should cross above the 50-day and be around this area. I will be looking to get long if this plays out and it appears to have support in this area.
Genomics (ARKG) Chart
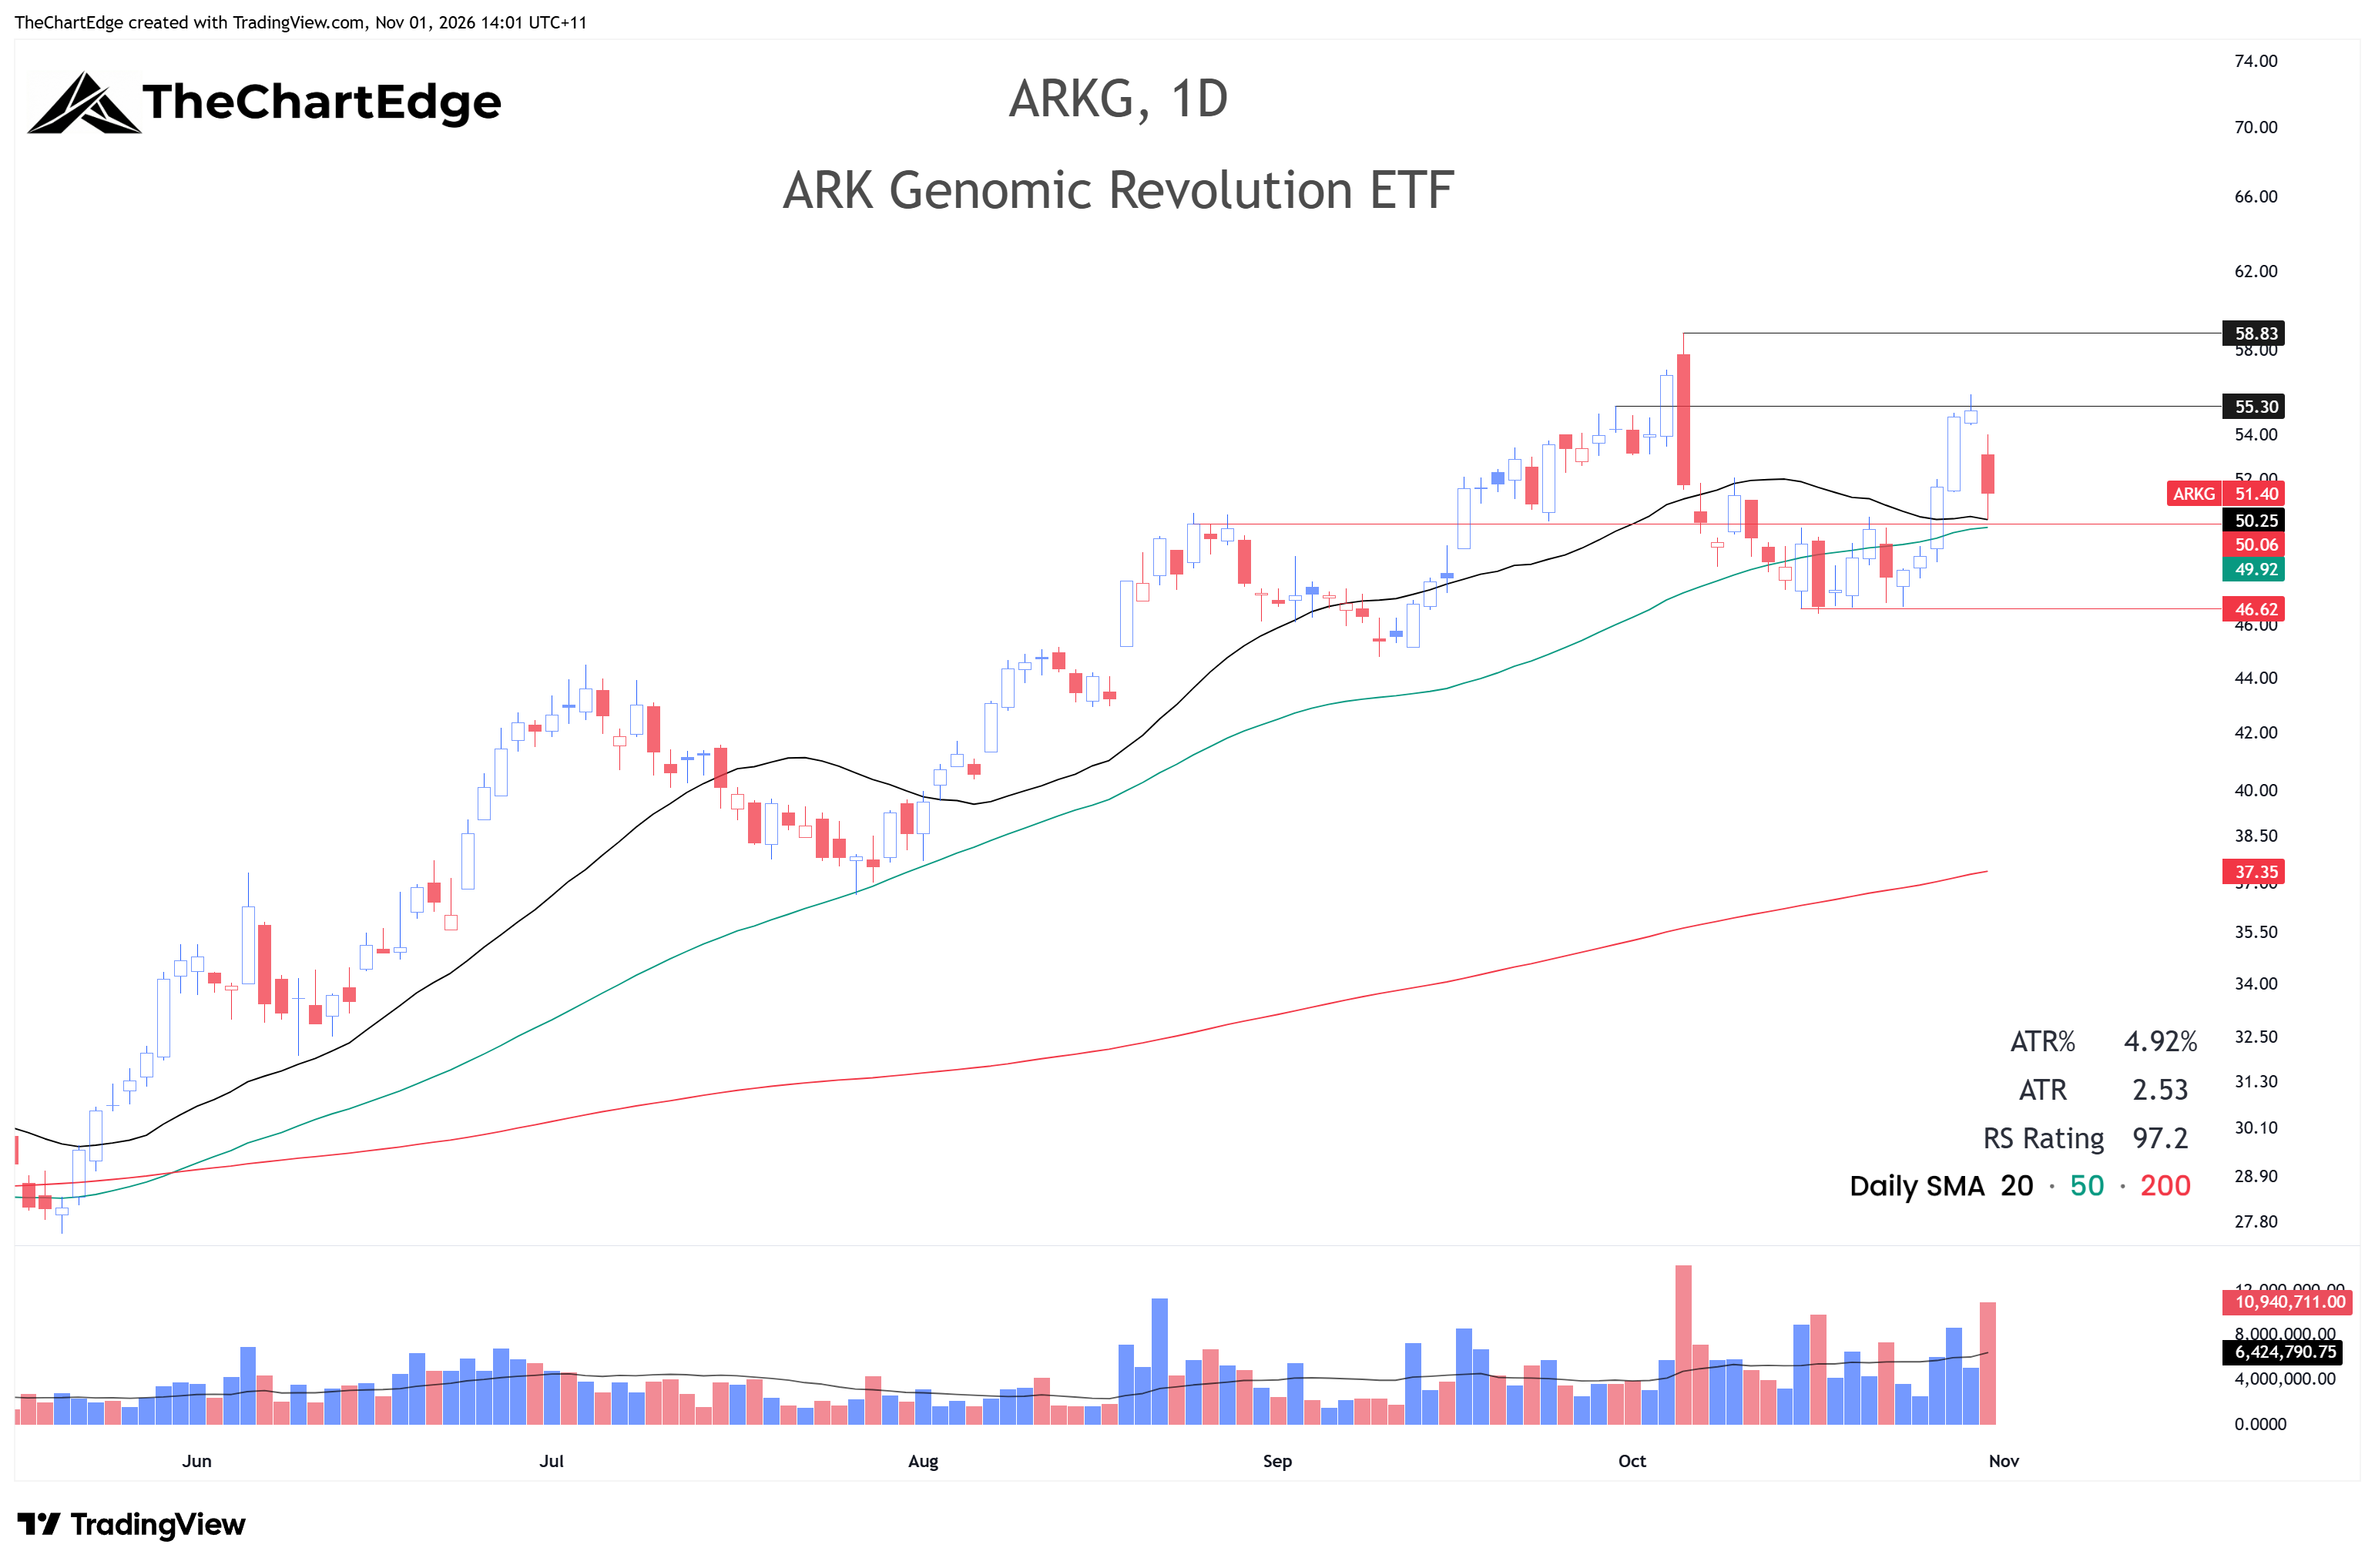
ARKG was the best performer in the universe last week, up 6.7%. After ripping higher on Tuesday and Wednesday, it gapped down on Friday and gave back around half of the week’s gains, closing at 51.40. It had a little bounce around its 20 and 50-day SMAs. If it shows some strength early in the week, I might take a long position with a stop under 48 or so.
Trades & Follow-Ups
Spot Ethereum Chart
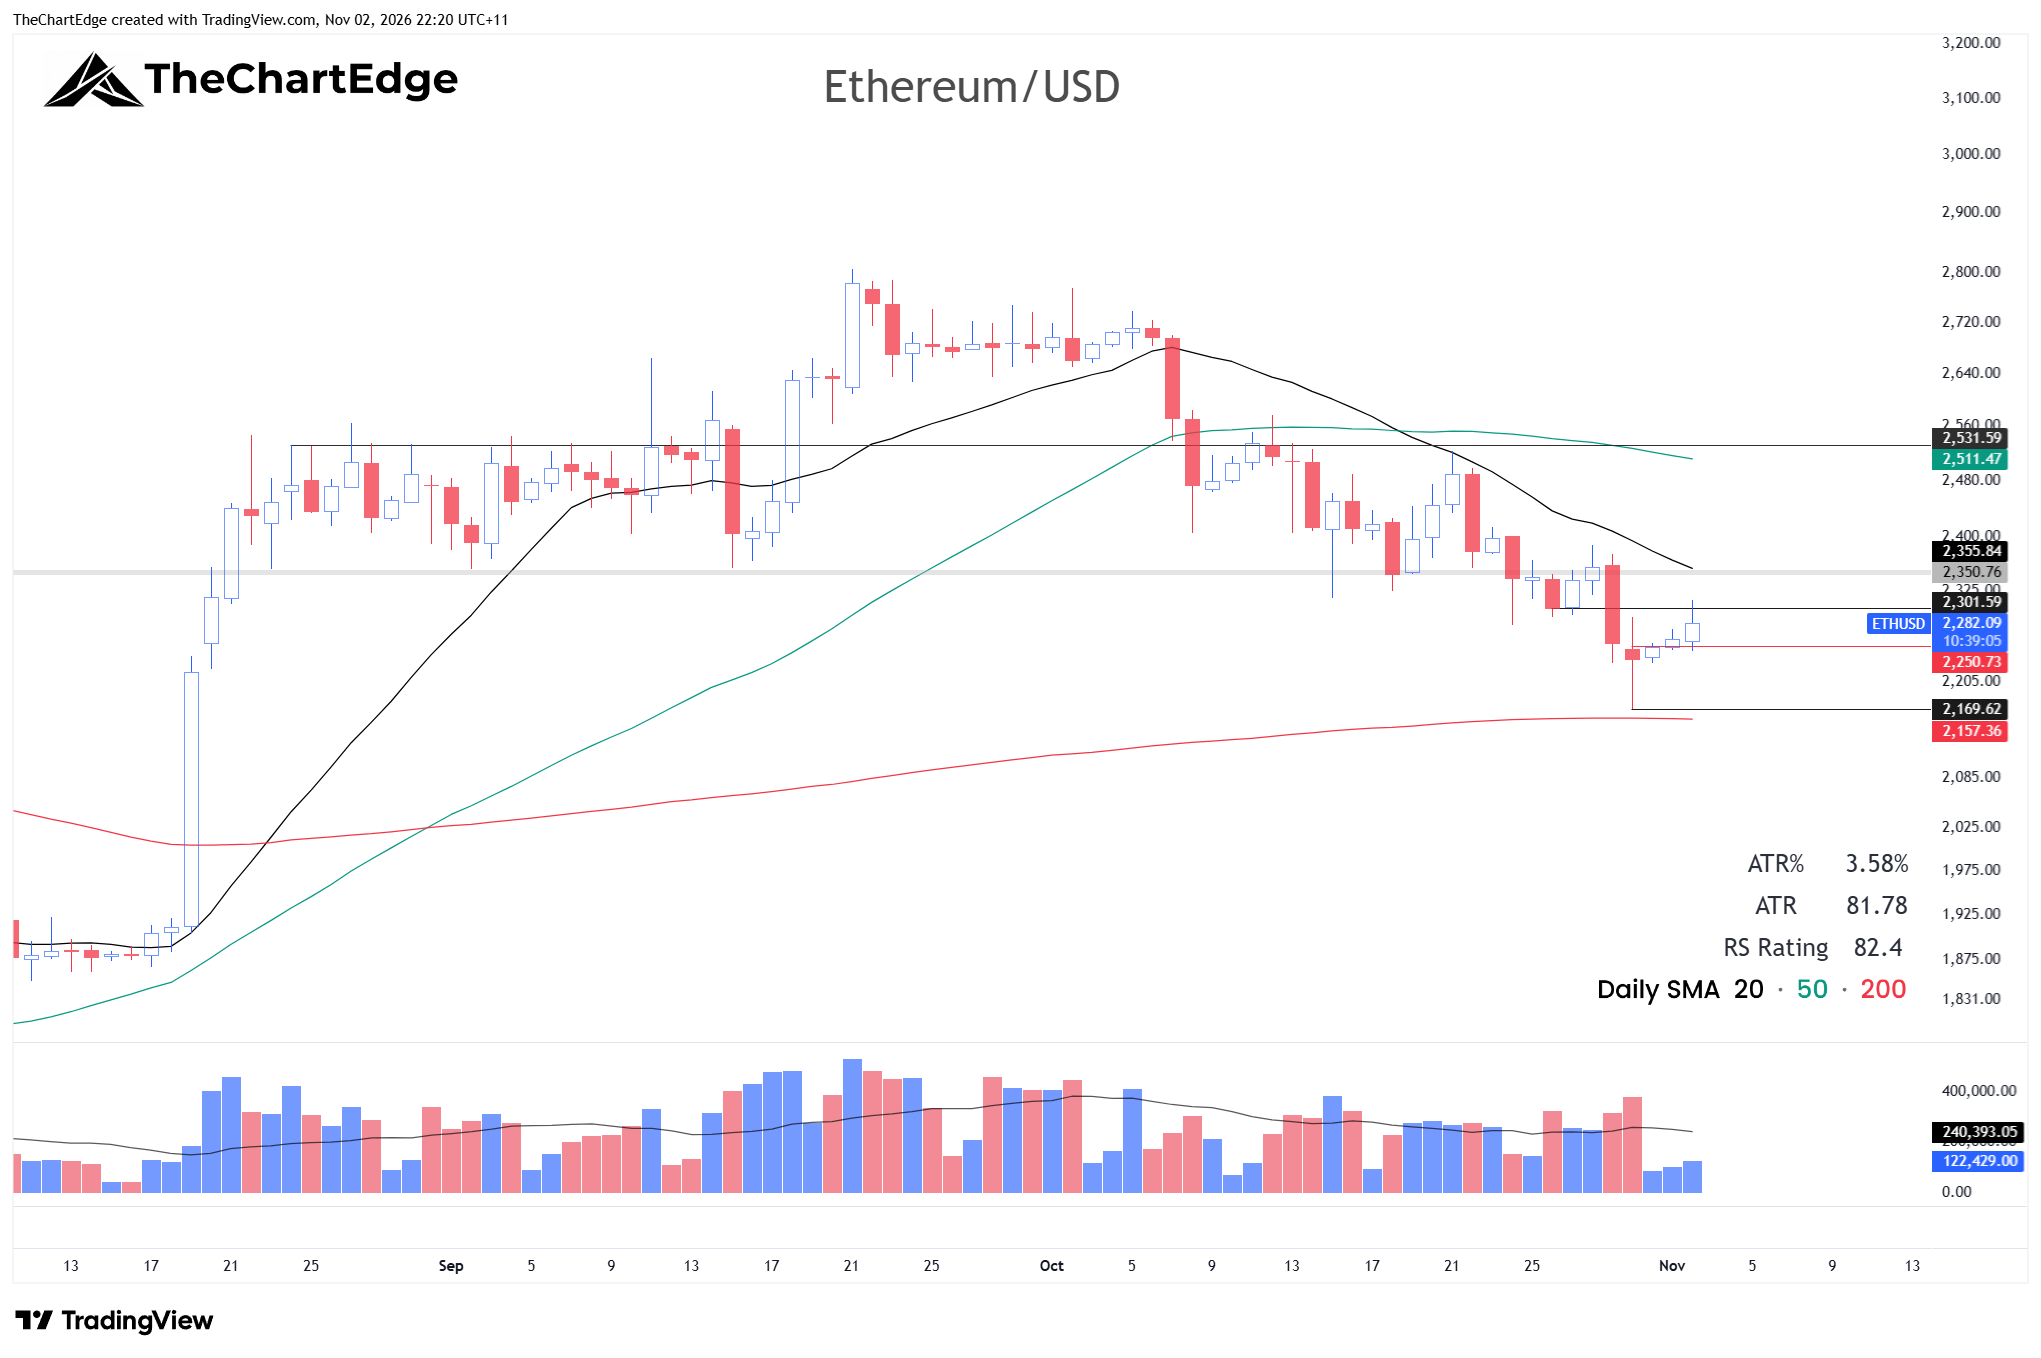
Crypto sold off late in the week after Binance reported a $6.3 billion hack. Bitcoin dropped below 77,000, and Ethereum briefly traded below 2,200. I bought Ethereum on Saturday after it bounced off its 200-day SMA. My entry was at 2250, and initial stop at 2140. I ended up taking profits earlier today, just over 2,300, as it looked like it was hitting resistance there. I was hoping for a bigger fast bounce when entering the trade.
The Week Ahead
The Market Temperature is back in the Cautious Zone, but most of the improvement came from easier comparisons in the model’s look-back period rather than improvements in the readings themselves. I’m not planning to take any large positions - either long or short. I’ve been day trading oil a bit and will likely continue to do so. I’ll be watching IBB, ARKG, GTLB, ADI and TXN as outlined above but will take quite small positions if I do enter. If we get a flush and swift recovery in semis and tech, I’ll likely play via the Nasdaq 100 CFD.
Risk and uncertainty remain high, with the US midterms on Tuesday (Wednesday morning here), the Israeli election still unresolved, and the possibility of heightened tensions and kinetic action in the Middle East.
Stay open-minded and manage risk carefully.
Cheers,
Marcus Grant, CFTe
Disclaimer: The content provided in this newsletter is for informational and educational purposes only and should not be considered as financial, investment, or legal advice. It is general information only and does not take into account your objectives, financial situation or needs. The information shared is based on our research and analysis, but we are not a licensed financial advisor, nor can we guarantee its accuracy, completeness, or timeliness. Market conditions and financial instruments can change rapidly, and any opinions expressed may not be suitable for all investors. Any opinions expressed and/or securities mentioned do not constitute a recommendation to buy, sell, or hold that or any other security. You should conduct your own due diligence and consult with a licensed financial advisor or other professional before making any investment decisions. Past performance is not indicative of future results, and all investments carry the risk of loss. The authors and publishers of this newsletter are not responsible for any financial decisions made based on the content provided herein. By reading and/or subscribing to this newsletter, you acknowledge and agree that you are using the information at your own risk.