

Market Temperature Rebounds to 5.6 - One Week in Cautious and Back to Goldilocks
Mega-caps bounced while the semi and AI names were sold, and the all-time-high list is dominated by healthcare, financials, and value

US markets were closed on Friday for the Independence Day long weekend, so last week’s data runs to the close on Thursday July 2. The S&P 500 (SPY) rose 2.2%, the Nasdaq 100 (QQQ) 0.9%, and FANG+ (FNGS) bounced 3.6% after leading the selloff the week prior. The equal-weight S&P 500 (RSP) rose 2.2% and the Dow (DIA) 2.0%. The mid and small caps lagged last week - the S&P MidCap 400 (MDY) slipped 0.2% and the Russell 2000 (IWM) fell 0.8%, though microcaps (IWC) added 1.4%.
However, the weekly numbers hide how the picture changed mid-week.
SPY Chart
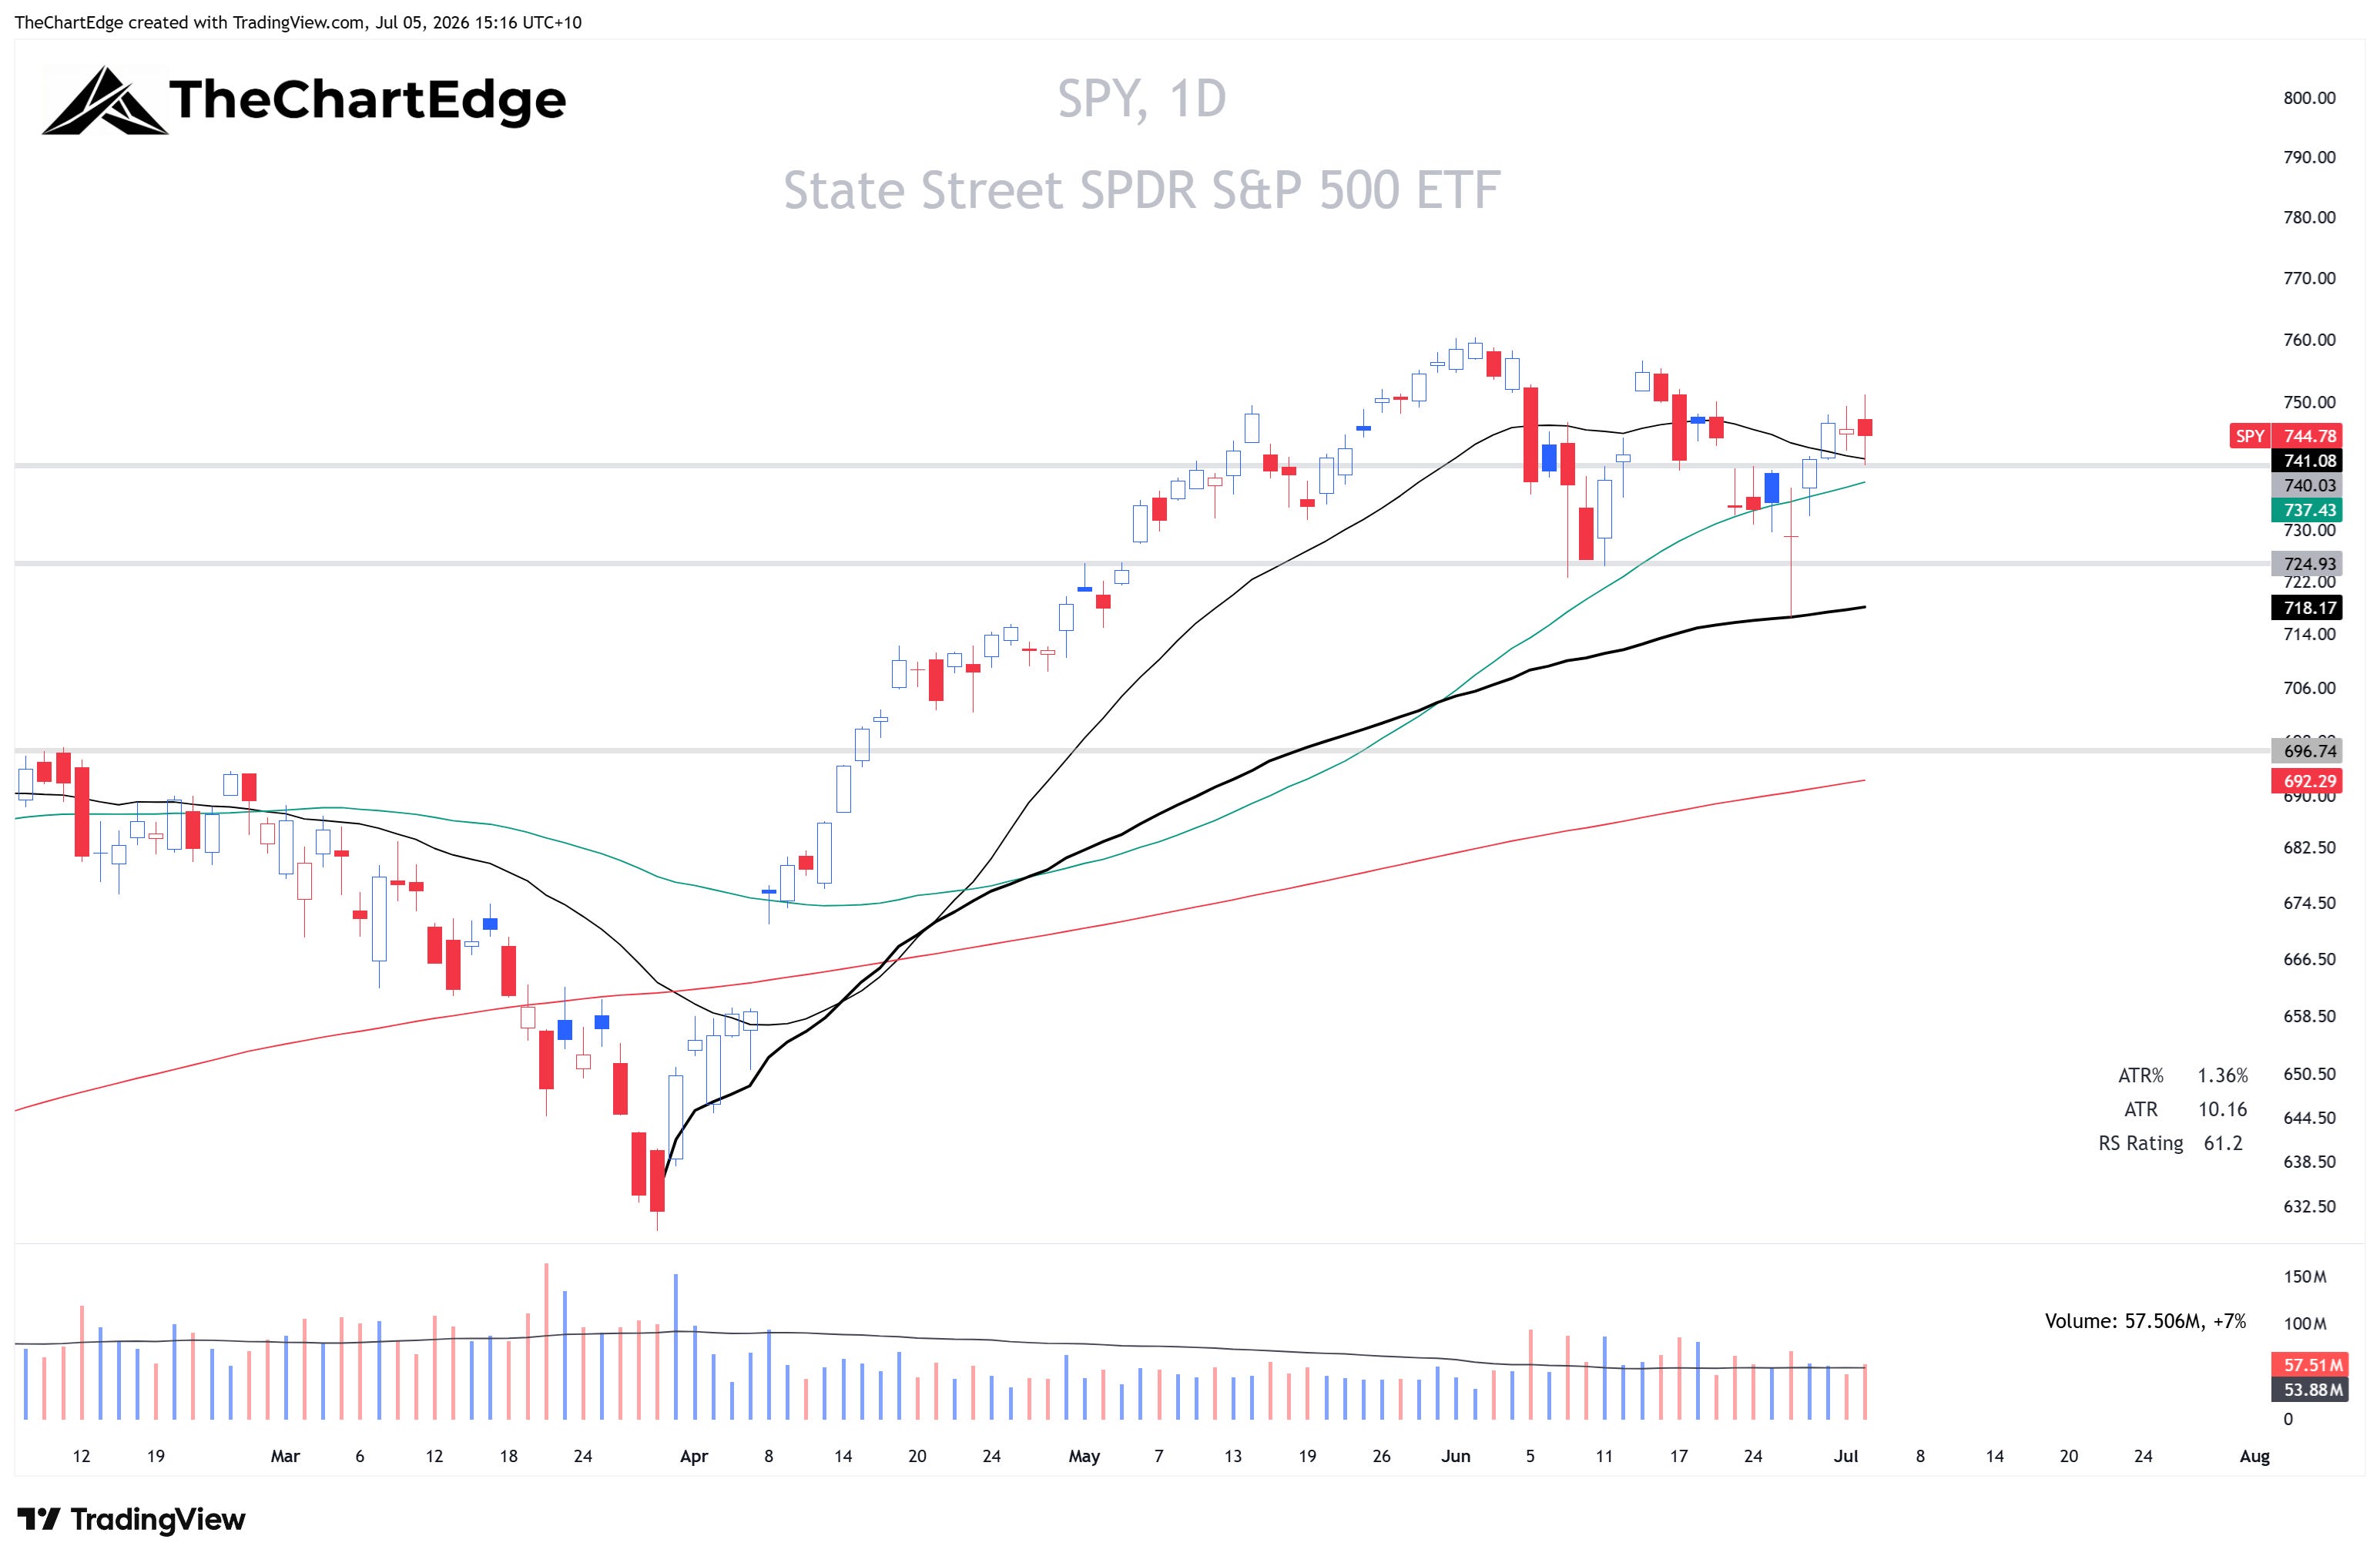
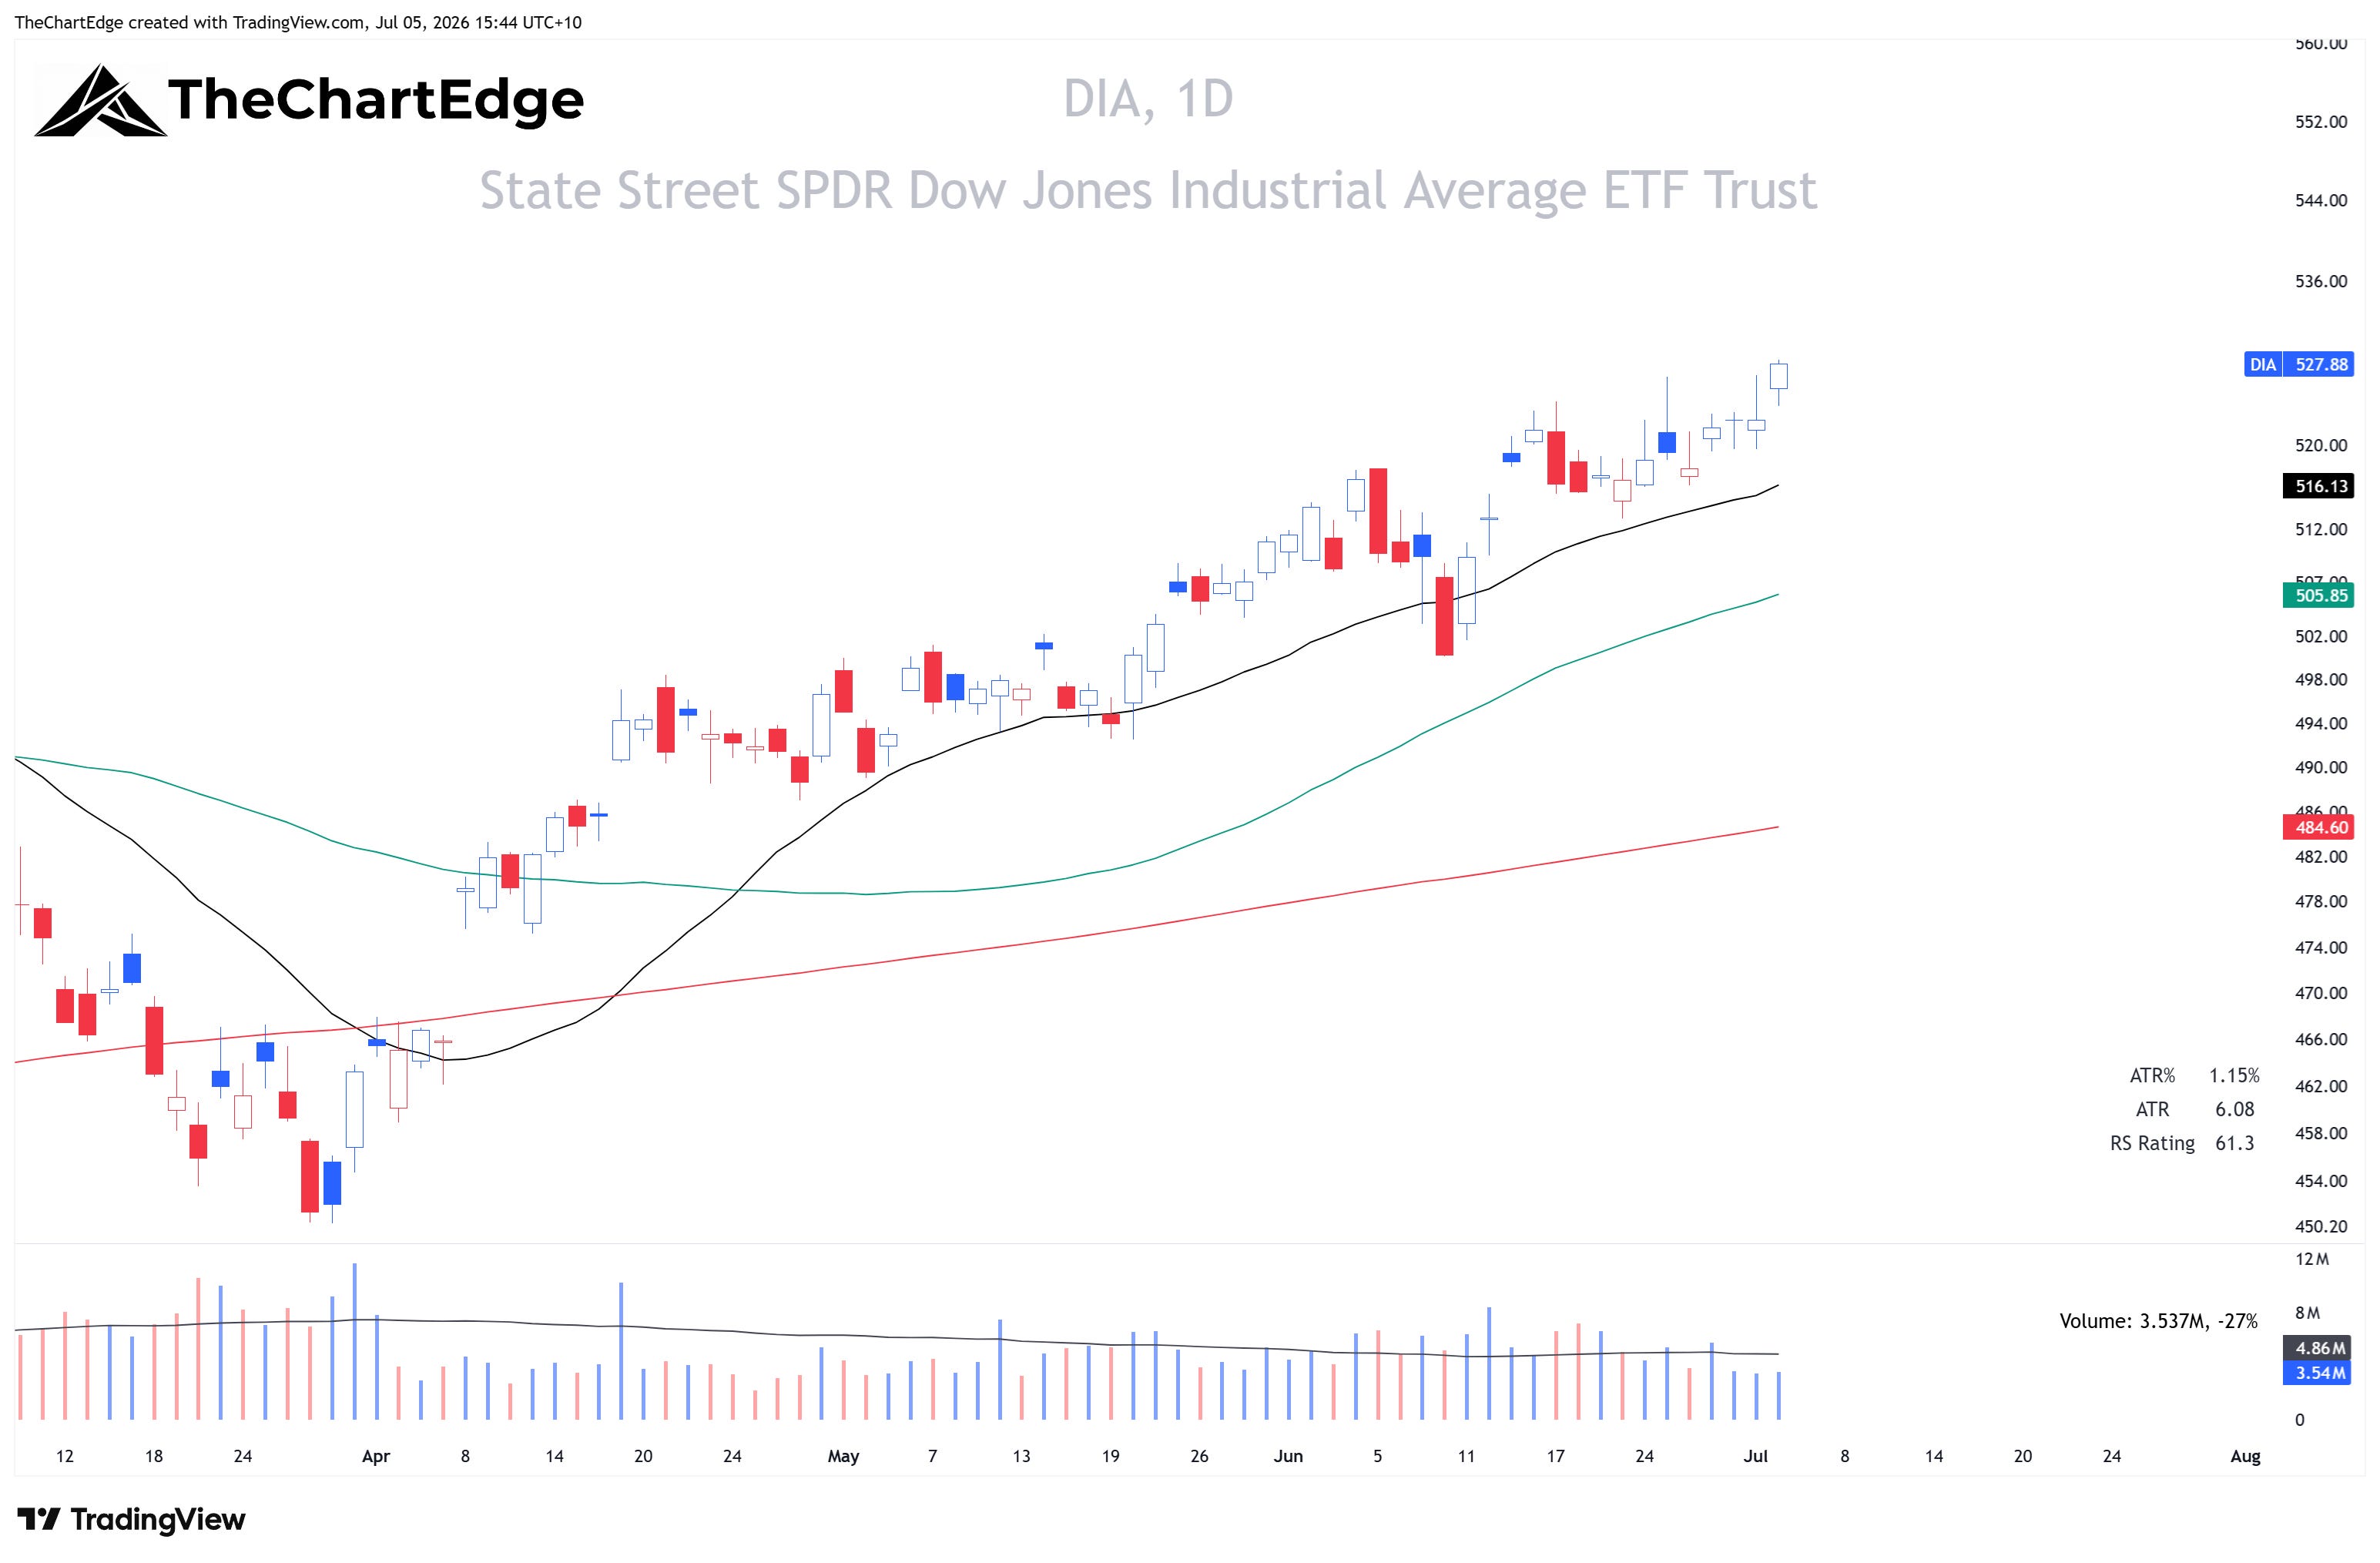
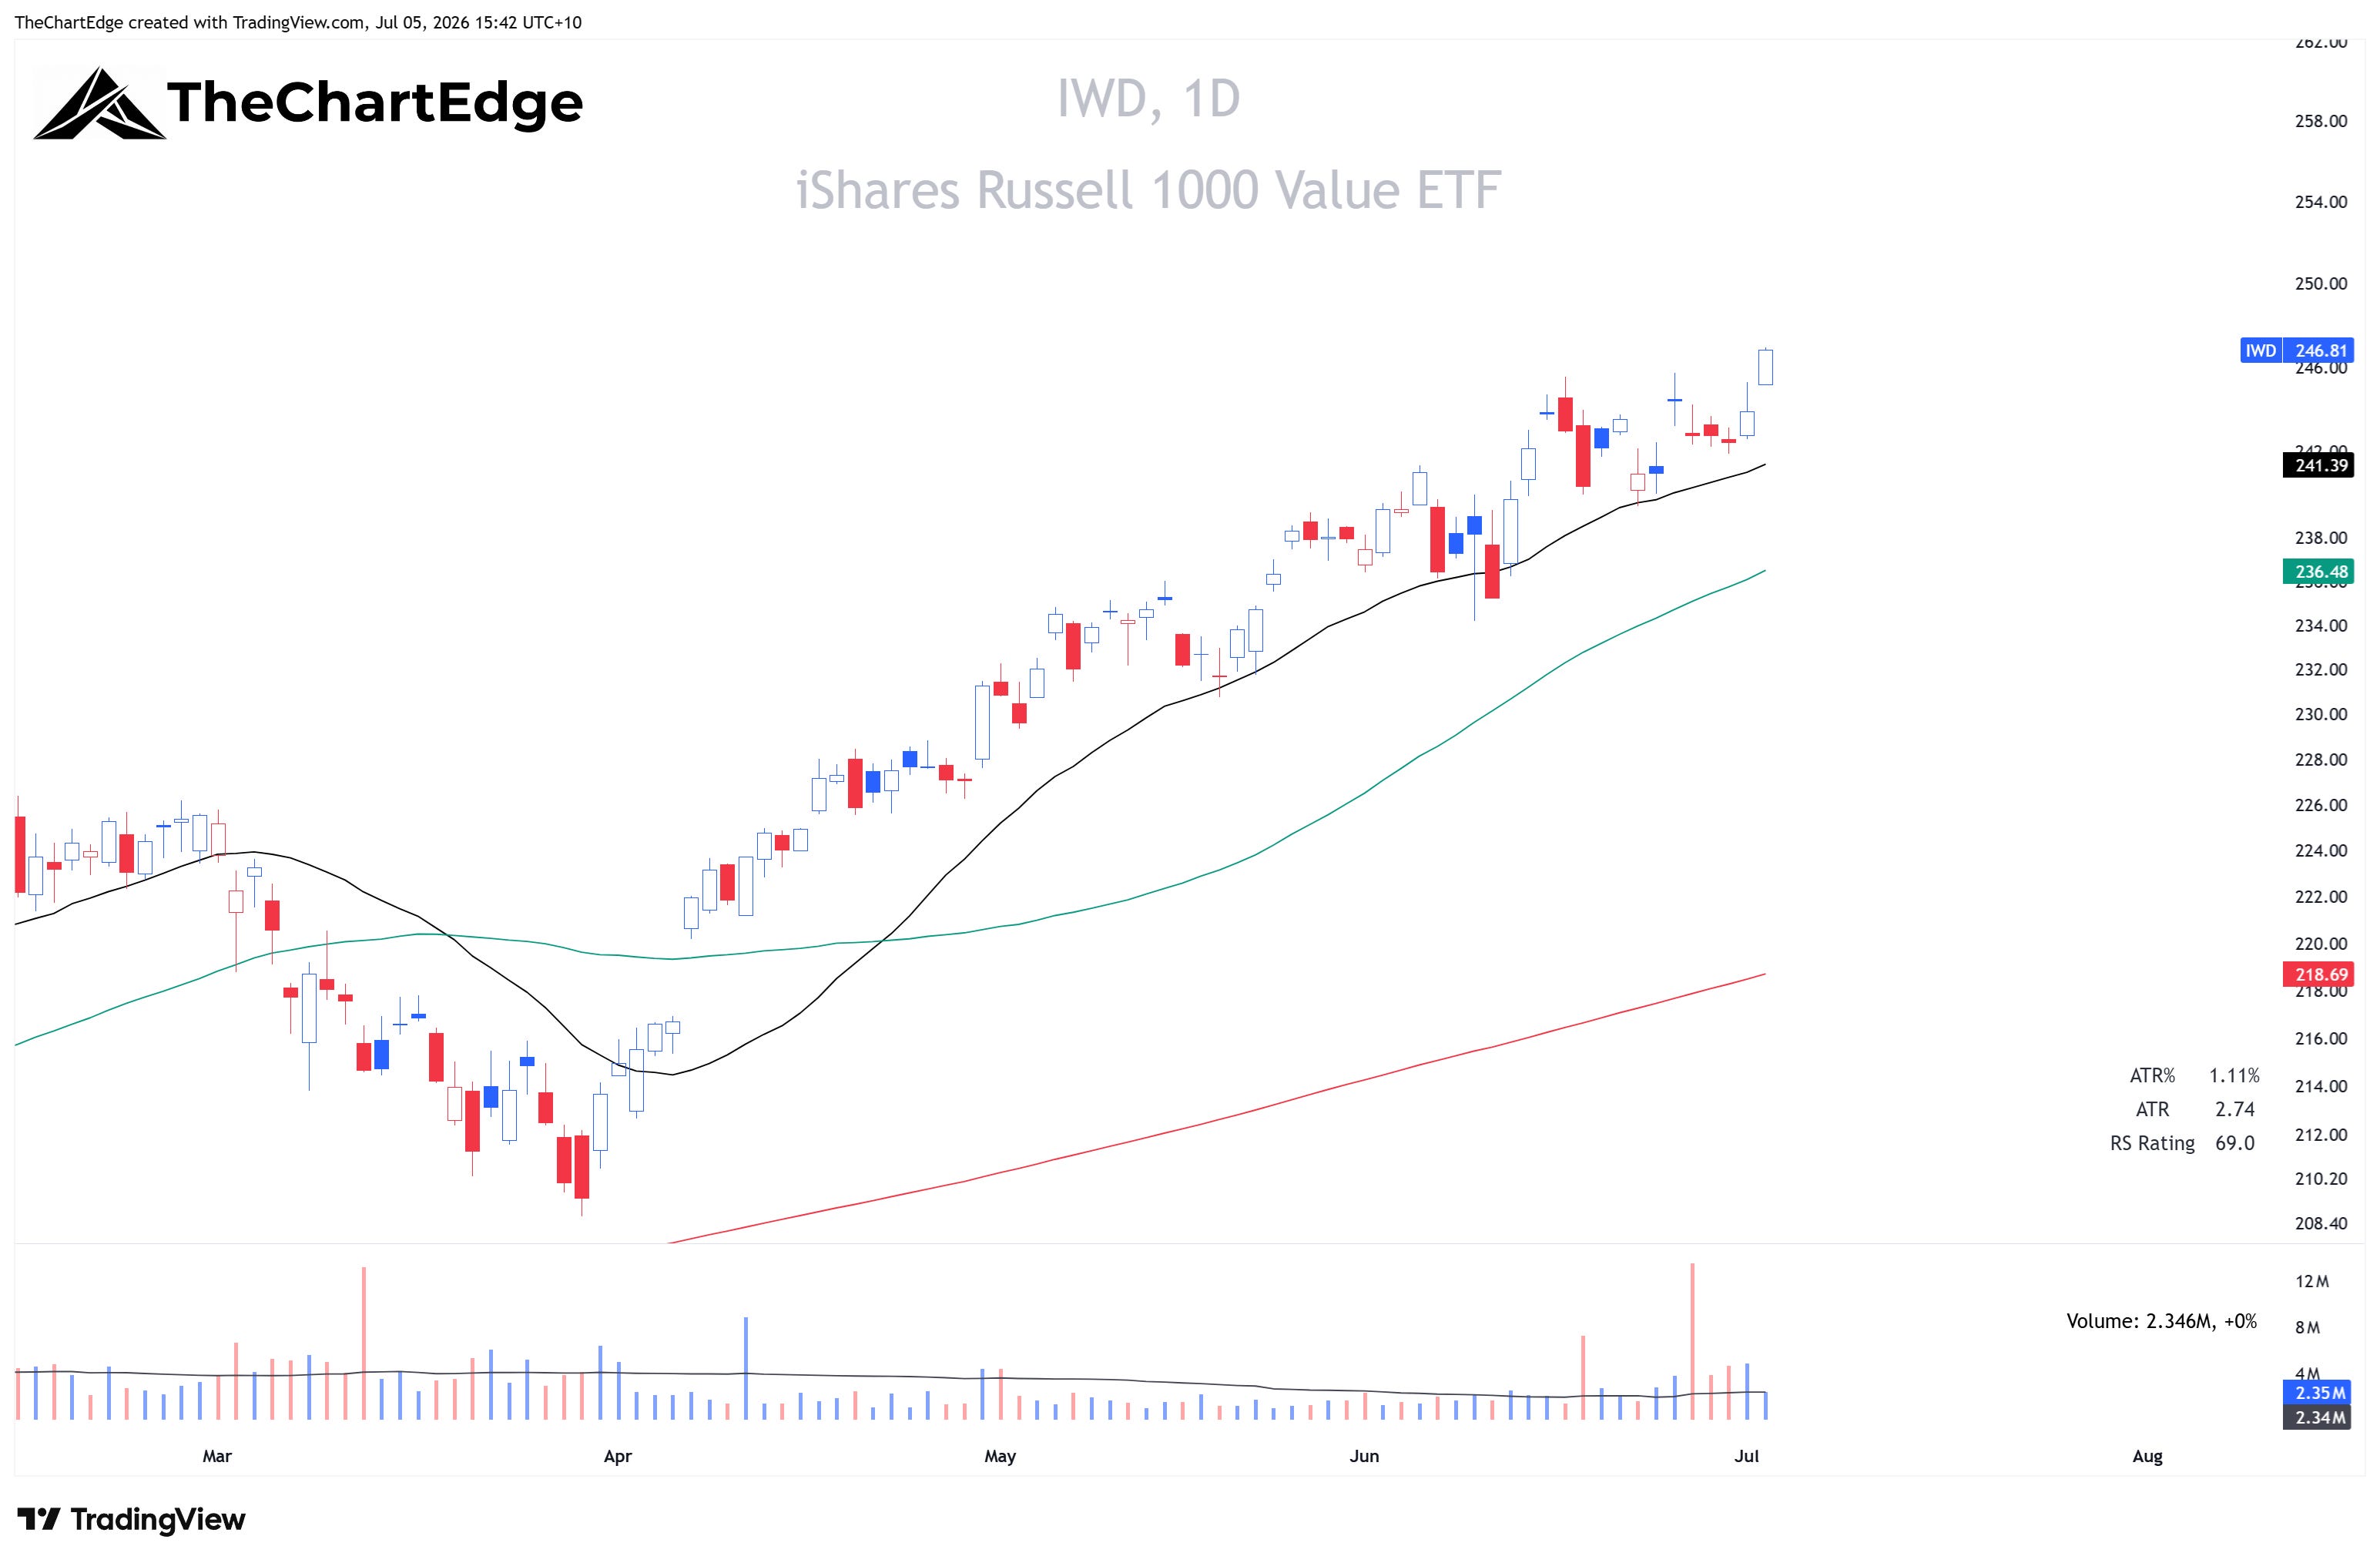
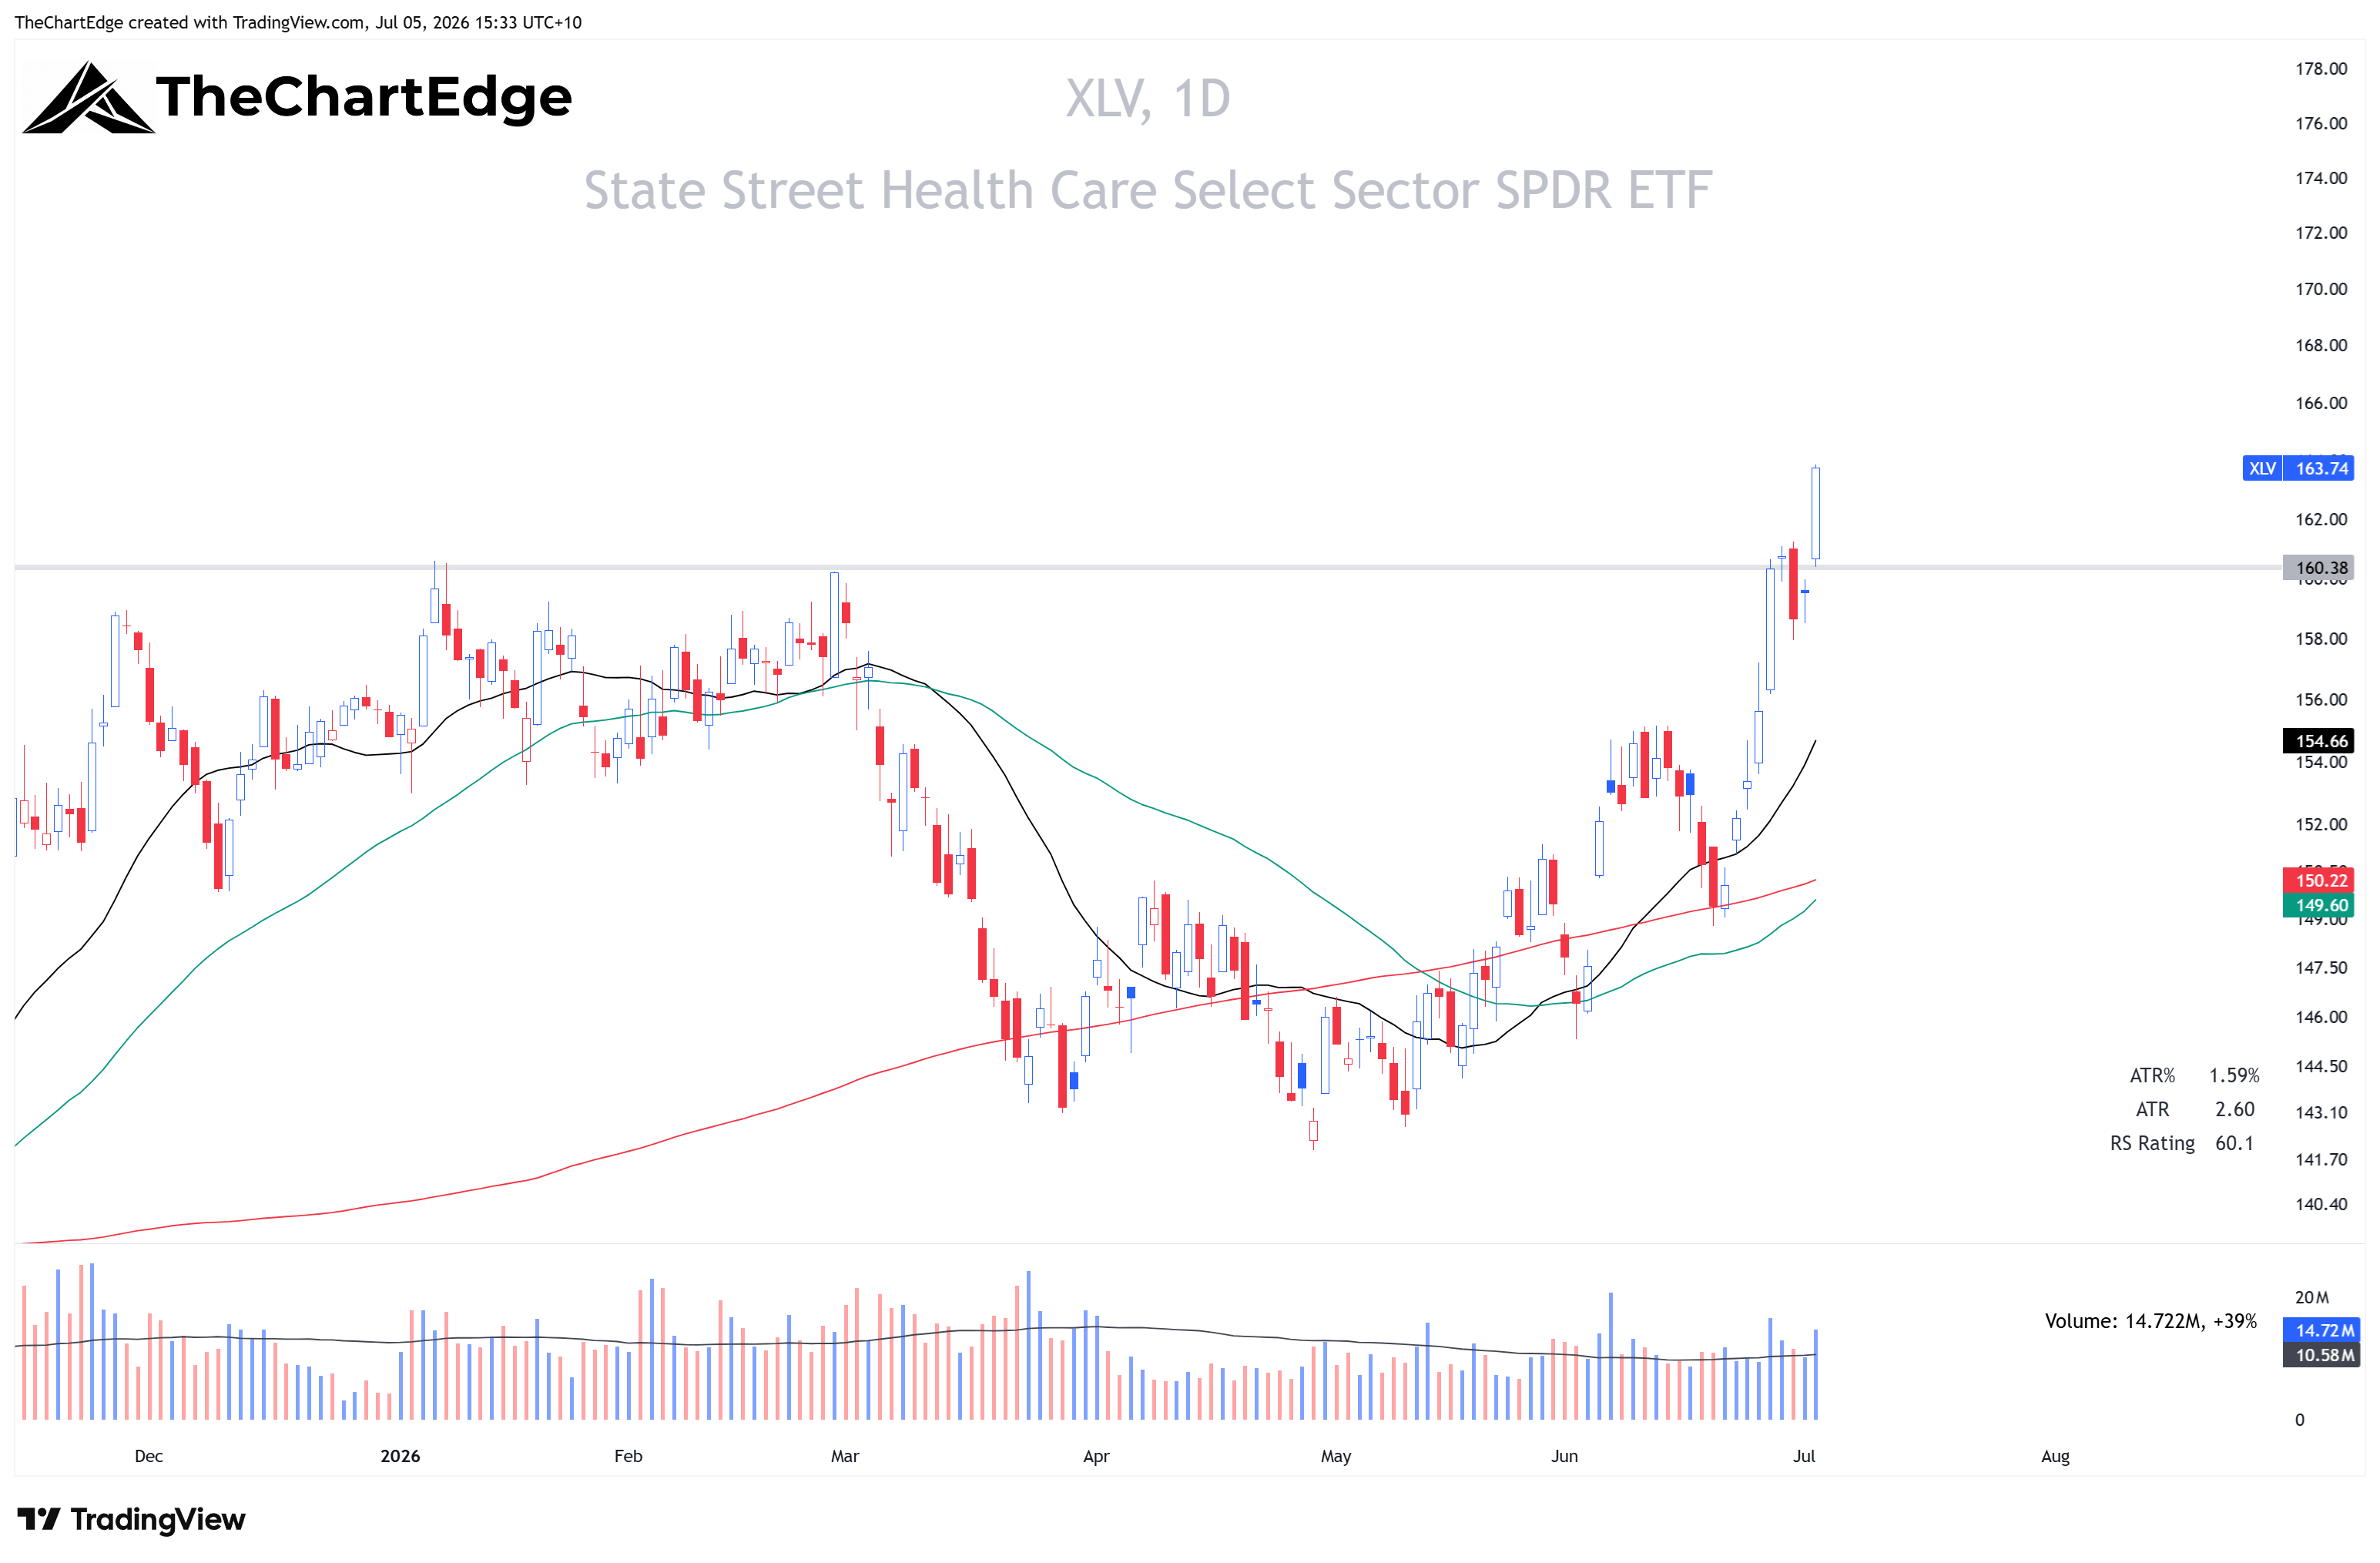
For all daily charts the black line is the 20-day SMA, the green is the 50-day, and the red is the 200-day. The thick black line is the AVWAP from the March 30 low.
Monday and Tuesday were strong. The SPY reclaimed its 20-day SMA on Tuesday and held above it into Thursday’s close - but the back half of the week the relative strength was concentrated in financials, healthcare, and some of the FANG+ mega-cap names.
QQQ Chart
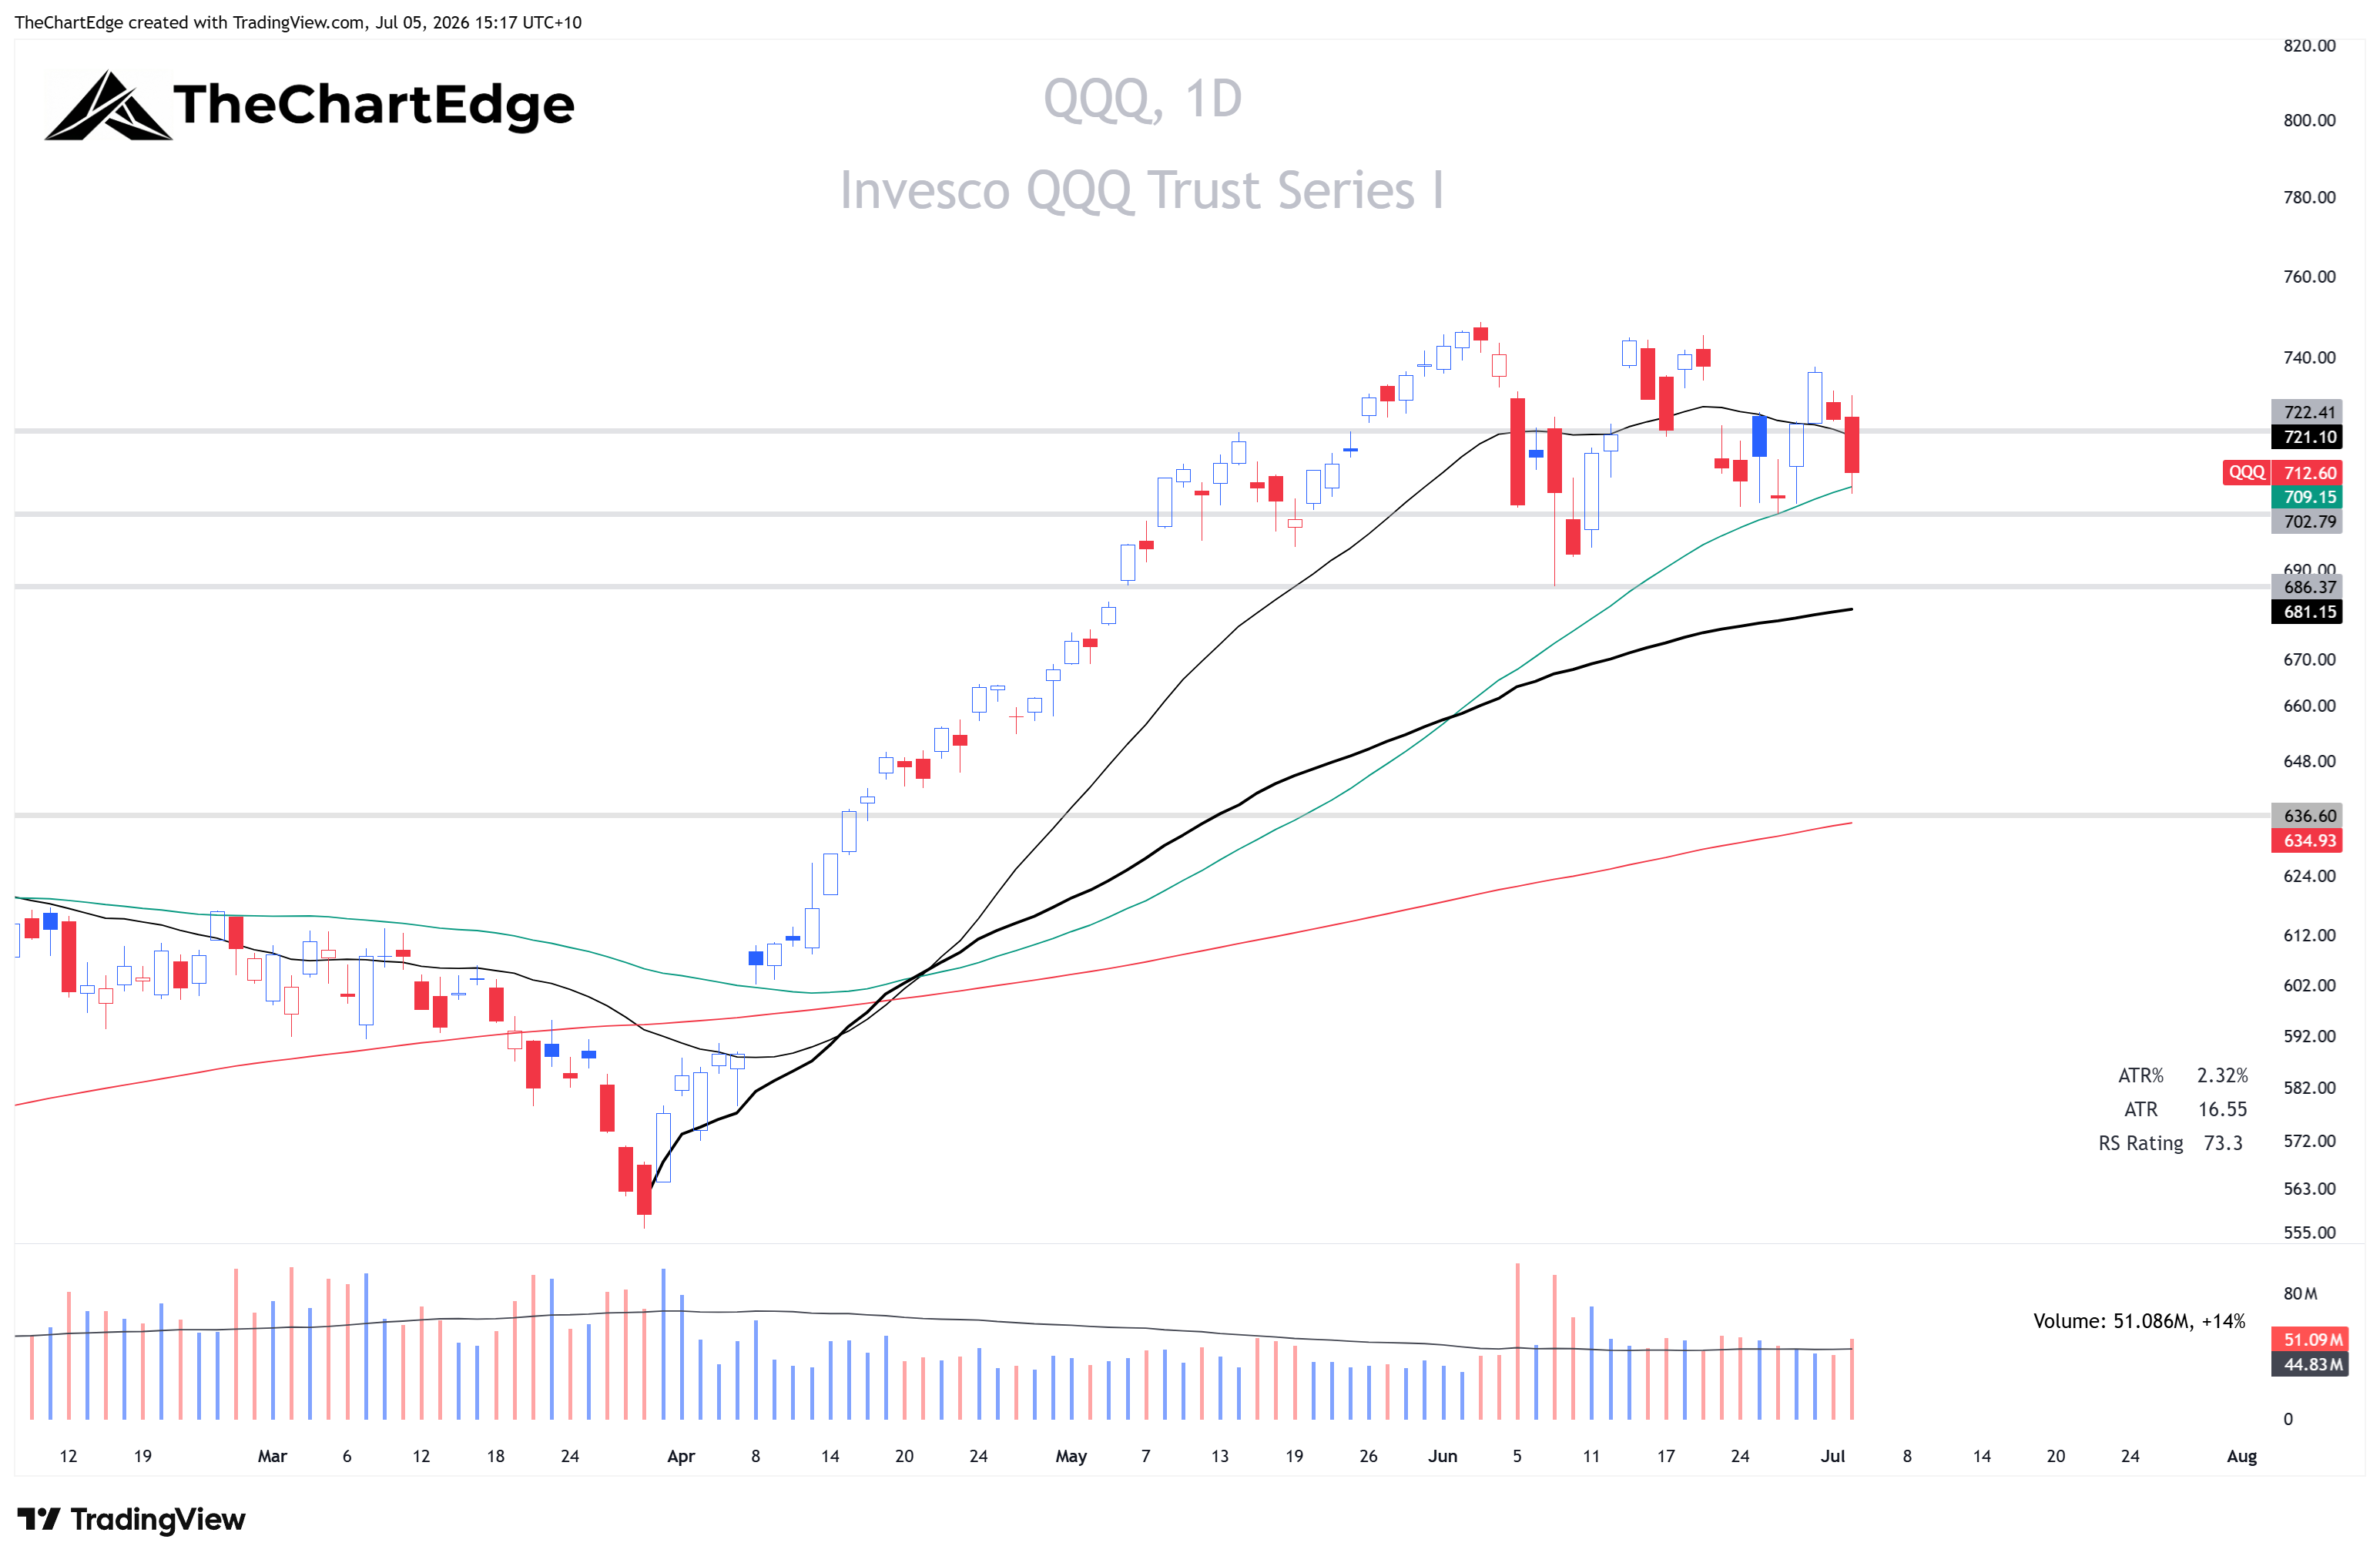
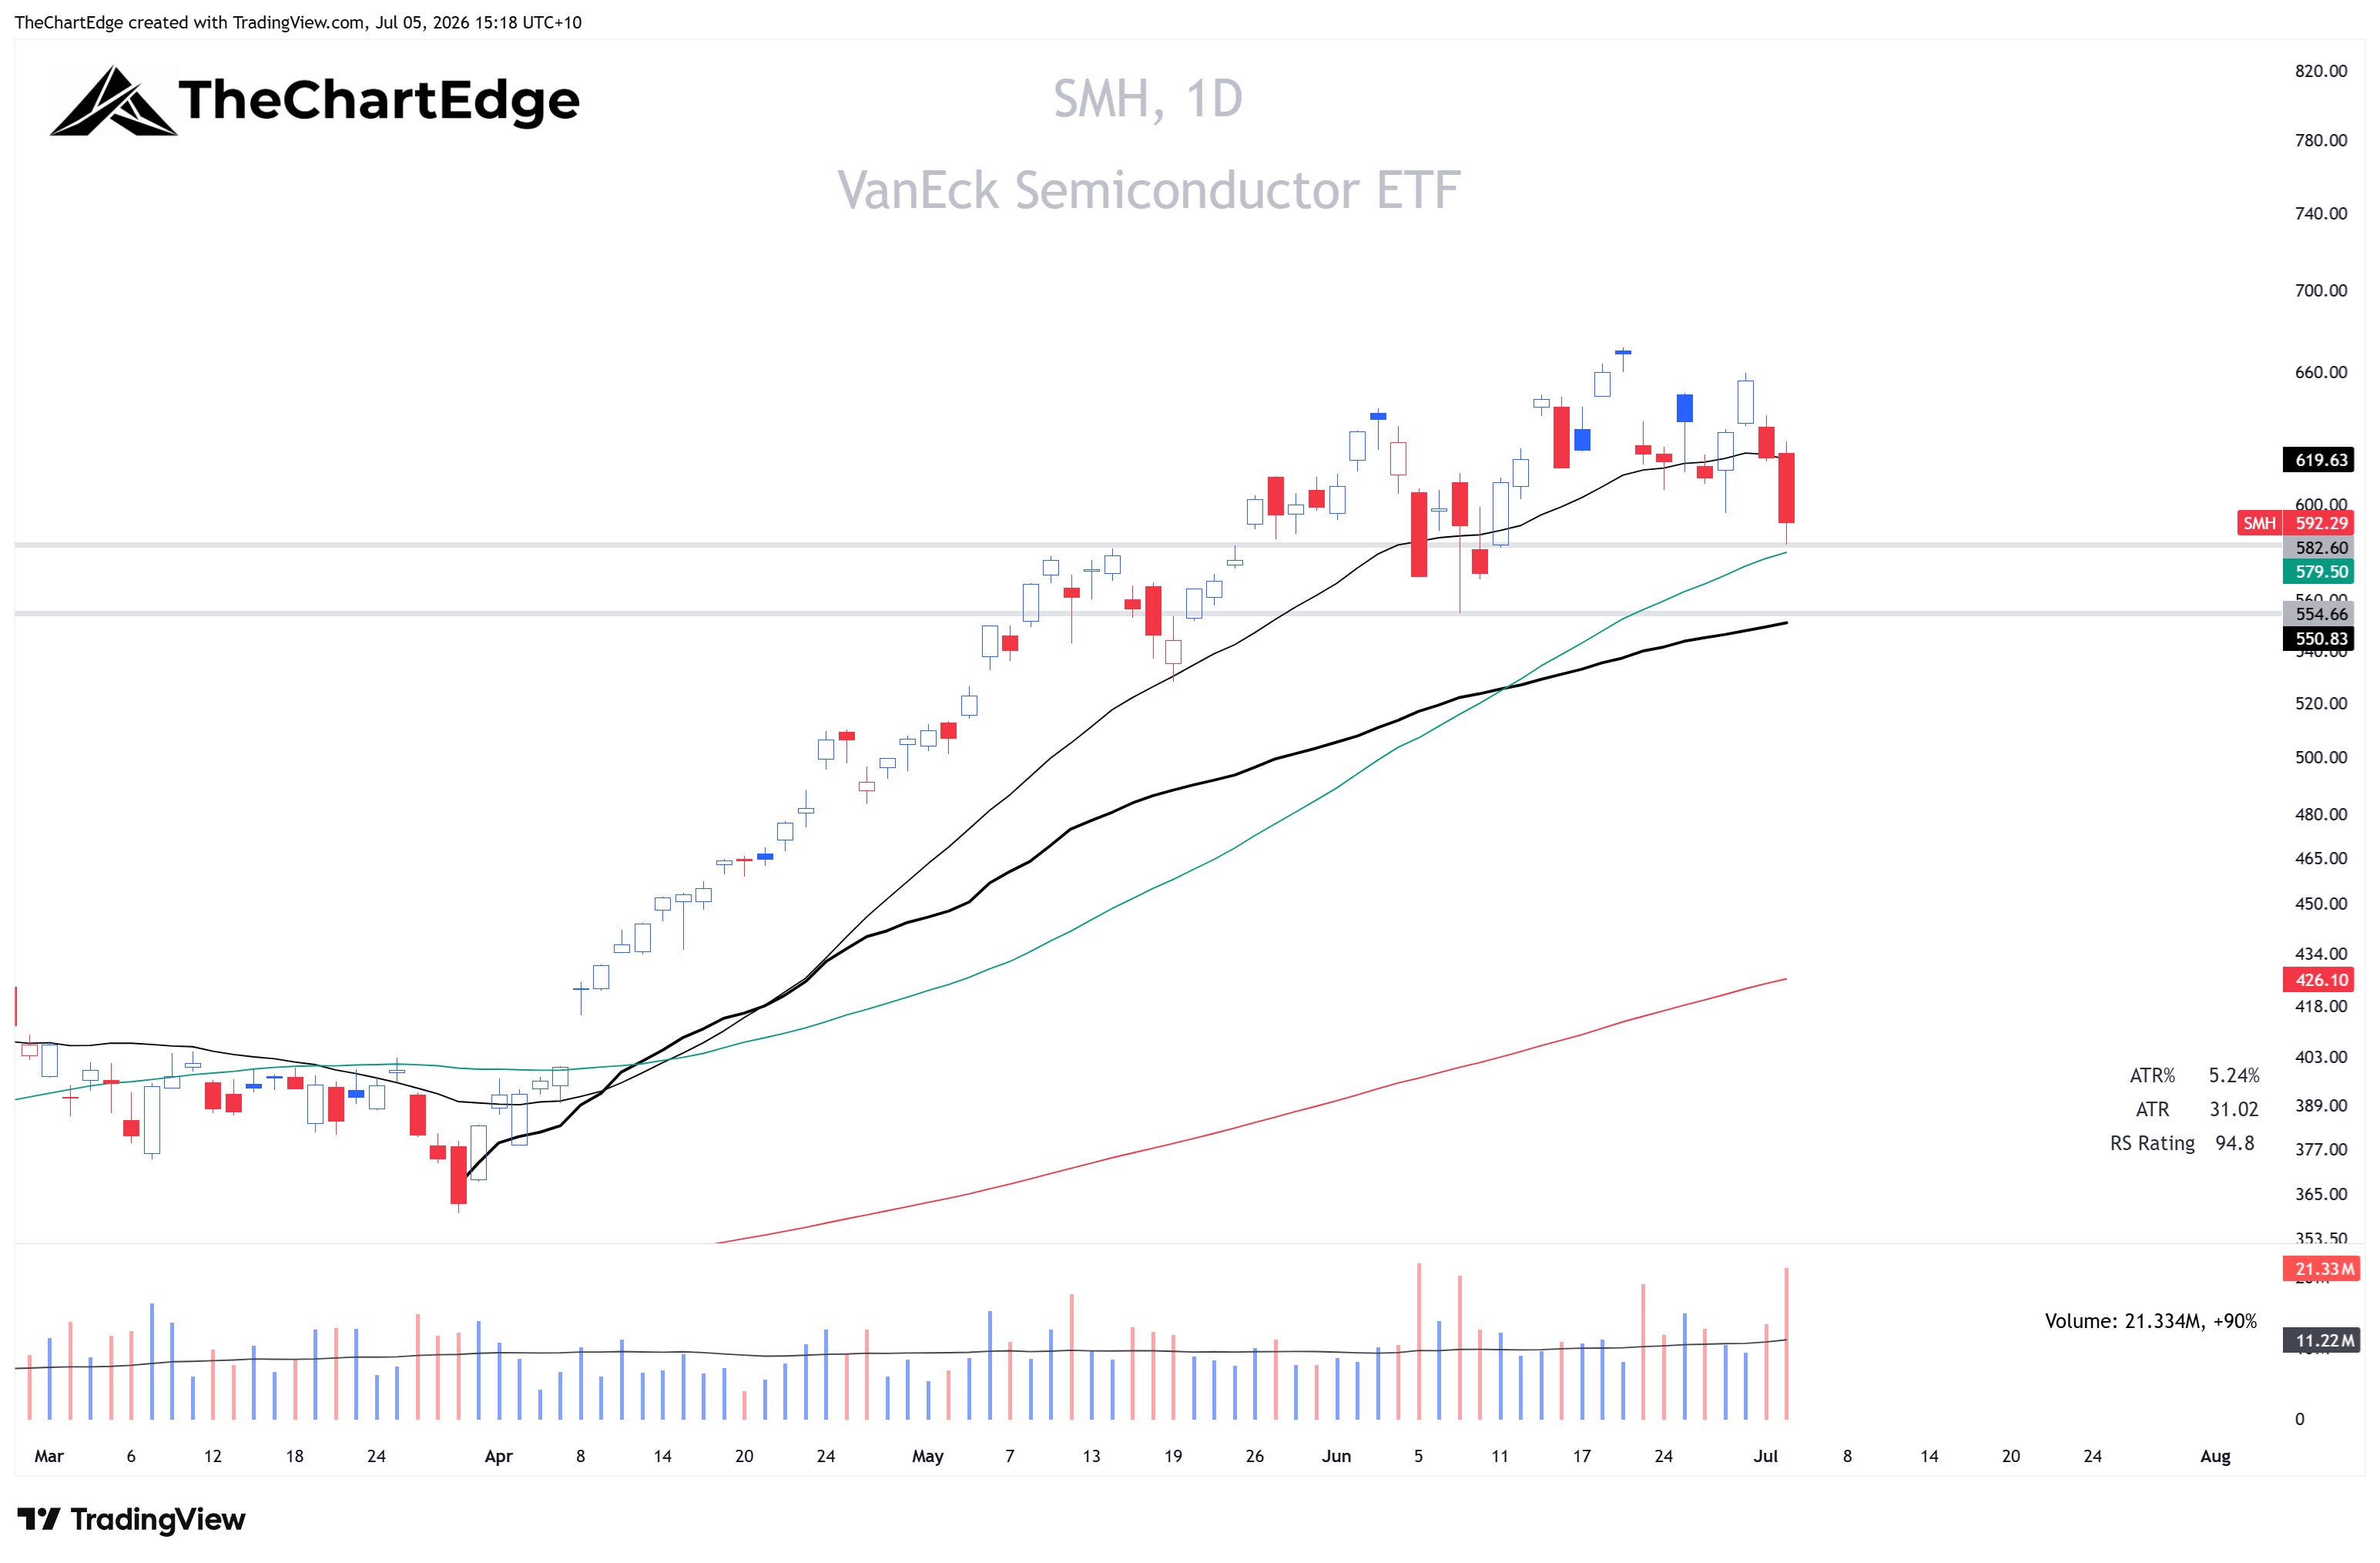
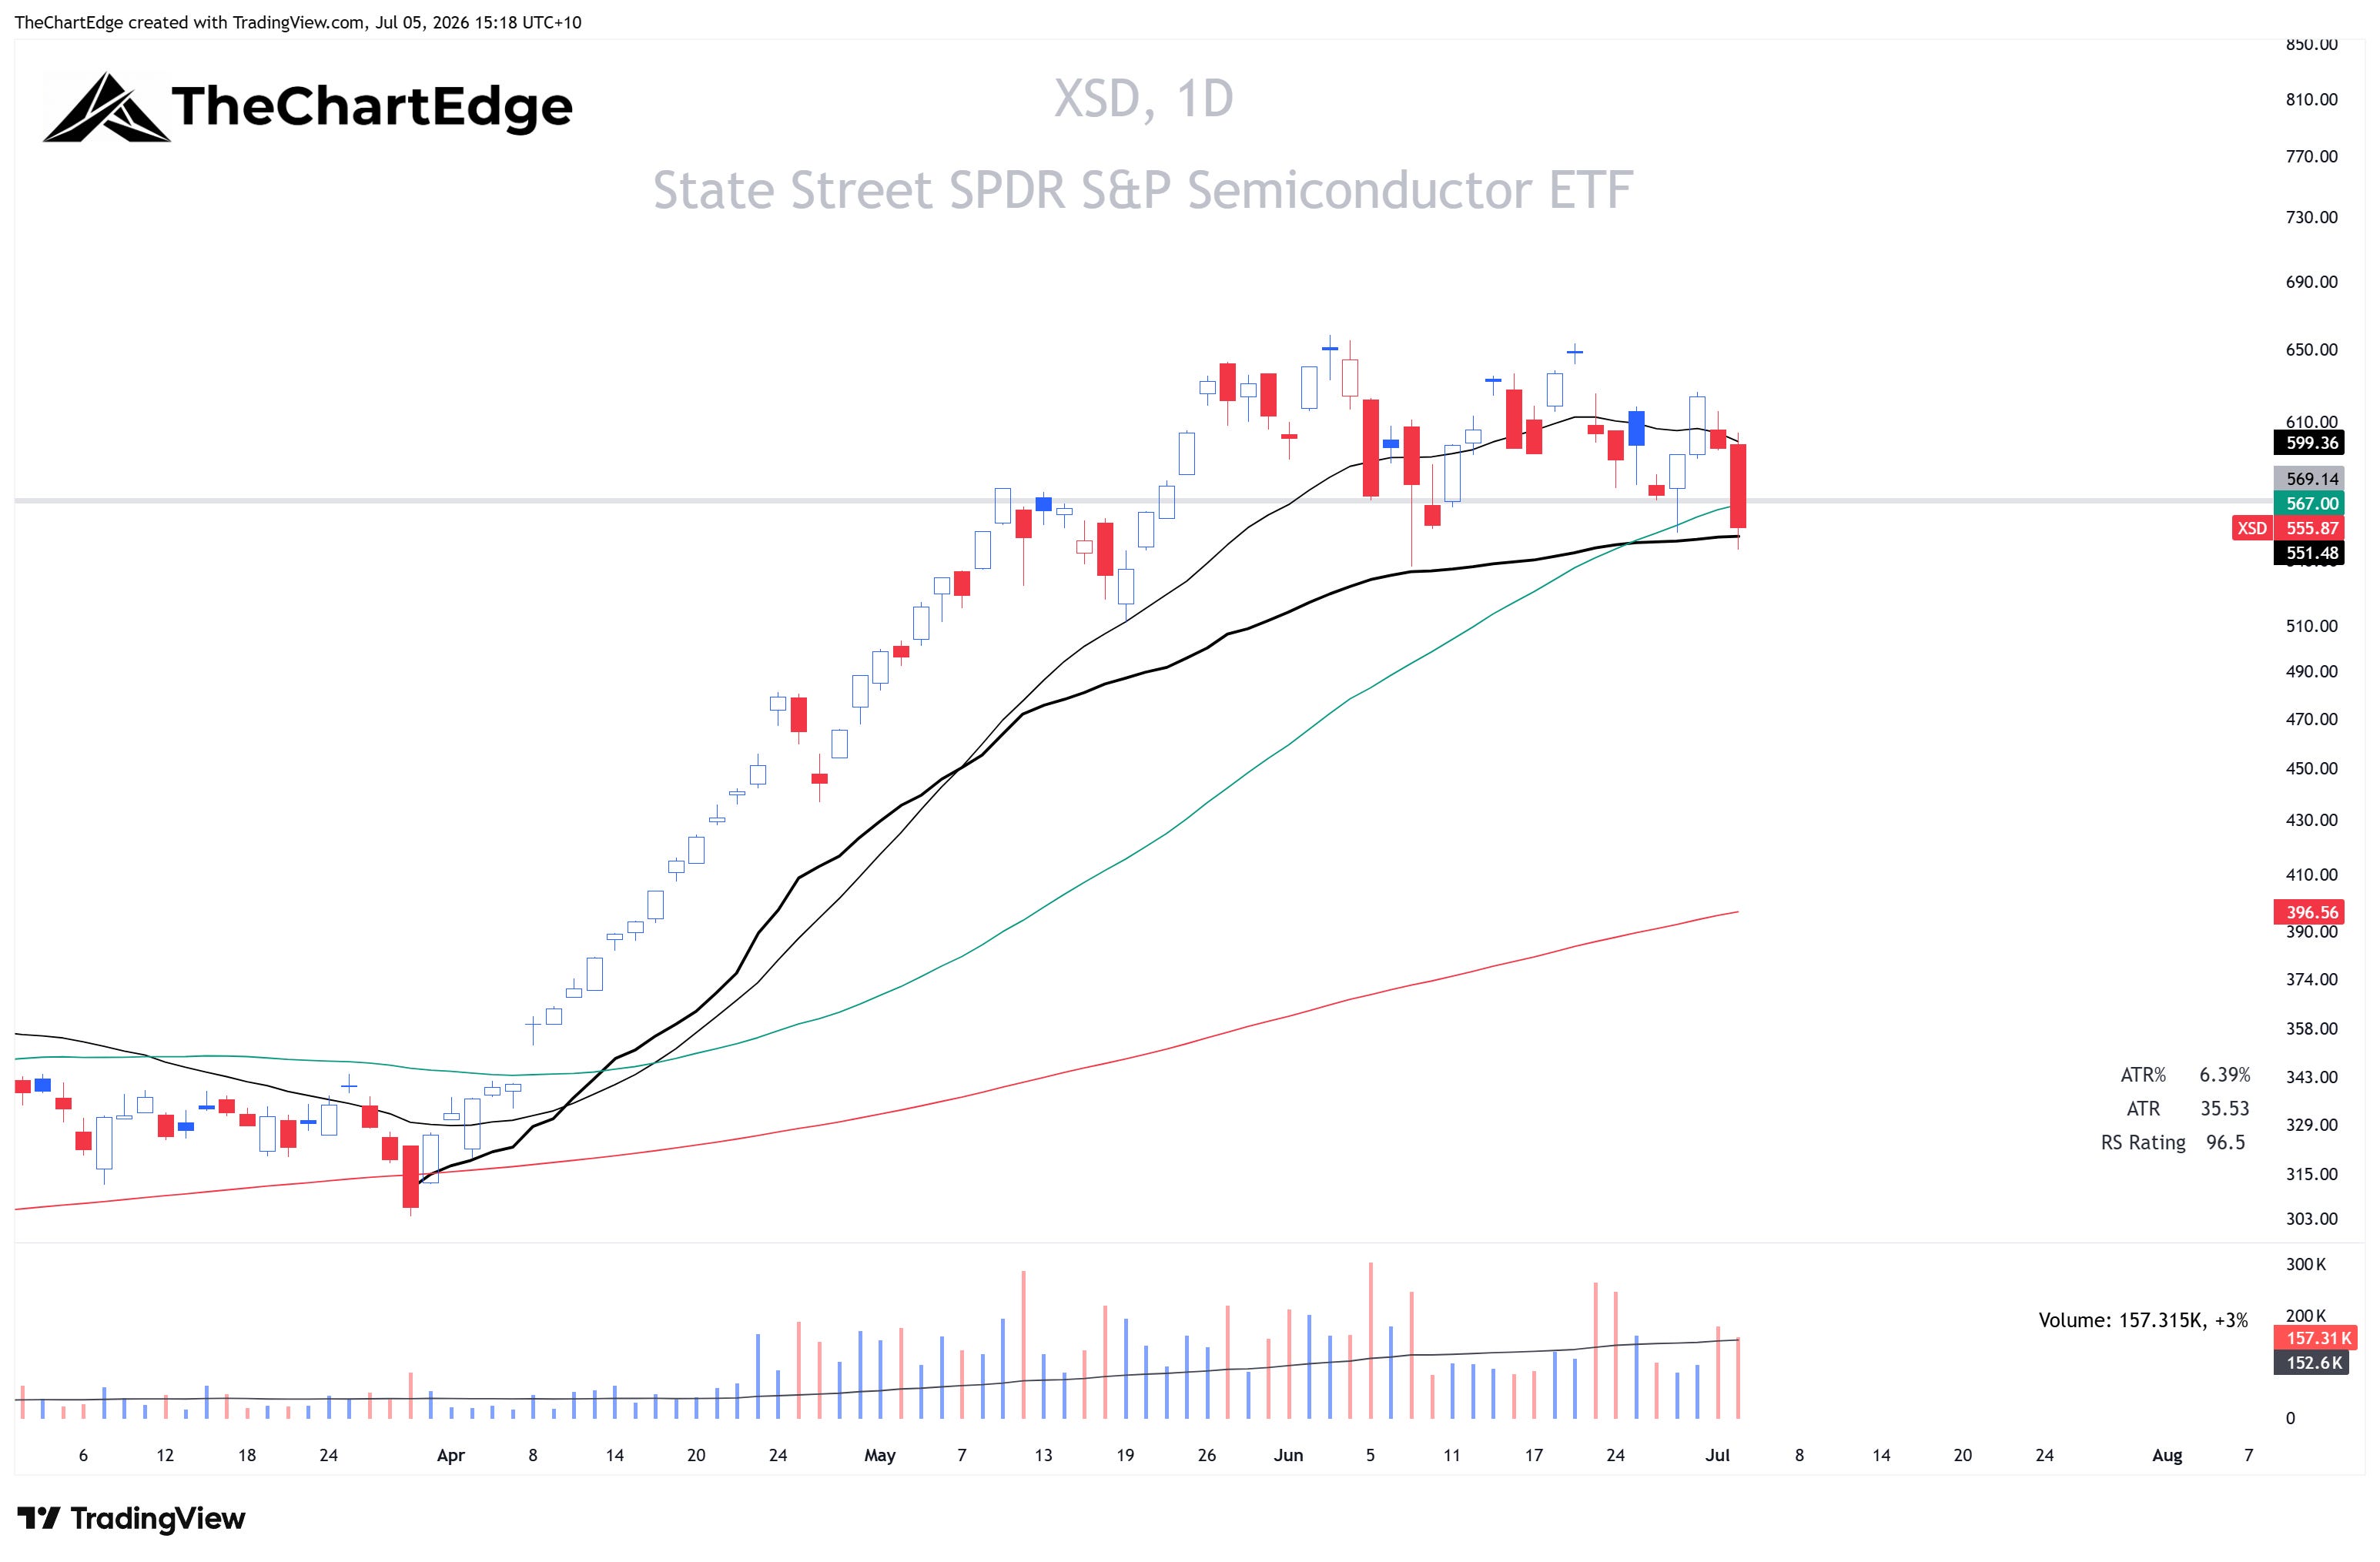
The QQQ looked the better of the two mid-week, with a strong Tuesday close above its 20-day SMA. However, the selling kicked in on Wednesday with a gap down and close near the lows, and continued on Thursday, falling 1.7%, with the losses concentrated in the semiconductor and AI names. SMH fell 4.5% on Thursday alone and equal-weight semis (XSD) 6.7%. The QQQ finished the week back below its 20-day SMA, sitting just above its 50-day.
Market Temperature
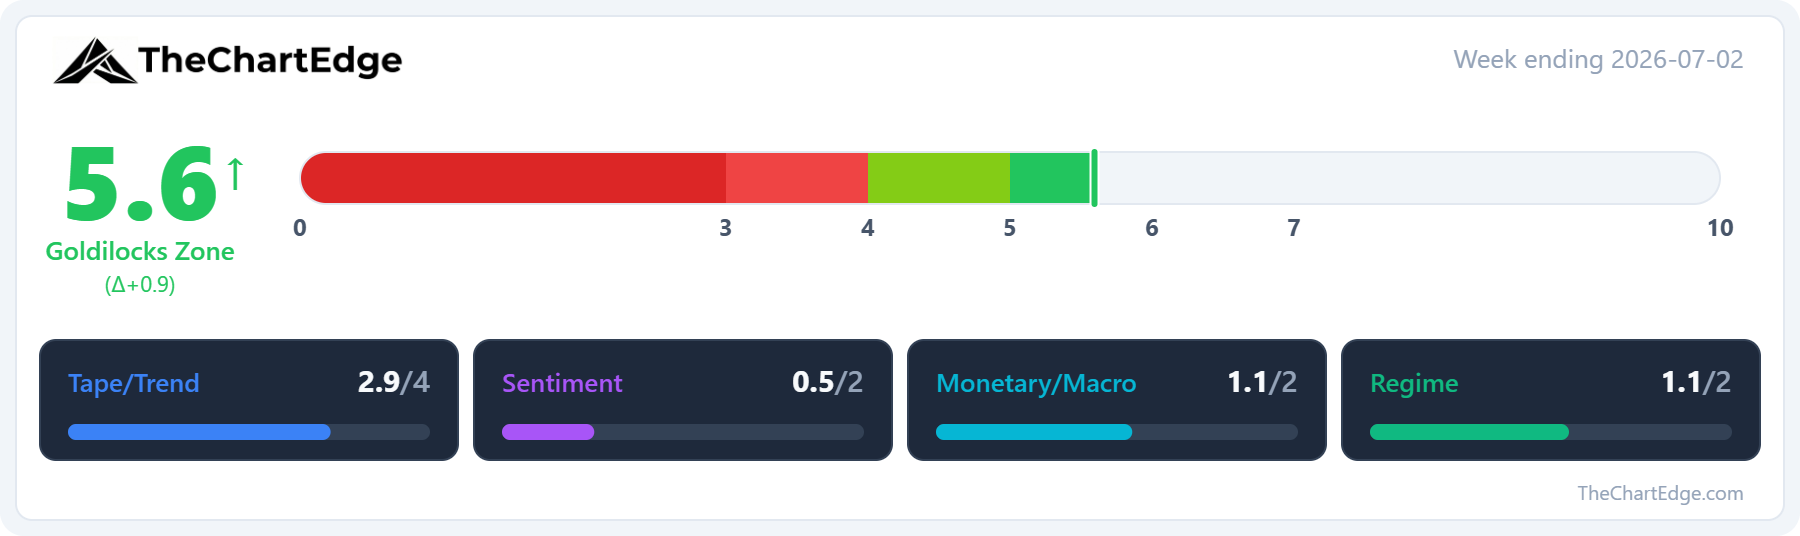
The Market Temperature rebounded to 5.6 from 4.7, moving back into the Goldilocks Zone after a single week in Cautious. Last weekend I wrote that a single week in Cautious is close to a coin-flip, and that it’s sustained weakness below 4.0 that has historically mattered.
The recovery came mostly from the Tape/Trend pillar. The S&P 500 went from Neutral directly back to a Strong Uptrend, the weekly RSI rose to 62.7 from 58.4, and breadth improved for a second week - 59.4% of US stocks are above their 50-day moving average and 59.1% above their 200-day.
Monetary/Macro also firmed. The dollar pulled back after several strong weeks, bond volatility eased with the MOVE index at 65.4, and credit spreads tightened.
The Regime pillar improved as the discretionary vs staples ratio (XLY/XLP) turned back up. High beta vs low volatility remains risk-on, and growth vs value still favours value, both unchanged.
Sentiment was the only pillar to fall. The VIX dropped to 15.8 from 18.4, which the model reads as a contrarian negative.
GICS Sector Relative Strength
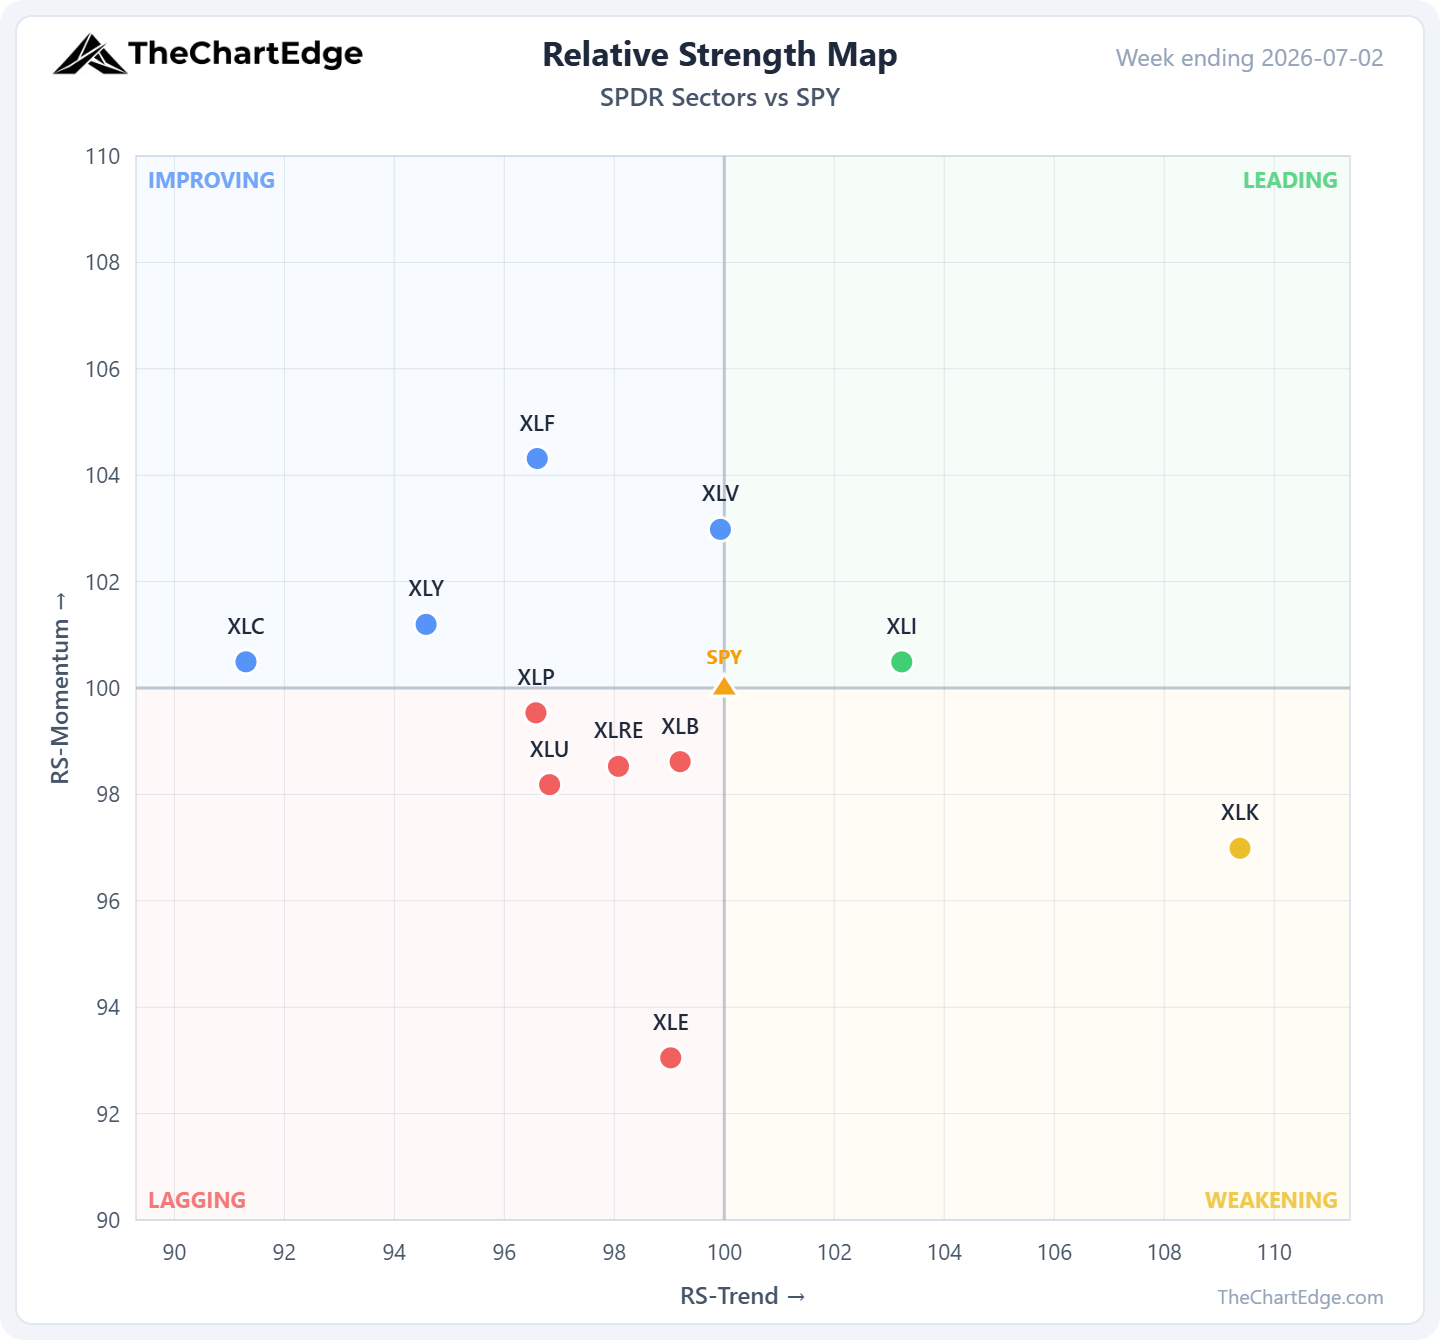
Only Industrials (XLI) sits in Leading after a 1.5% week. Technology (XLK) held in Weakening on a flat week. Discretionary (XLY) was up 2.4%, and Communications (XLC) 3.2%, both crossed up from Lagging into Improving, joining Health Care (XLV), up 2.1%, and Financials (XLF), the strongest sector on the week, up 3.8%. Materials (XLB), up 0.8%, and Real Estate (XLRE), down 1.2%, dropped out of Leading, while Utilities (XLU), down 1.0%, and Staples (XLP), up 0.3%, slipped out of Improving - all four into Lagging. Energy (XLE) fell 1.2% and went from Weakening into Lagging.
Momentum Leaderboard
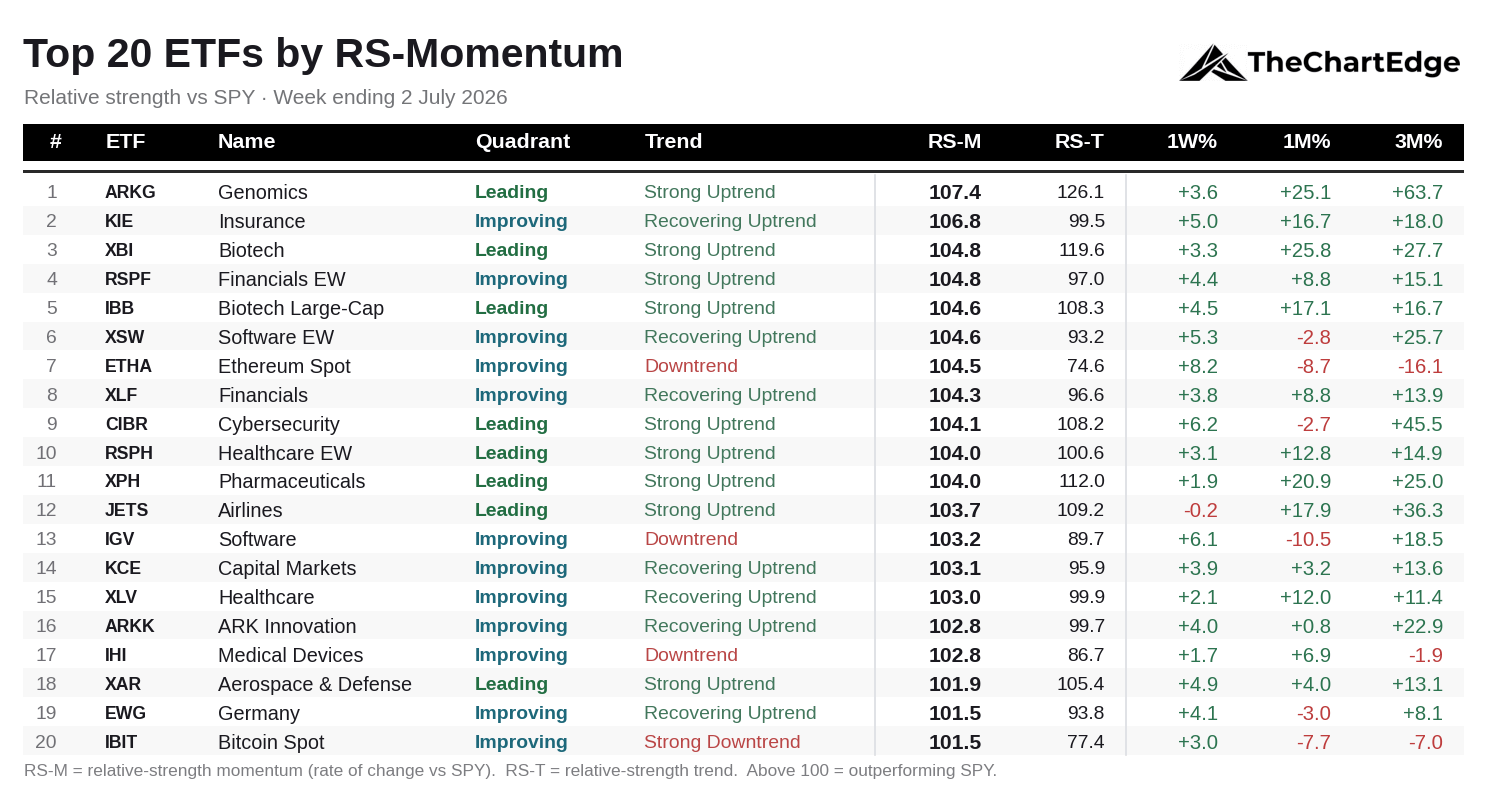
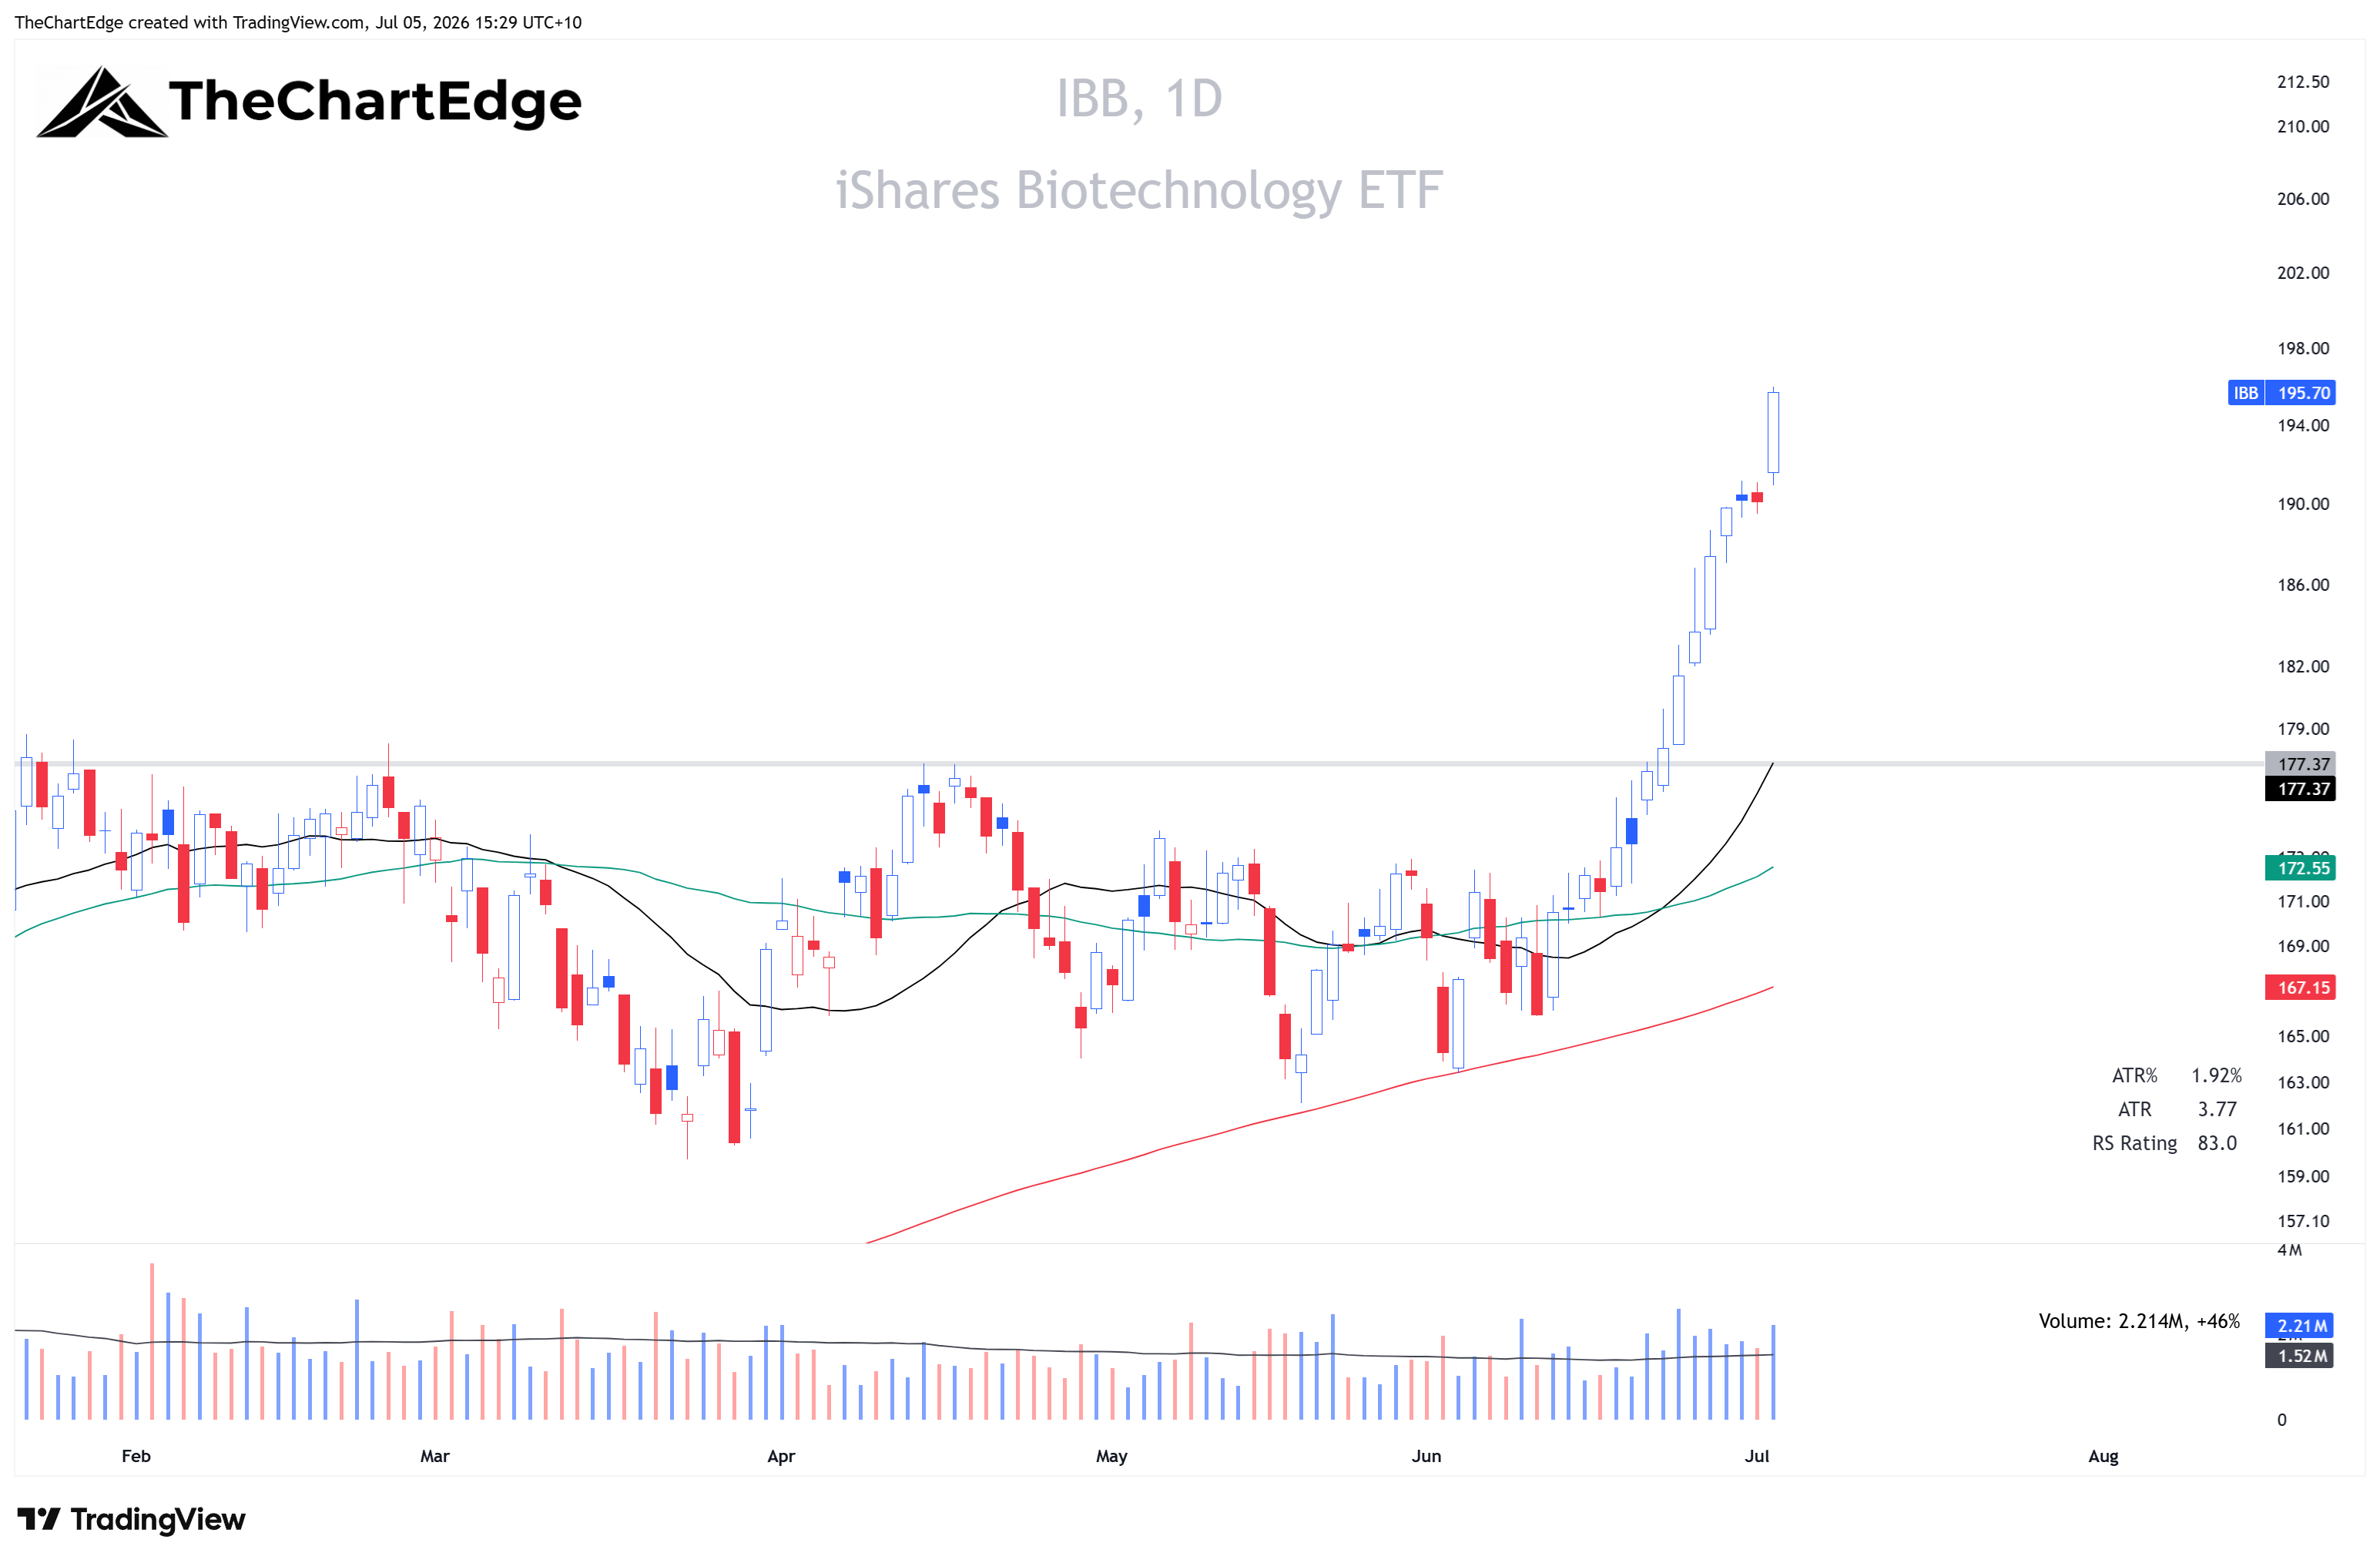
There are nine new names on the board this weekend. The healthcare and biotech leadership held its ground. ARK Genomics (ARKG) still tops the board, with Biotech (XBI), large-cap biotech (IBB) and Pharmaceuticals (XPH) all in the top dozen and all in Strong Uptrends.
Three of the new arrivals are financials - equal-weight financials (RSPF), broad financials (XLF) and Capital Markets (KCE) - joining Insurance (KIE), which sits second on the board after a 5% week. There are no semiconductor names on the board for a second week. Trend quality is much the same as last week, with nine of the twenty in Strong Uptrends and four in downtrend states.
All-time Highs
The Dow (DIA), Insurance (KIE), Russell 1000 Value (IWD), Health Care (XLV), equal-weight healthcare (RSPH), Pharmaceuticals (XPH), large-cap biotech (IBB), equal-weight financials (RSPF), and the equal-weight S&P 500 (RSP) all finished the week within 0.4% of all-time highs.
DIA Chart
IWD Chart
XLV Chart
IBB Chart
Semis and AI Names Down, Software Up
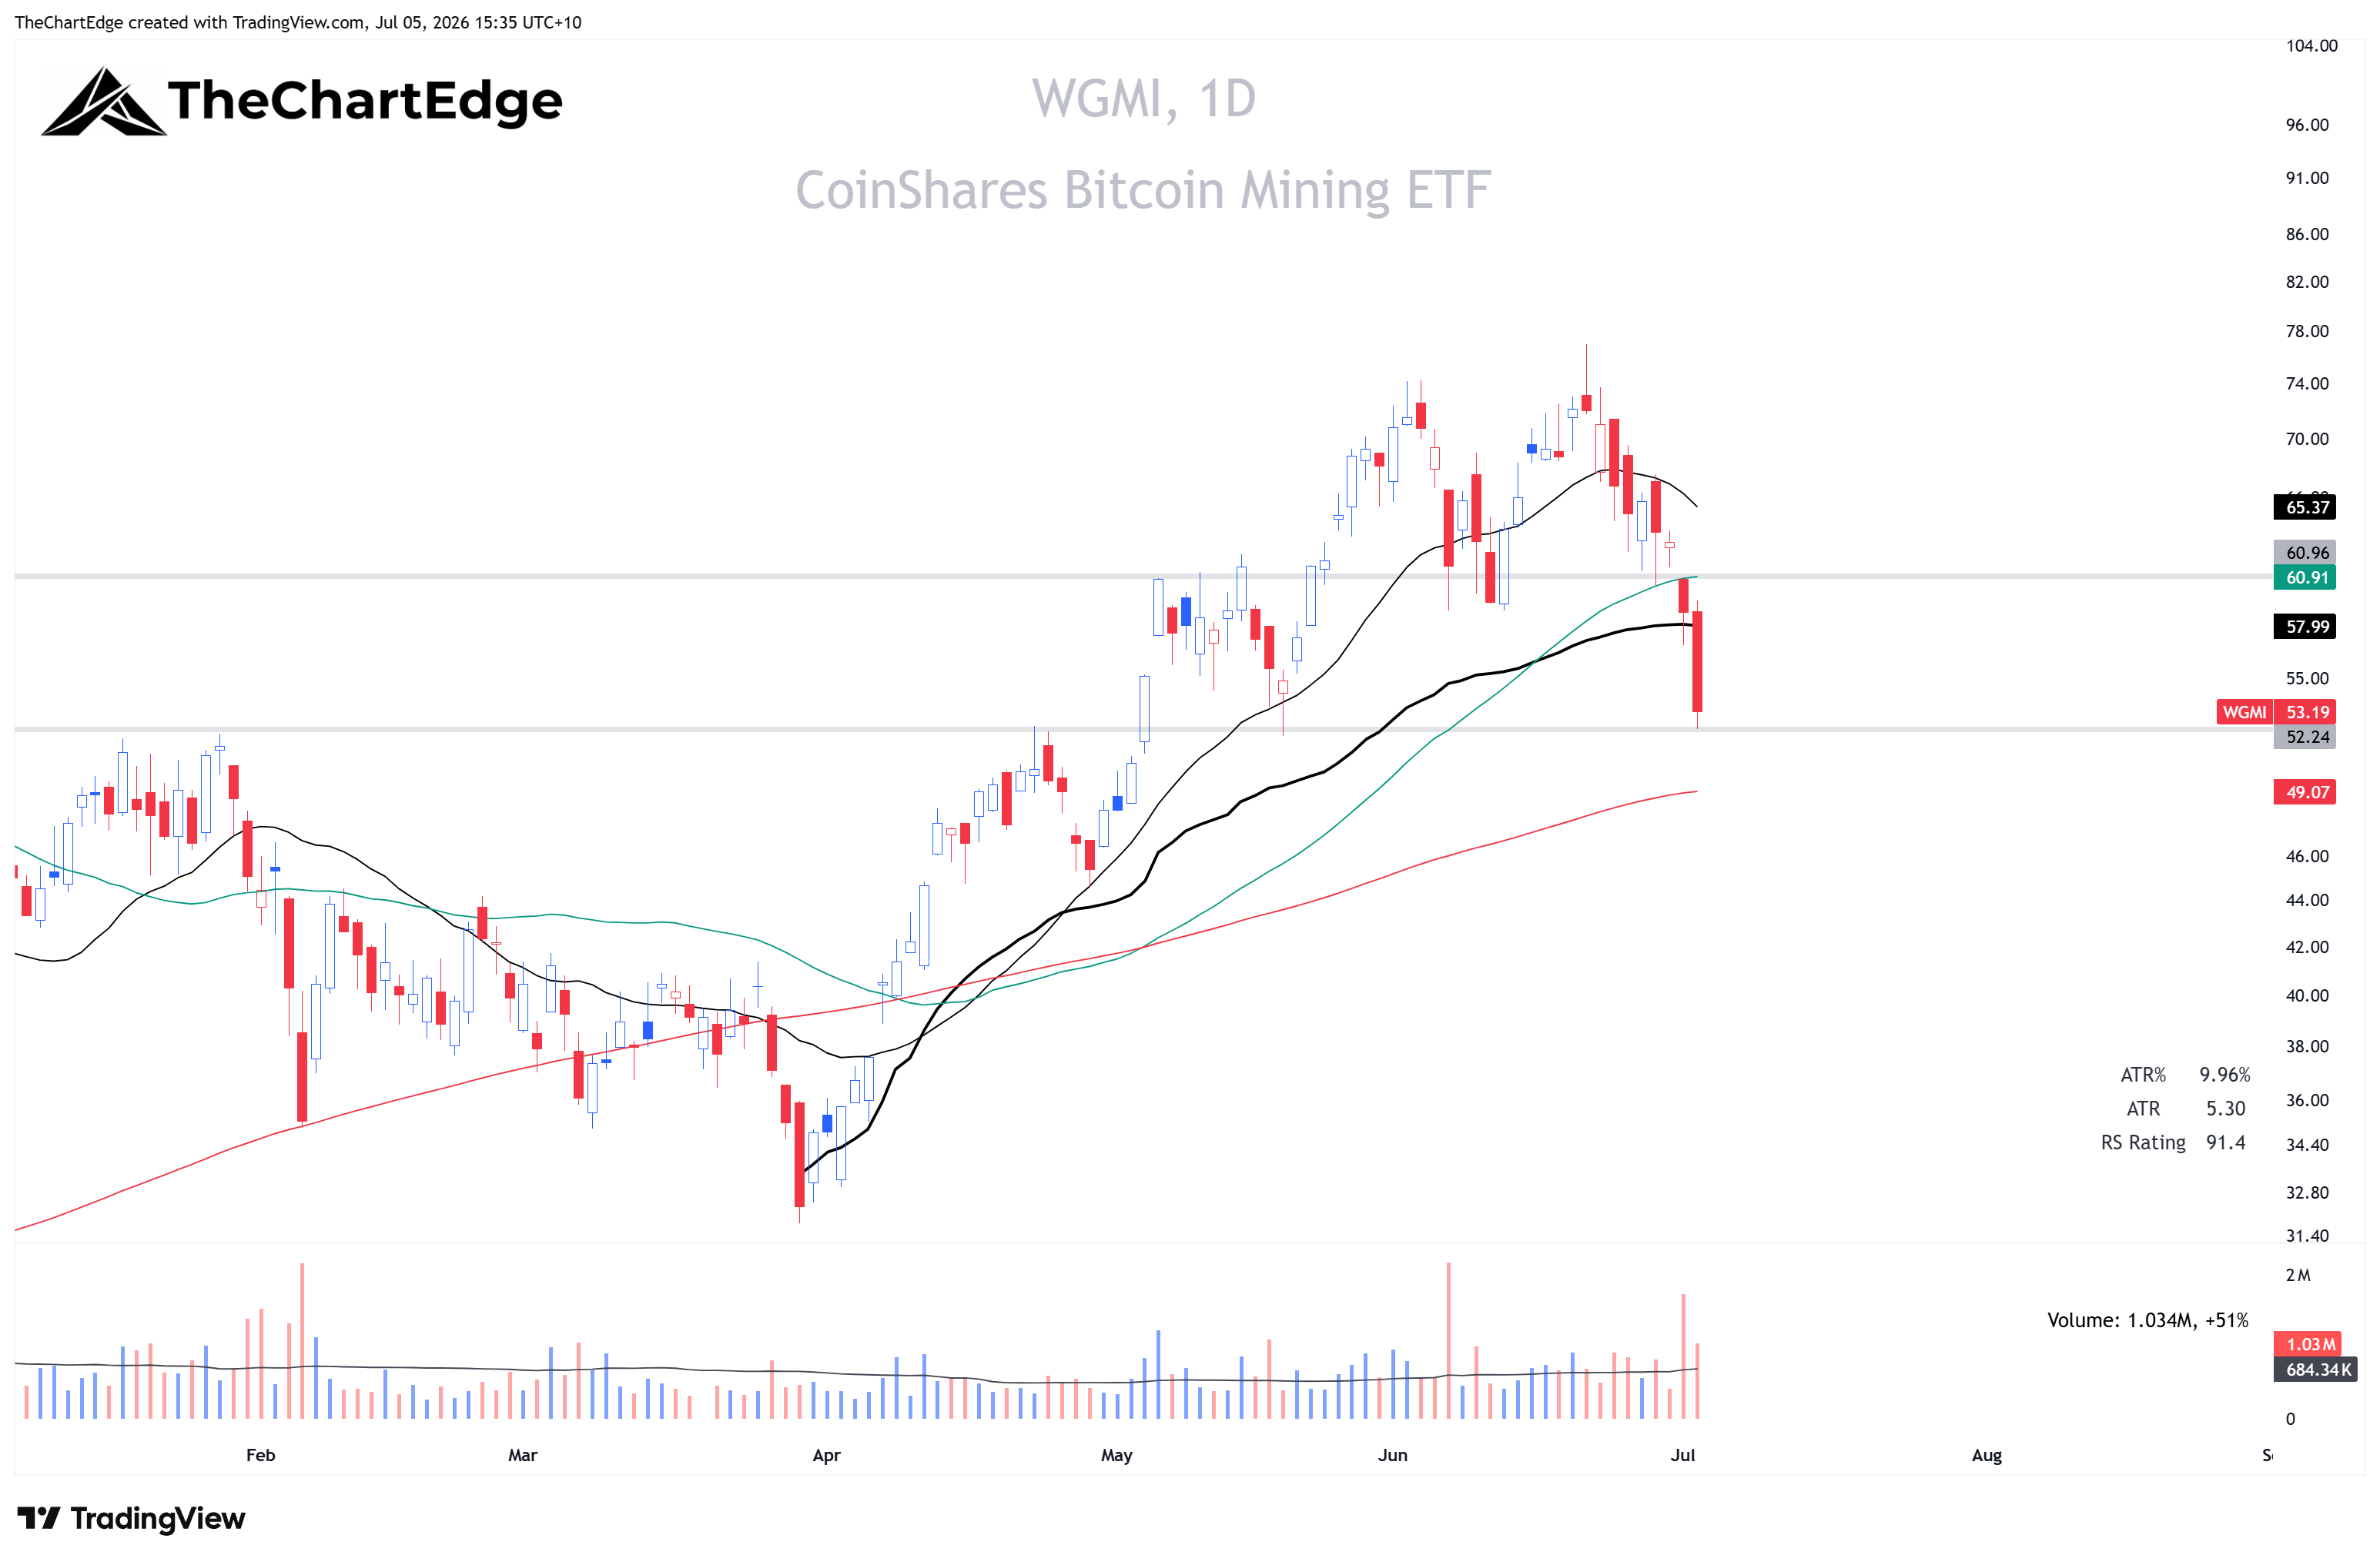
Semiconductors (SMH) fell 3.2% on the week and equal-weight semis (XSD) 2.8%. Generative AI (CHAT) fell 5.2%, Data Center Infrastructure (DTCR) 7.2% and AI Innovation (BAI) 4.3%. Crypto miners (WGMI), which mostly trade as an AI compute proxy now, fell 19.1% - the worst week of any ETF I track. Bitcoin (IBIT) and Ethereum (ETHA) rose 3.0% and 8.2% for the week and both made the Momentum Leaderboard. However, they remain in severe downtrends, still more than 50% and 65% below their all-time highs.
SMH Chart
XSD Chart
CHAT Chart

WGMI Chart
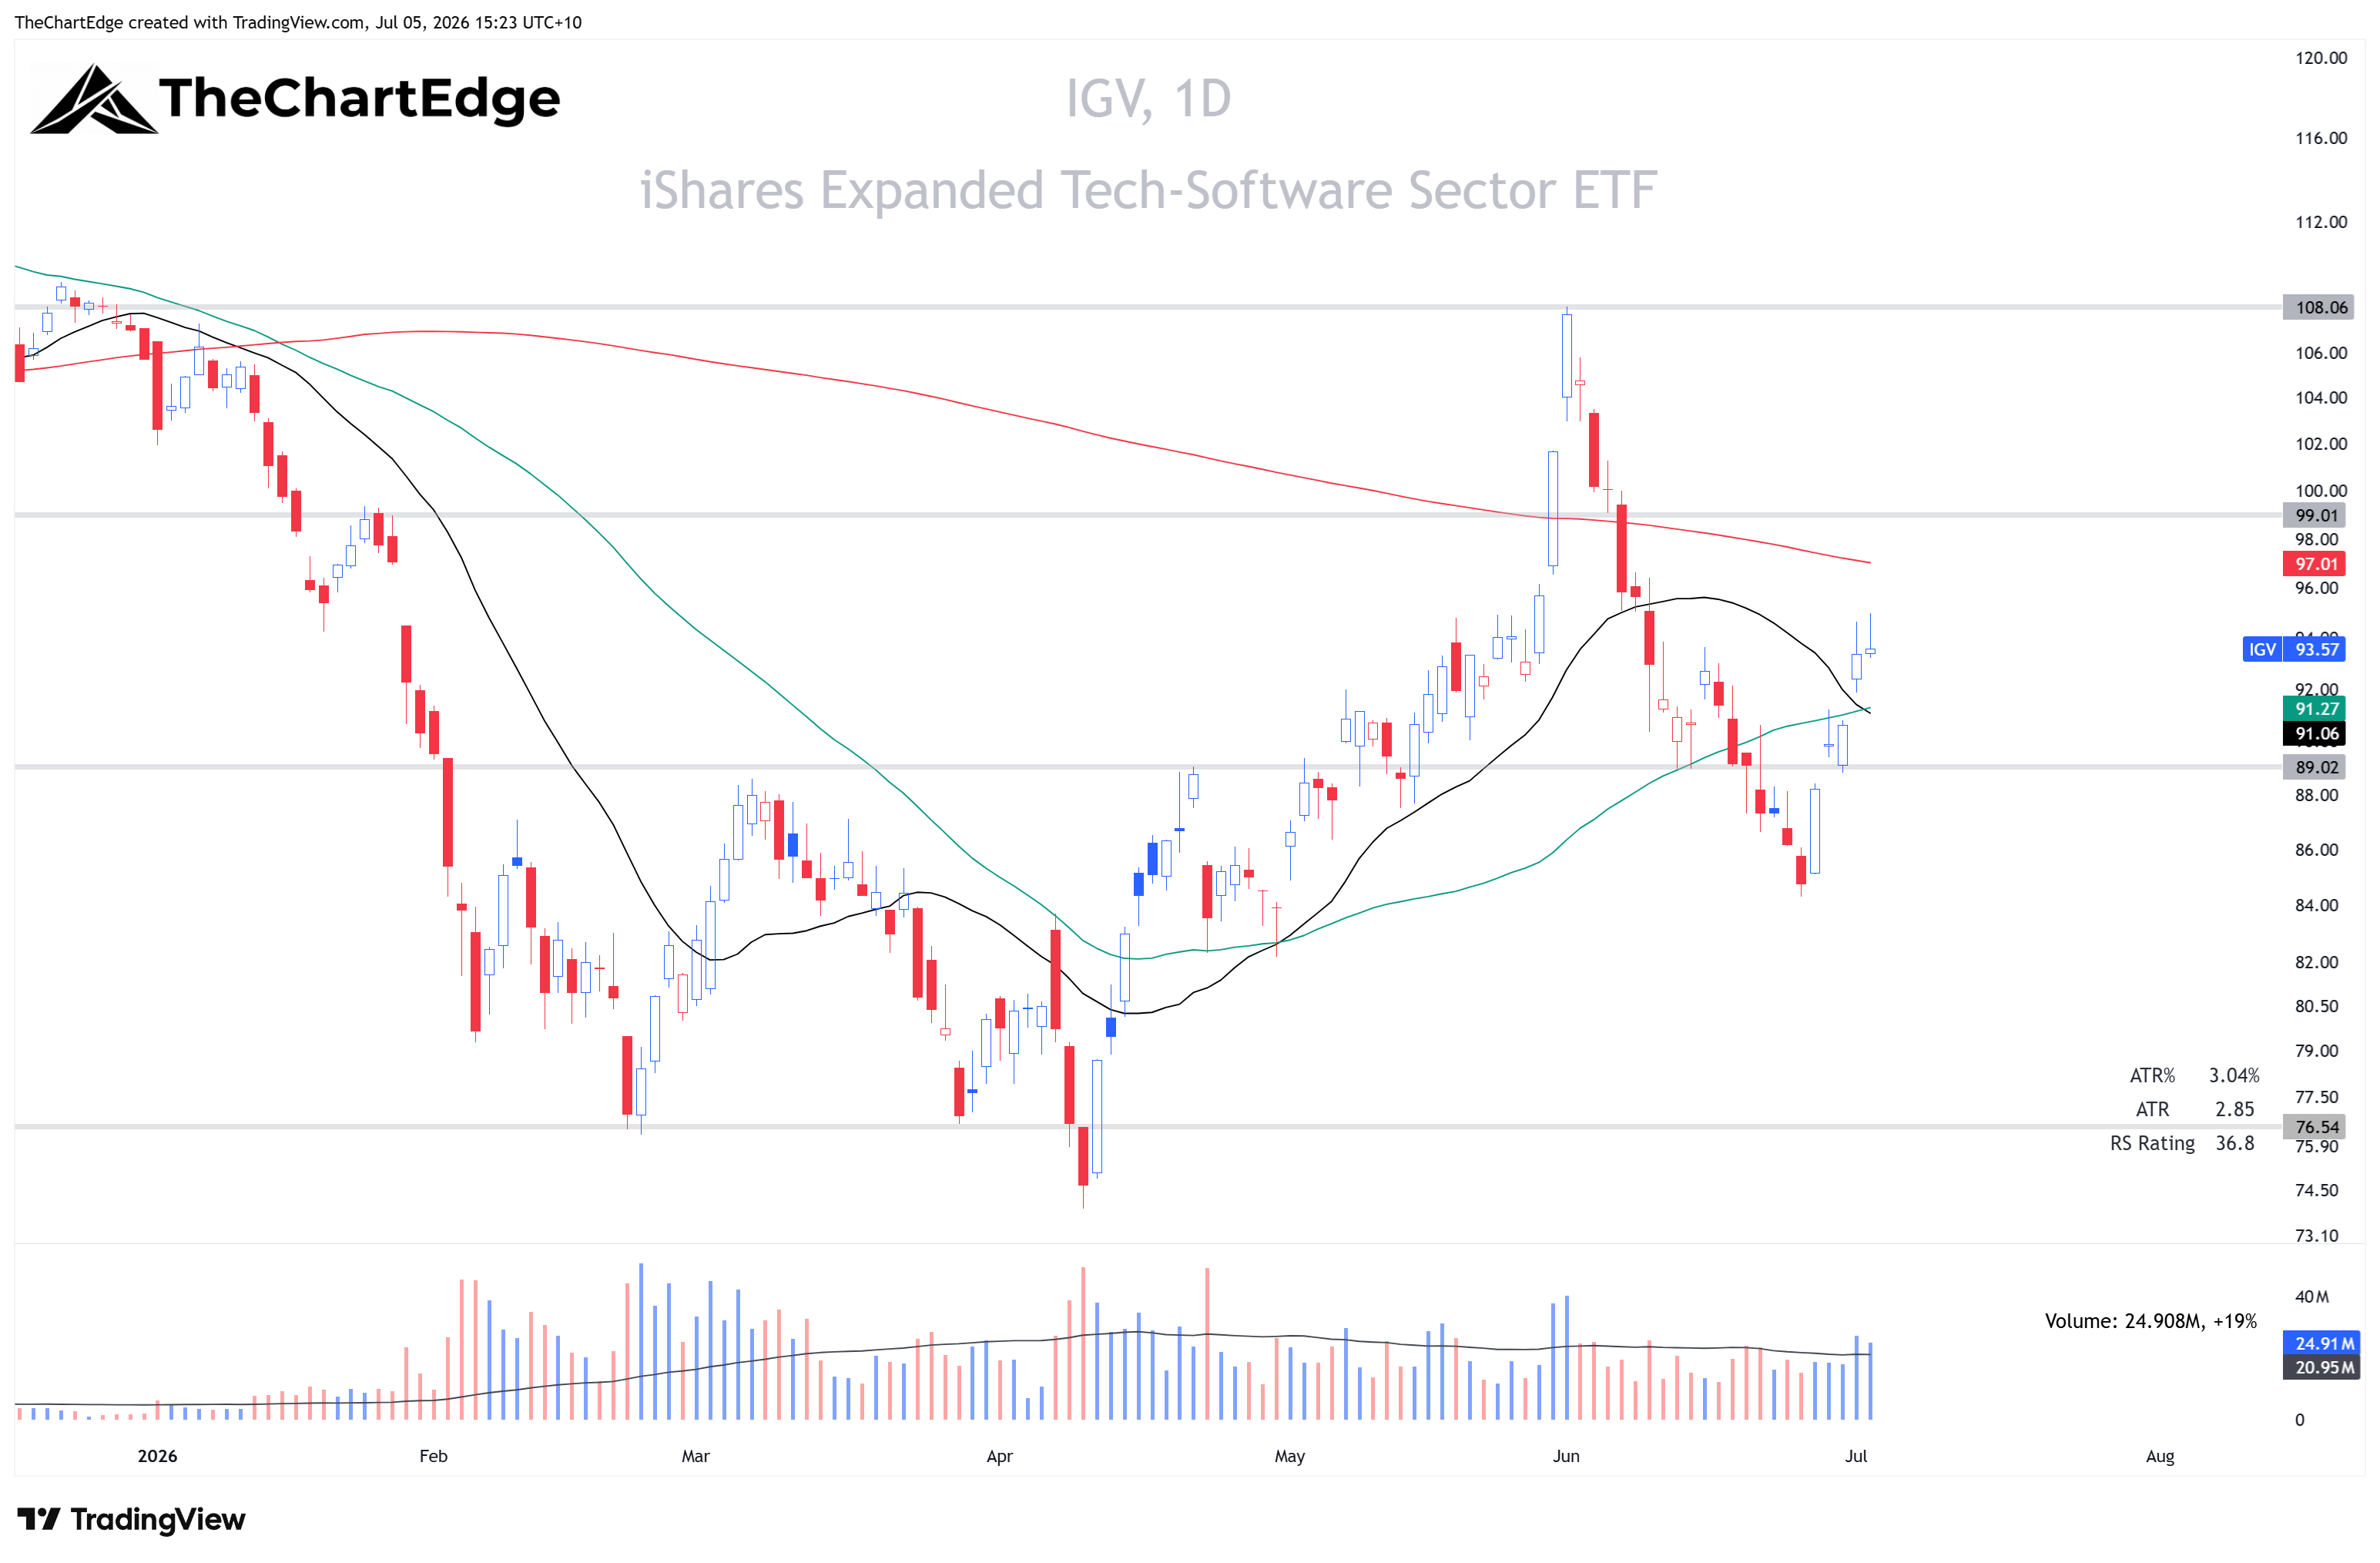
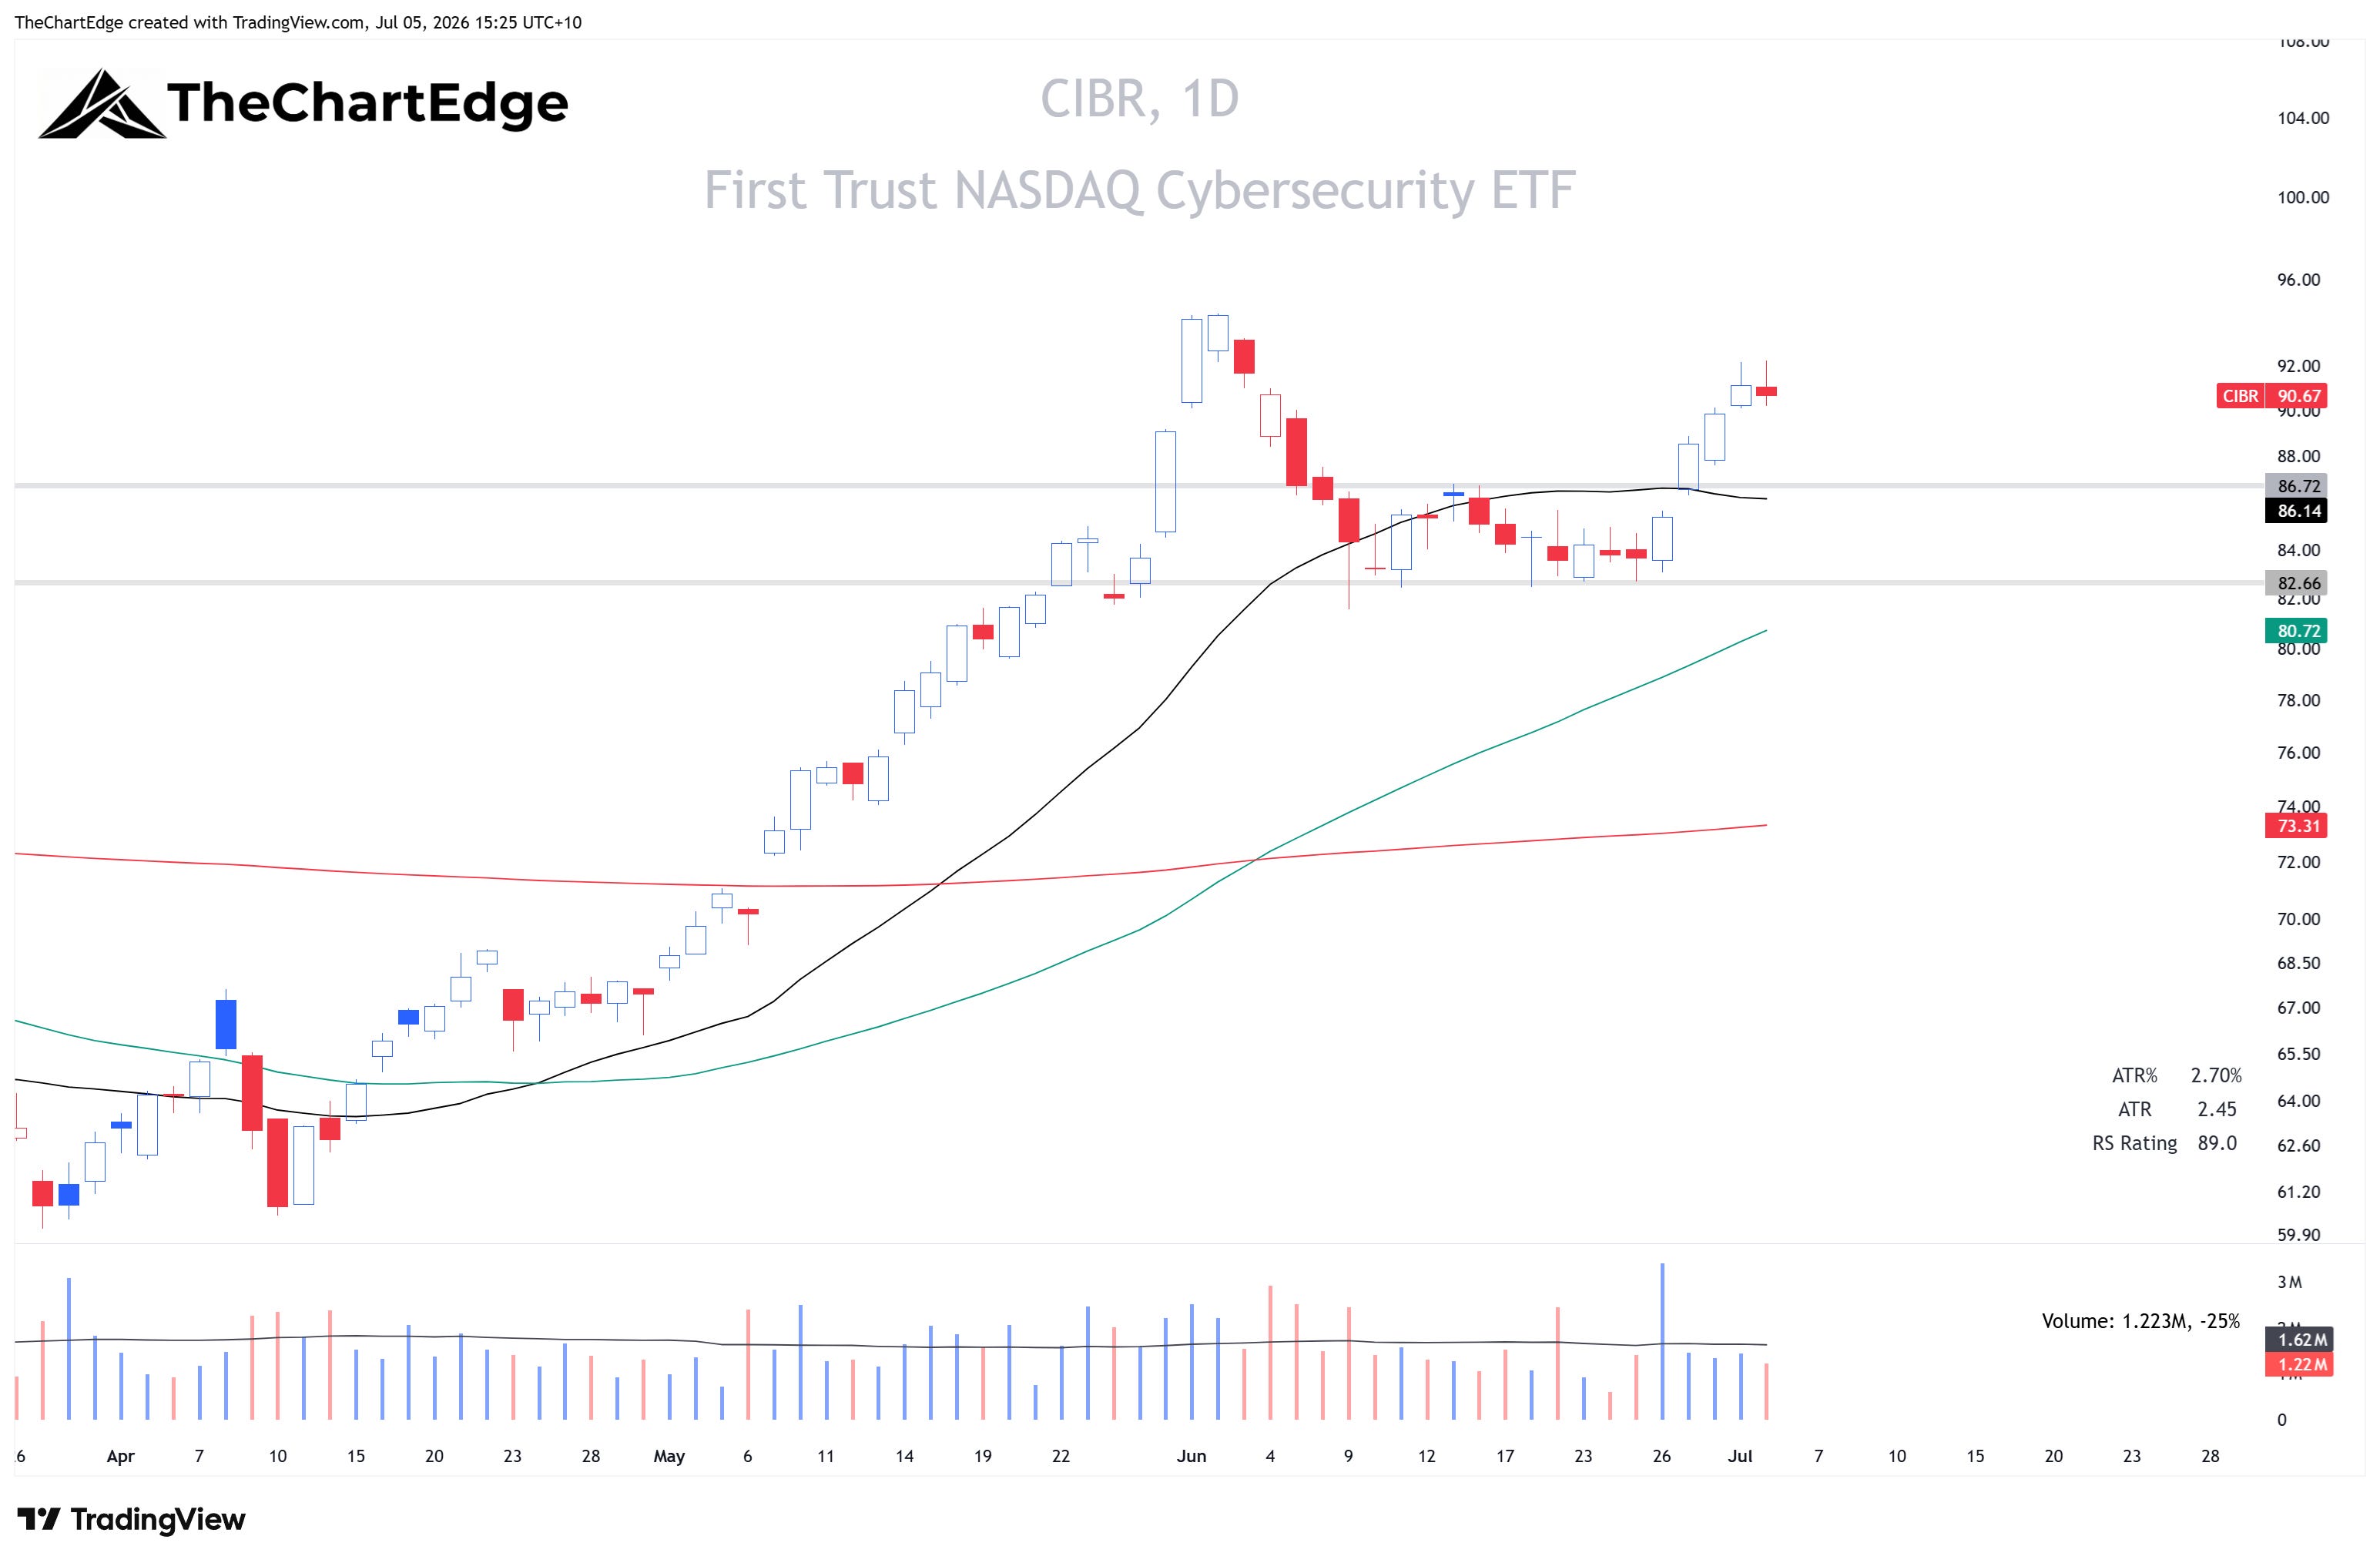
IGV rose 6.1%, despite that ETF containing many of the crypto miner names. Equal-weight software (XSW) was up 5.3%, and cybersecurity (CIBR) 6.2%, back in a Strong Uptrend. IGV is still in a Downtrend, 3.6% below its 200-day SMA. XSW doesn’t look as bad, above its 200-day, but I’m not looking to trade them until their moving averages align bullishly.
IGV Chart
CIBR Chart
Financials - Insurance and Capital Markets Lead
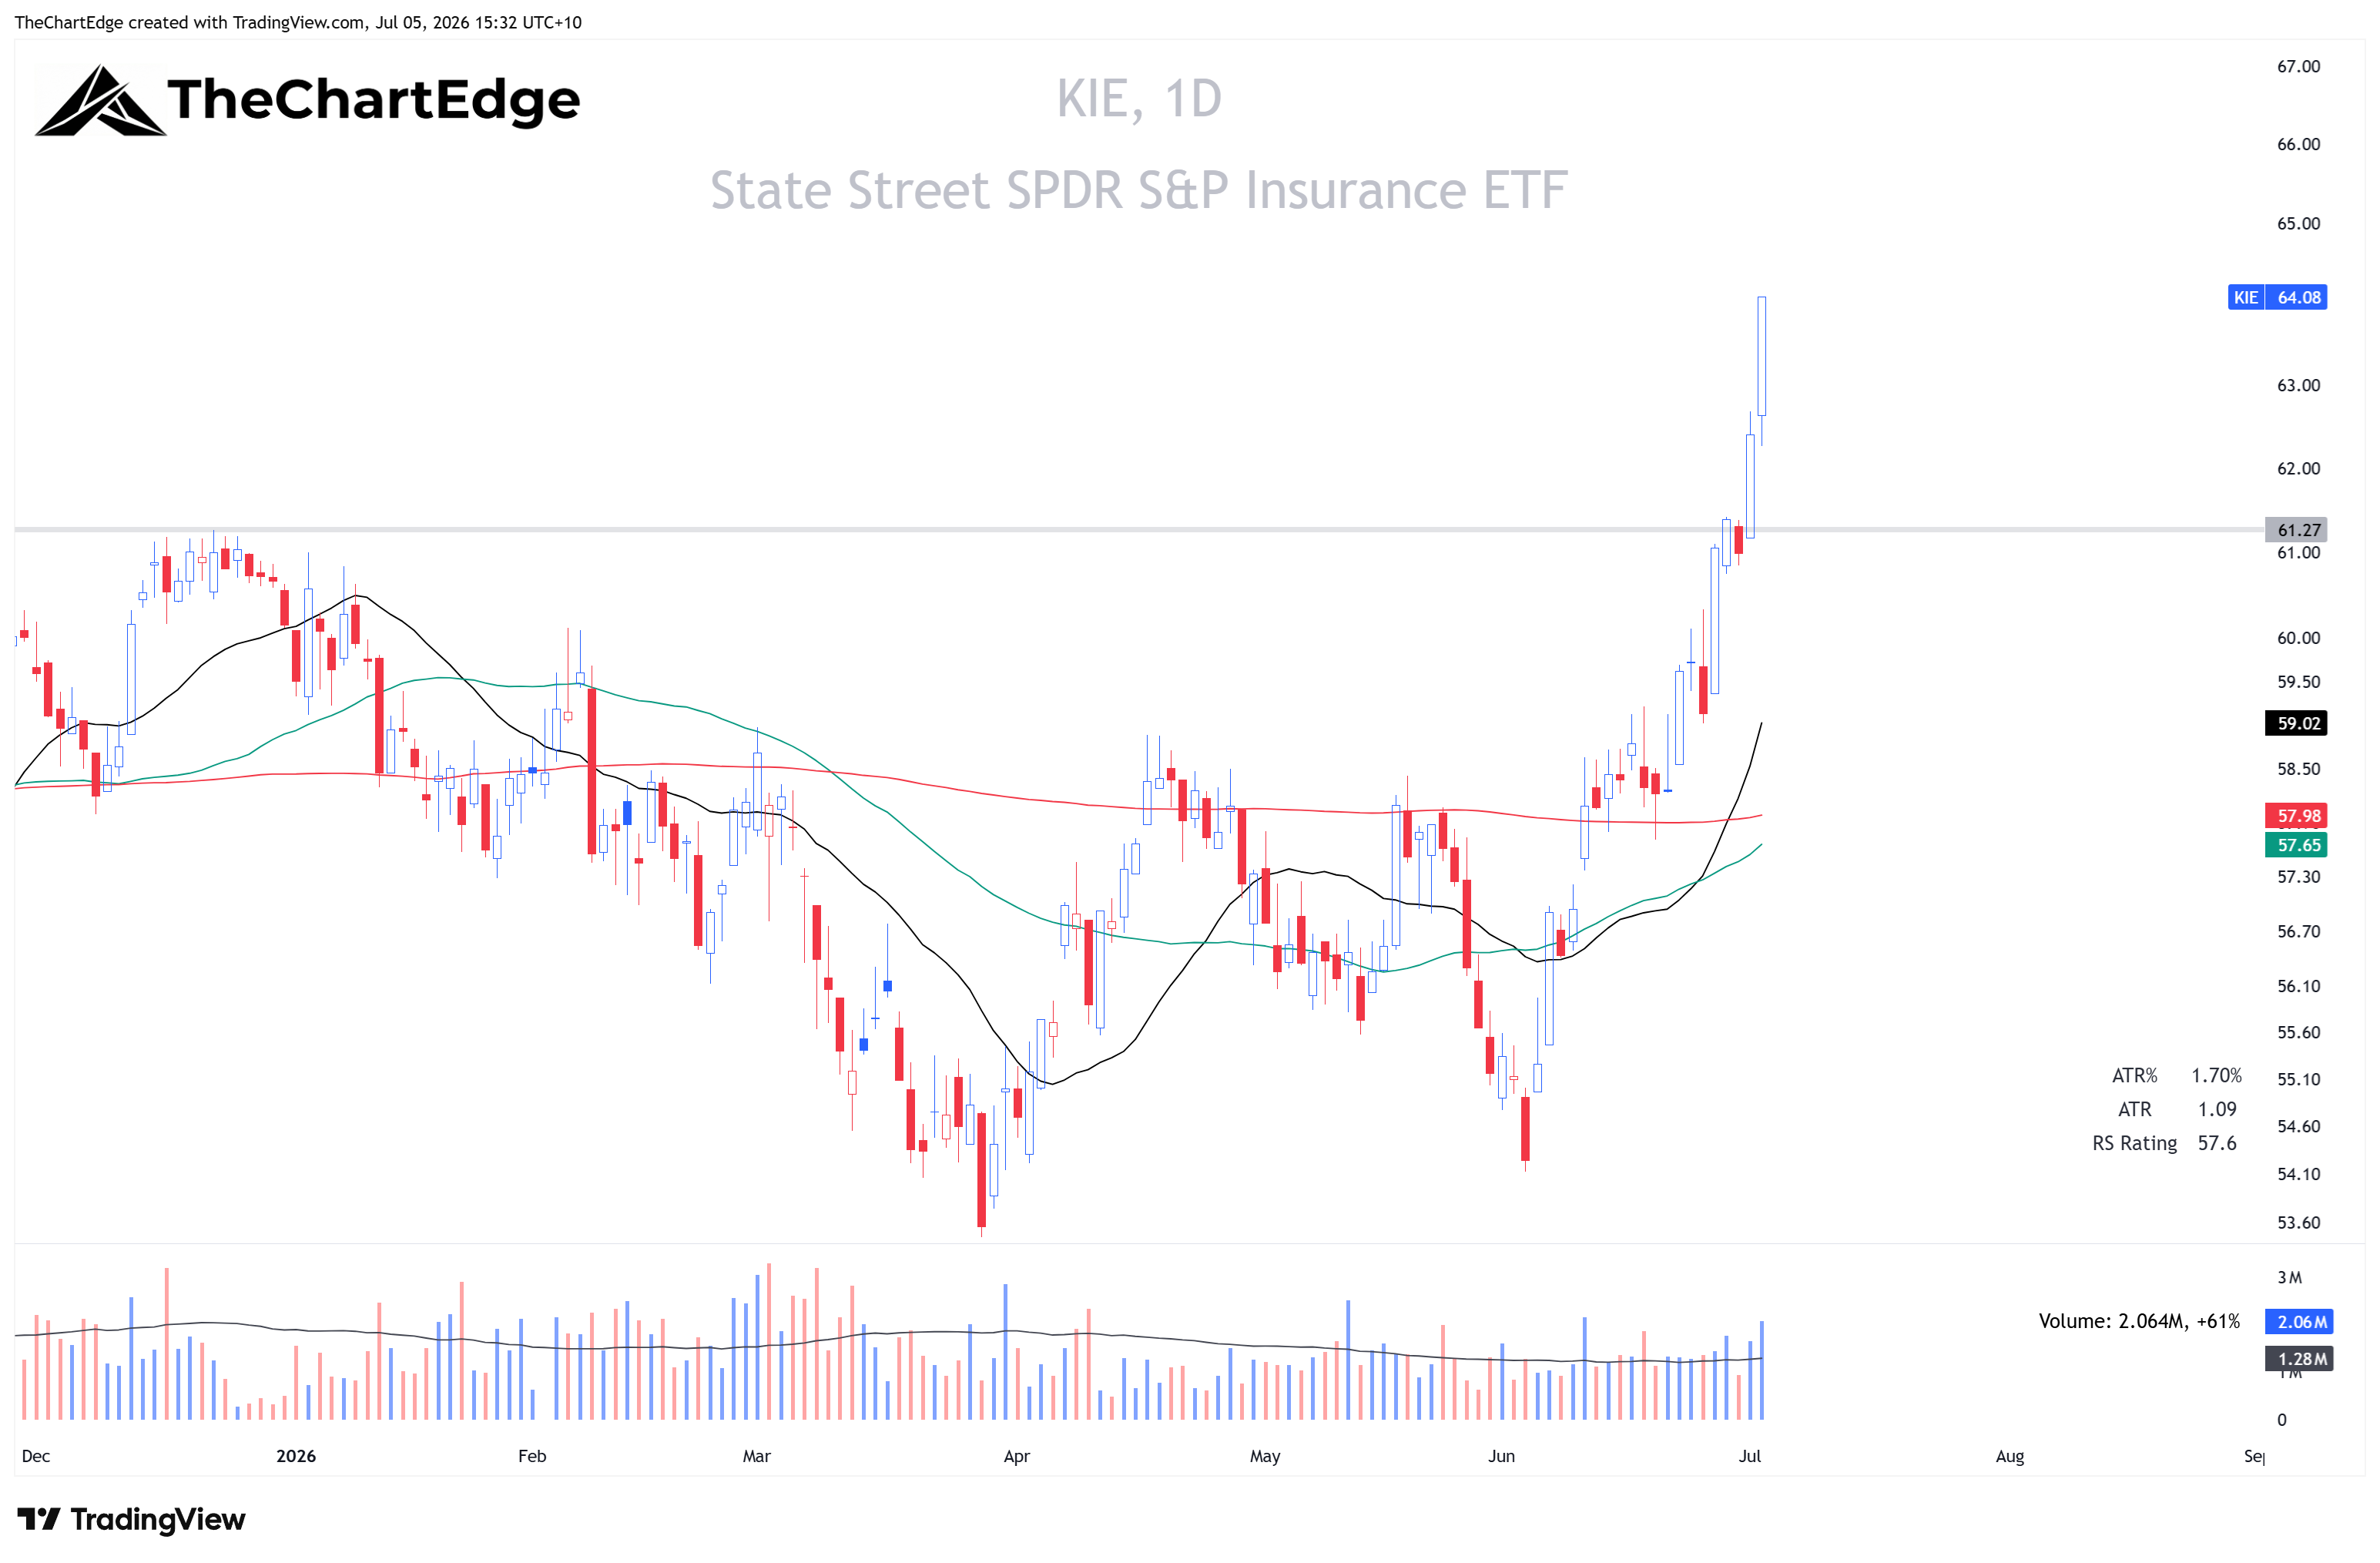
Within financials, the strength was in insurance and capital markets rather than the banks. KIE rose 5.0% and KCE 3.9%. The banks looked good until Thursday, when both KBE and the regional banks (KRE) sold off to finish the week roughly flat - KBE up 0.3% and KRE down 0.2%.
KIE Chart
Rates Up, Rate-Sensitives Down
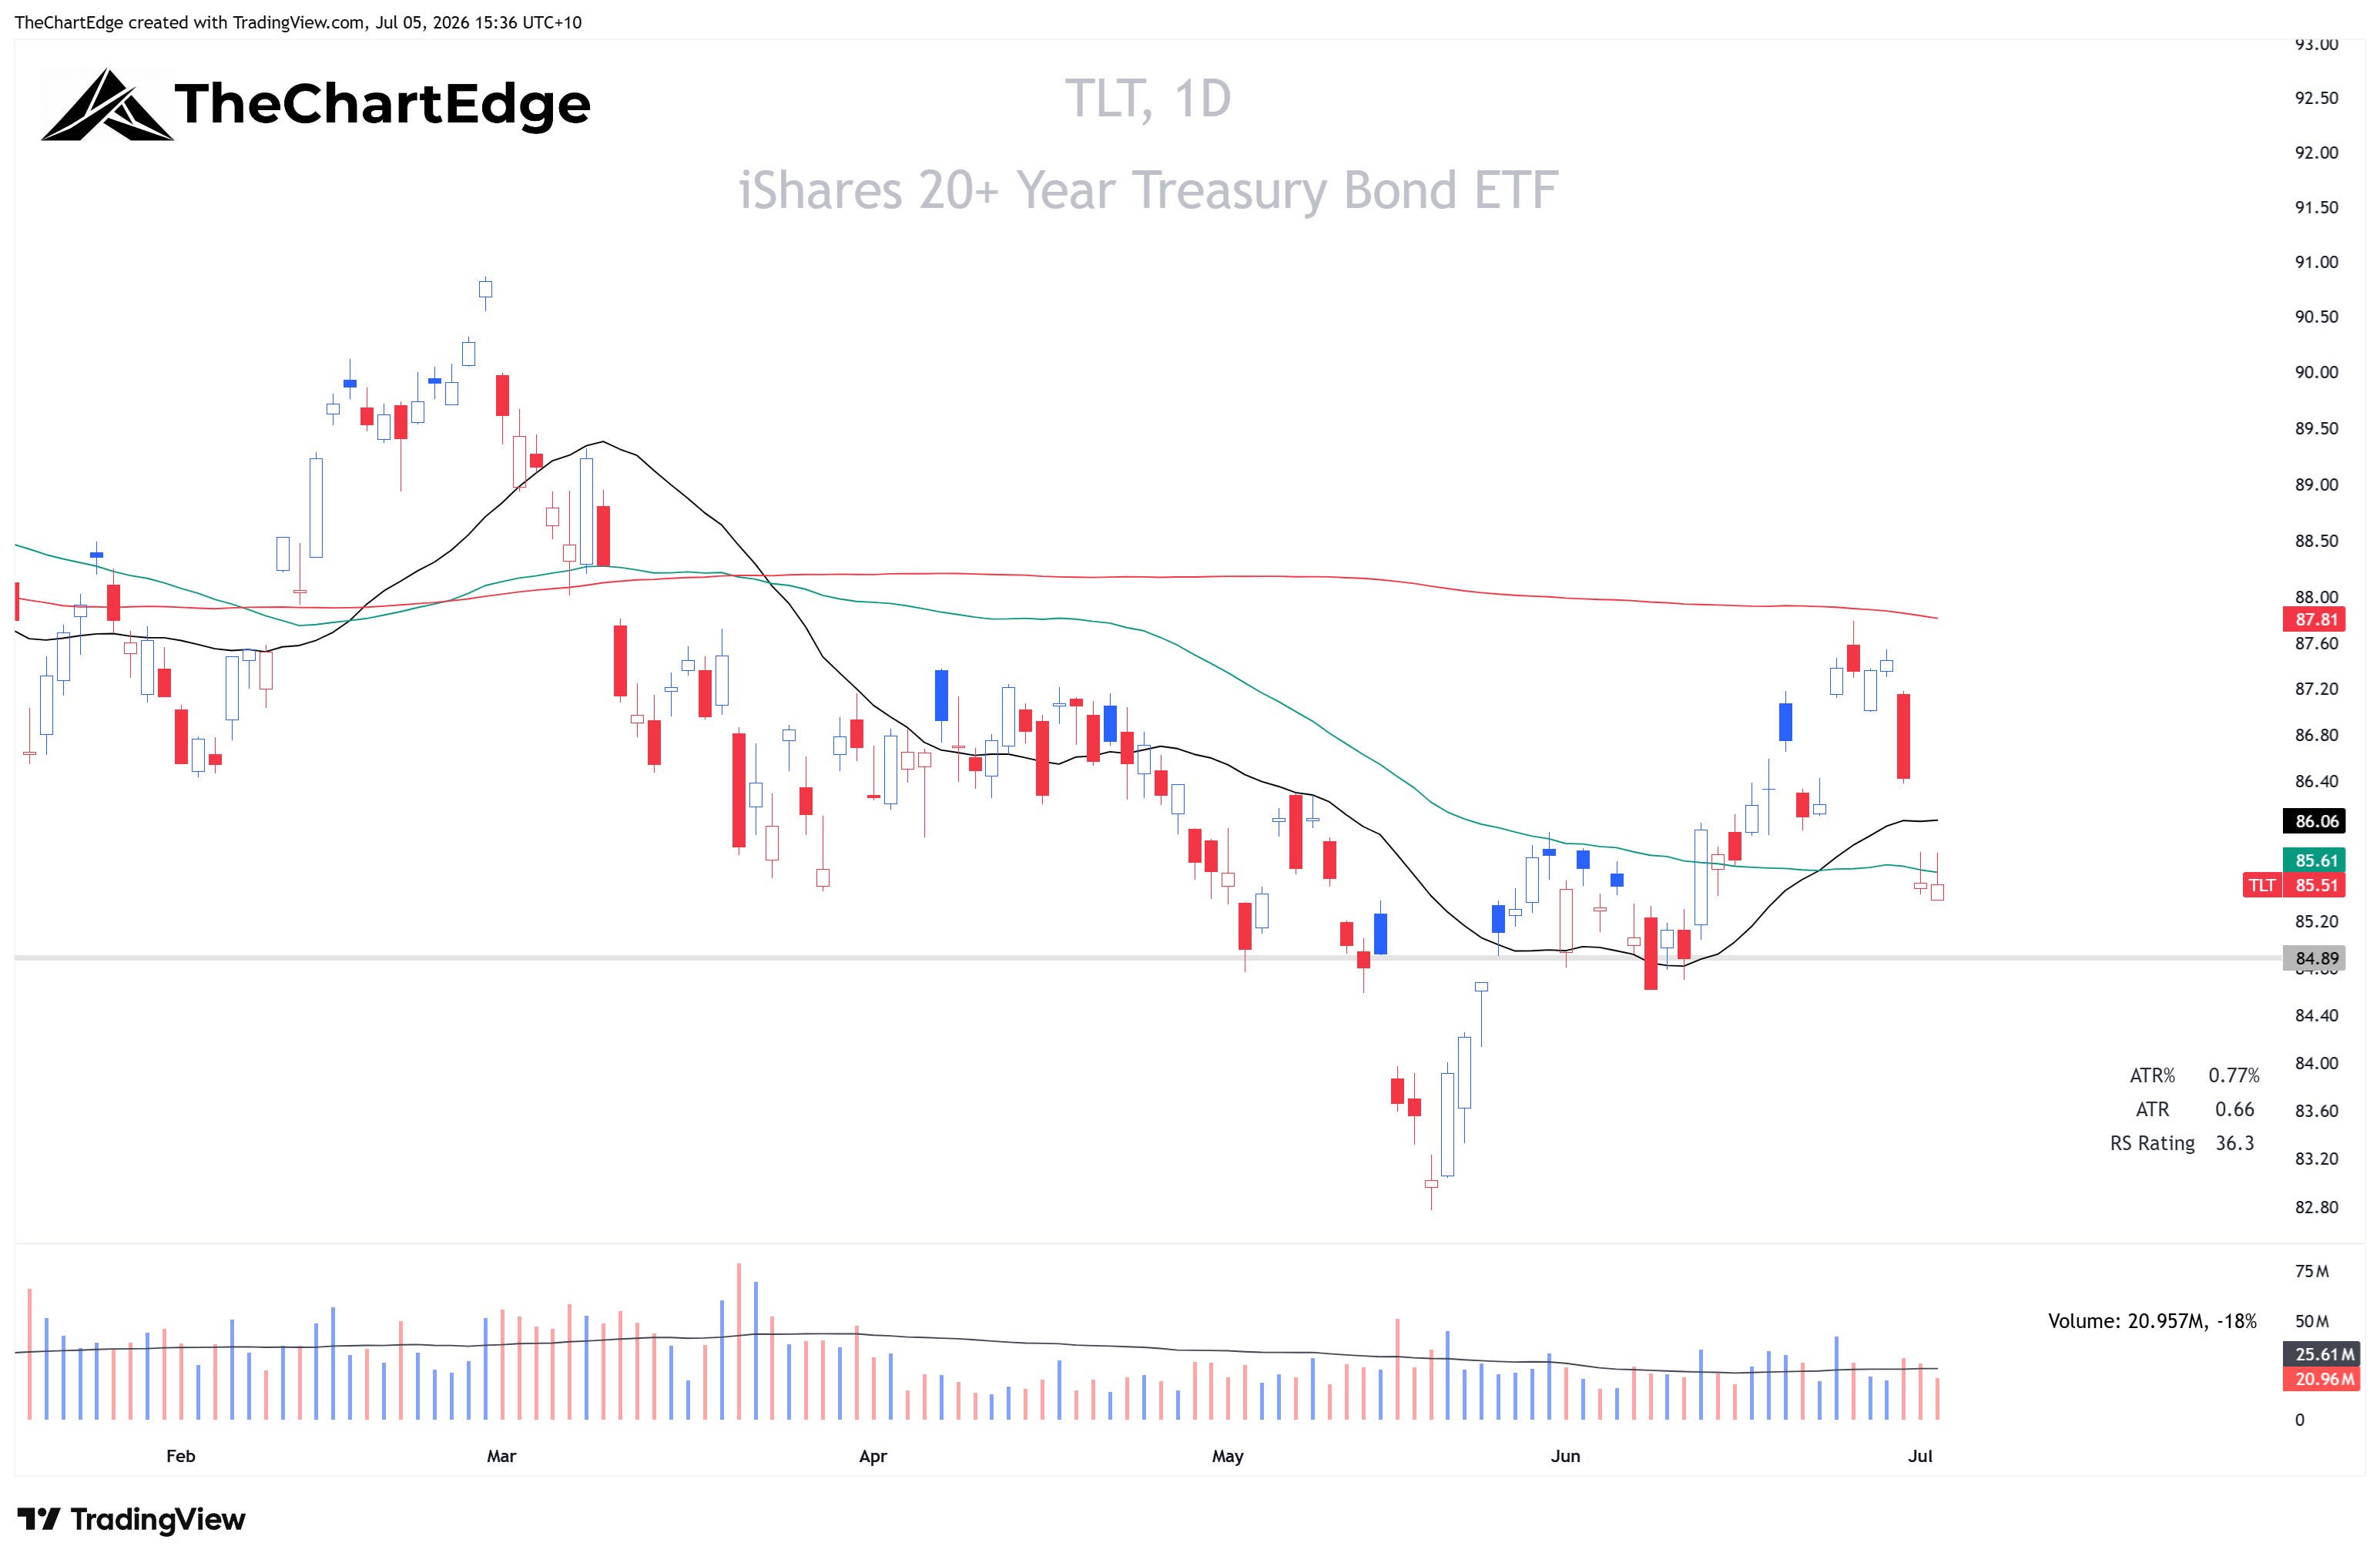
Treasury ETFs fell across the curve, with the 20+ year (TLT) down 2.1%, and every fixed income ETF I track dropped from Improving into Lagging. The rate-sensitives went with them. Utilities and Real Estate lost RS ground, as mentioned above, and the homebuilders were hit harder - Home Construction (ITB) fell 1.9% and Homebuilders (XHB) 2.7%, both dropping out of Leading.
TLT Chart
Aerospace, Defense and Space
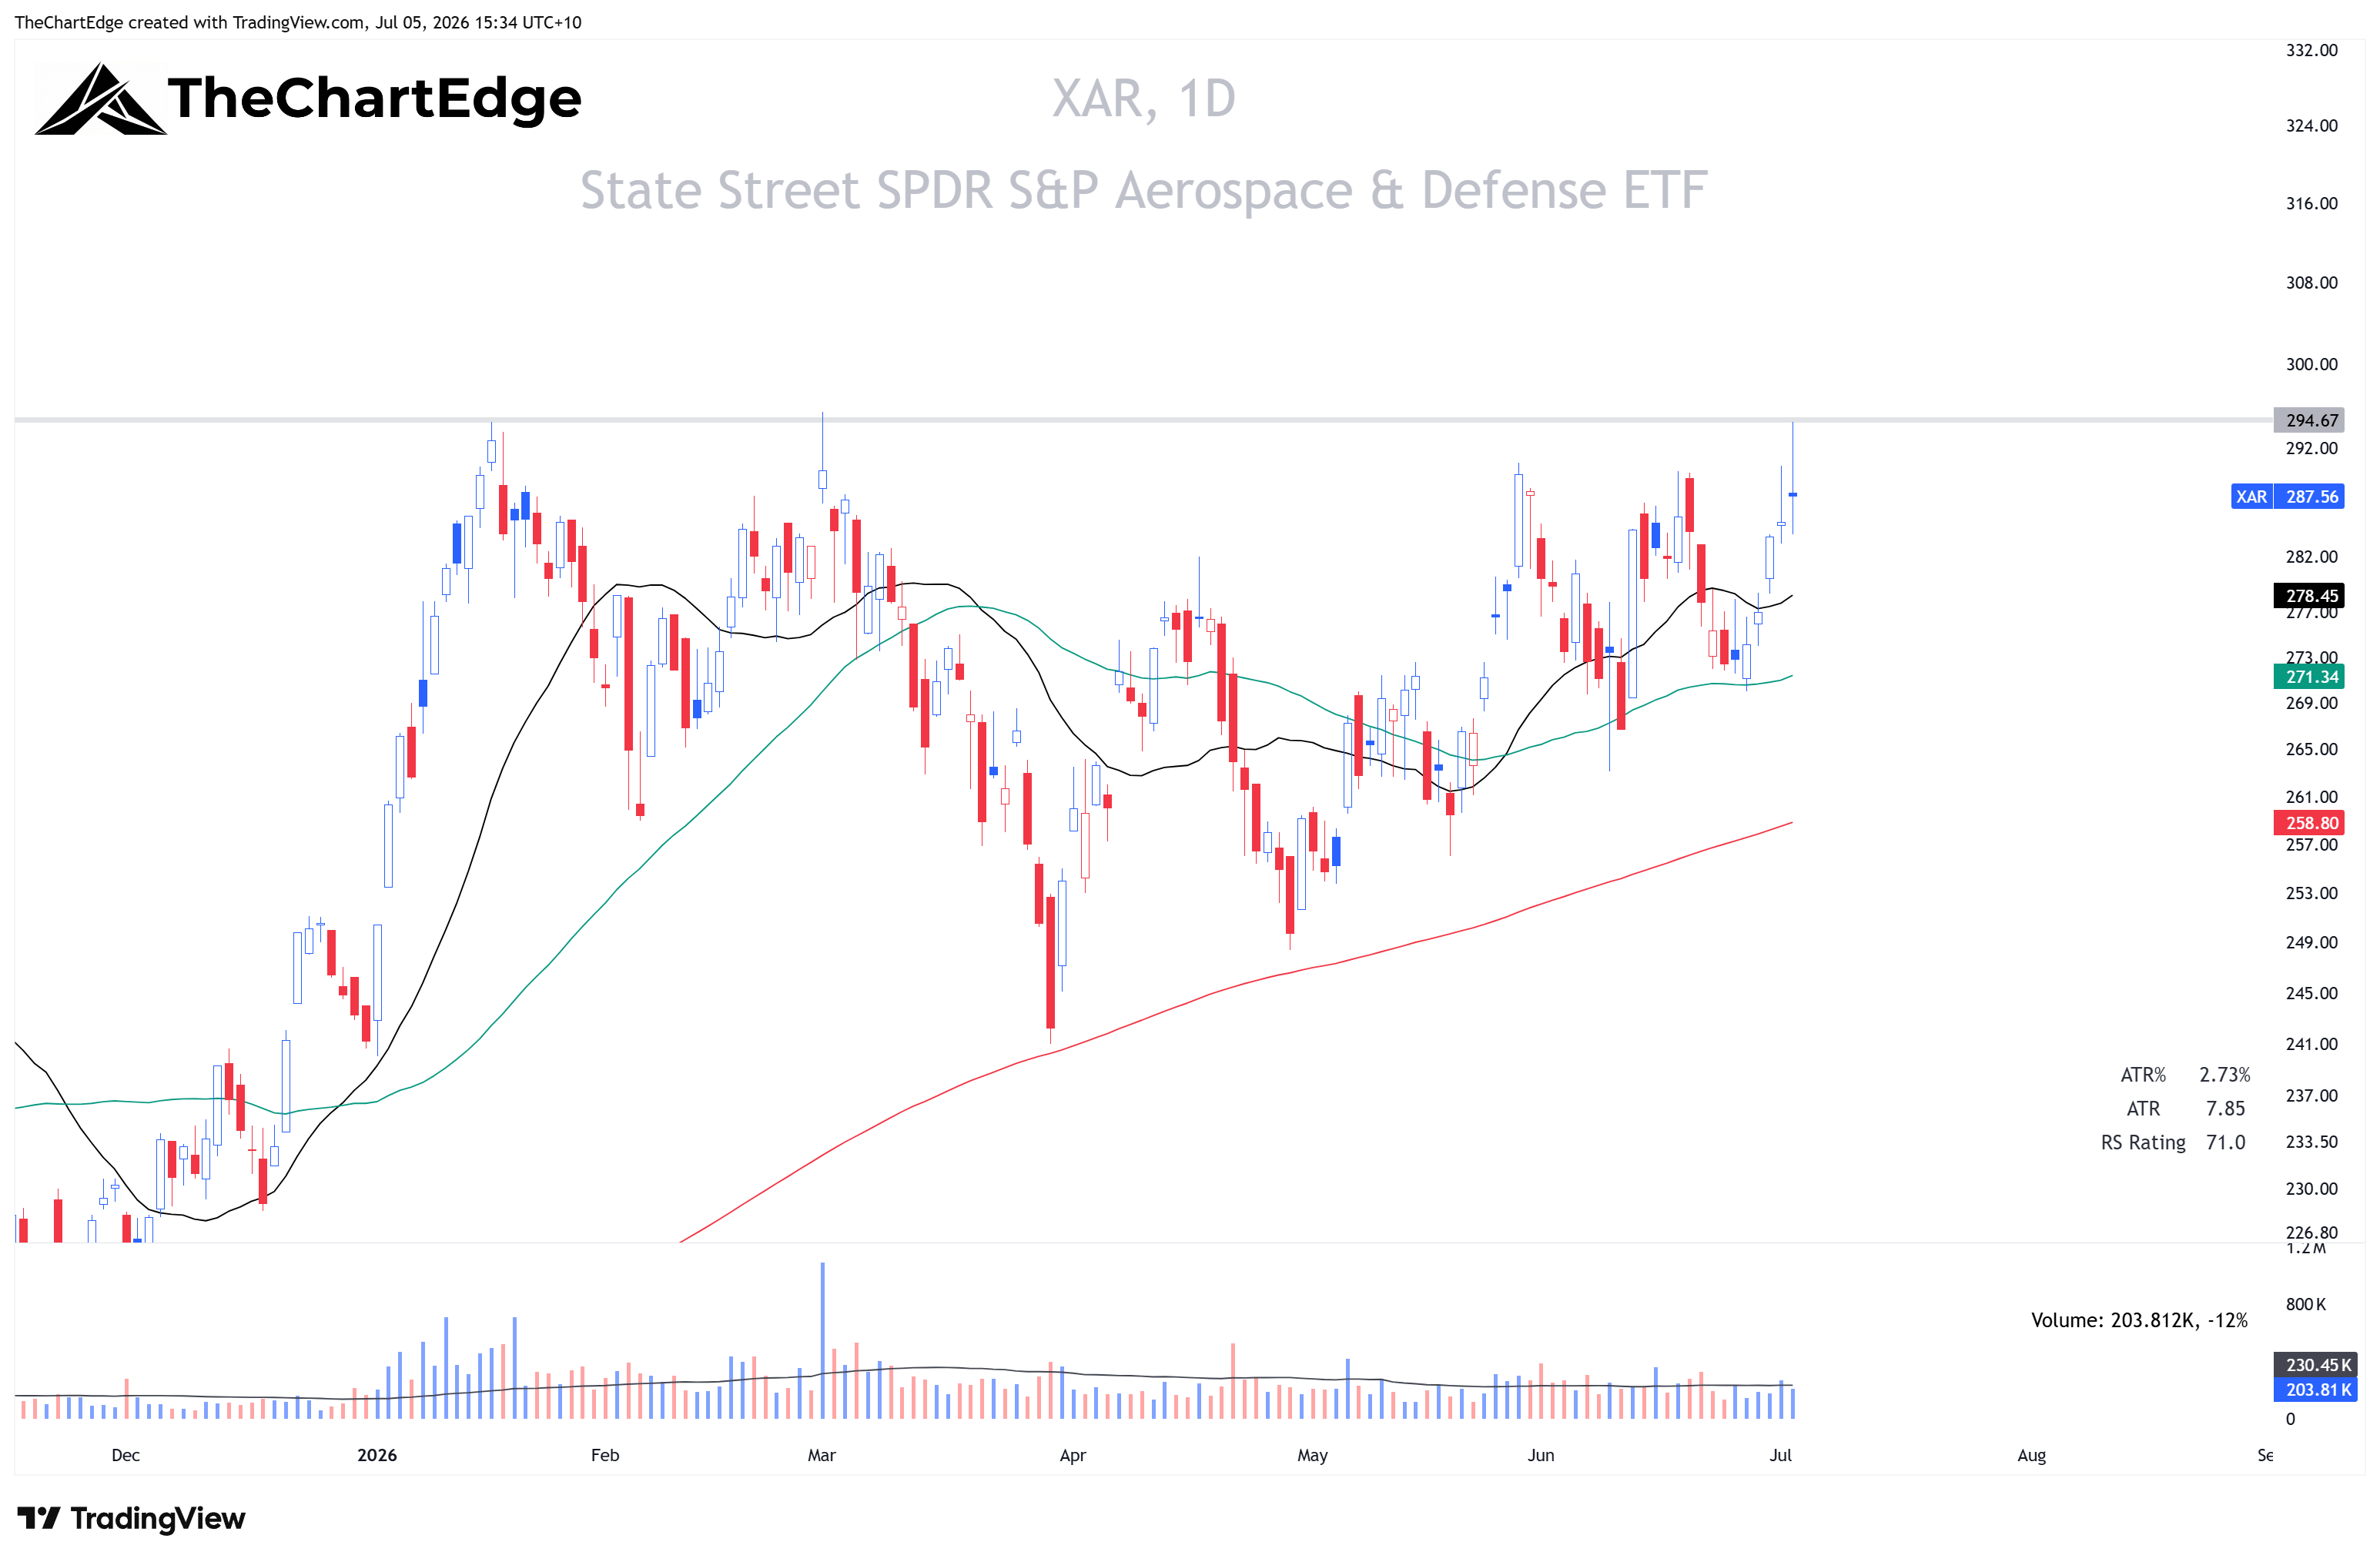
Aerospace & Defense (XAR) rose 4.9%, crossed into Leading and is now in a Strong Uptrend, only 2.7% from an all-time high. ARK Space (ARKX) rose 6.1%, also crossing into Leading.
XAR Chart
The Week Ahead
The temperature is back in the Goldilocks Zone and the SPY returned to a Strong Uptrend, but the leadership picture is very different to what we have seen for most of the year. The names at all-time highs are healthcare, financials, value, and the Dow. I will be watching the semi and AI ETFs next week to see if they can hold around their 50-day SMAs and/or AVWAP from the March 30 lows. That would be a logical place for a bounce, but I’m not in a hurry to add back individual stock exposure until it becomes clearer the volatility has settled. I was stopped out of Teradyne (TER) on Thursday, which was the last remaining position I held in AI-related stocks. Currently, my only positions are in XBI and Eli Lilly (LLY). I am considering entering a new position in the S&P 500 index CFD on Monday with a stop under last Thursday’s low and the 50-day SMA, which sits just below that. If semi and AI names bounce next week, I may look to play that through the Nasdaq 100 index CFD. However, if the pullback continues, I will monitor for stocks holding up and showing relative strength for my watchlist.
Stay open-minded and manage risk carefully.
Cheers,
Marcus Grant, CFTe
Disclaimer: The content provided in this newsletter is for informational and educational purposes only and should not be considered as financial, investment, or legal advice. The information shared is based on our research and analysis, but we are not a licensed financial advisor, nor can we guarantee its accuracy, completeness, or timeliness. Market conditions and financial instruments can change rapidly, and any opinions expressed may not be suitable for all investors. Any opinions expressed and or securities mentioned do not constitute a recommendation to buy, sell, or hold that or any other security. You should conduct your own due diligence and consult with a licensed financial advisor or other professional before making any investment decisions. Past performance is not indicative of future results, and all investments carry the risk of loss. The authors and publishers of this newsletter are not responsible for any financial decisions made based on the content provided herein. By reading and or subscribing to this newsletter, you acknowledge and agree that you are using the information at your own risk.