


Everything below is as of Friday August 7 close.
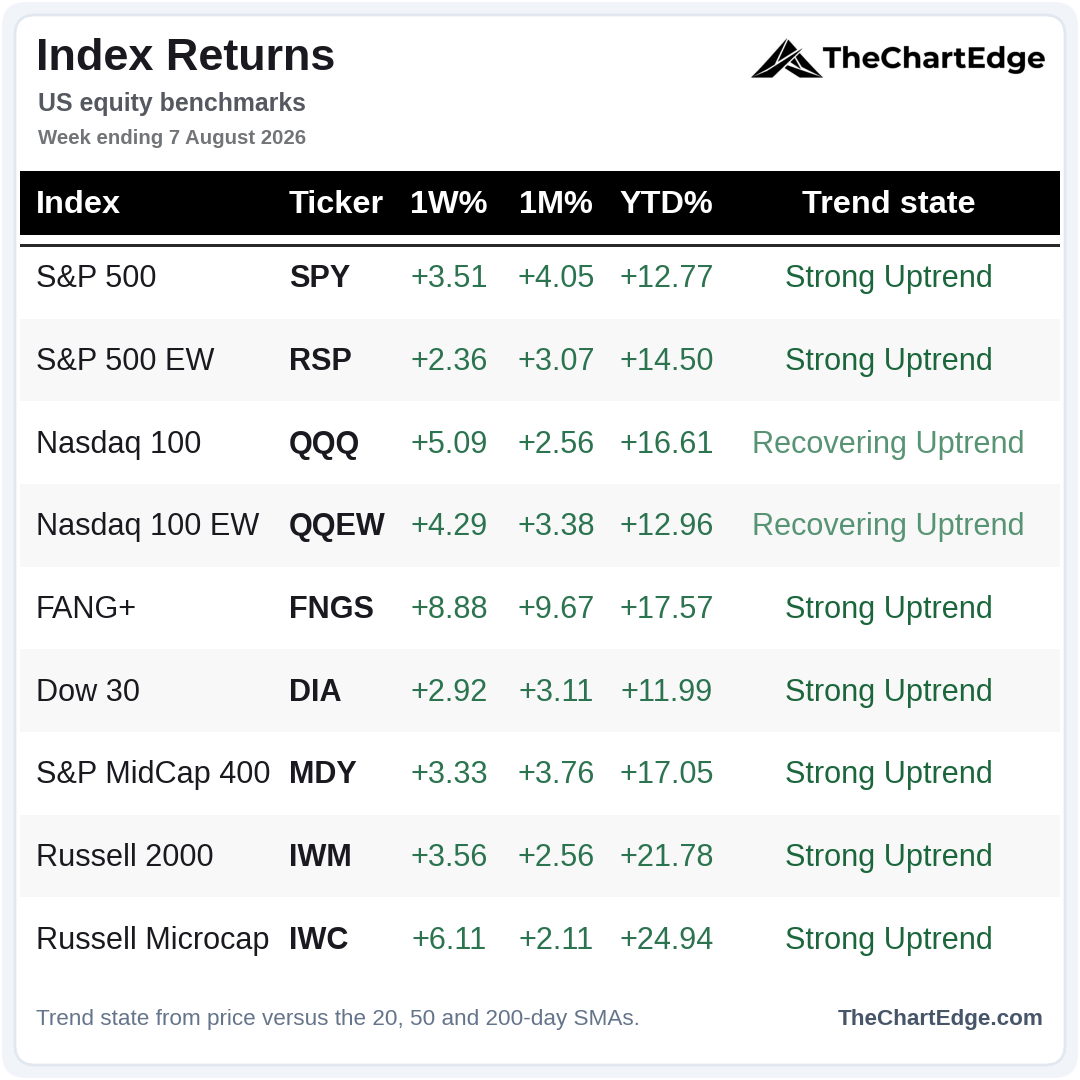
Of the major indices I track, all nine finished the week higher and, other than the Nasdaq 100, made their highest weekly closes ever.
SPY Chart
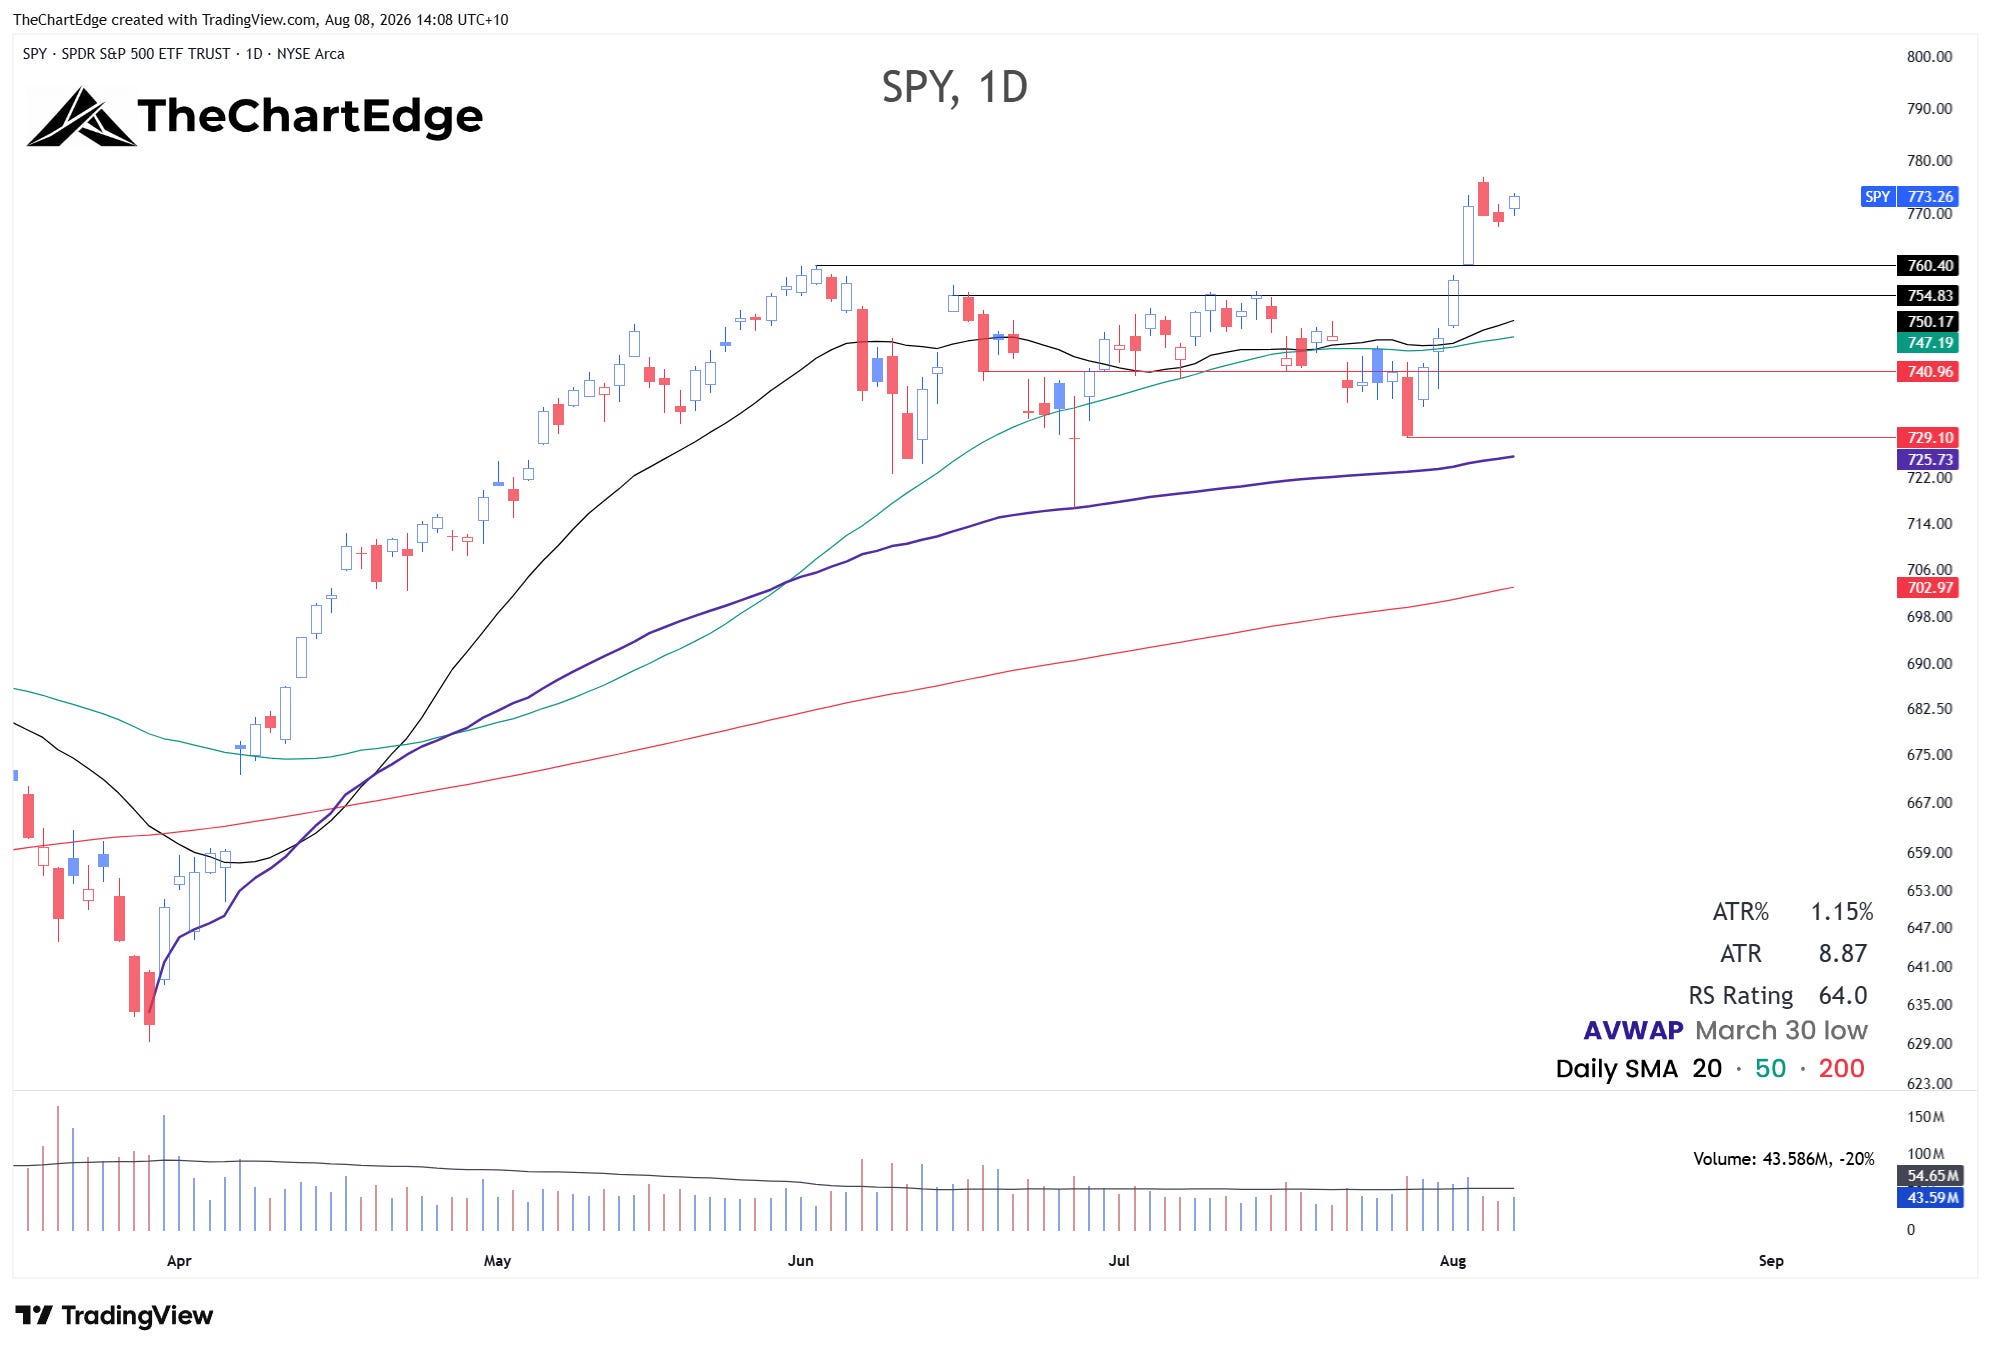
SPY finally resolved its 2-month consolidation, driving higher on Monday and Tuesday. Tuesday’s gap and go took it to new all-time highs. Wednesday’s gap up was sold into, but selling never accelerated and Friday’s close was quite strong. If we get a bigger pullback, the top of the old range around 760 is the first level of potential support, with the 20-day SMA near 750 and rising. I would look to buy strength if we retest 755-760, but it might not be that easy.
QQQ Chart
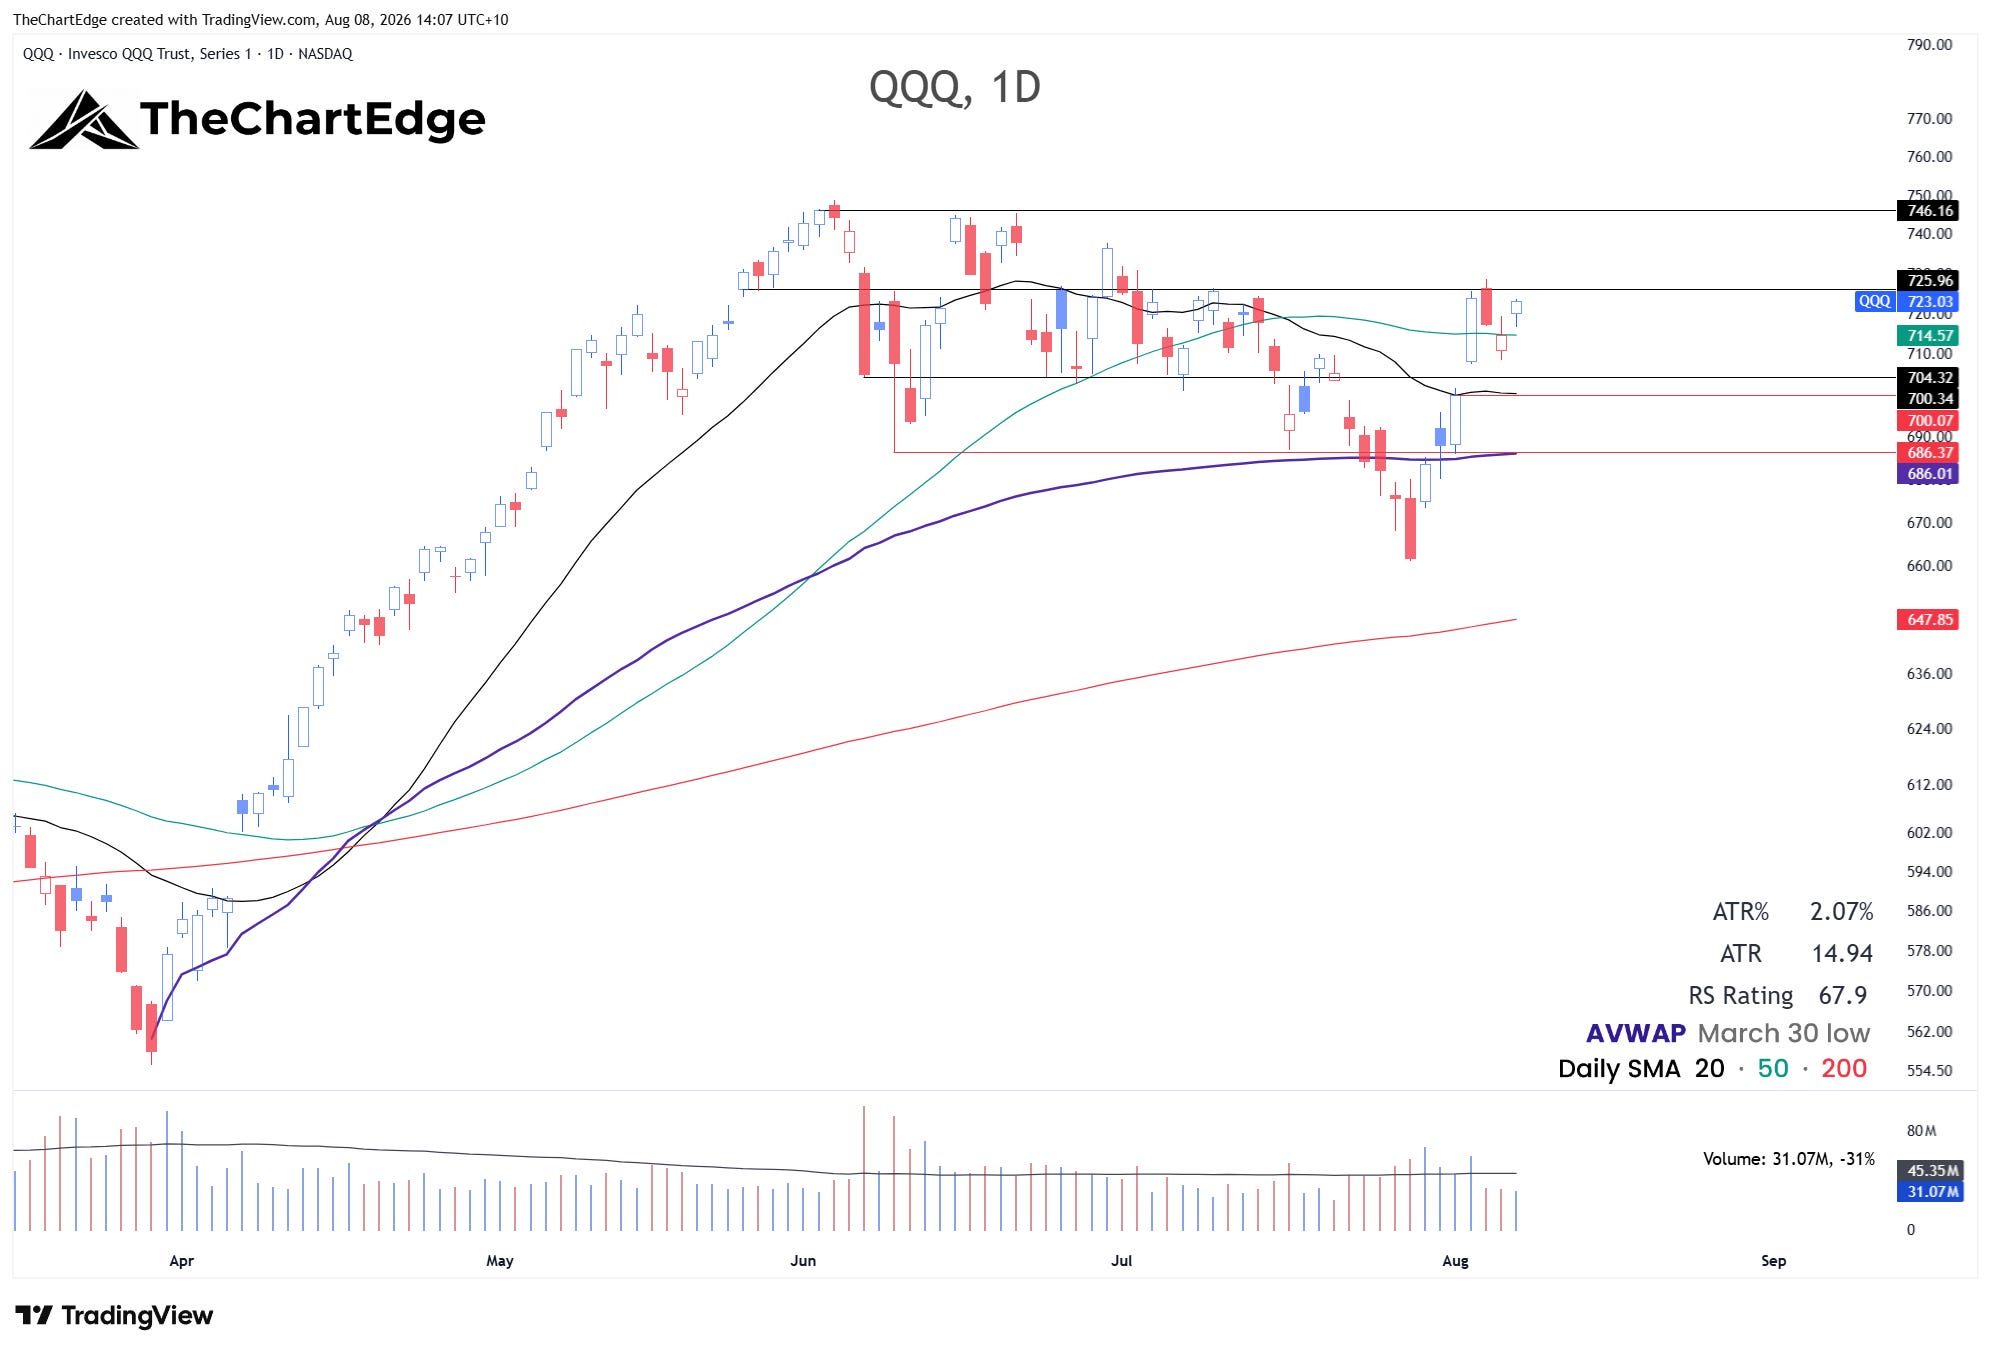
QQQ rose 5.1% and is back above its 20 and 50-day SMAs - although they are not yet bullishly aligned. Last weekend I said I’d be watching whether it could push higher early in the week and set a higher low above 685 on any pullbacks. Tuesday’s move was explosive and the pullback on Wednesday and Thursday didn’t even take out Tuesday’s low, let alone fill the gap from Monday’s close around 700. I’d like to see that level hold, with 686 as the last line in the sand. If it can clear 726, it could make a run at the June high around 746.
Market Temperature
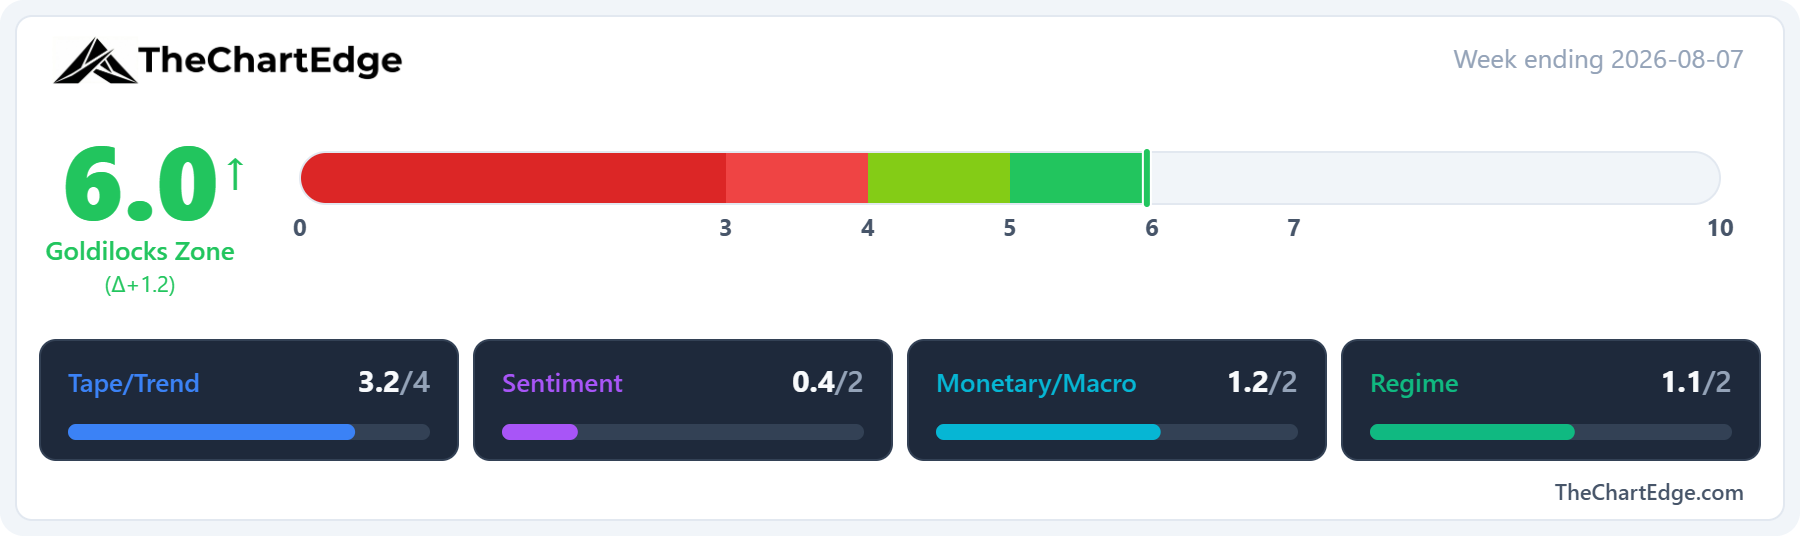
The Market Temperature jumped to 6.0, up from 4.8, out of Cautious, where it has been for three weeks, and back into the Goldilocks Zone. If you’re wondering why 6.0 isn’t classified as Strong, it’s because the reading to two decimal places was 5.96.
The Tape/Trend pillar drove most of the gain. QQQ improved from Neutral to a Recovering Uptrend, the SPY weekly RSI rose to 67.1 from 60.8, and breadth expanded - 61.4% of US stocks are back above their 50-day moving average, from 51.7%, and 61.3% above their 200-day, from 56.1%.
The Regime pillar also improved. High beta vs low volatility flipped back to risk-on, and the discretionary vs staples ratio continued higher. Growth vs value still scores in value’s favour.
The Monetary/Macro pillar firmed as well. The MOVE index fell around 13% on the week to 72, and the dollar eased.
The VIX fell to 14.9, from 16.0, which the model reads as a contrarian negative, so Sentiment was the only pillar to fall.
GICS Sector Relative Strength
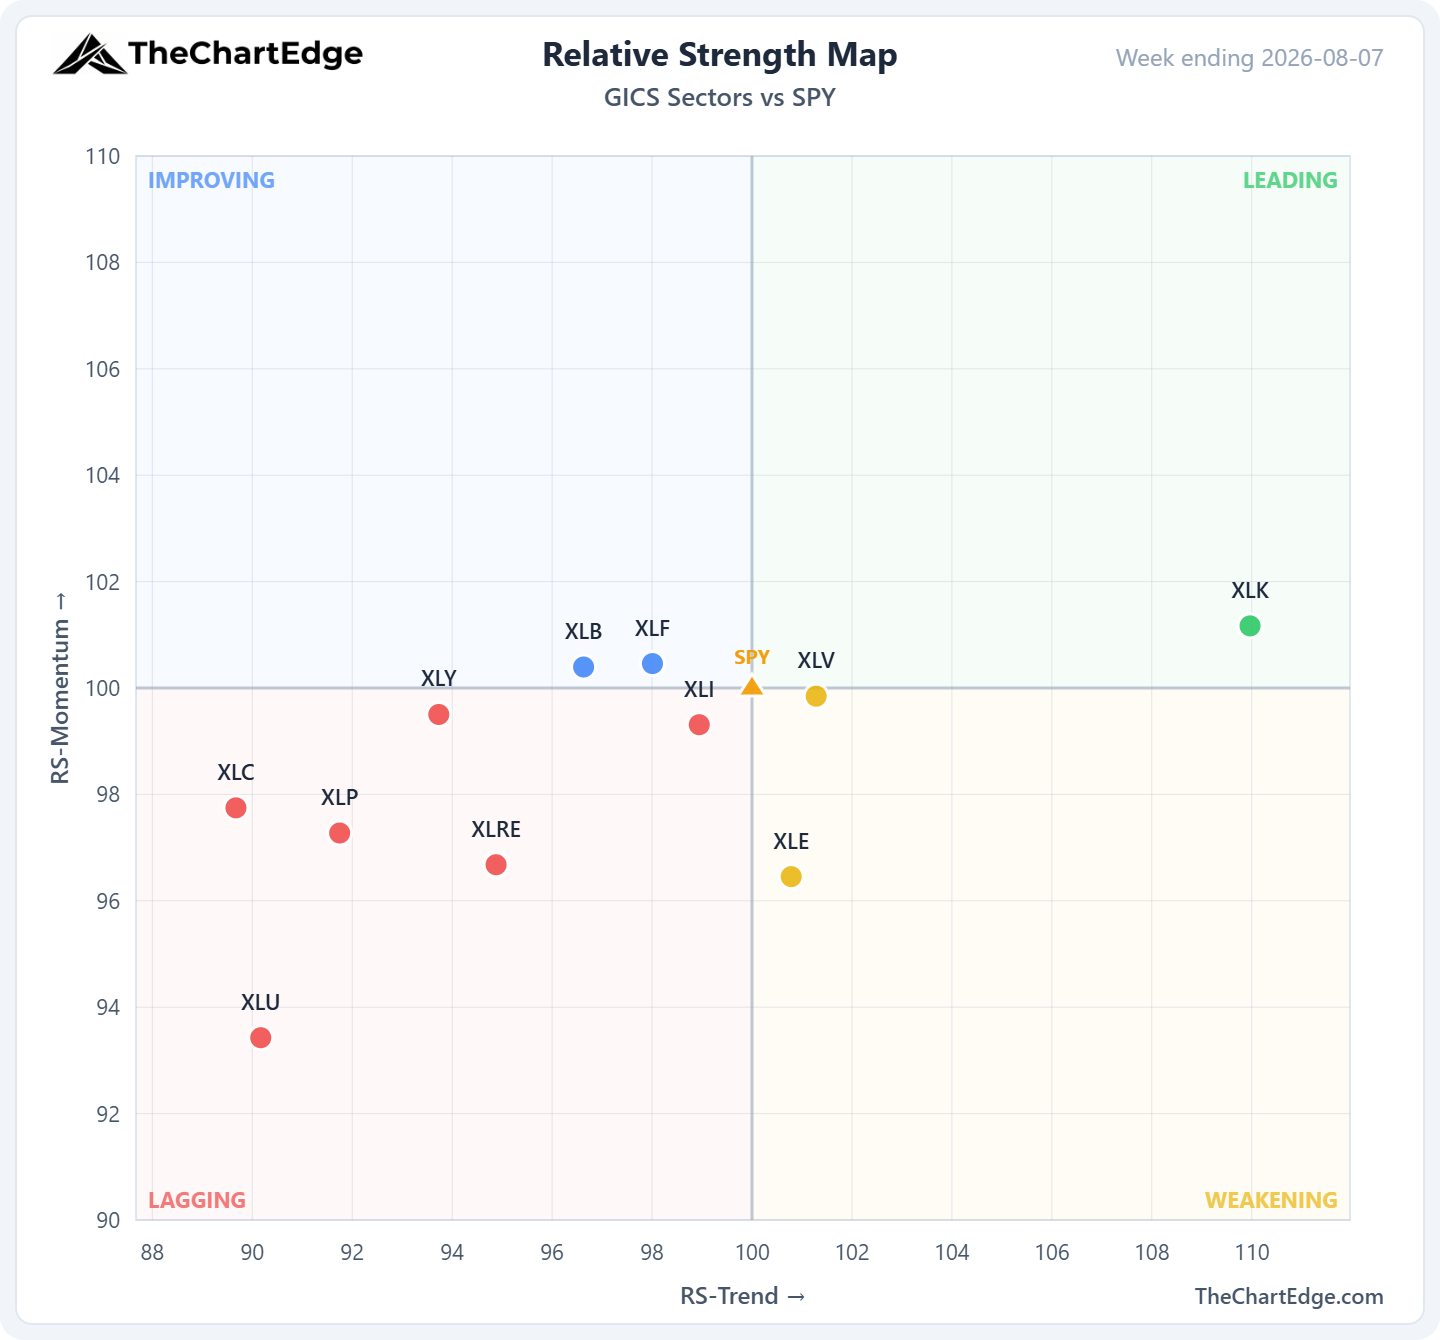
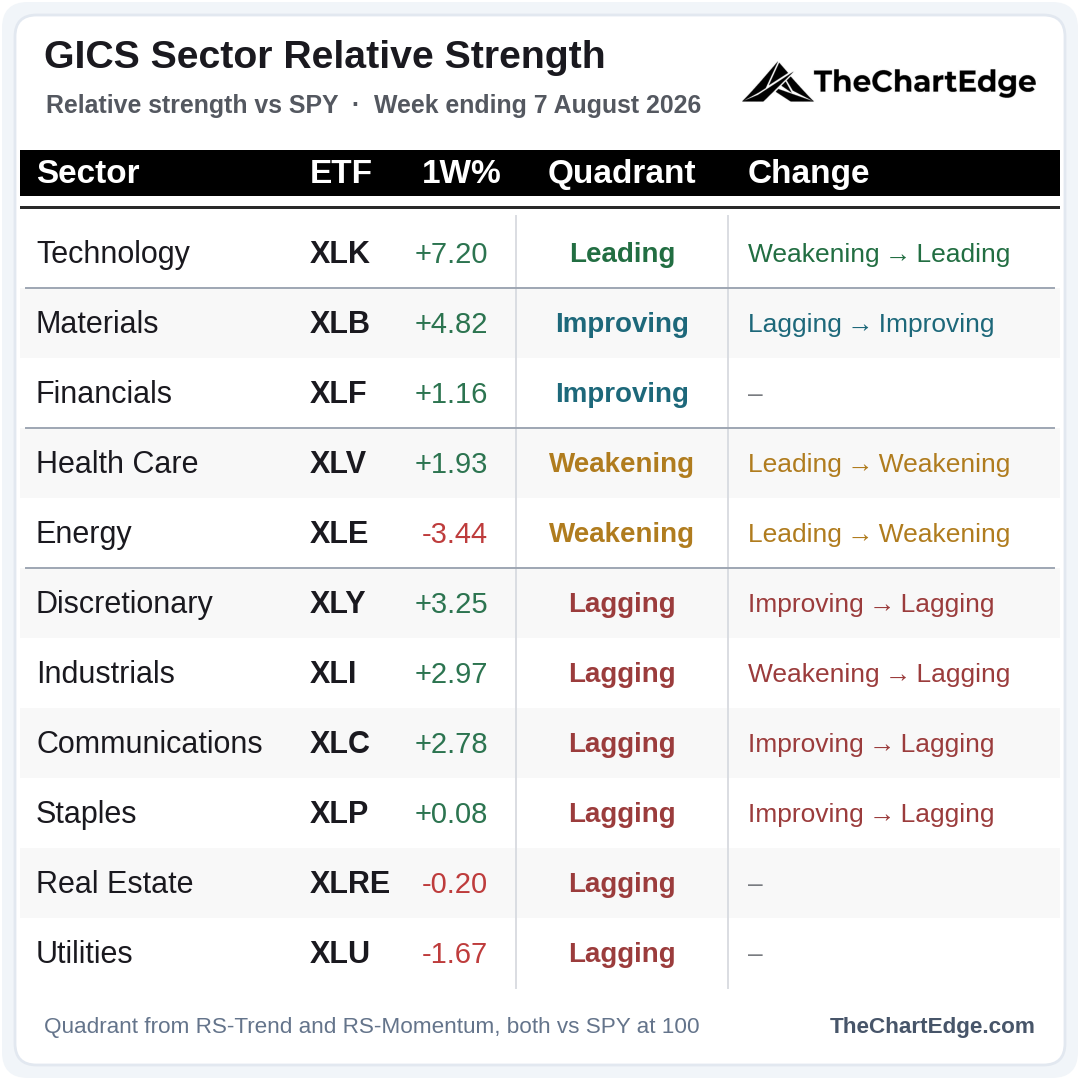
Technology moved back into Leading after a big 7.2% week, and it’s the only sector there - for the second time in a month. Materials crossed into Improving, joining financials.
Health care and energy both dropped out of Leading into Weakening. Energy was down 3.4% and, along with utilities and real estate, was one of the three sectors to finish lower on the week.
Discretionary, industrials, communications and staples all slipped into Lagging despite all four finishing the week higher. Apart from staples they all had good weeks - they just lost ground relative to a very strong SPY.
A lot of the sectors are bunched right around the boundary lines this week. Six of the eleven sit within a point of a line, so I wouldn't read too much into any single quadrant change.
Momentum Leaderboard
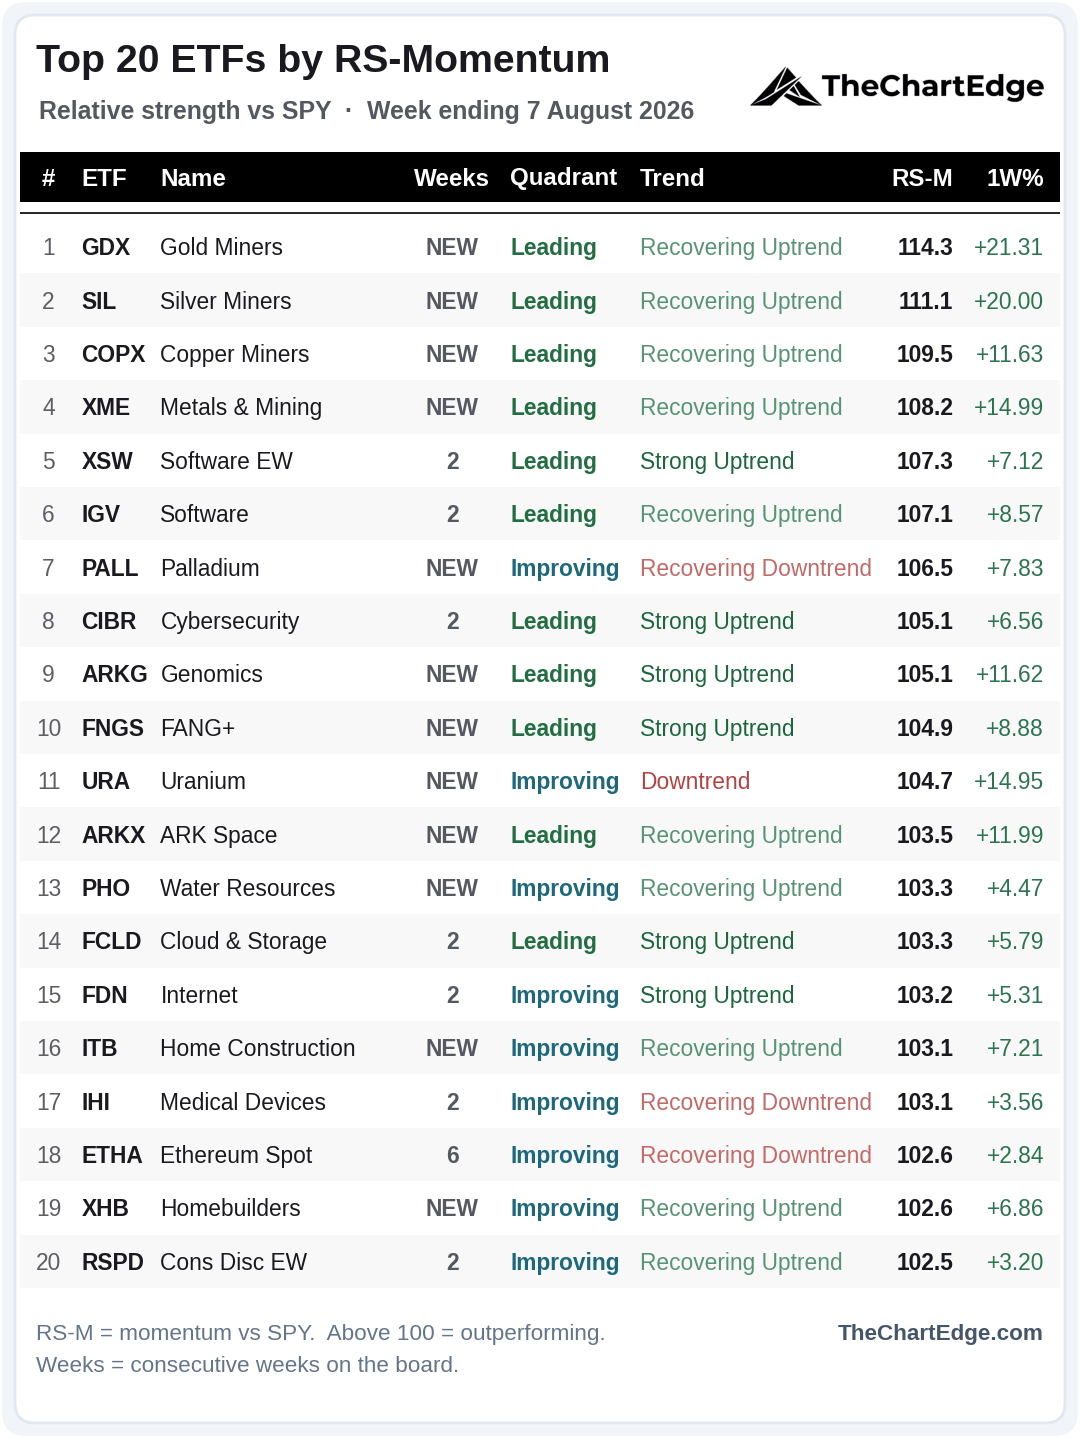
Twelve of the twenty are new again this weekend. Gold Miners (GDX) tops the board after sitting in a Strong Downtrend just a week ago, with Silver Miners (SIL), Copper Miners (COPX) and Metals & Mining (XME) rounding out the top four. Palladium (PALL) and Uranium (URA) also arrived, as did the homebuilders (ITB & XHB).
All five international names dropped off - China Internet (KWEB), China Large-Cap (FXI), Hong Kong (EWH), Germany (EWG) and India (INDA) - along with the financials (XLF, RSPF & KCE) and Anti-Beta (BTAL).
Genomics (ARKG) returned after two weekends off.
Ethereum (ETHA) now has the longest streak on the board, at six straight weeks.
Trend States Across the Universe
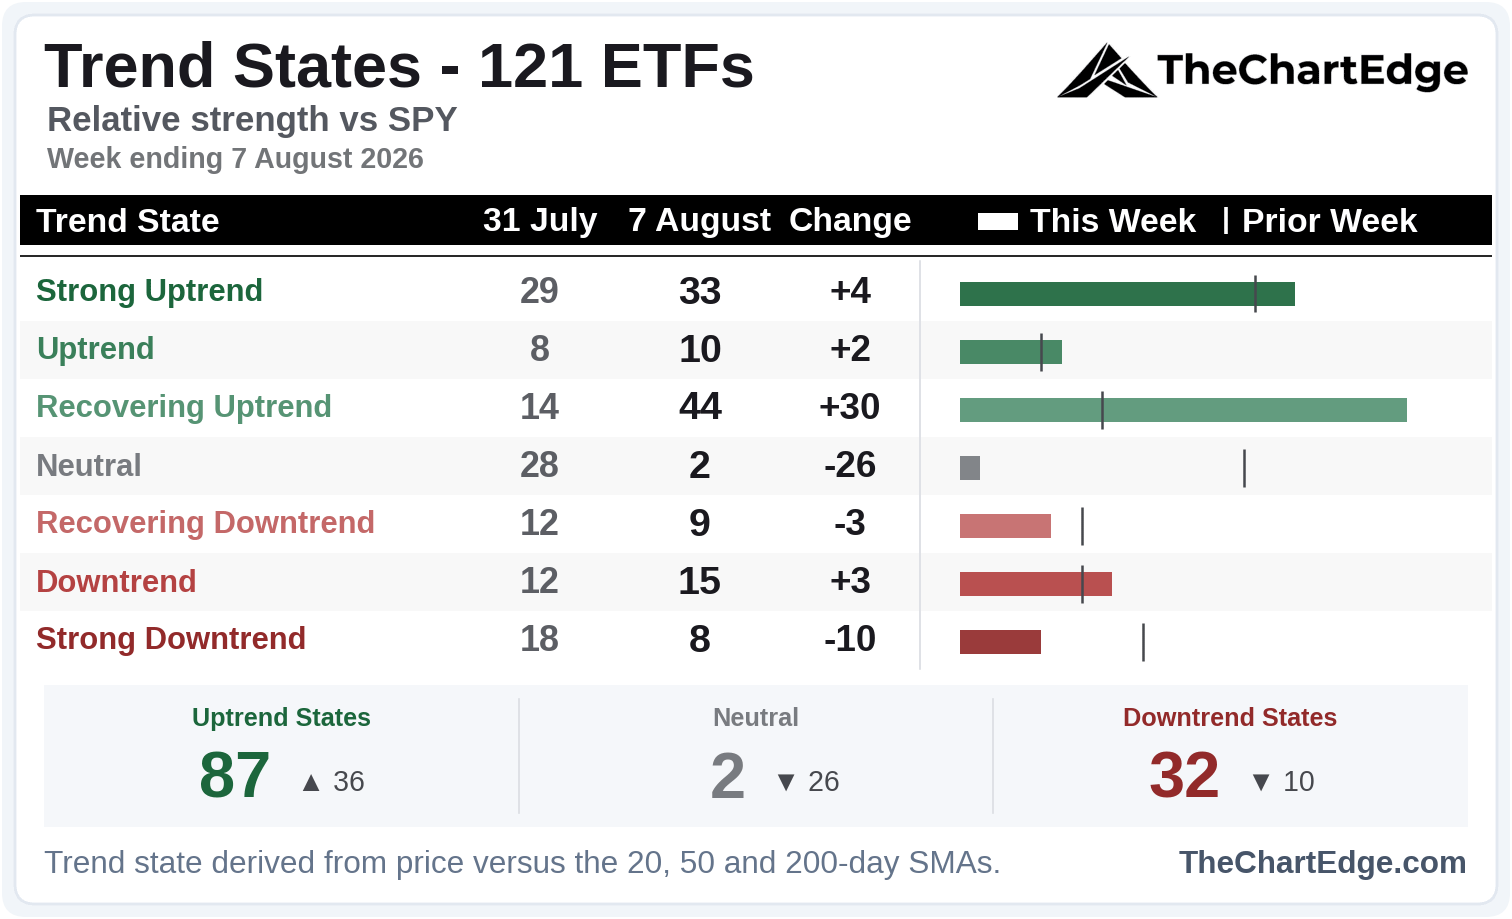
Quite the jump on this board. Neutral collapsed from 28 names to just 2. The biggest jump was in Recovering Uptrends - price back above at least the 20 and 200-day moving averages, but the averages themselves not yet in bullish alignment.
87 of the 121 ETFs are now in one of the three uptrend states, up from 51 - both the level and the one-week change are the largest in the five weeks I’ve been publishing it.
Industry Breadth
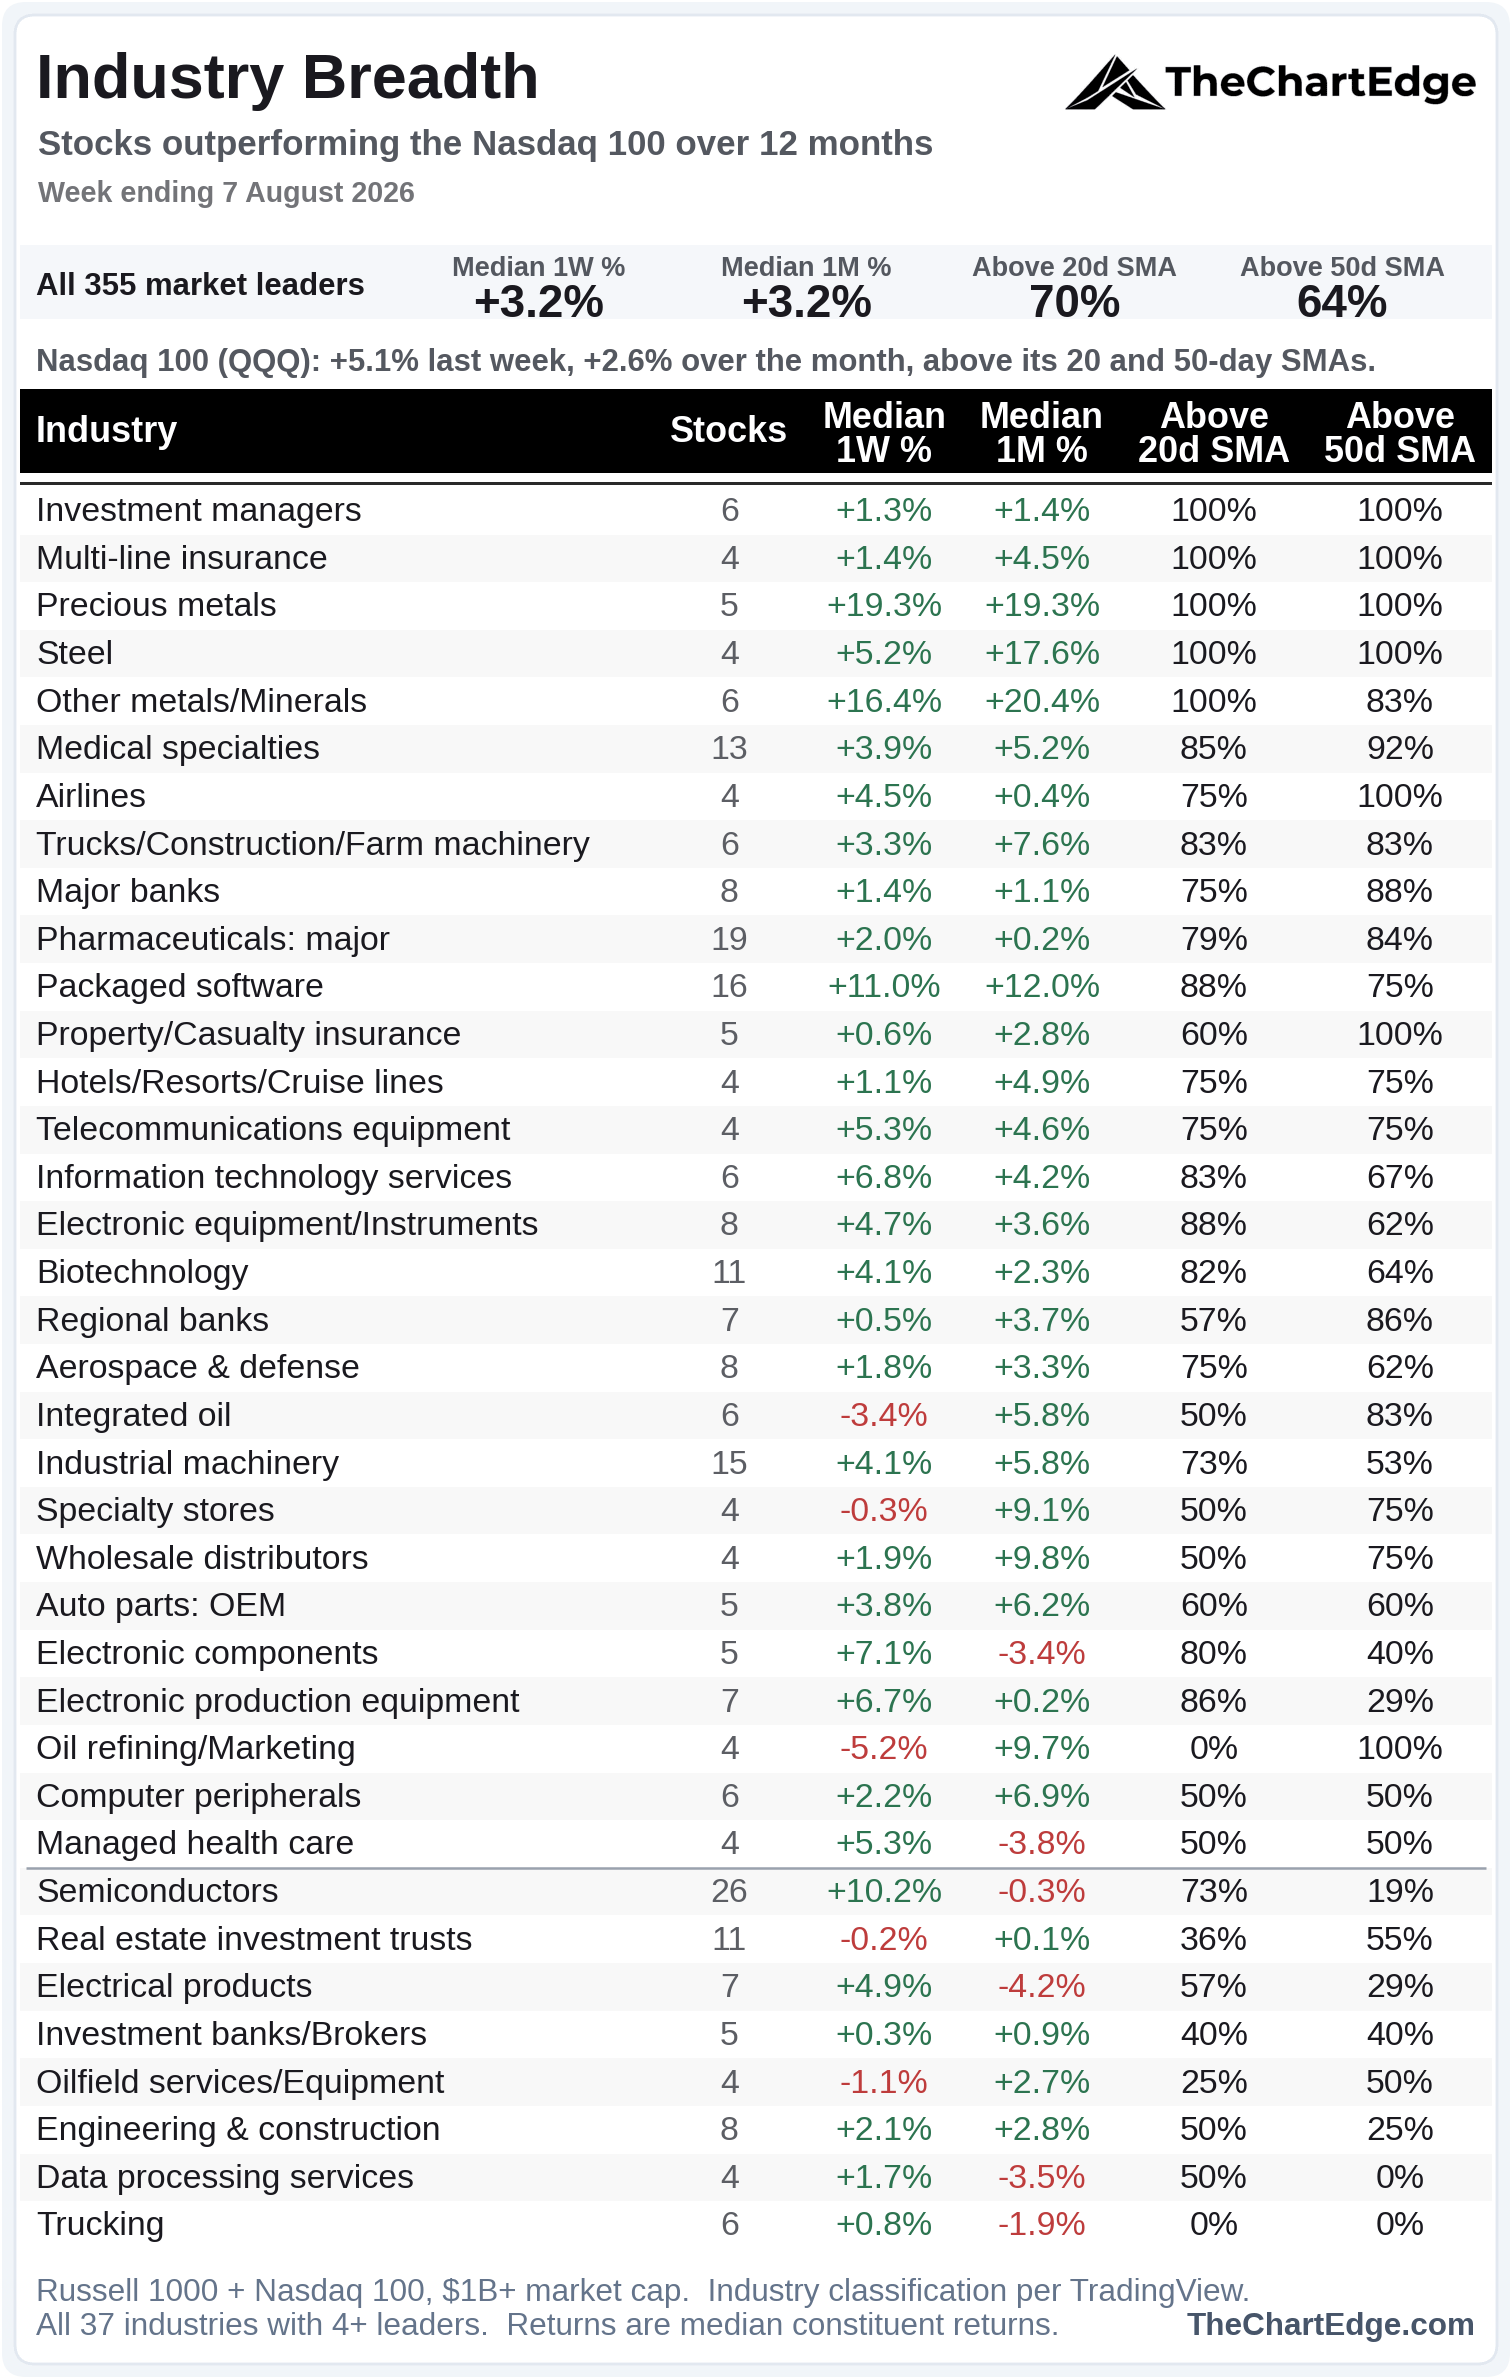
The turnaround shows here too. 336 of the 355 names on the board were also there last weekend - what changed is how many are back above their moving averages. On those same names, the percentage above their 20-day SMA went from 49% to 69% in a week.
Last weekend semiconductors sat third last on the board, with 8% of names above their 20-day SMA and none above their 50-day. This weekend 73% are back above the 20-day, though only 19% are above the 50-day. Seven of the nine technology industries were below the line last weekend. Now only semis and data processing services are.
Precious metals and steel have every name above both SMAs, alongside investment managers and multi-line insurance.
The Semi and AI Names Still Not Confirming
Semi and AI names generally had a big bounce last week, but many are yet to reclaim their 50-day SMA. Also, the three earnings I said I’d be watching - AMD, Western Digital (WDC) and SanDisk (SNDK) - all beat, but AMD was down just over 4% after reporting, while WDC fell over 16% and SNDK just over 10% - poor reactions from some prior leaders in the strongest tape week in months.
SMH Chart
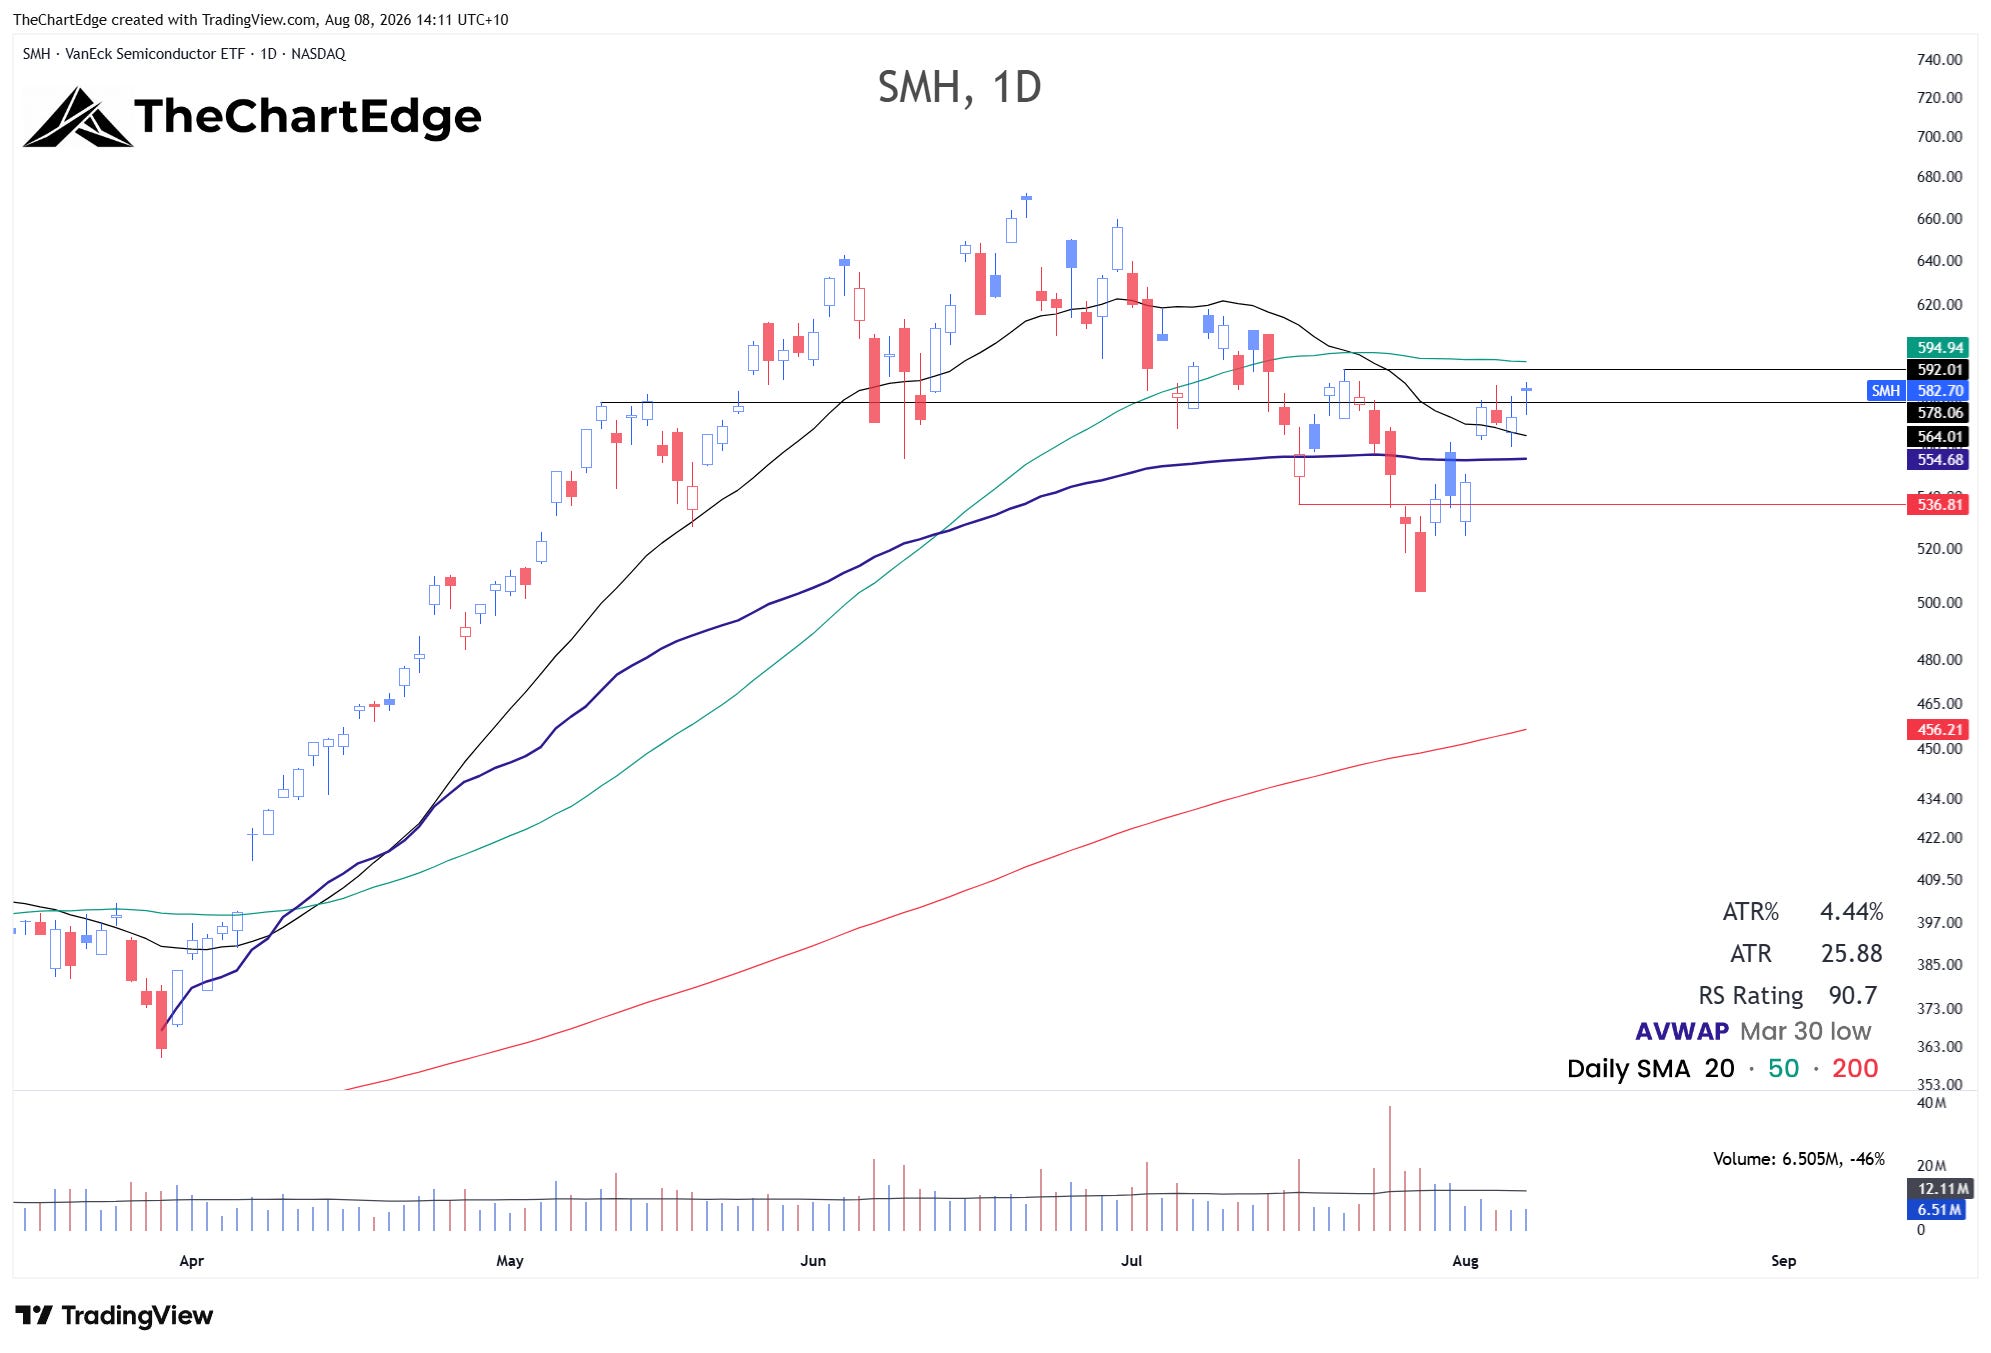
Two weekends ago, I was watching 536 and 592 on SMH. The 536 level broke during the late-July selloff, but last week’s 7.8% rally took it back above its 20-day SMA and AVWAP from the March 30 low, closing at 582.70. However, it still sits about 2% below its declining 50-day. Further strength and a reclaim of this level would be a positive for the bulls. But I remain open-minded to the possibility of another leg down.
XSD Chart
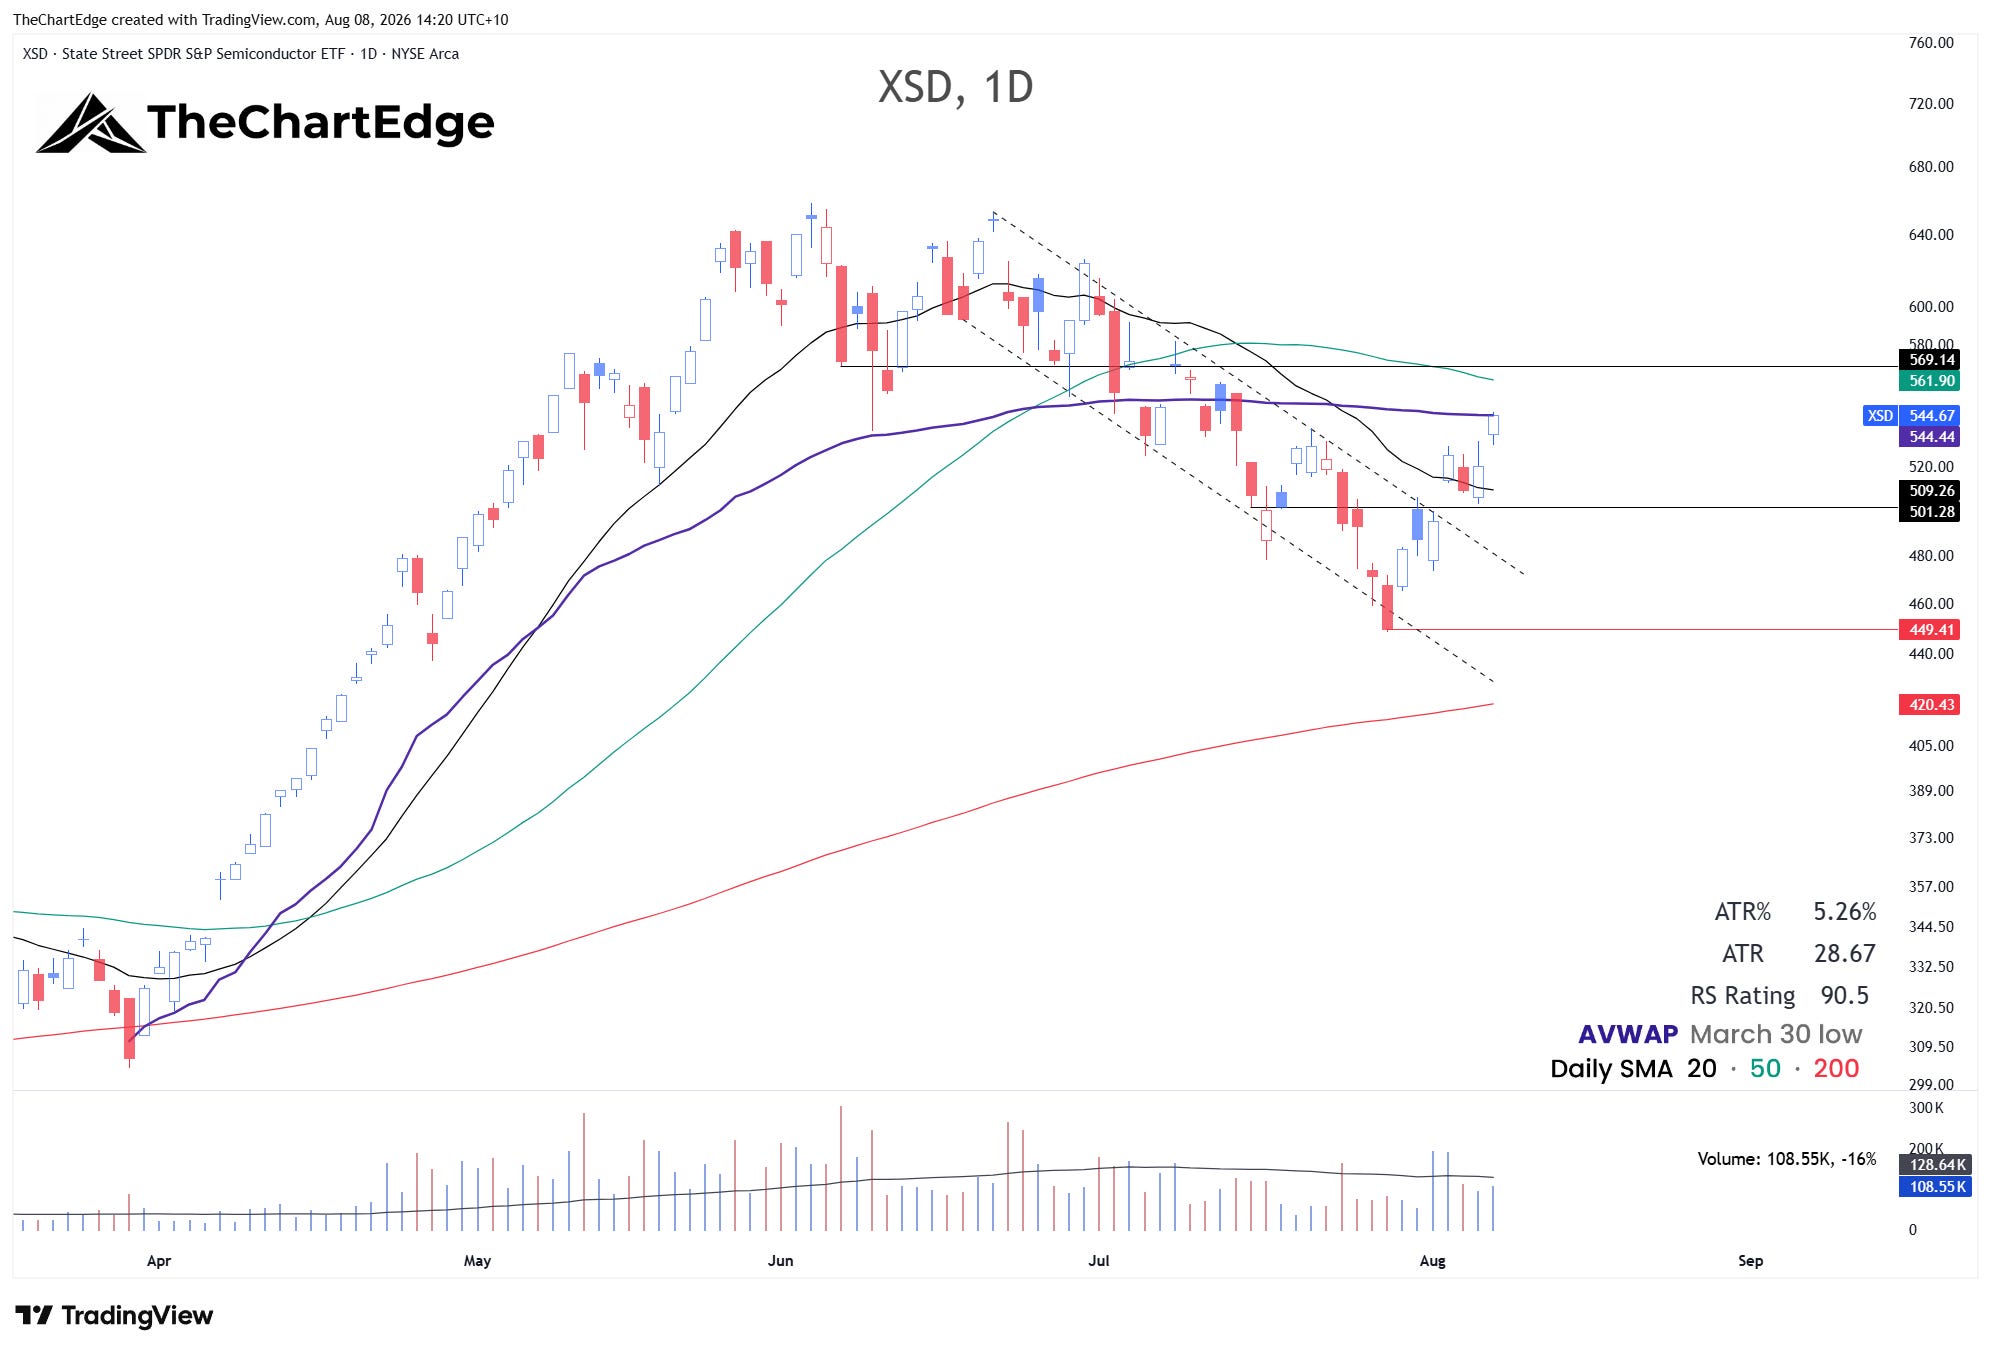
Equal-weight semis (XSD) rose 11.7% and broke out of the descending channel it had been in since late June. It closed right at its AVWAP from the March 30 low, below its declining 50-day SMA.
Other Tech Breaking Out to ATHs
CIBR Chart
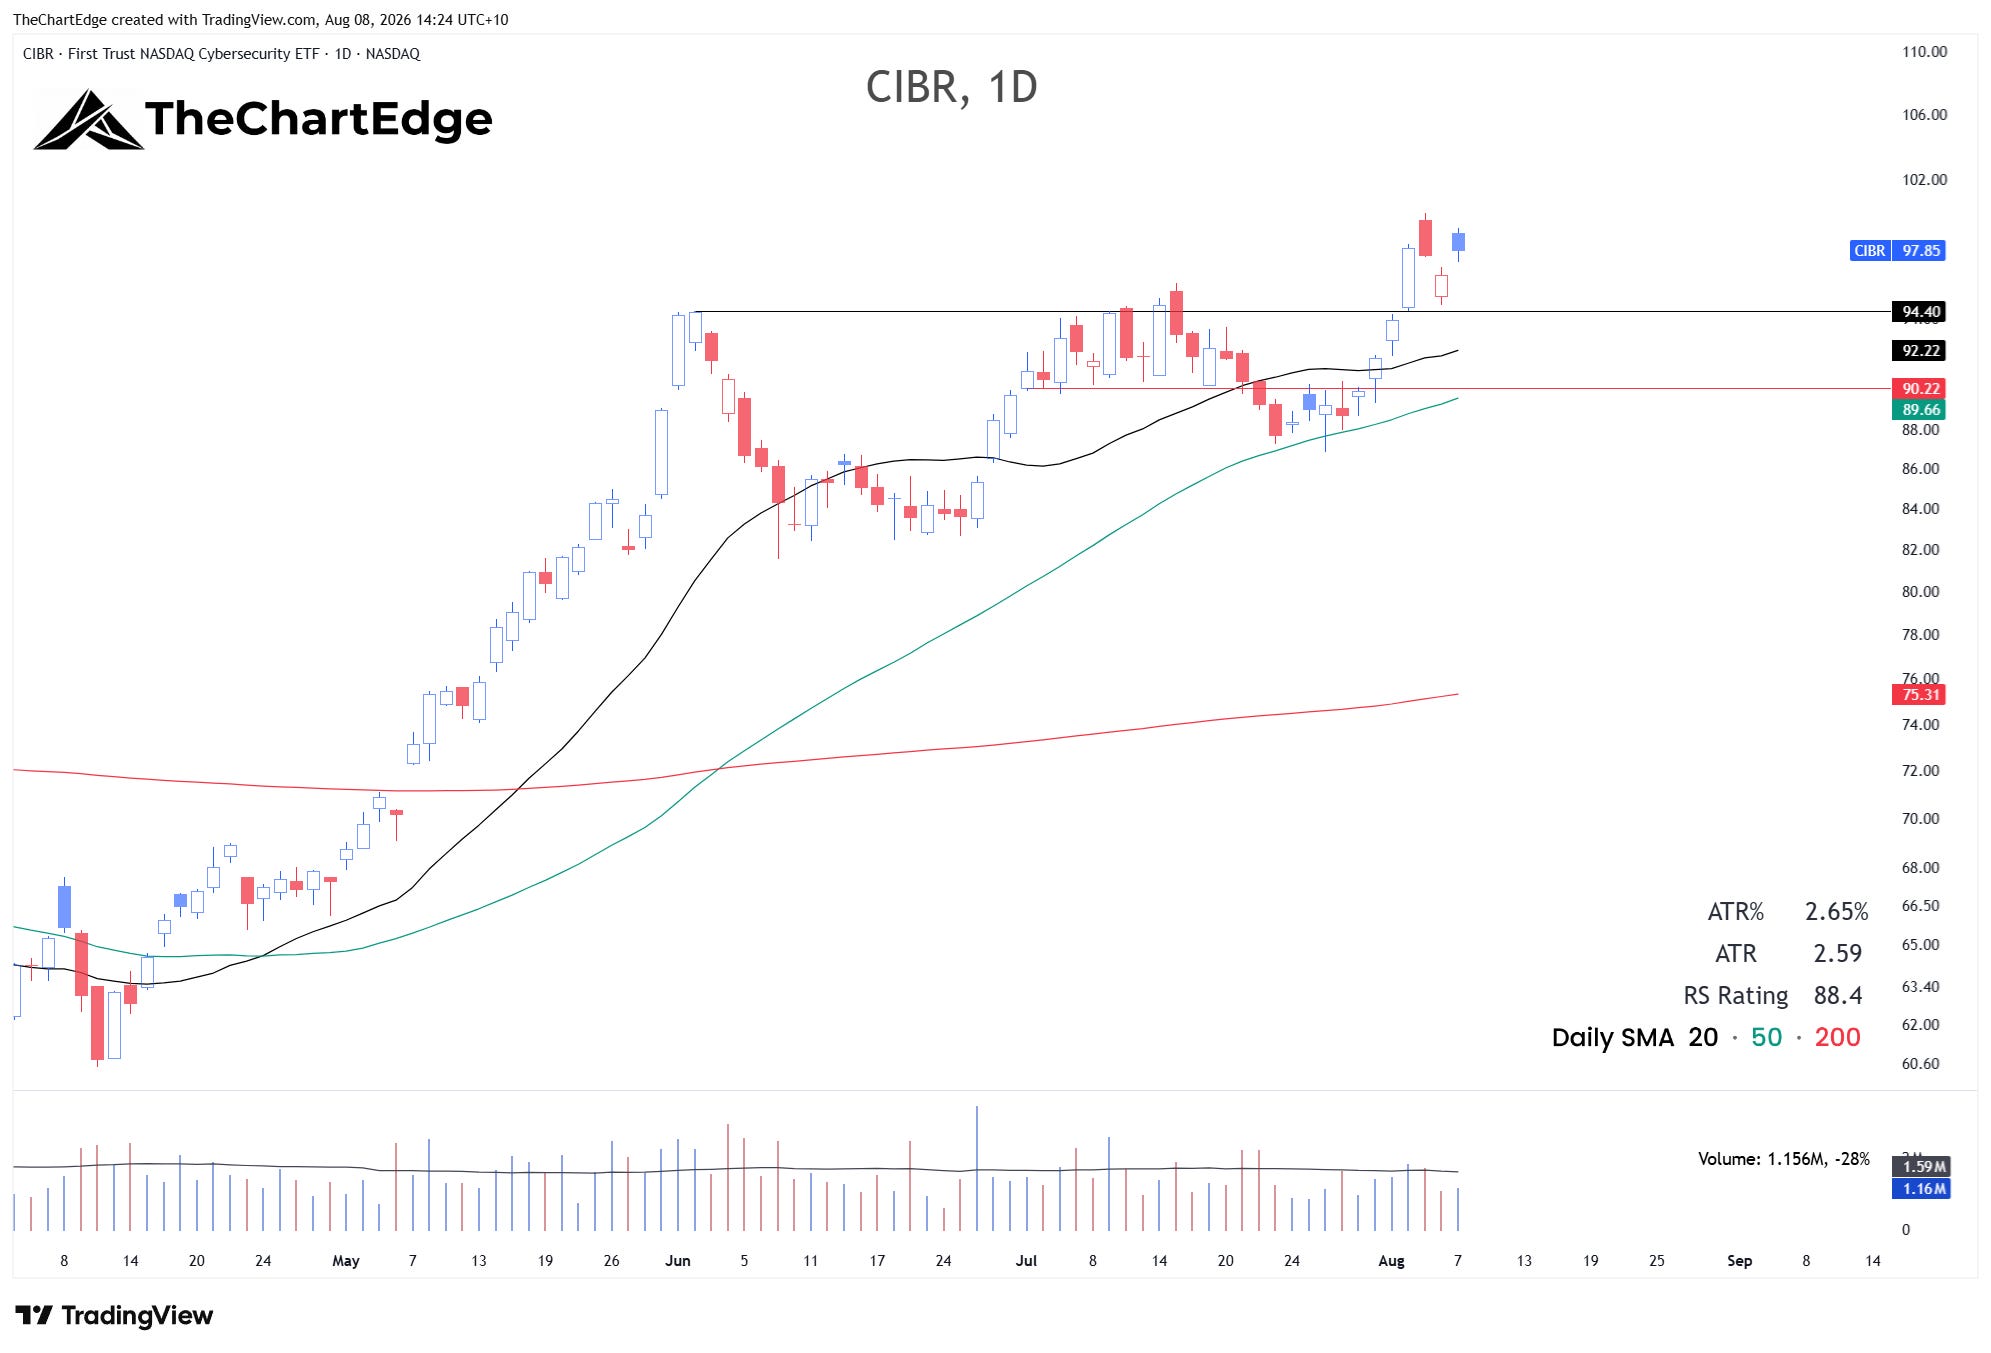
Cybersecurity (CIBR) broke out of its two-month range, up 6.6% on the week and in a Strong Uptrend.
QQQJ Chart
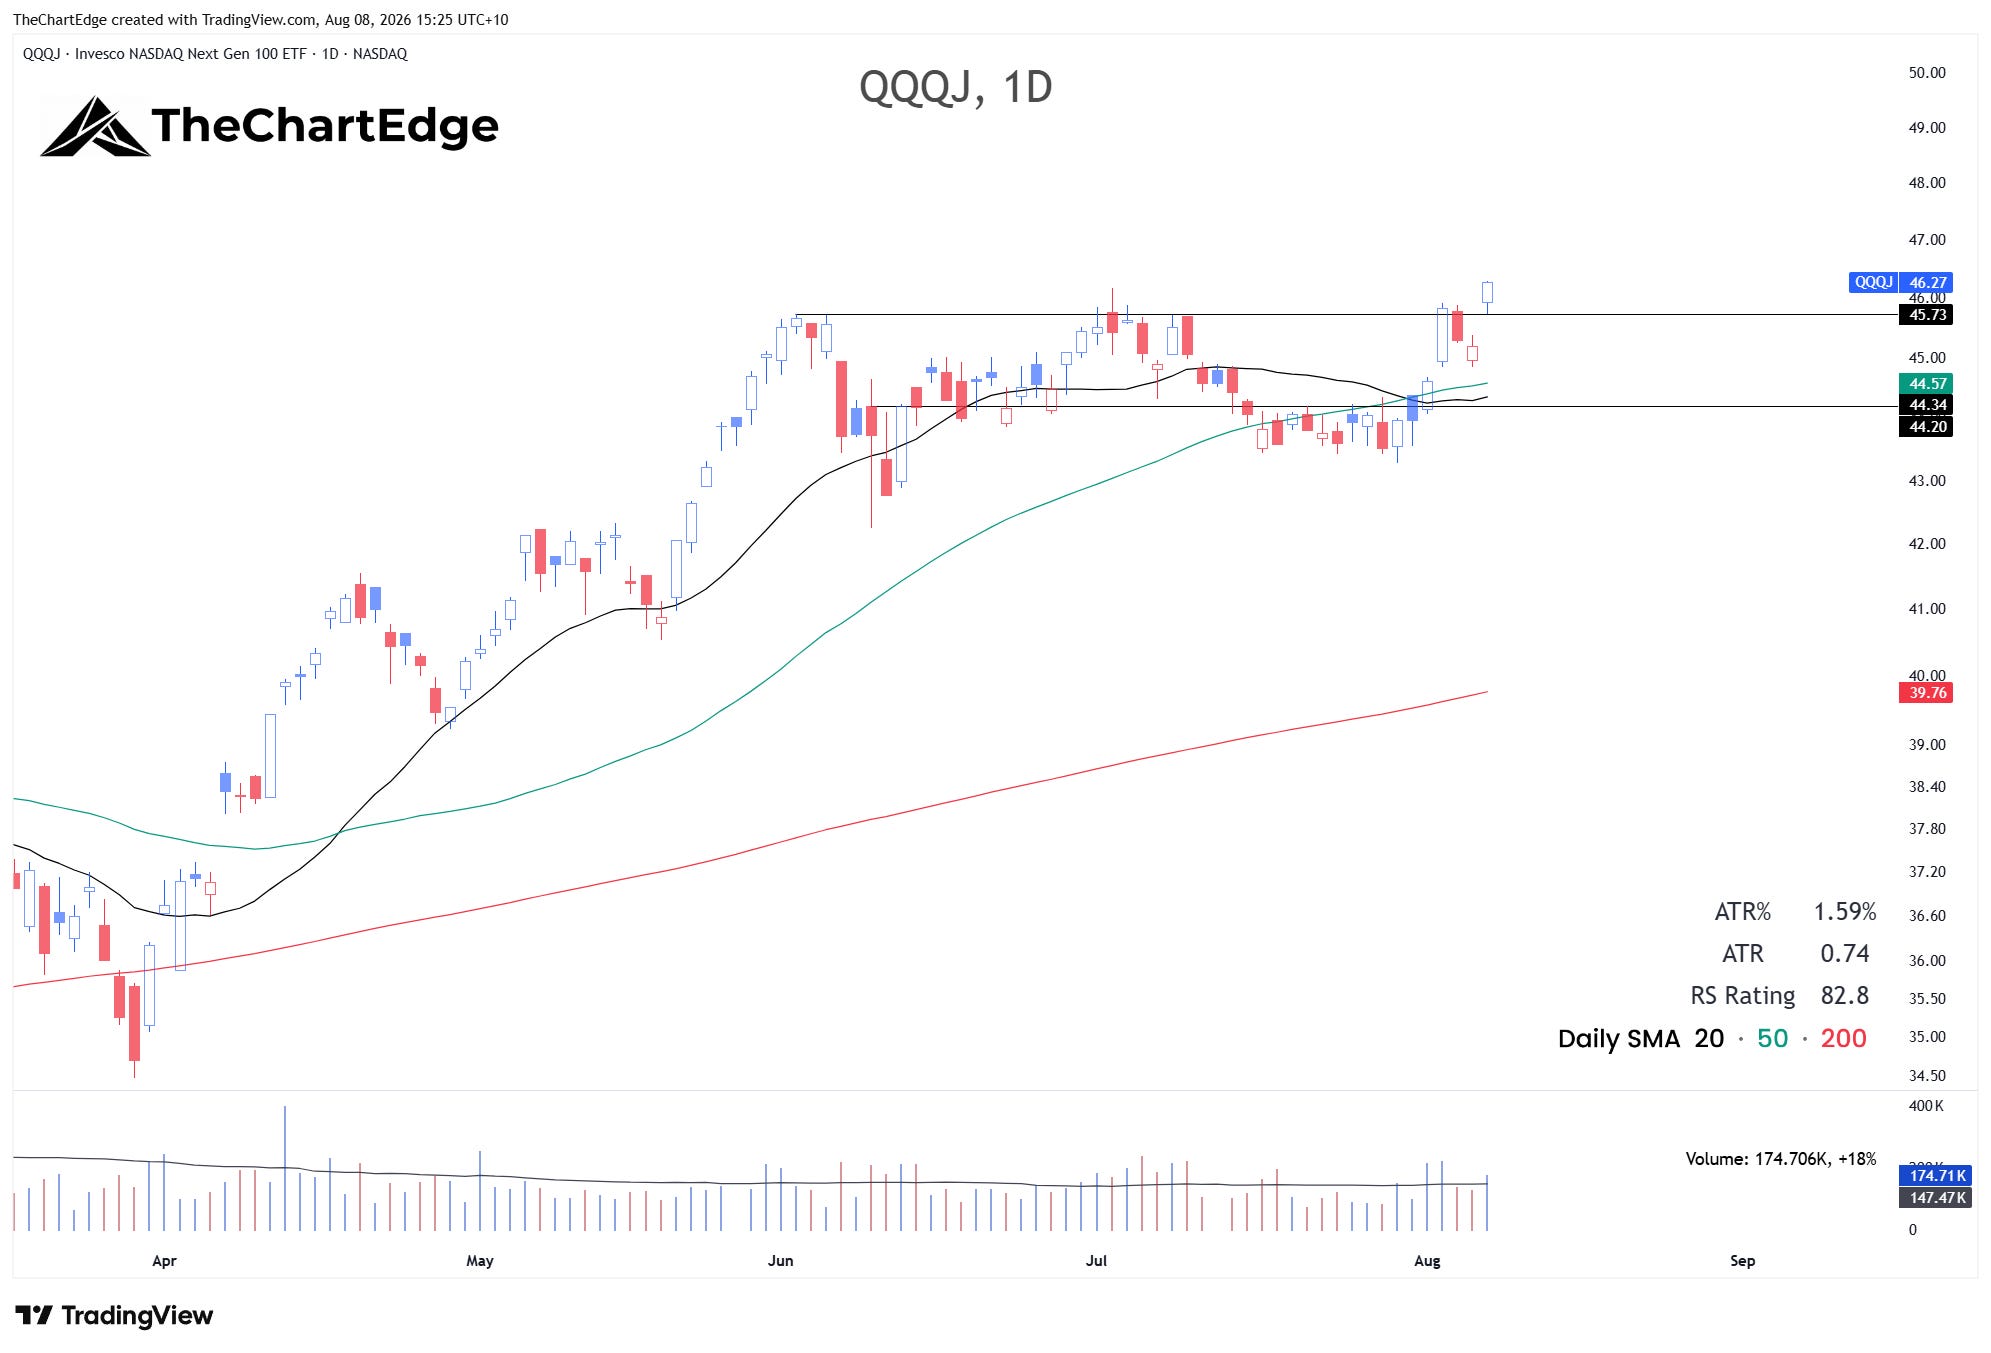
The Nasdaq Next Gen 100 (QQQJ) - the hundred names next in line for the Nasdaq 100 - also broke out of its two-month range.
Biotech Showing Strength Again
Large-cap biotech (IBB) made a closing weekly all-time high, and the ARK Genomics Fund (ARKG) is back on the momentum board at number nine. Equal-weight biotech (XBI) also looks good.
XBI Chart
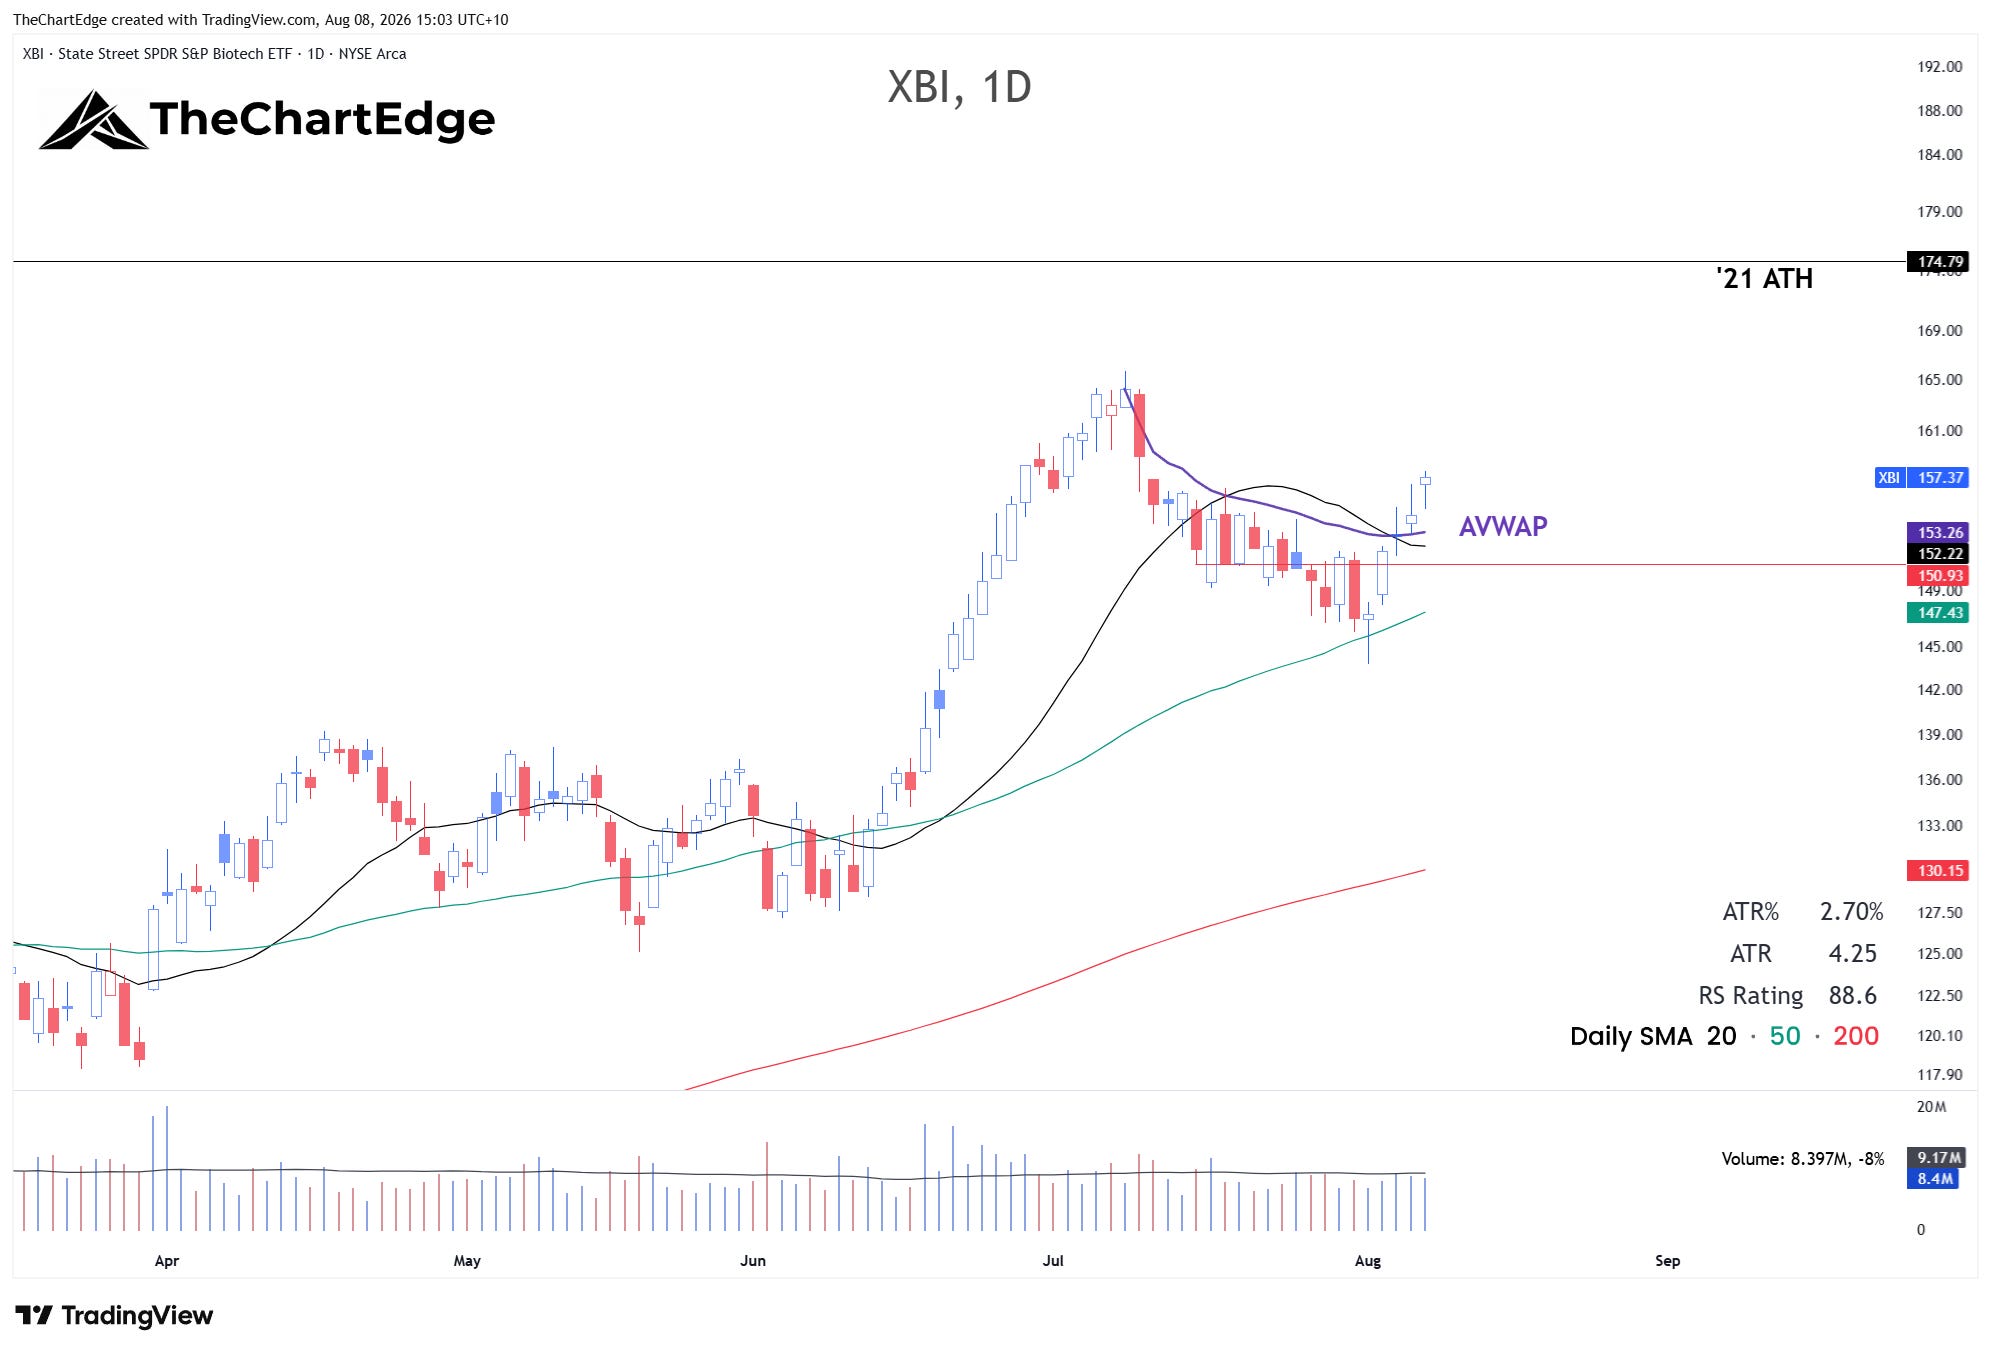
XBI bounced after testing the 50-day SMA on Monday - up 7.1% for the week, and back above its 20-day SMA and the AVWAP from the July high. I am going to try and get back into this - ideally closer to the AVWAP which currently sits a touch over 153, with a stop-loss just under 150 and an initial target around 174, which is its 2021 all-time high.
Gold, Silver and the Miners
The metals were the story of the week. Gold (GLD) rose 7.3% and silver (SLV) 9.8%, but the miners ripped - GDX up 21.3% and SIL up 20.0%, the two biggest weekly gains of any ETF I track. Noticeably, both miner ETFs reclaimed their 200-day SMAs last week - the metals themselves haven’t yet.
Spot Gold Chart
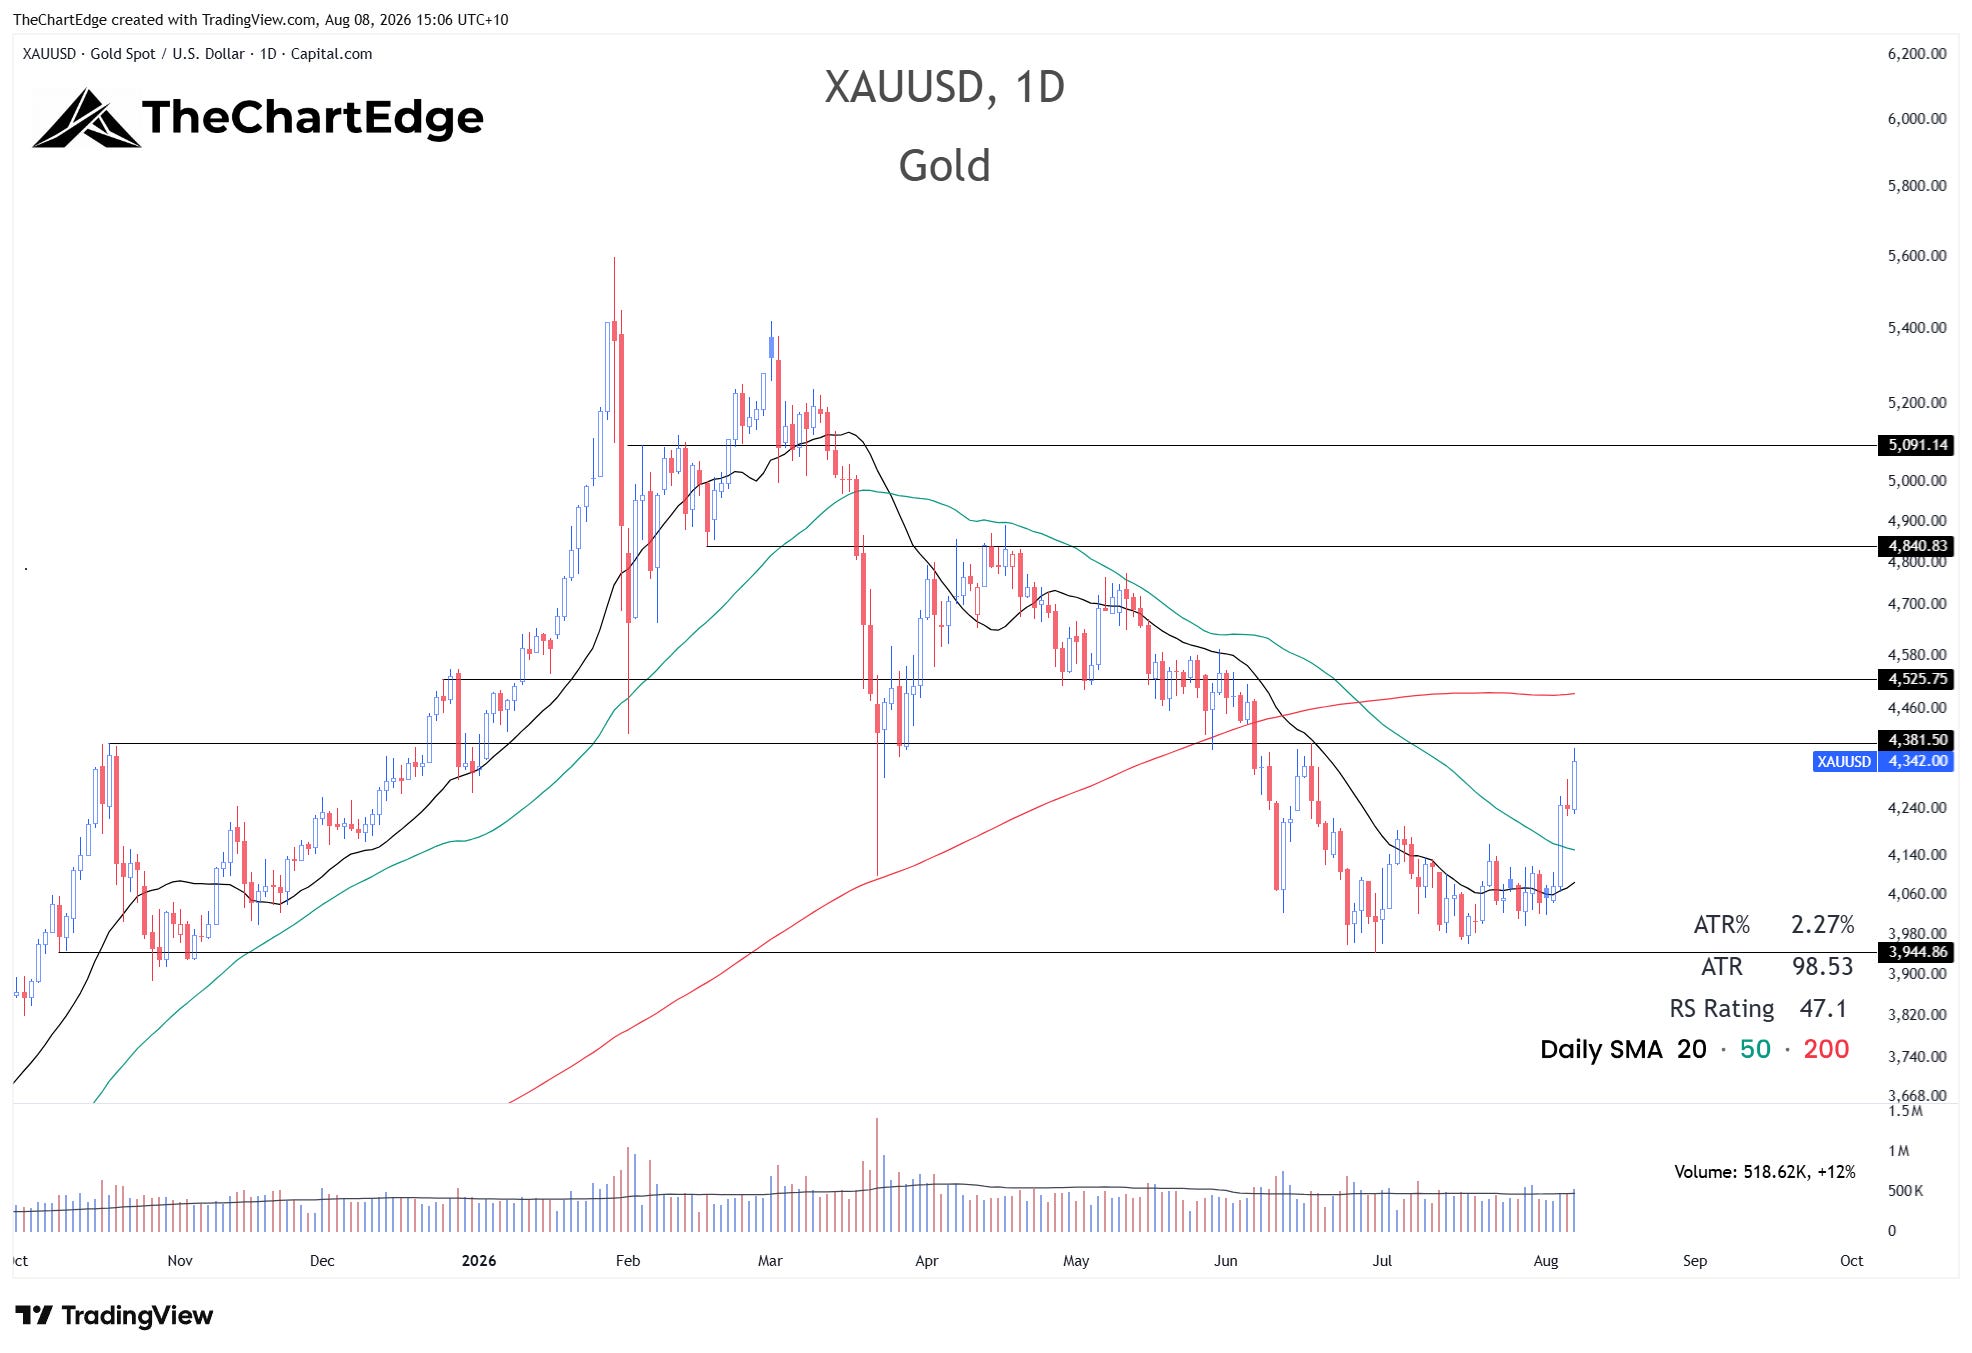
Spot gold closed just under 4380 - which was the October 2025 high. If it clears that it could make a run for the 200-day SMA which sits around 4500.
Spot Silver Chart
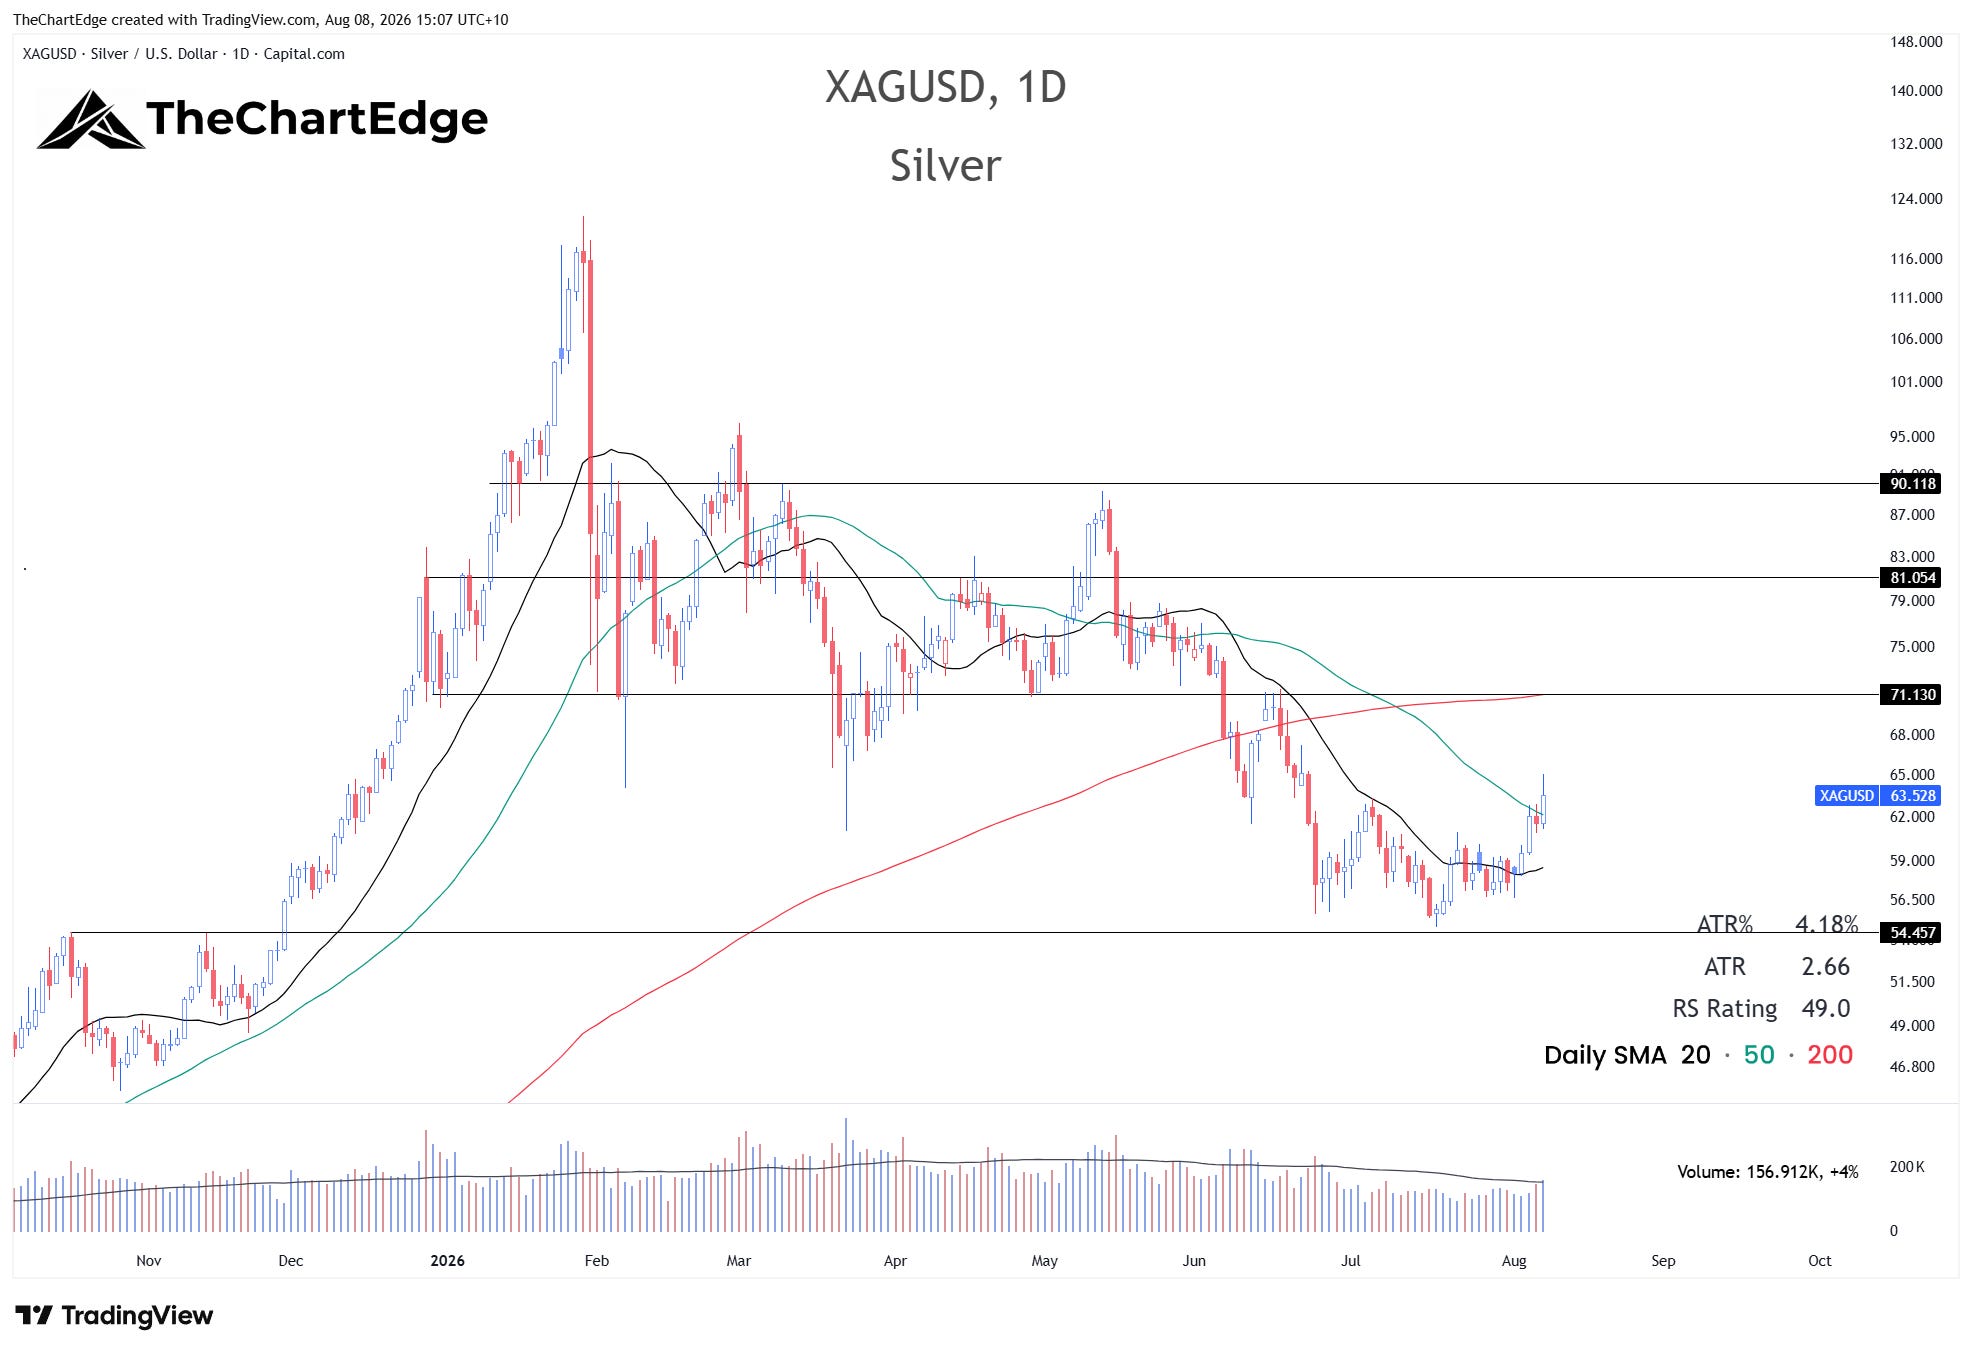
Spot silver also looks like it could make a run towards its 200-day SMA, which currently sits around 71.
Ethereum and Crypto
Ethereum (ETHA) and crypto haven’t participated in 2026, however Ethereum has been carving out higher lows since the late June bottom and is back above its 20 and 50-day SMAs. It has also outperformed Bitcoin during this timeframe. I generally don’t trade anything below a declining 200-day SMA. However, I am willing to make an exception for crypto.
Ethereum Chart
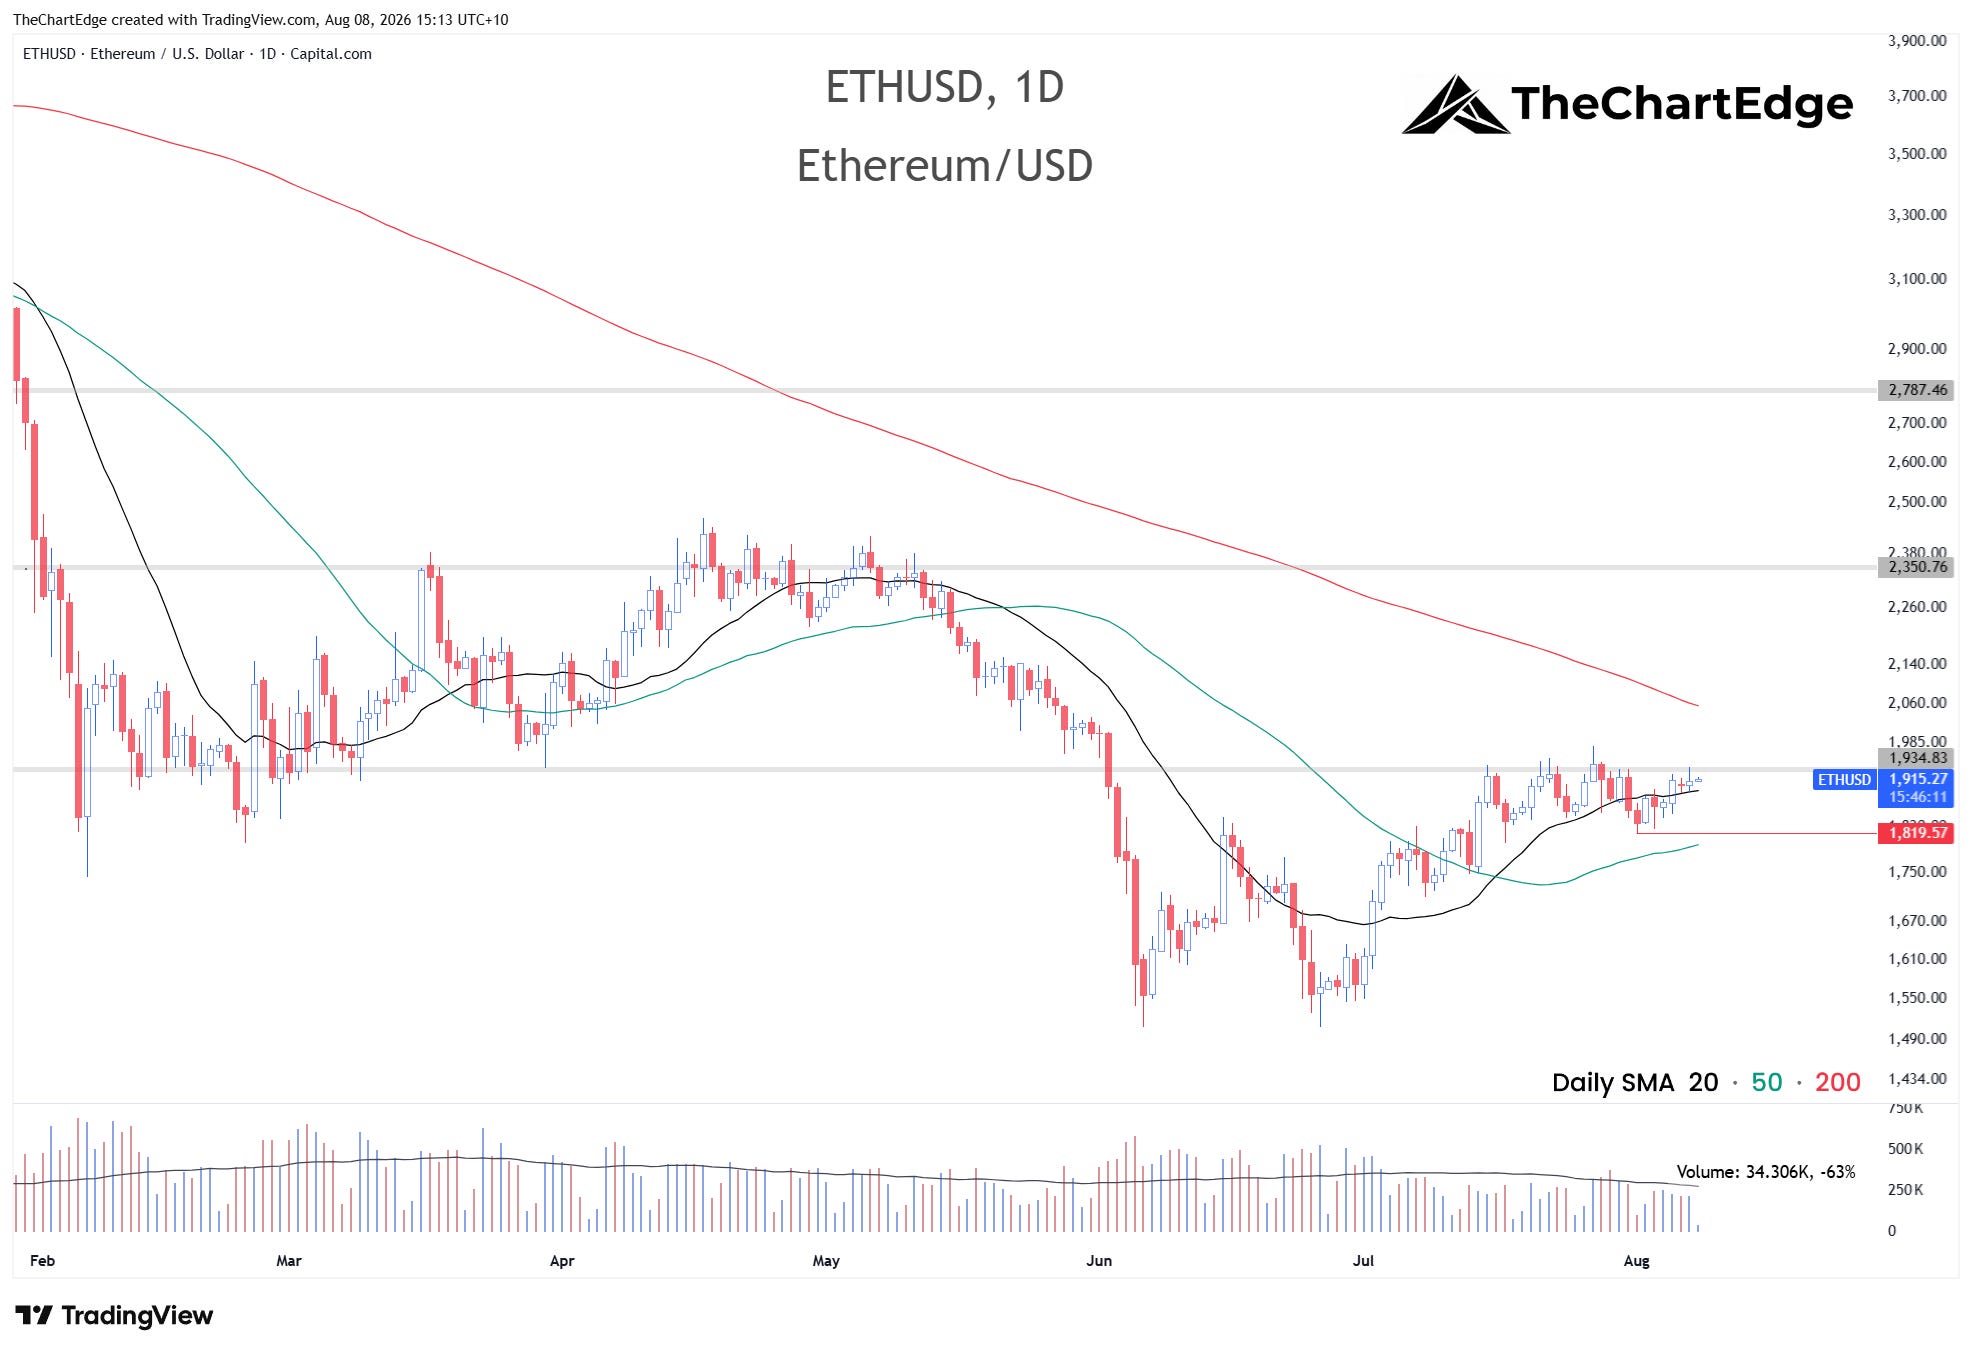
I like the tight ETH setup under resistance here - especially given the action in gold and silver. I plan to take a position around current levels - currently on Sunday evening in Australia it’s trading around 1915 - and would add if it breaks above recent highs around 1940-1950. Initially my max stop-loss would be below the August 1 low, around 1820, but I may use a more aggressive stop under the lows of the last few days and the 20-day SMA, around 1875, and would raise my stop to this level if it does clear 1950, with potential upside targets at 2350 and then 2750.
Follow-Up on the Dollar and TLT
DXY Chart
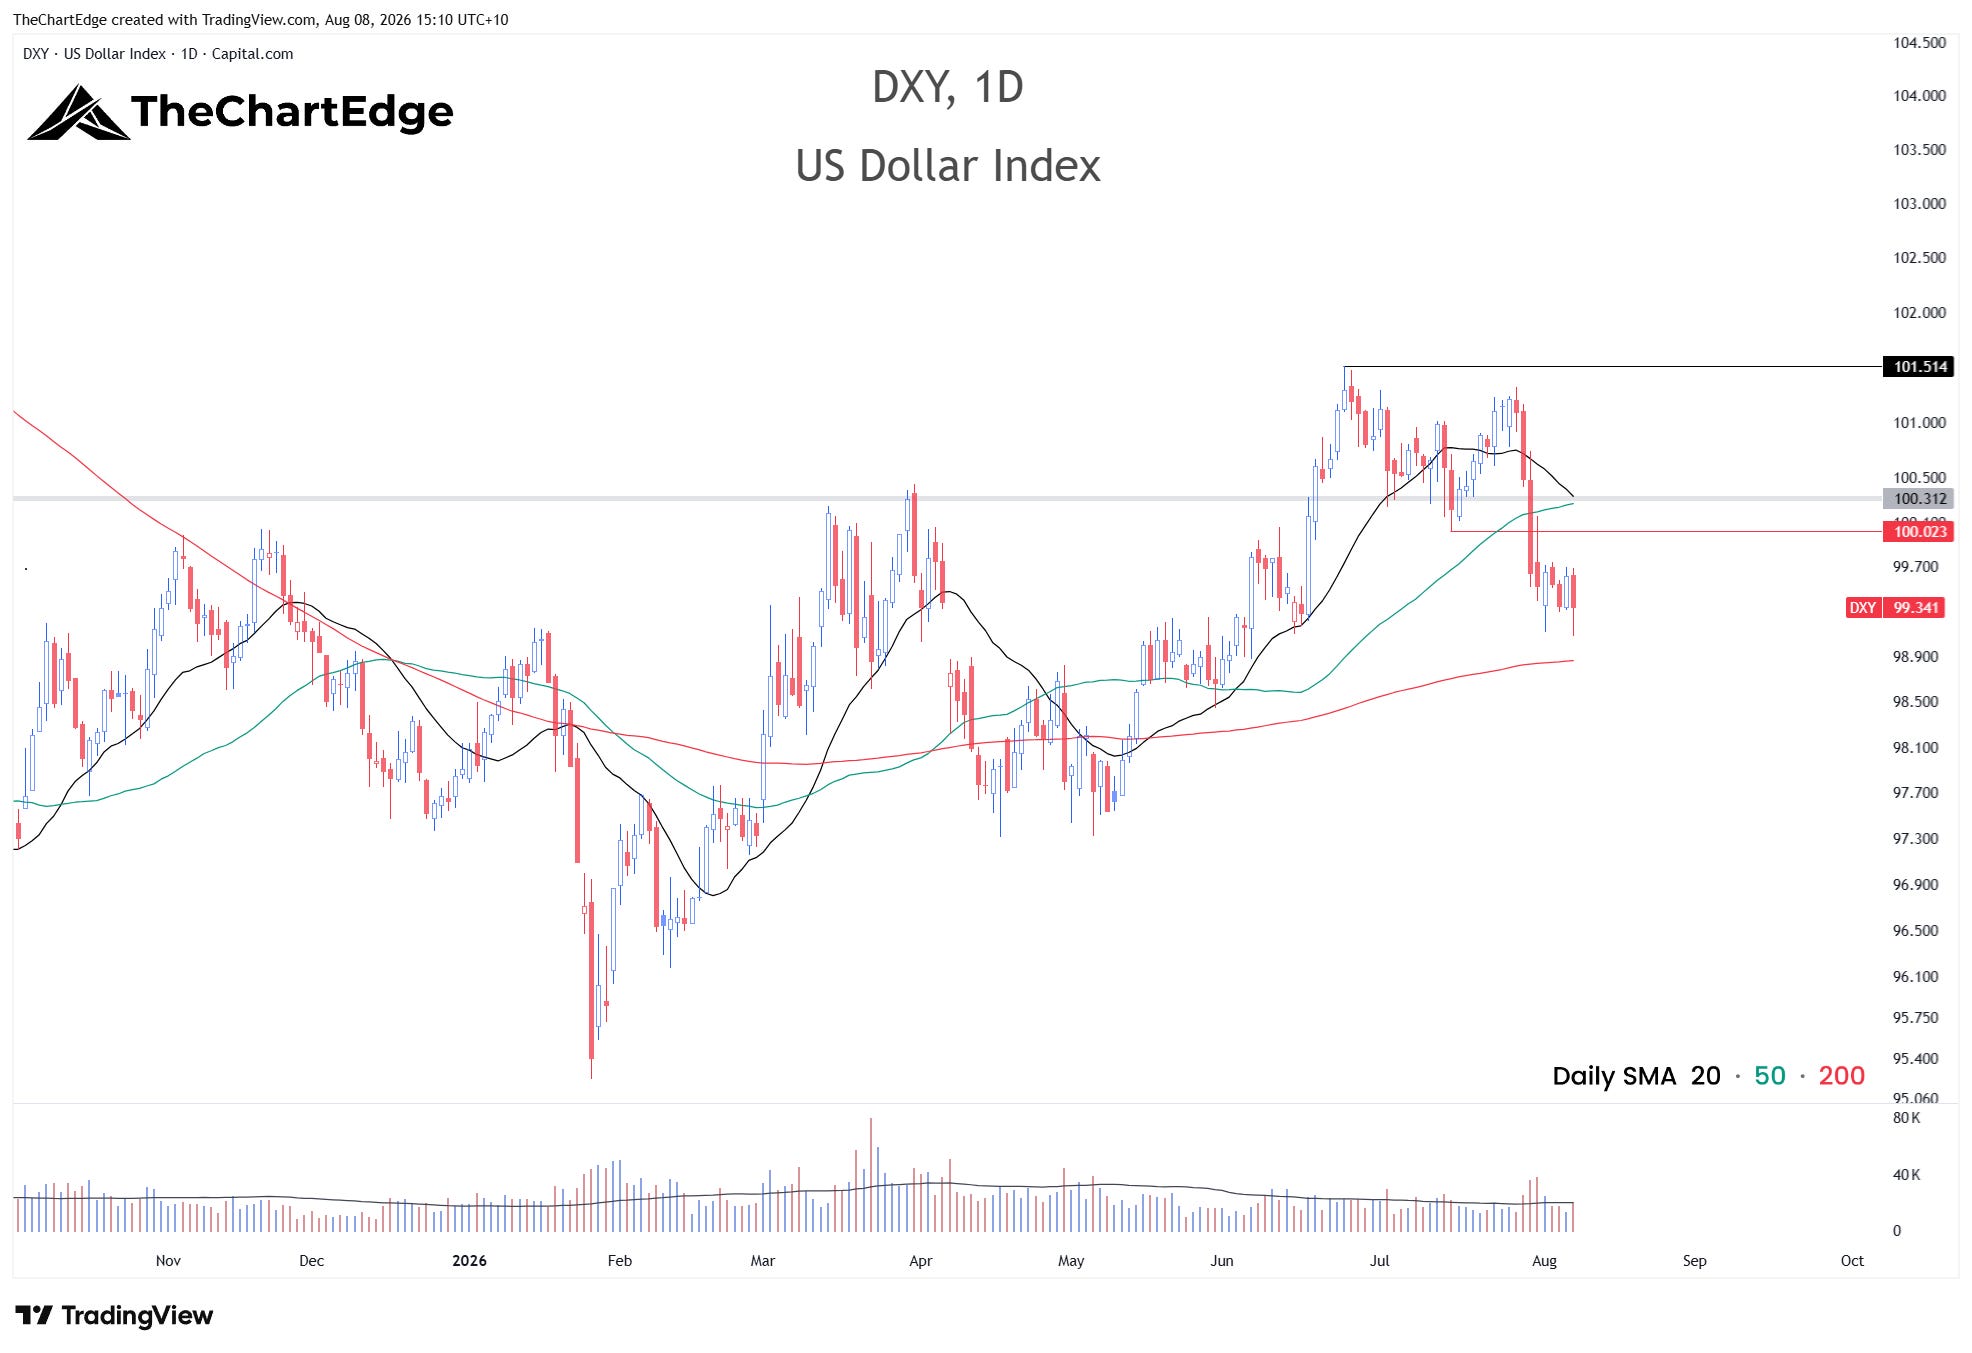
The DXY spent the week below 100 - continued weakness should be a tailwind for equities, precious metals and potentially crypto.
TLT Chart
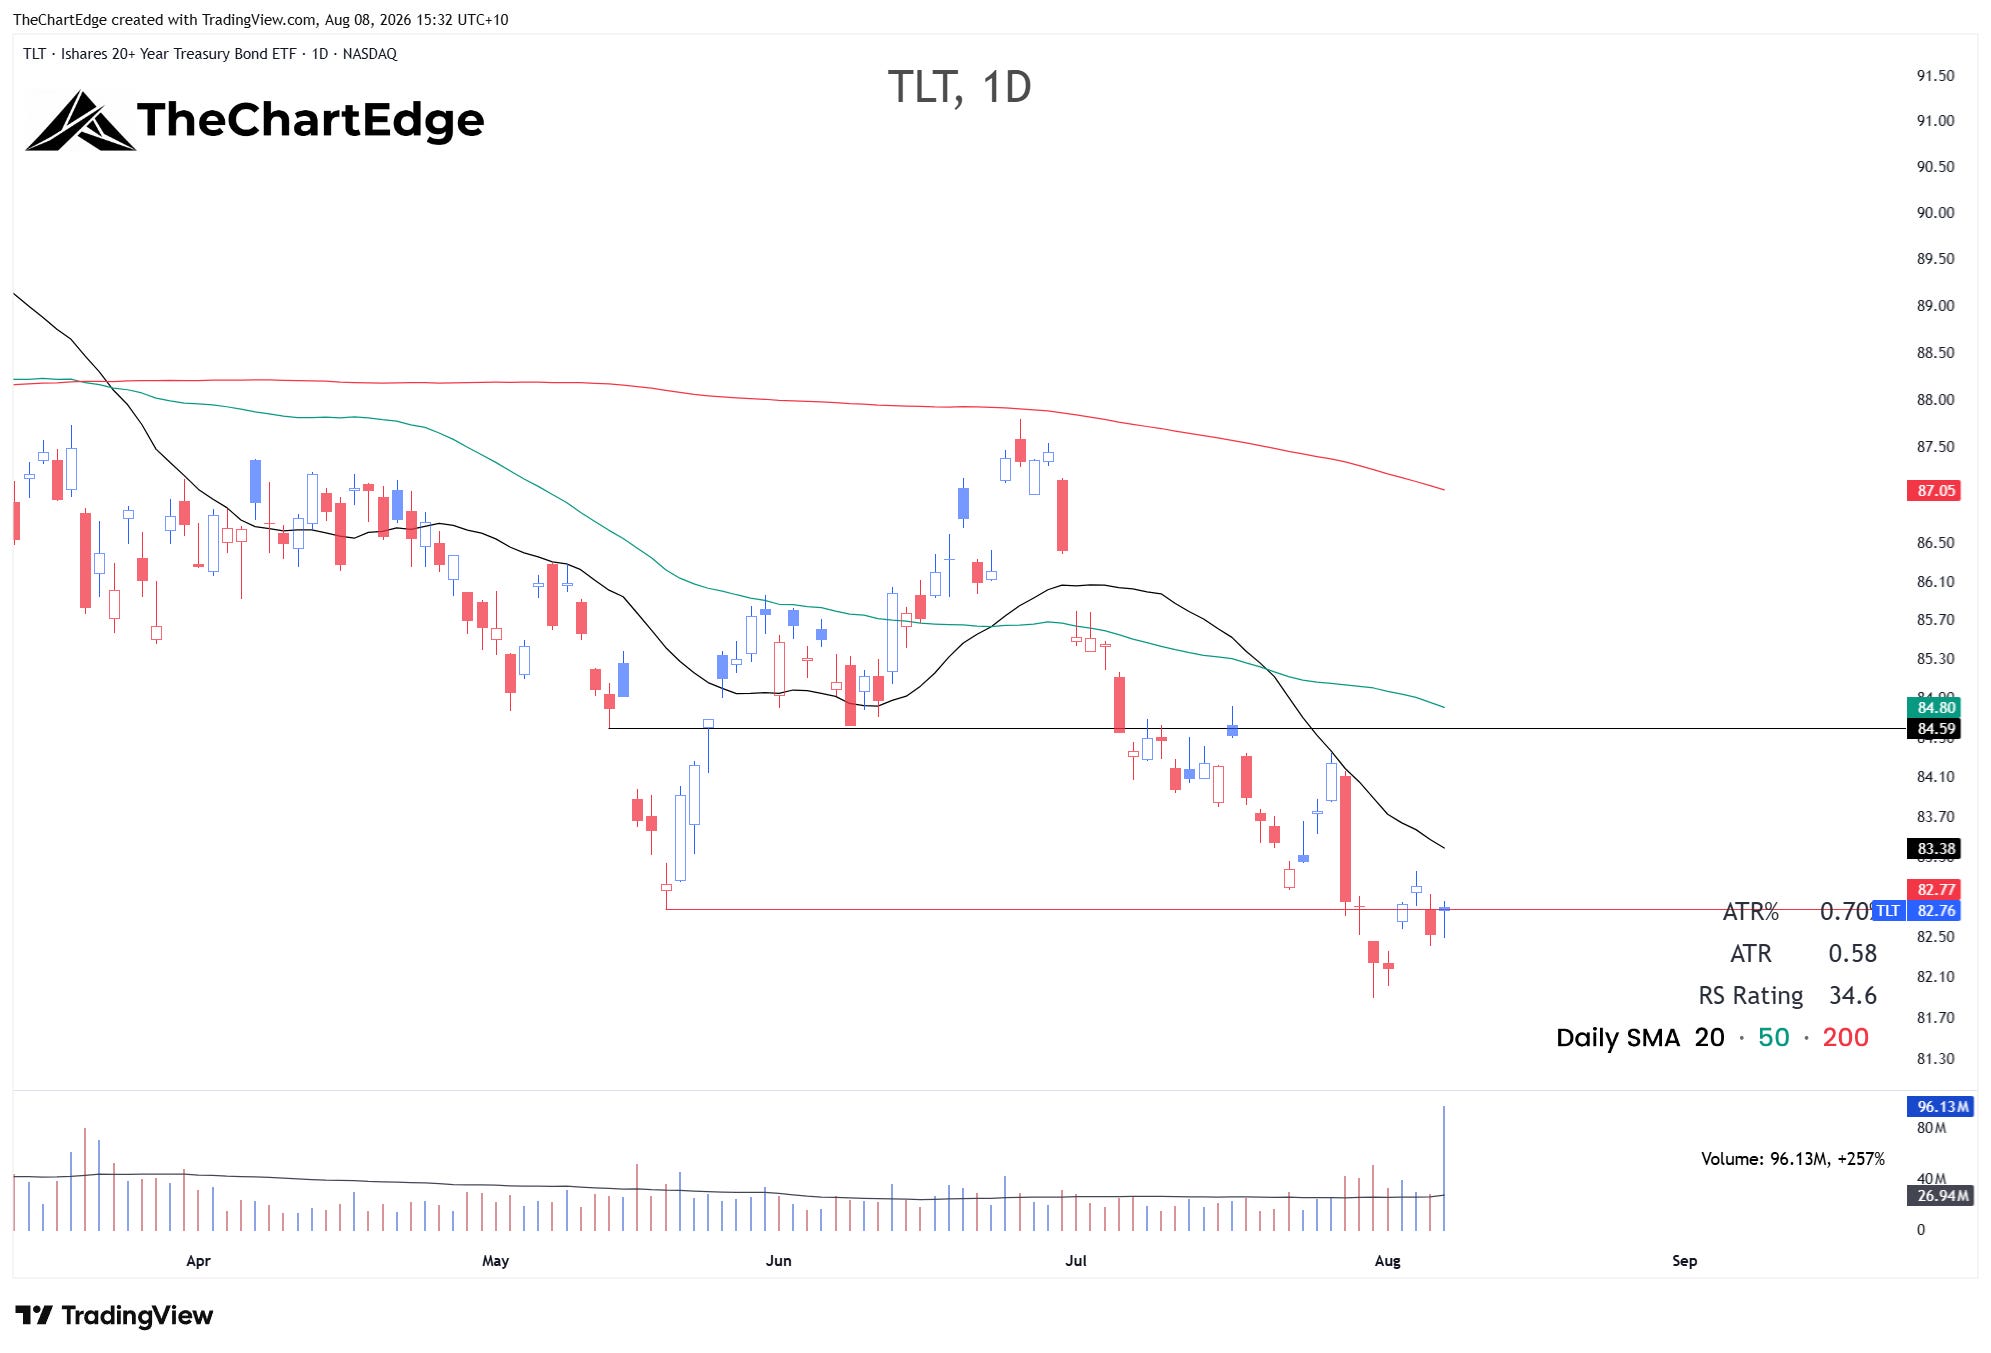
TLT recovered during the week to close right back at the 82.77 May low - with the 10-year yield easing to 4.66% from 4.74% and the 30-year to 5.21% from 5.27%. If yields continue to ease, I will be more comfortable adding risk and exposure.
The Week Ahead
The temperature is back in the Goldilocks Zone, SPY at all-time highs, breadth surged, and the momentum board turned over to a far more risk-on look. Last weekend I was neutral and in capital preservation mode, but after last week the market is signalling it’s time to start adding exposure. I’m mindful the semi and AI complex is yet to confirm - I’ll be watching SMH to see if it can clear 592 and whether QQQ continues to outperform SPY. I’ll also keep an eye on 10-year and 30-year treasury yields. However, this coming week I will look to get exposure on via XBI and Ethereum and look to add some S&P 500 through CFDs on strength after a pullback towards 7600, if we get one.
Stay open-minded and manage risk carefully.
Cheers,
Marcus Grant, CFTe
Disclaimer: The content provided in this newsletter is for informational and educational purposes only and should not be considered as financial, investment, or legal advice. The information shared is based on our research and analysis, but we are not a licensed financial advisor, nor can we guarantee its accuracy, completeness, or timeliness. Market conditions and financial instruments can change rapidly, and any opinions expressed may not be suitable for all investors. Any opinions expressed and or securities mentioned do not constitute a recommendation to buy, sell, or hold that or any other security. You should conduct your own due diligence and consult with a licensed financial advisor or other professional before making any investment decisions. Past performance is not indicative of future results, and all investments carry the risk of loss. The authors and publishers of this newsletter are not responsible for any financial decisions made based on the content provided herein. By reading and or subscribing to this newsletter, you acknowledge and agree that you are using the information at your own risk.