

Market Temperature Hits 7.4 - Into The Surge Zone
SPY at all-time highs, semis accelerating hard, and a growing gap between AI related names and almost everything else

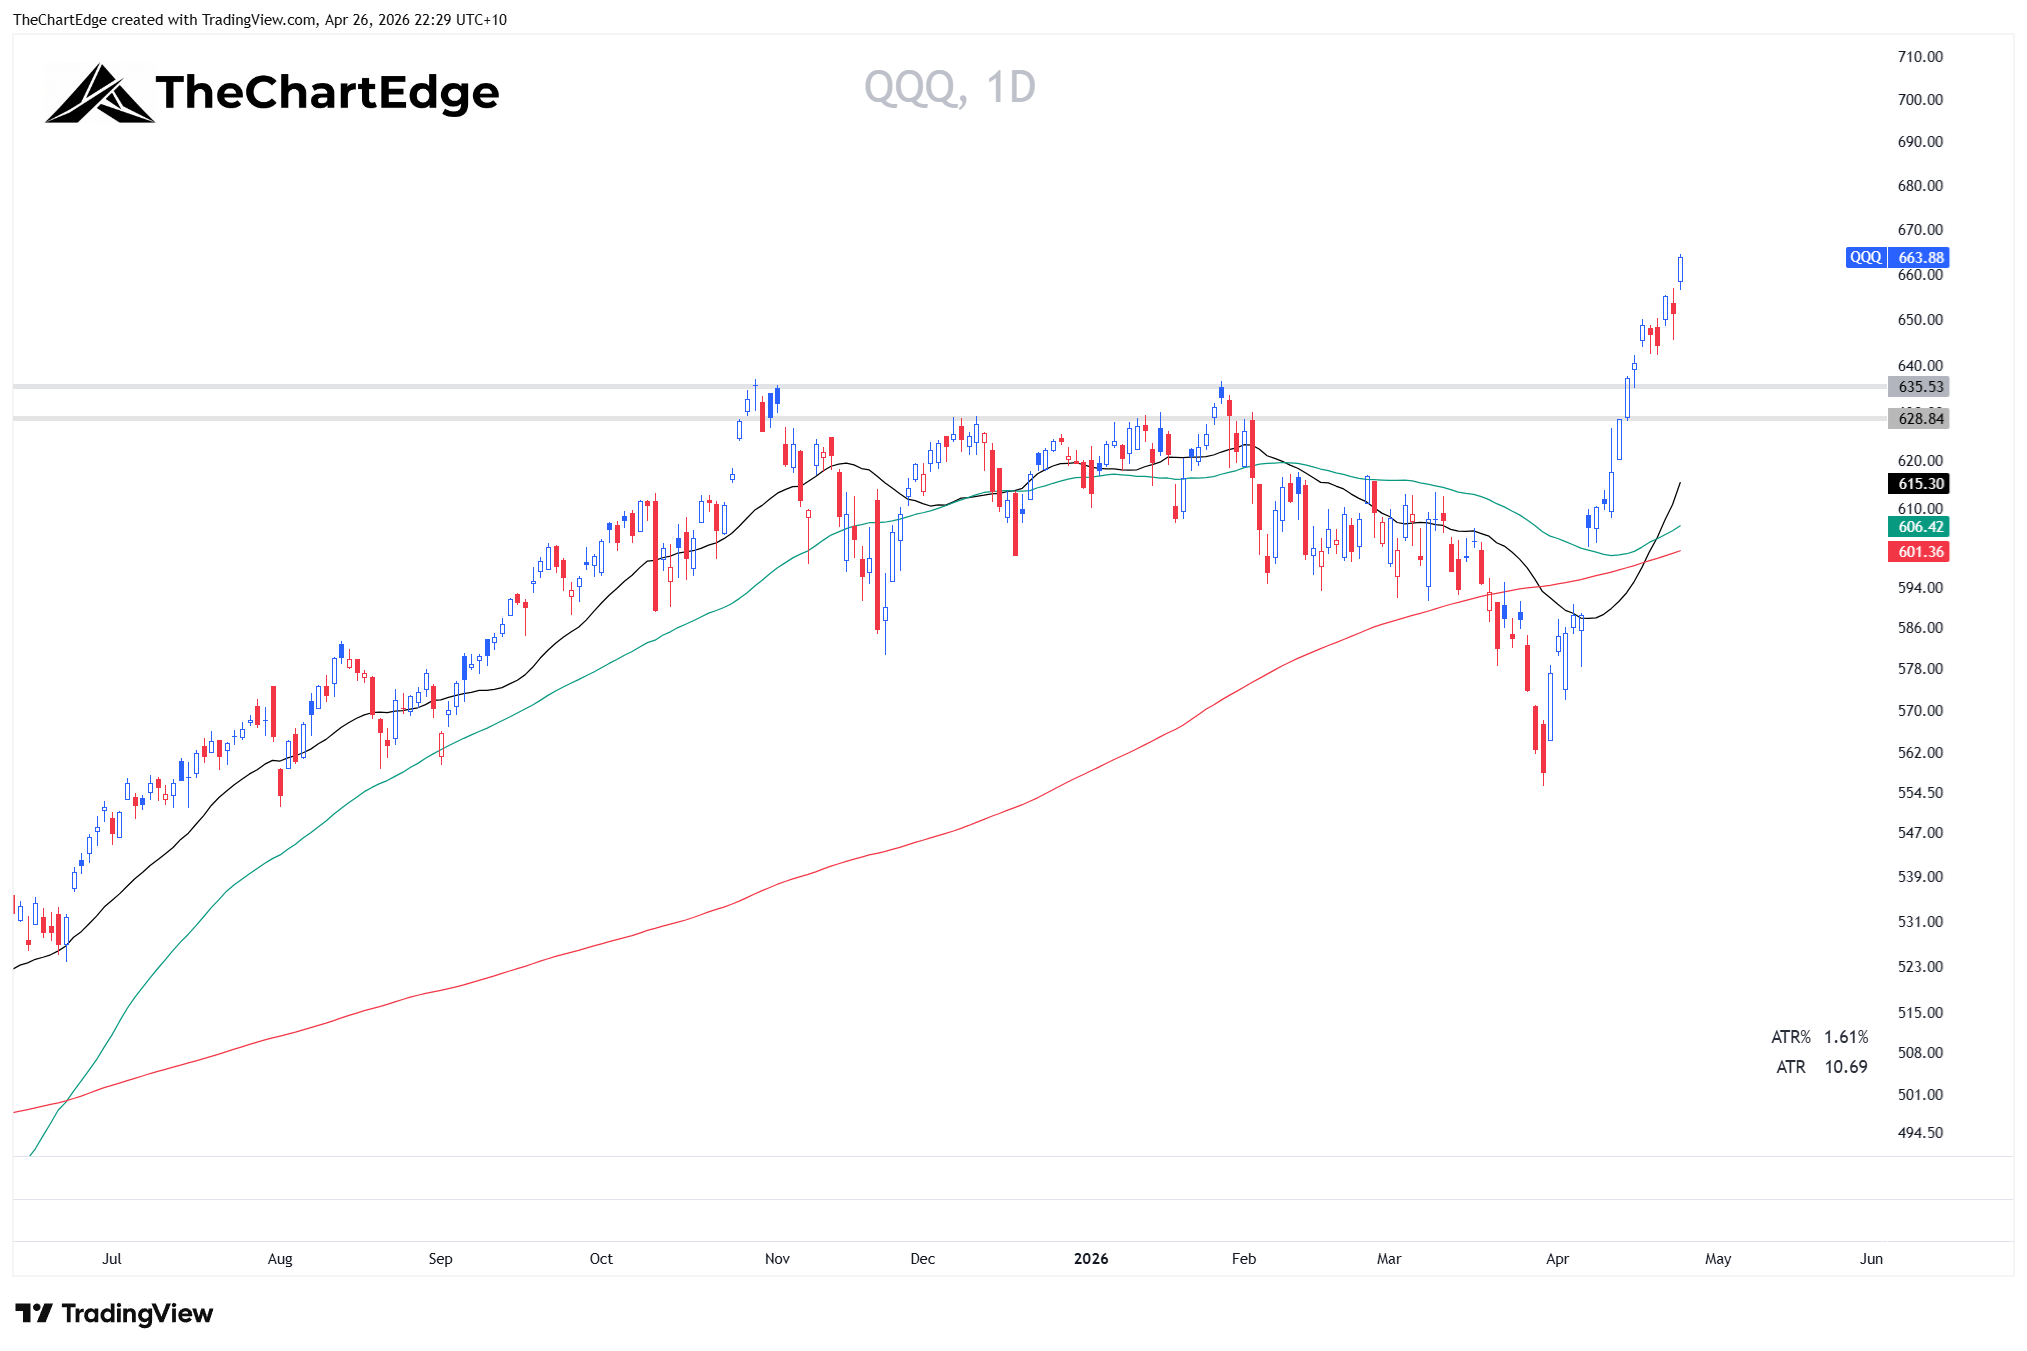
AI related names and oil outperformed everything last week. The S&P 500 (SPY) gained 0.54%, but it was a week of constructive consolidation after rallying around 12% over the three weeks prior, closing out the week at an all-time high. The Nasdaq 100 (QQQ) was up +2.32%, and FANG+ (FNGS) up 1.48%. The Dow (DIA) slipped 0.41%, the S&P MidCap 400 (MDY) was basically flat at -0.14%, and the Russell 2000 (IWM) eked out a +0.32% gain.
The Market Temperature - which I introduced in detail in this post - hit 7.4 out of 10, up from 6.9 the prior week. That puts us into the Surge zone (7.0+) for the first time since July 2025.
Surge is the highest zone in the model, and it’s very rare - in my 10-year backtest, the model only spent about 7% of weeks at 7.0 or above. It’s hard to reach because it needs almost everything firing at once: the tape and trend pillar - which captures moving average alignment, breadth, and momentum - accounts for 4 of the 10 points and needs to be near-maxed. On top of that, credit and monetary conditions need to be supportive, risk appetite and regime indicators need to be healthy, and for sustained readings in the Surge zone, VIX elevated enough to act as a contrarian signal. That last one is why the COVID Surge run (VIX 20-35, peaked at 7.98) lasted for months.
Outside of COVID, the model has only touched Surge five times in ten years (prior to this week’s reading) - and never for more than a week or two. Two of those were at tops: January 2018 (7.29, two weeks before a 10% correction) and November 2021 (7.19, eight weeks before the 2022 bear market). Both came at the end of extended rallies.
The other three were momentum surges after corrections. The model hit 7.04 in late November 2023 after the October bottom and touched 7.02 again in late December 2023. The last one hit 7.32 in early July 2025 - about three months after the tariff selloff bottom. All three were single-week spikes that dropped back below 7.0 the following week. The tariff recovery took three months to reach Surge because the correction was over 20% - deep enough to drag the moving averages far apart, requiring a long rally to get them realigned. The October 2023 correction was a similar depth to this March 2026 one (a little over 10%) but more drawn out - three waves down over three months - and the recovery, while strong, wasn’t as extreme as what we’ve just seen.
This week’s 7.4 is different from all of those, and it is unique in the model’s history. The correction was just under 10%, and yet the reading is higher than any previous post-correction Surge spike. What sets this one apart is the speed and intensity of the snap-back. Even though last week’s gain was modest in percentage terms, the four-week rally of around 12.7% off the low was enough to push the moving averages into full bullish alignment. Three of the model’s four pillars - tape, monetary, and regime - are all running at 77-85% of their maximum scores. The only pillar not fully contributing is sentiment, where VIX at 18.71 isn’t elevated enough to provide a contrarian boost.
I’m genuinely not sure what to make of this week’s reading. The rapid movement into the Surge zone could be setting us up for a sustained uptrend. Or it could mean the model reached Surge too easily because the correction was shallow, and the reading is less meaningful than it looks. SPY and QQQ are extended - SPY is 5.46% above its 50-day SMA, and QQQ is 9.48% above its 50-day. To put that in context, SPY’s extension sits between the 89th and 95th percentile of the last 26 years of daily data, depending on whether you adjust for the current volatility regime - meaningfully stretched but not extreme. QQQ’s is at the 95th-97th percentile on both measures - historically rare, and a level where forward returns have tended to compress. The next few weeks should tell us a lot. If we consolidate above the breakout zones or have an orderly pullback to the 20-day SMA or even the 50-day SMA - with the market temperature remaining above 5 - it would be positive and likely offer new lower-risk entries.
I track how each index ETF sits relative to its key moving averages - the 20-day, 50-day, and 200-day SMAs. When all three are stacked in bullish order (price above the 20, the 20 above the 50, the 50 above the 200), that’s a “Strong Uptrend”. When price is above at least the 20 and the 200, but the 20 and 50 haven’t sorted into bullish sequence yet - typically after a sharp correction drags them down - that’s a “Recovering Uptrend”.
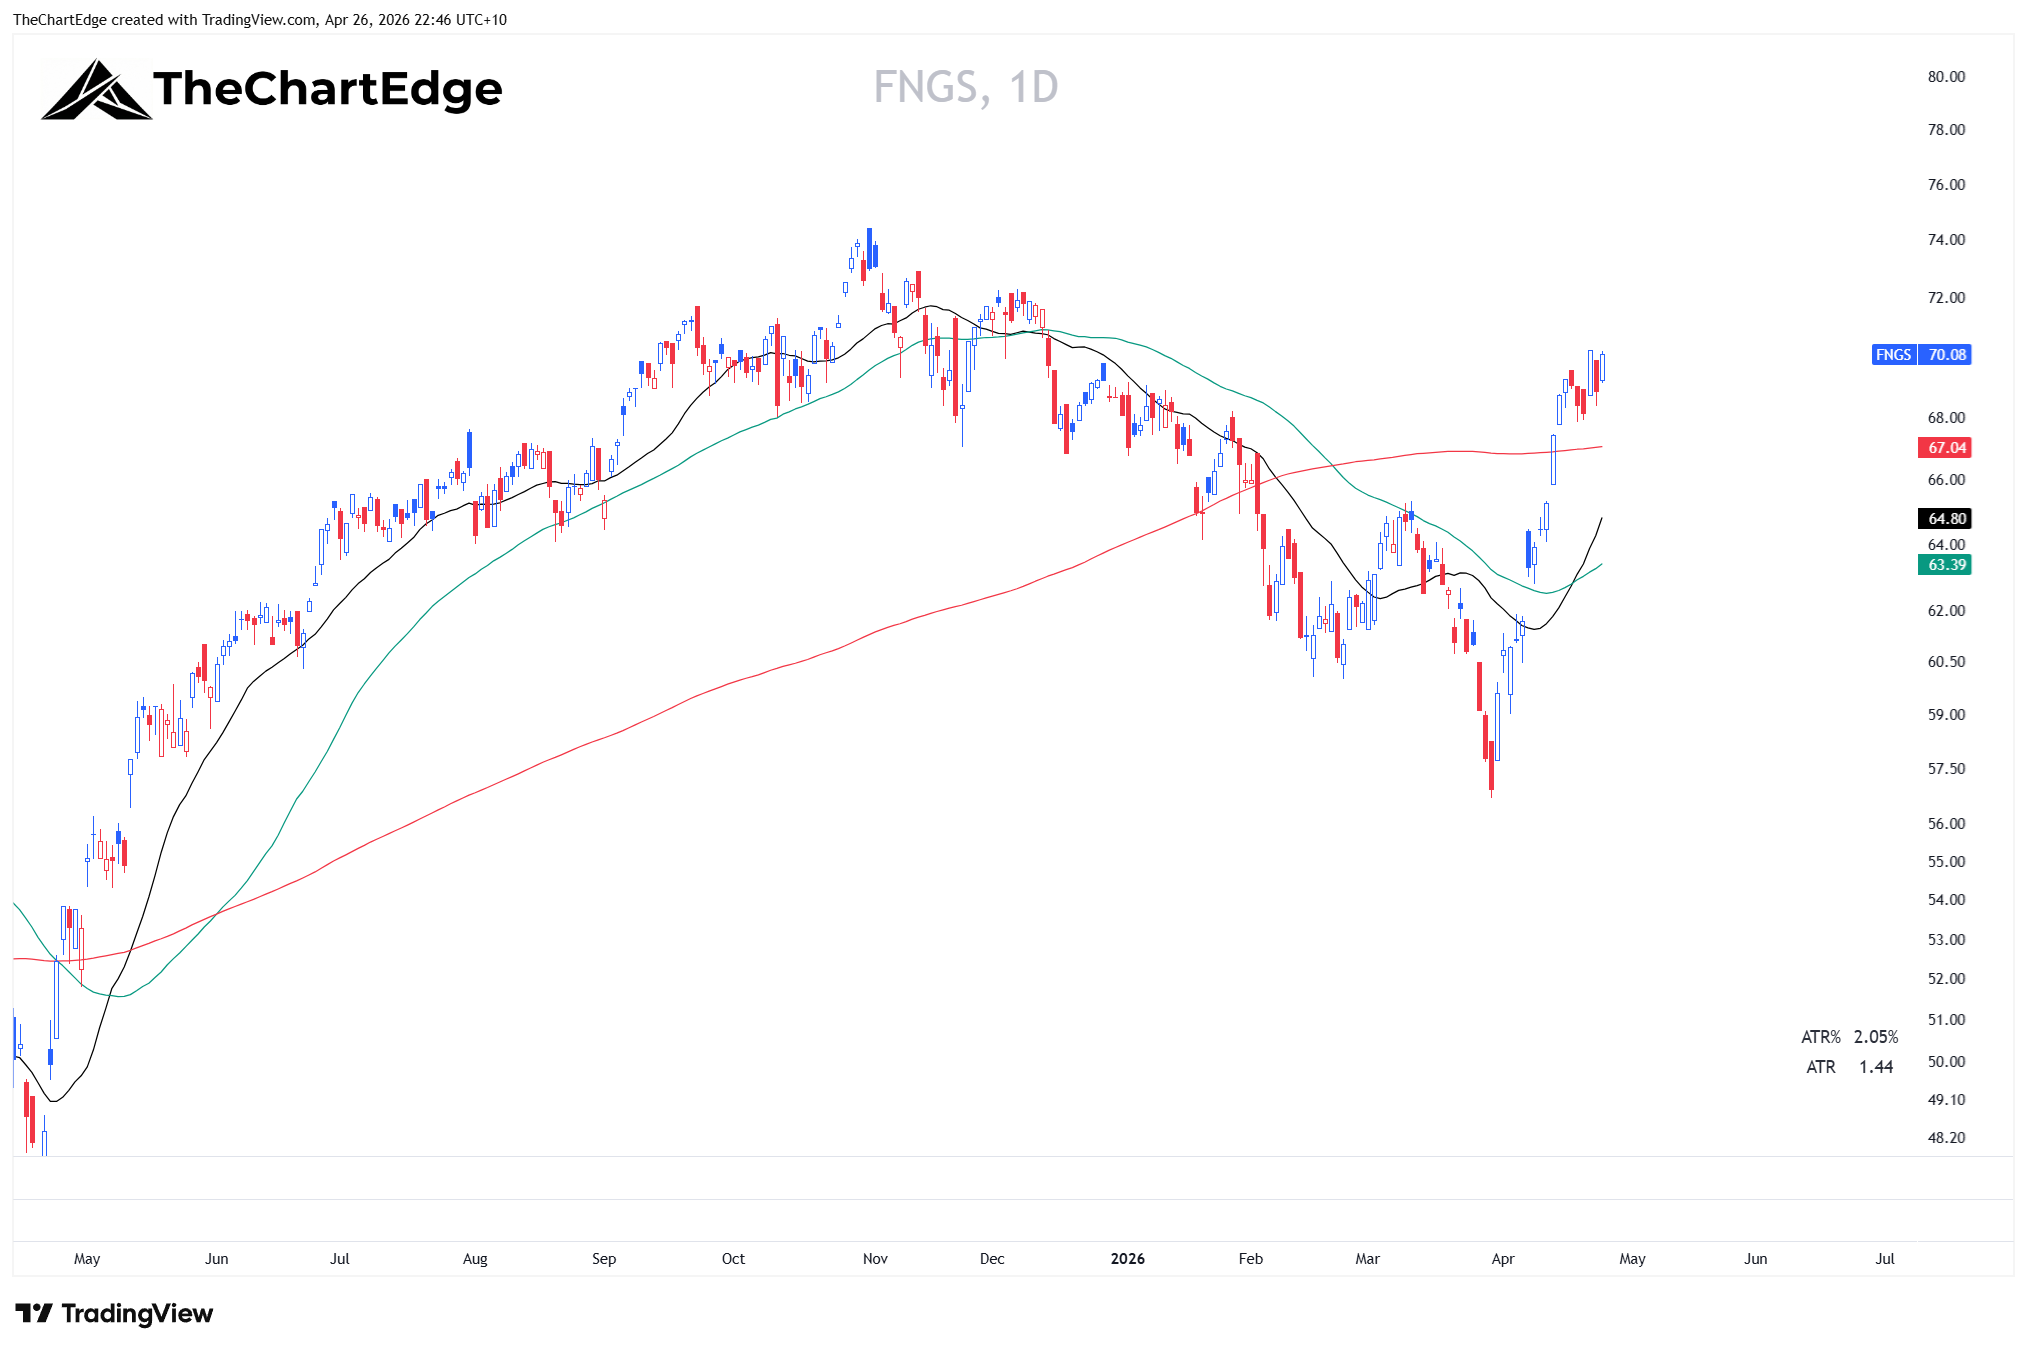
Last week, both SPY and QQQ flipped from Recovering Uptrend to Strong Uptrend - their 20-day moving averages crossed above their 50-day. I flagged this potential in last week’s post. MDY and IWM are also in a Strong Uptrend. FNGS and DIA are still Recovering - DIA is about to cross into bullish alignment, but FNGS is messier. Price is above all of the moving averages, but they are not bullishly aligned - the 200 is above the 20, which is above the 50.
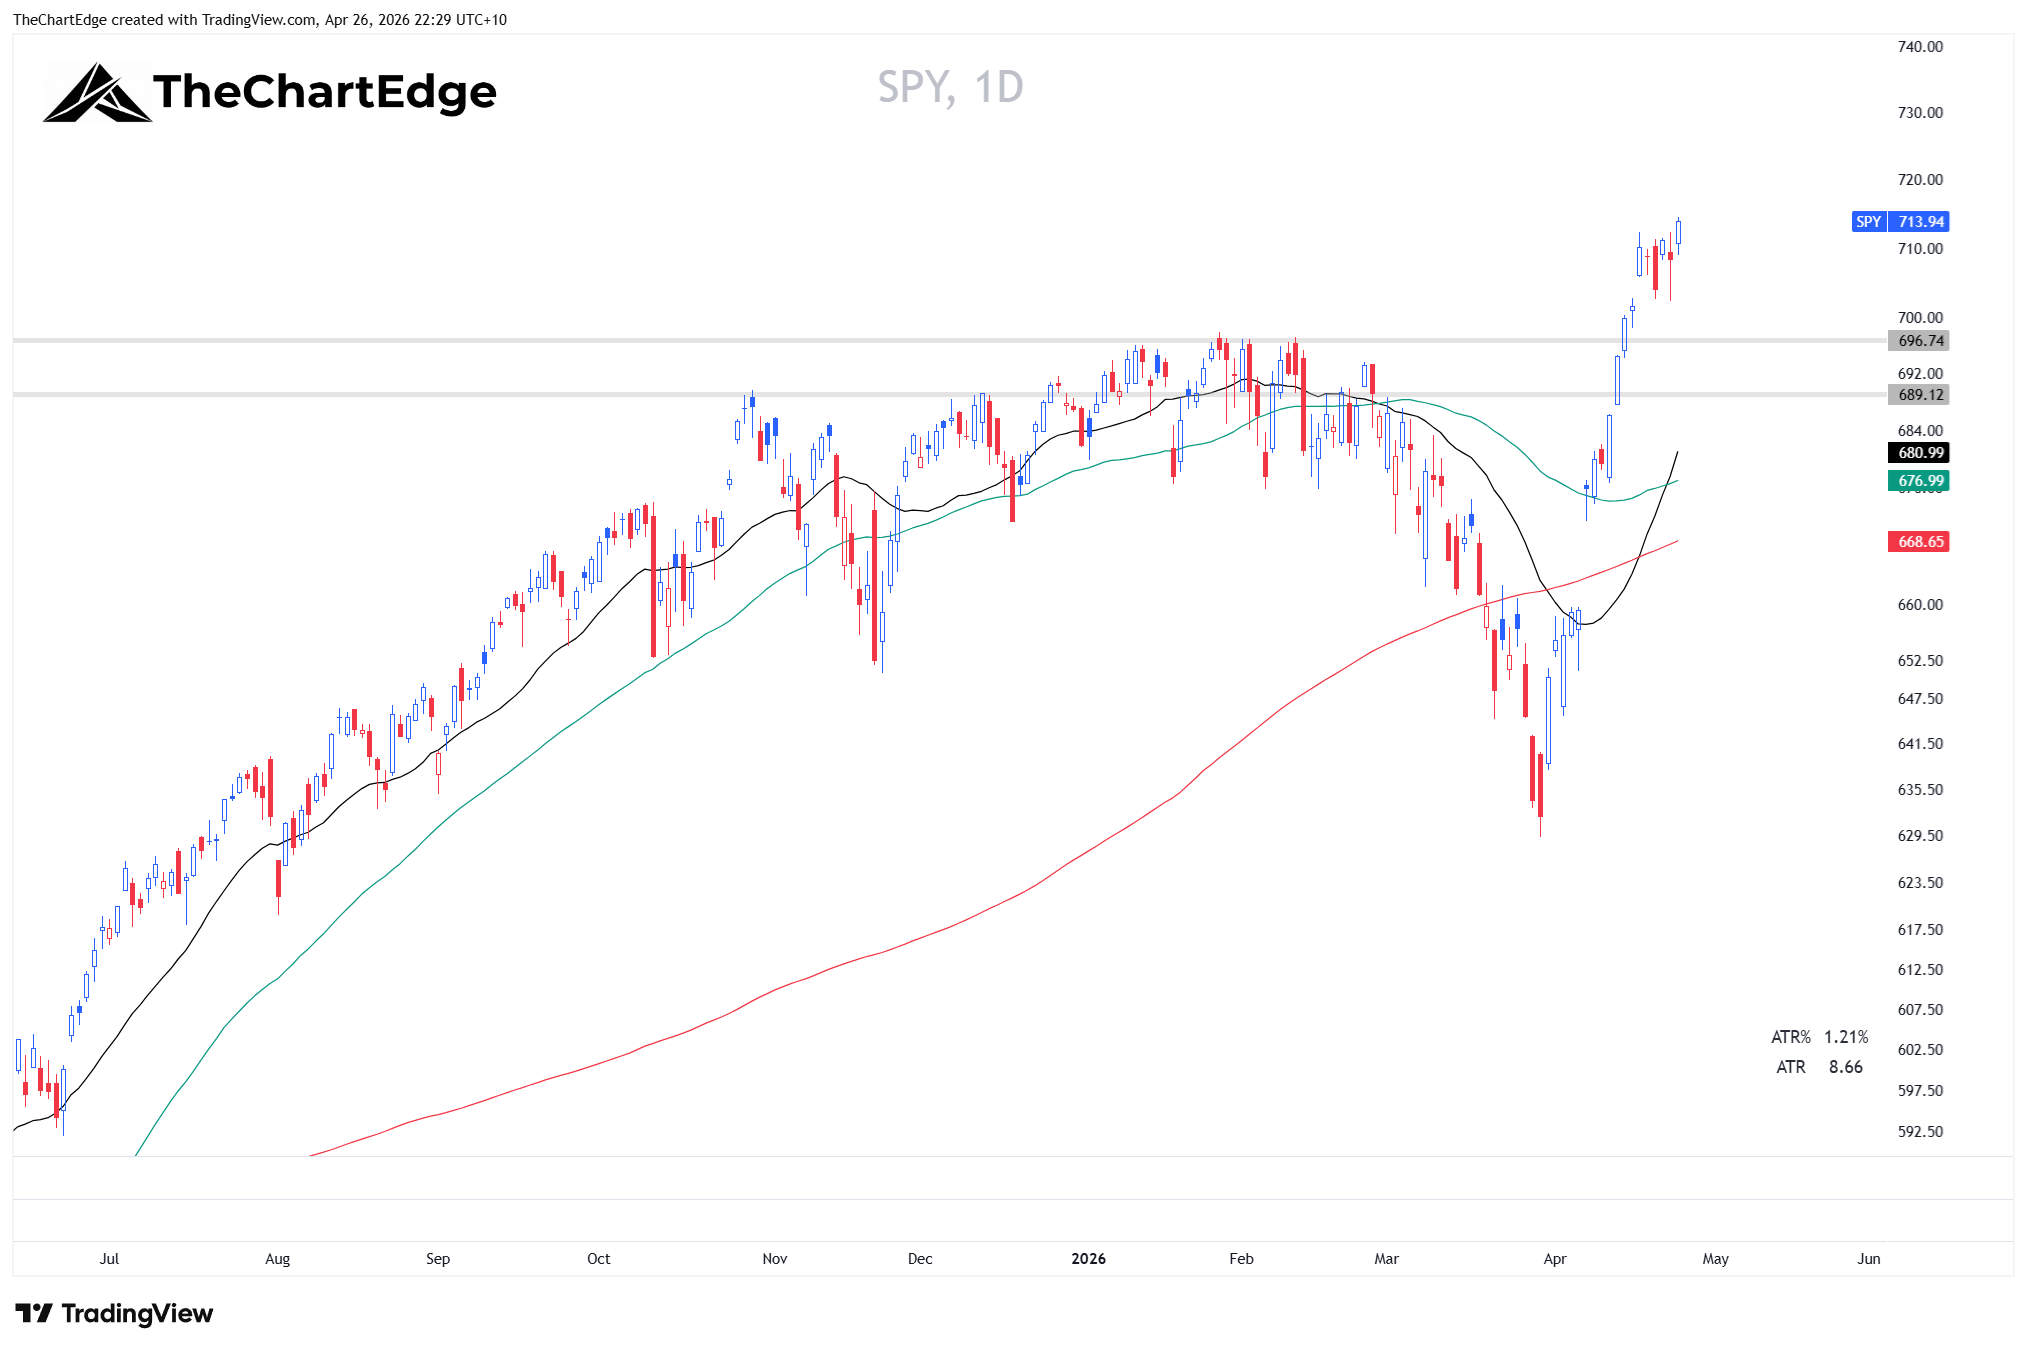
For all daily charts the black line is the 20-day SMA, the green is the 50-day SMA, and the red is the 200-day SMA.
Those trend state upgrades were the biggest driver of the temperature move from 6.9 to 7.4. Conversely, breadth narrowed slightly - the percentage of US stocks above their 50-day moving average dropped from around 69% to 62%, and those above their 200-day fell from around 59% to 56%.
VIX closed at 18.71, up slightly from 17.48 the prior week. Still comfortably below 20.
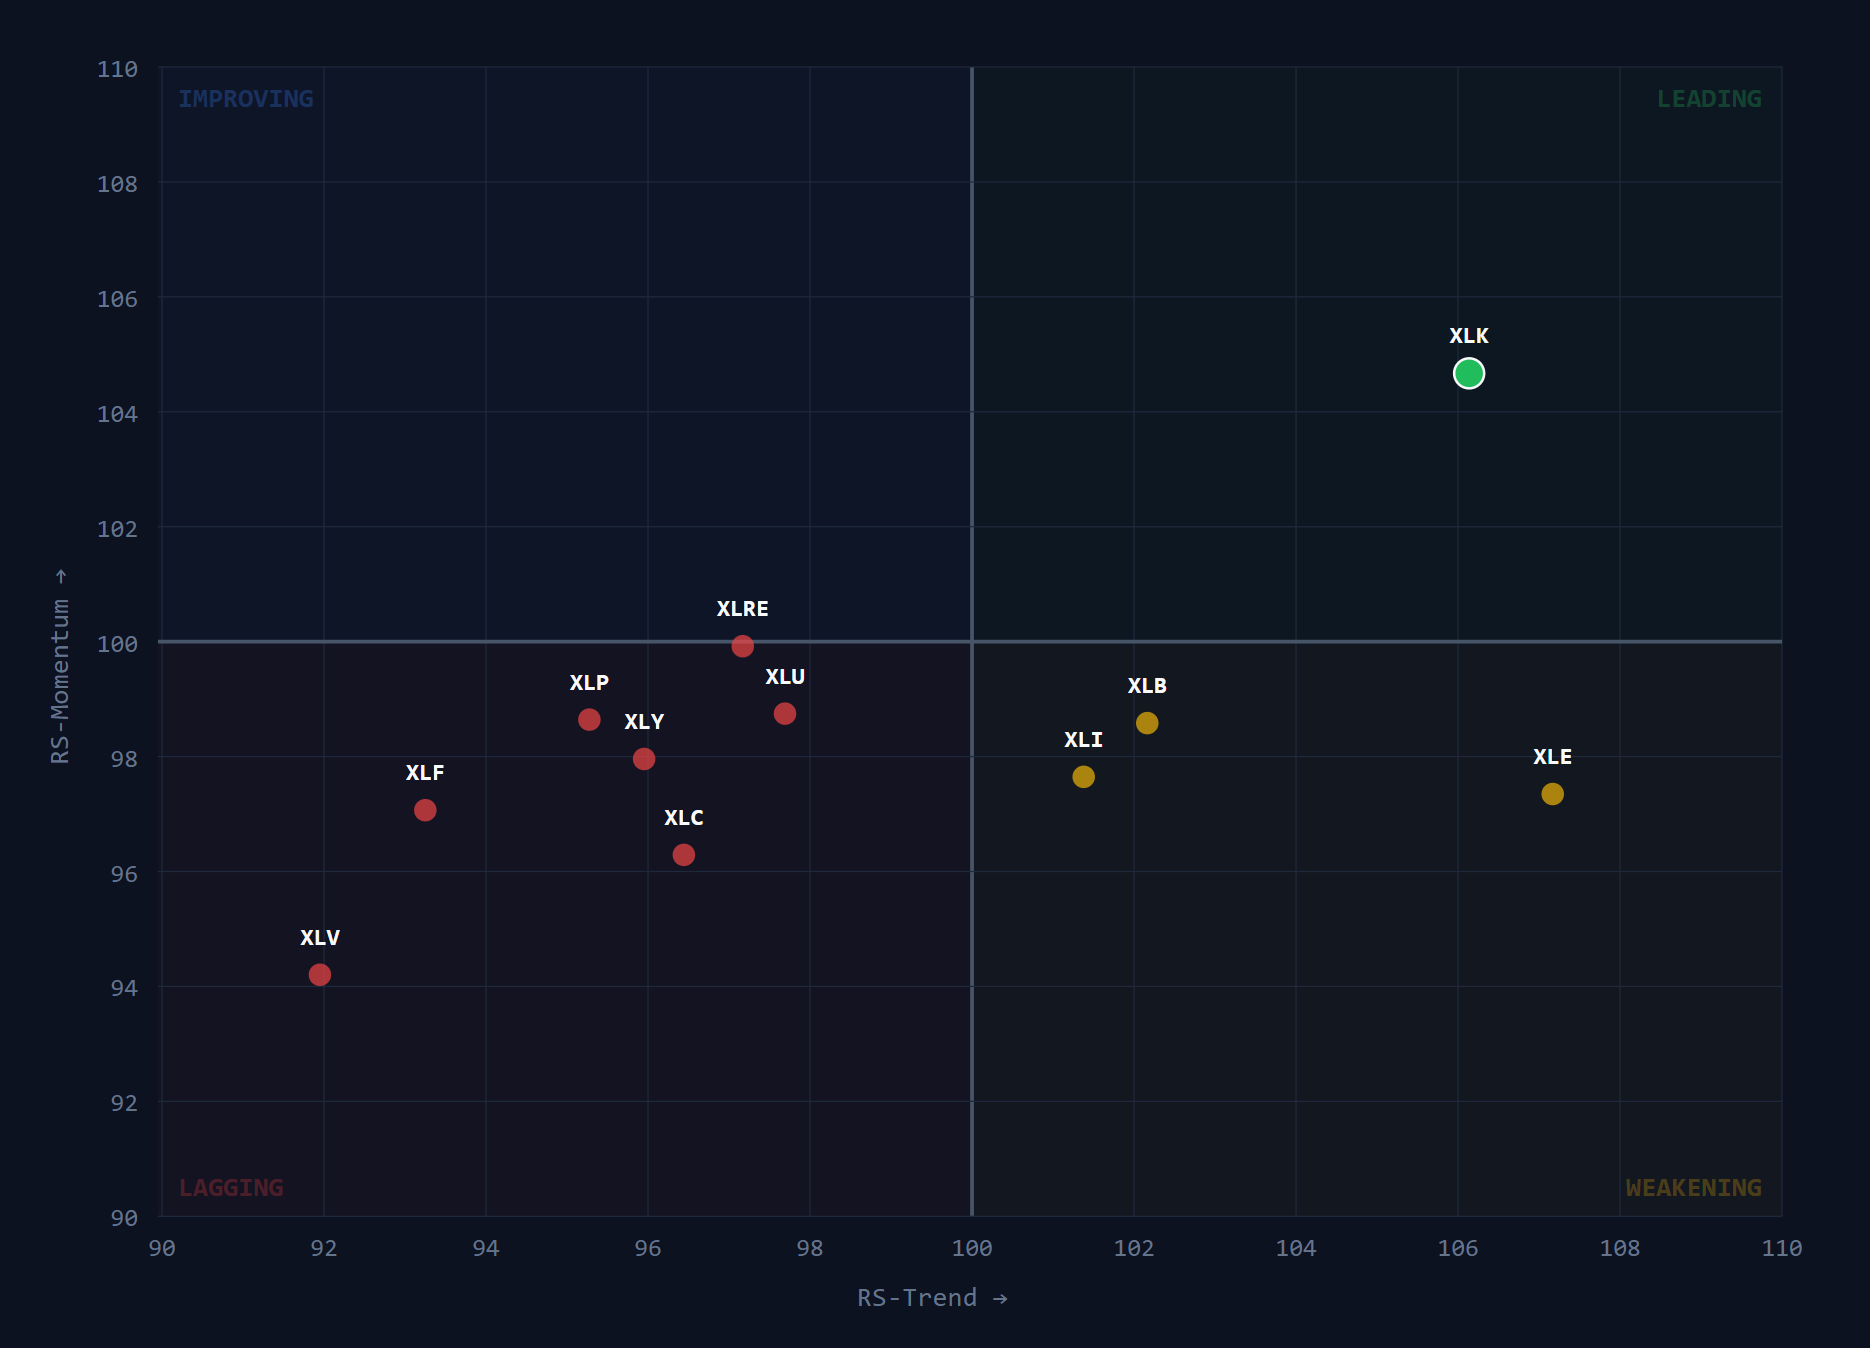
The sector-level data reinforces that picture. At the GICS level, Technology is the only sector in the Leading quadrant (outperforming SPY and accelerating). Only two sectors posted meaningful gains last week - Technology (+3.80%) and Energy (+3.36%). Consumer Staples was up just under 1%. Materials and Utilities were essentially flat. Everything else was down, including Comms Services (-2.99%), Healthcare (-3.10%), Financials (-1.93%), Consumer Discretionary (-1.43%), and Real Estate (-1.46%).
Last week I highlighted Real Estate and Consumer Discretionary as Improving sectors (still underperforming on trend, but showing short-term momentum). Both dropped back to Lagging (underperforming and decelerating) this week. No sectors remain in the Improving quadrant at the GICS level.
Only one sector Leading. Will the other sectors catch up, or will tech catch down?
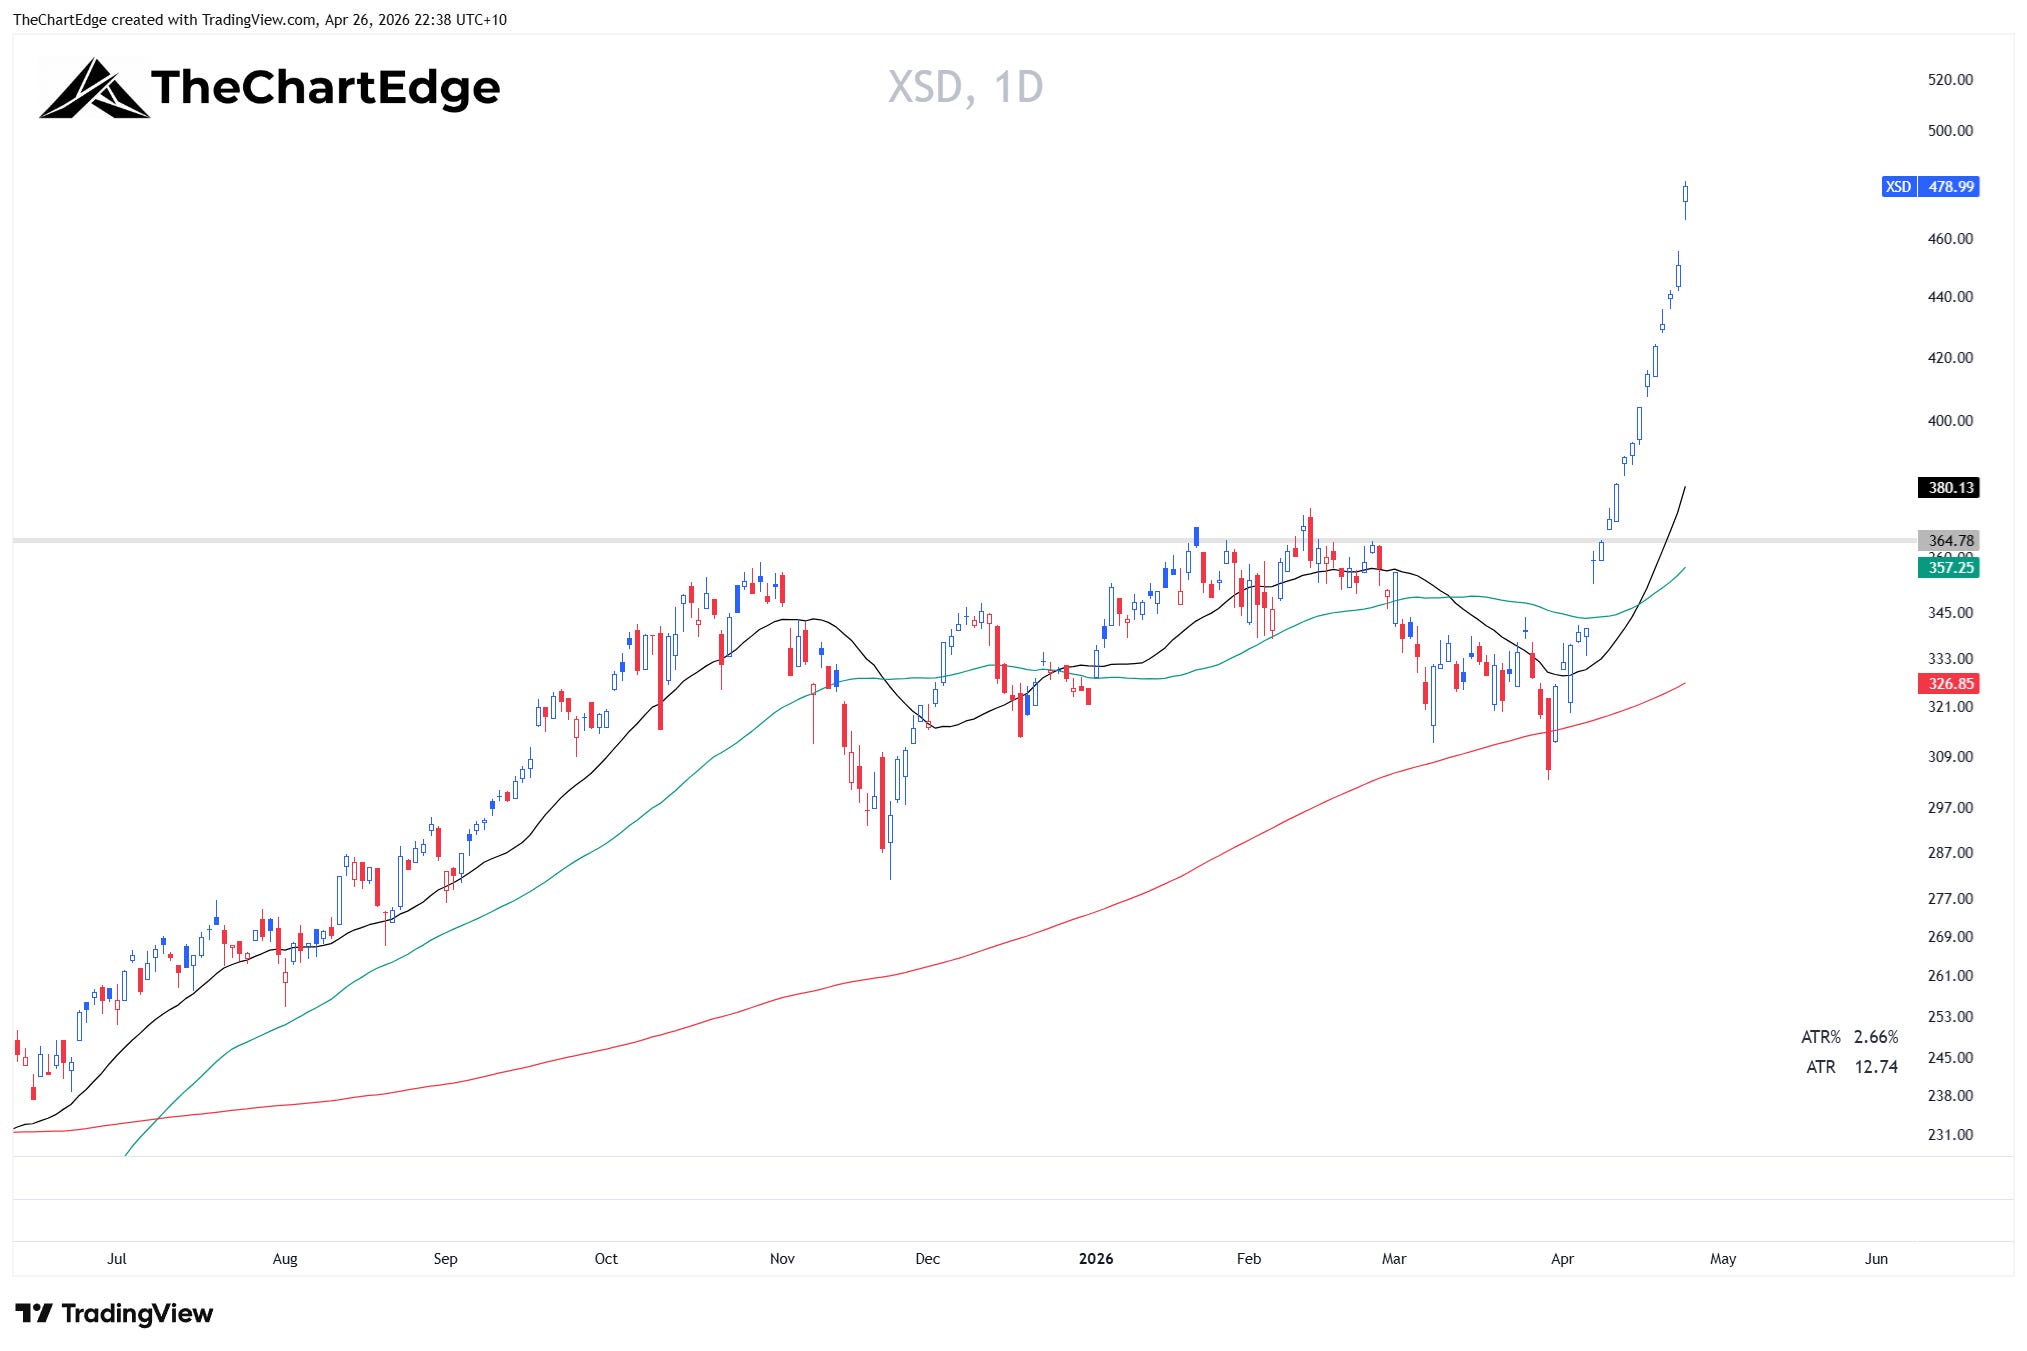
The semiconductor and AI complex continues to be the dominant theme. XSD (the equal-weight semiconductor ETF) had the strongest short-term momentum reading in our entire 121-ETF universe last week, with a gain of 15.51%. SMH (the cap-weighted version) gained 9.11%. The equal-weight outperforming the cap-weighted tells you the strength is broad-based across the sector. Both are massively extended, with the XSD 34.08% above its 50-day SMA, and SMH is 22.58% above.
The AI hardware and infrastructure complex - generative AI, digital infrastructure, data centre infrastructure ETFs - all remain in the Leading quadrant with Strong Uptrend trend states. Most of these names are extended after the recent run. Software (IGV) remains the missing piece - it was roughly in line with SPY last week (+0.14%) and the gap between hardware and software widened meaningfully.
FNGS confirmed into the Leading quadrant last week - its relative strength trend reading crossed above 100, but barely. It’s sitting at 100.04 - four hundredths of a point above the boundary.
The more interesting story is what’s happening underneath. Within the FNGS components, it’s a split: four names are Leading - MU, AVGO, NVDA, and AMZN. Two are Weakening - GOOGL and AAPL (still outperforming on trend but losing momentum). And four names are Lagging with Downtrend trend states - META, MSFT, NFLX, and PLTR. It’s the semiconductor and cloud infrastructure names driving the ETF into Leading, not broad mega-cap strength.
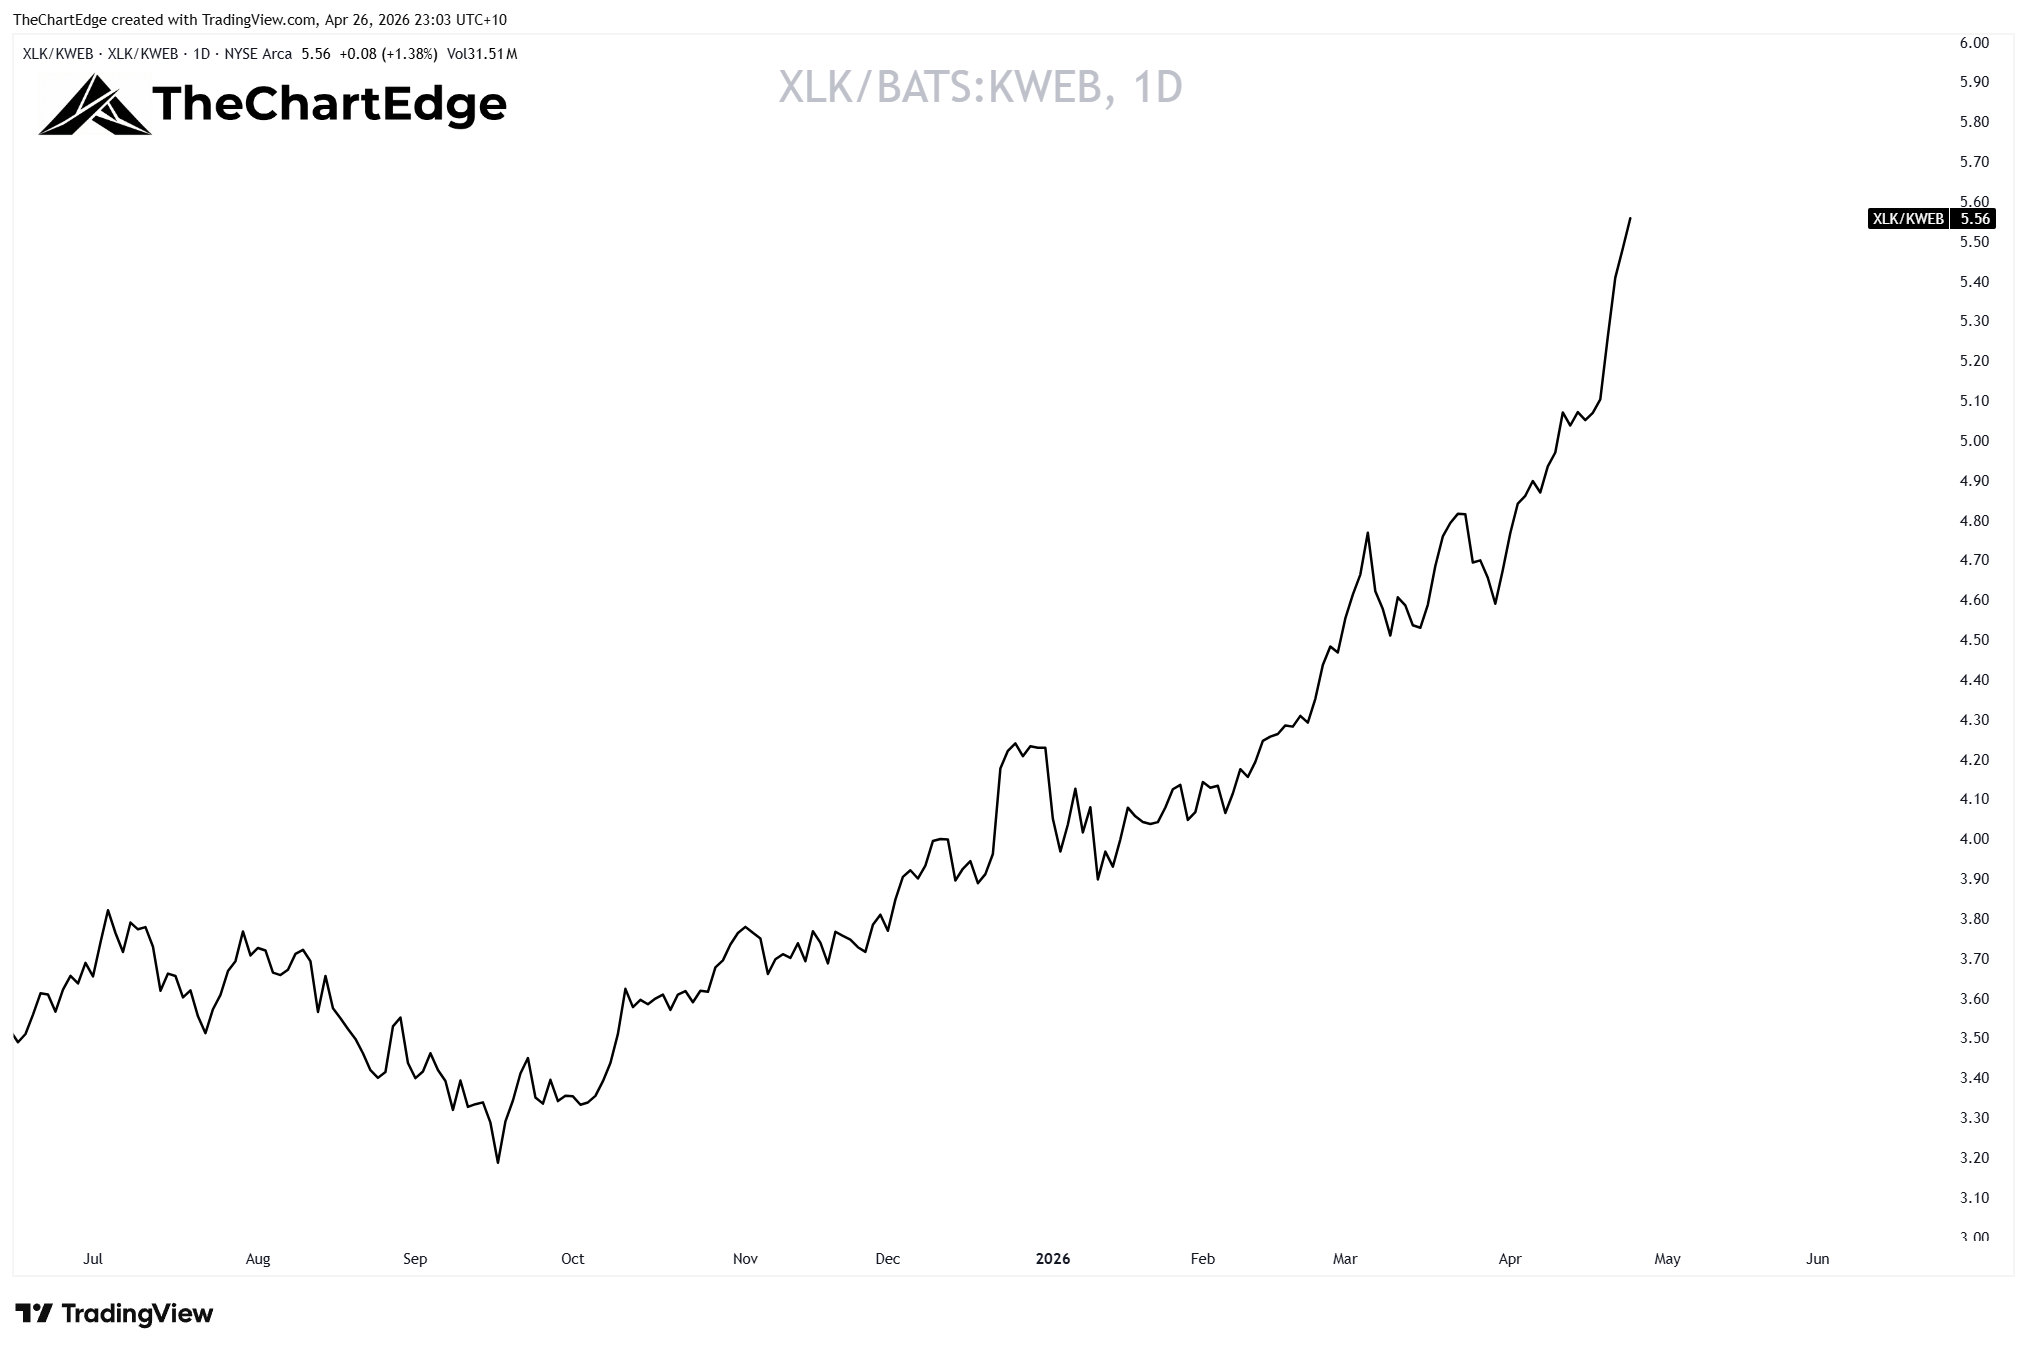
The divergence between US tech and Chinese tech is extreme. XLK (Technology Sector SPDR ETF) is in a Strong Uptrend and is in the Leading quadrant. KWEB (China Internet) is in a Strong Downtrend and is one of the weakest ETFs in the entire universe. Last week XLK gained 3.8% while KWEB fell 5.32%. Below is a ratio chart showing XLK/KWEB. The outperformance since October 2025 is stark.
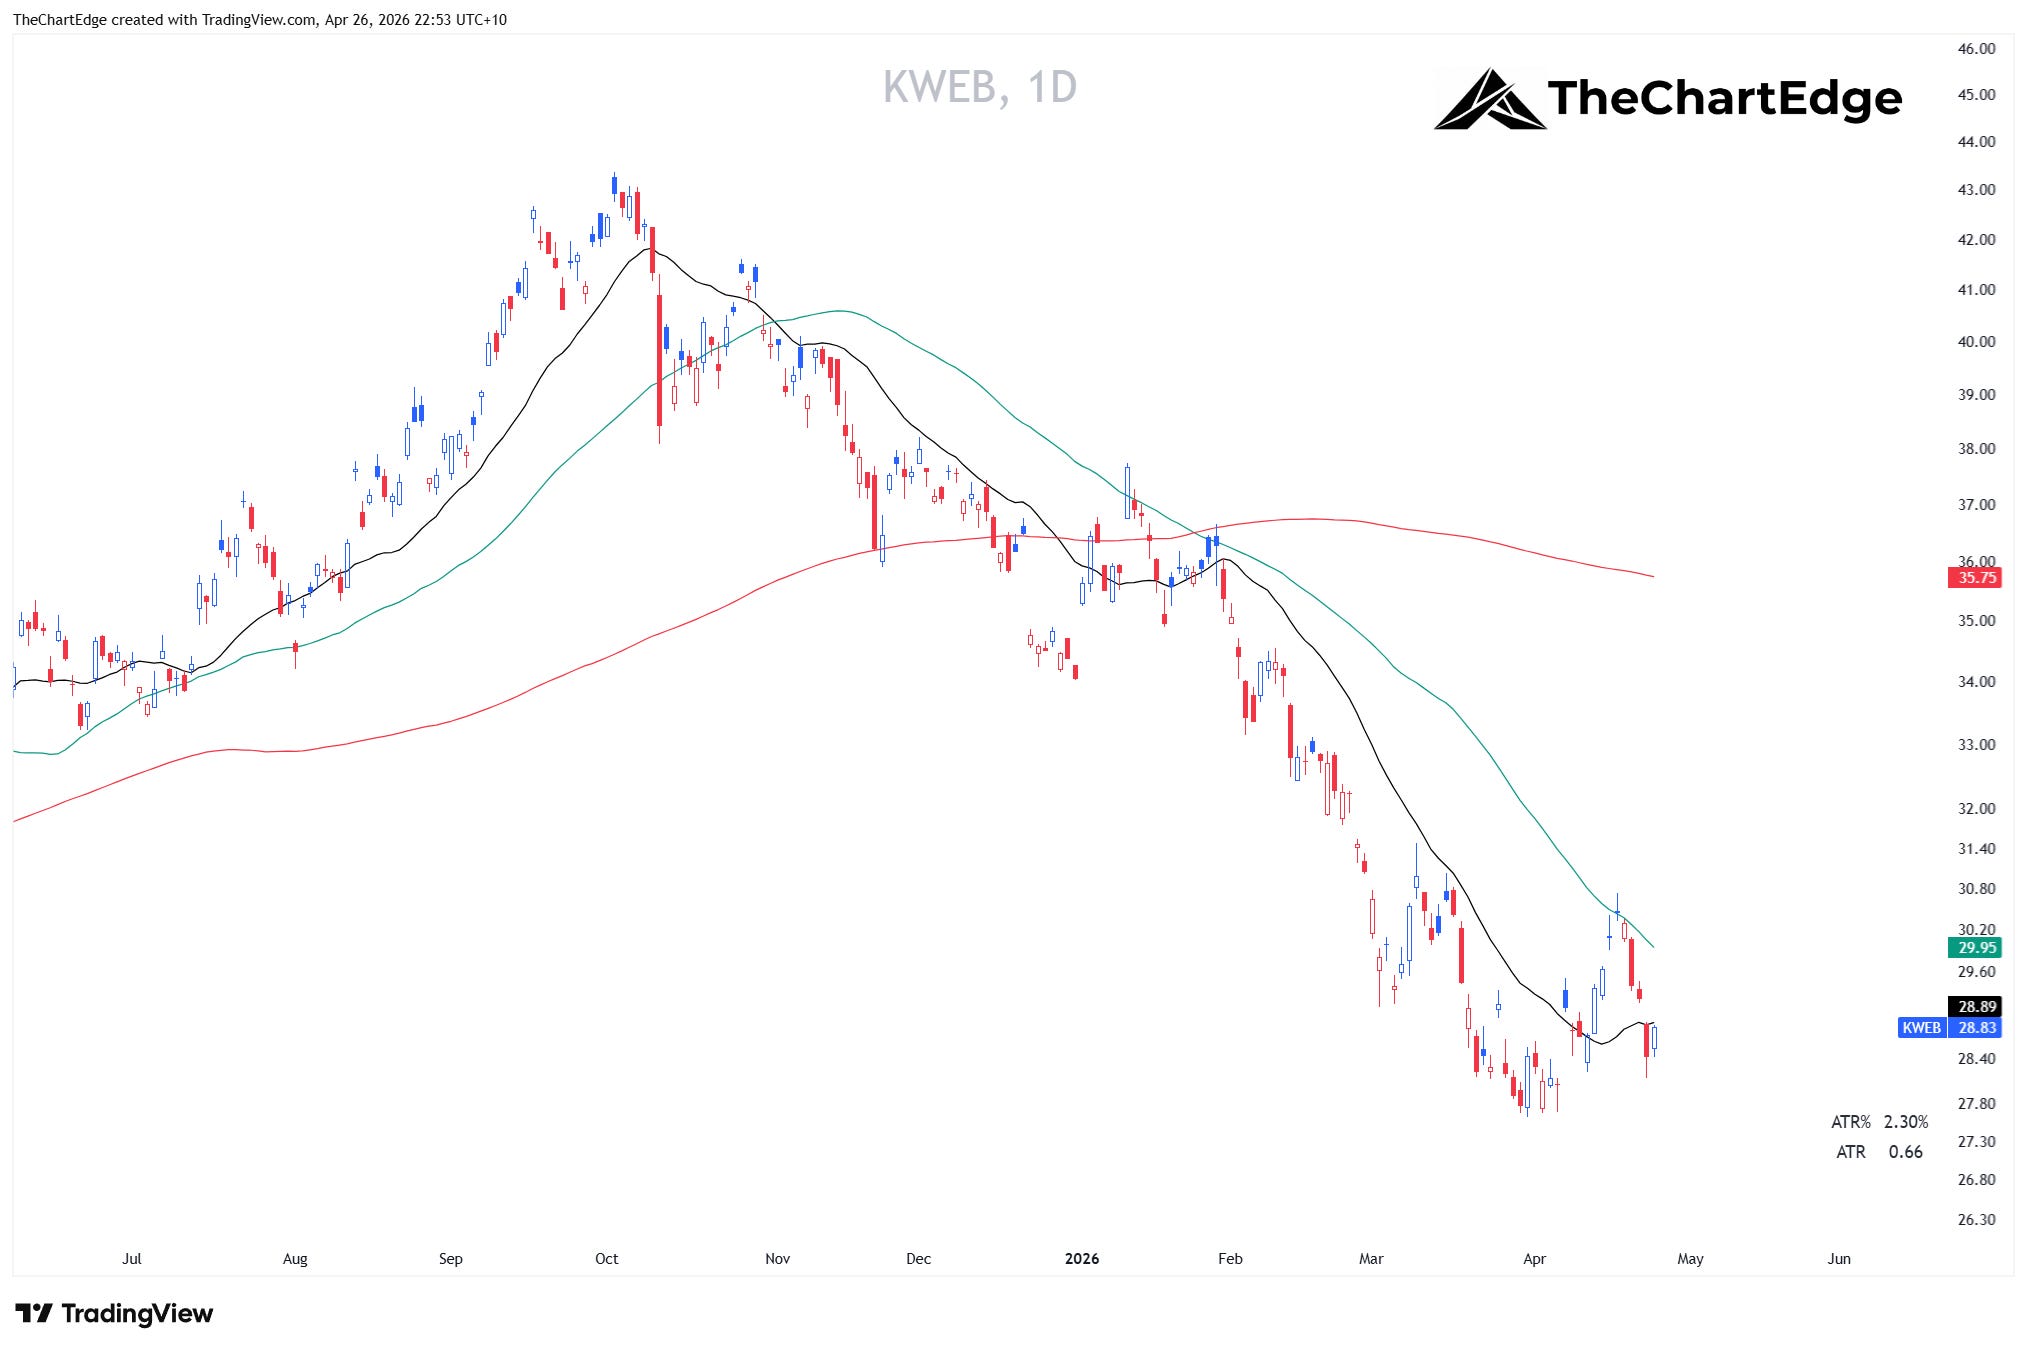
Even within KWEB, the names that are technically outperforming their peers - JD, Baidu, Alibaba, Trip.com - mostly have Downtrend or Weakening trend states. They look relatively good only because the rest of the universe is worse.
Financials are another divergence story worth mentioning. XLF (the Financials sector ETF) is Lagging with a Weakening trend state. Last week XLF dropped 1.93% and is now down 6.22% year-to-date. It got turned away right at its 200-day moving average.
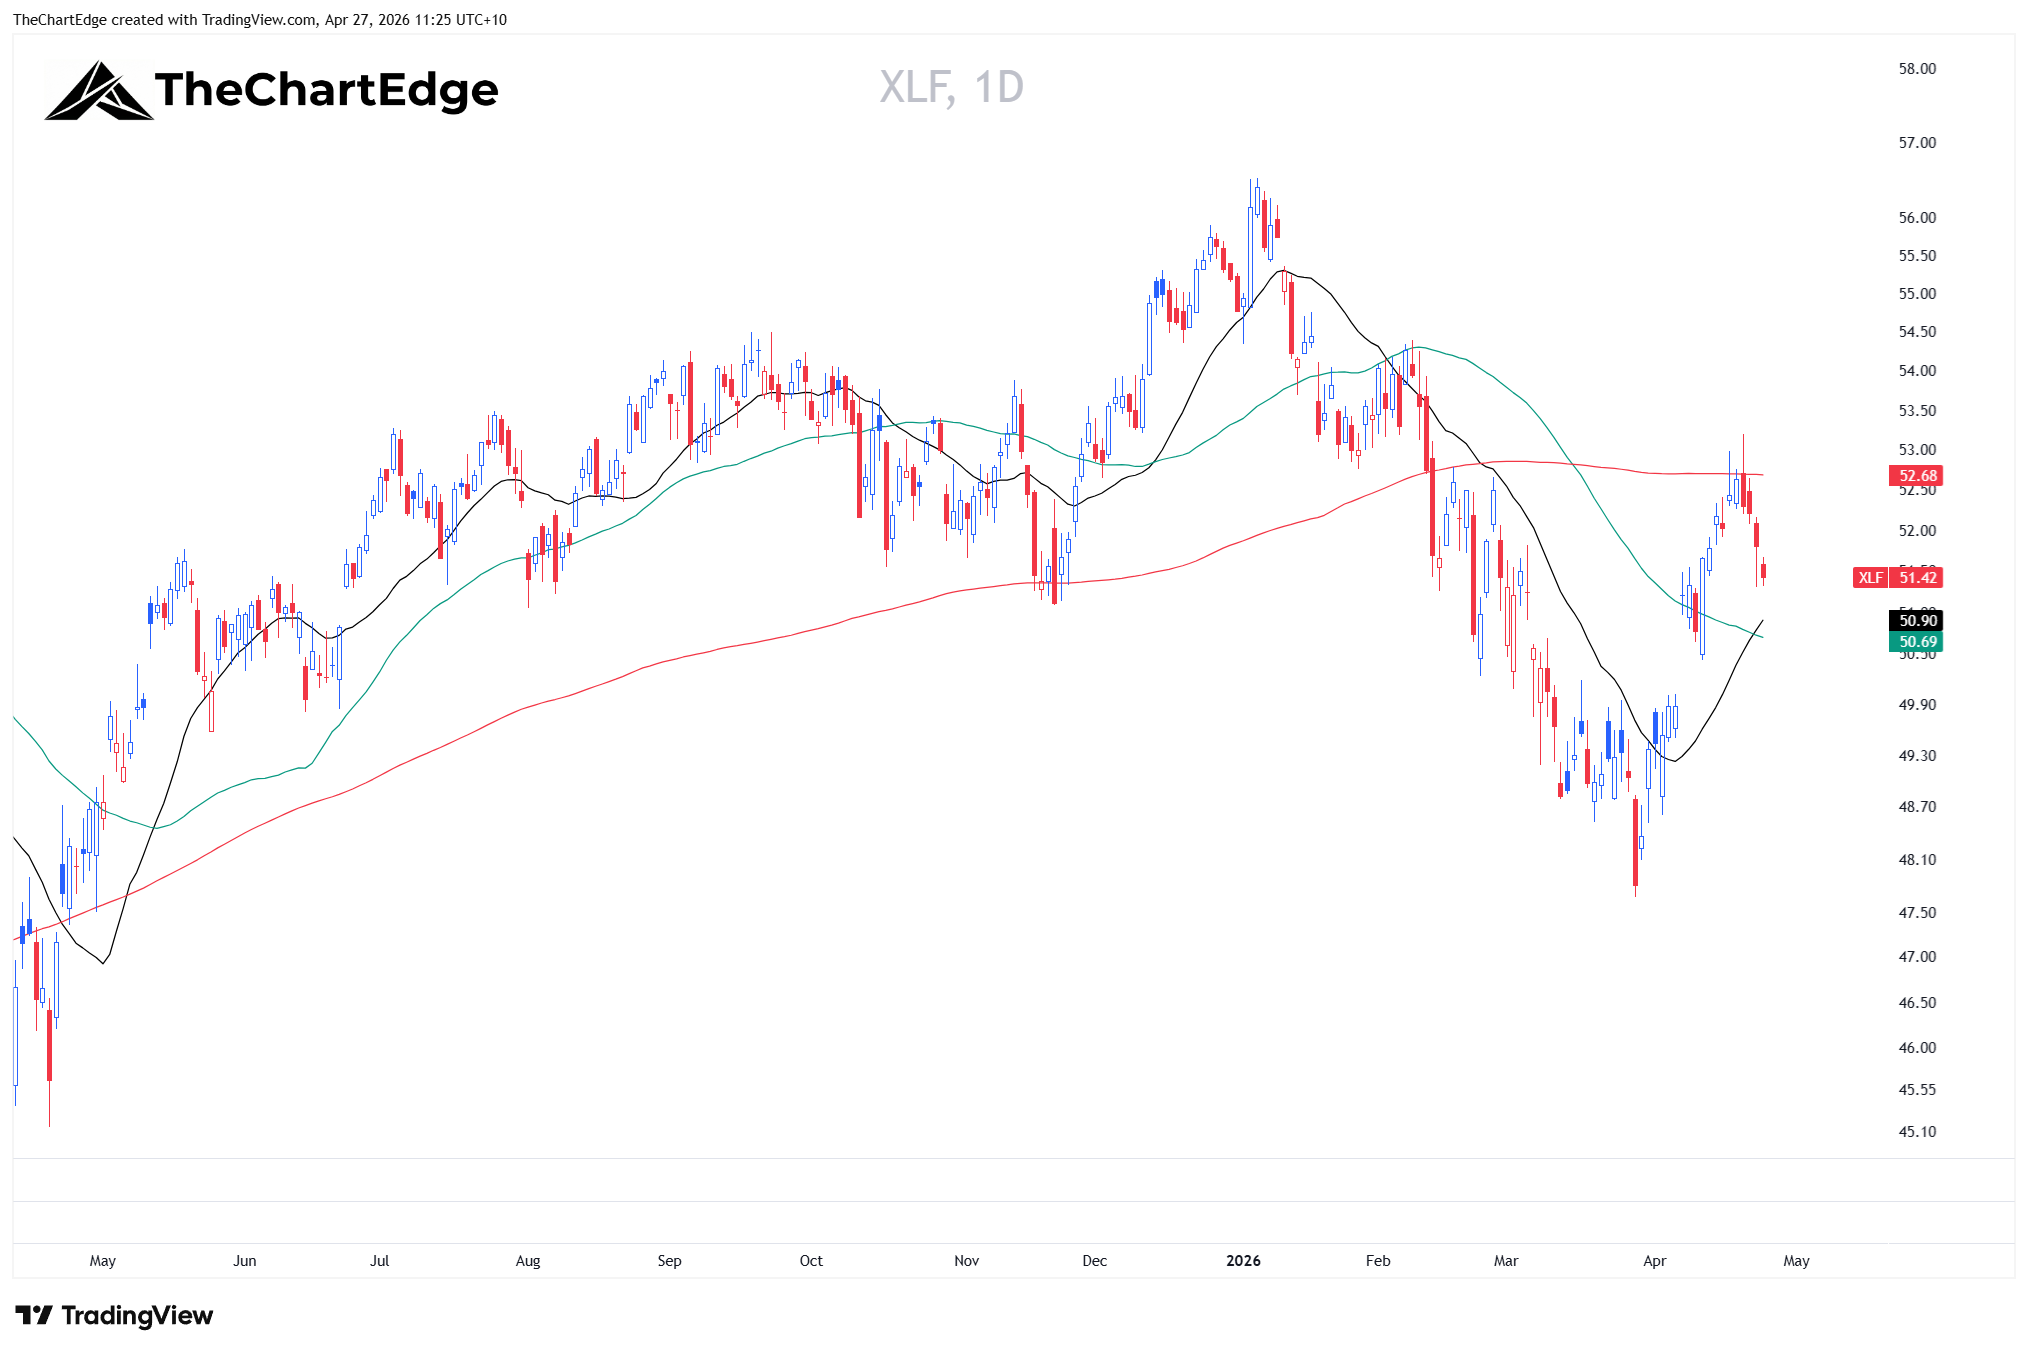
The banks within XLF tell a different story. Goldman, Morgan Stanley, Citi, State Street, and BNY Mellon are all Leading with Strong Uptrend trend states. JPMorgan - the largest US bank - is also Leading but still in a Recovering Uptrend. Bank of America is right on the boundary - its momentum reading is 0.03 below Leading.
What’s dragging XLF down is the non-bank weight - insurance brokers (AJG, BRO - in Strong Downtrends), payment networks like Visa and Mastercard, alternative asset managers (ARES, BX), and brokerages like Schwab.
Energy was the reversal story of the week. In last week’s post I highlighted the energy complex as the area where rotation was clearly moving away from - USO (crude oil) fell over 7% while SPY gained over 4.5%.
However the bounce back was strong, USO gained 14.10%.
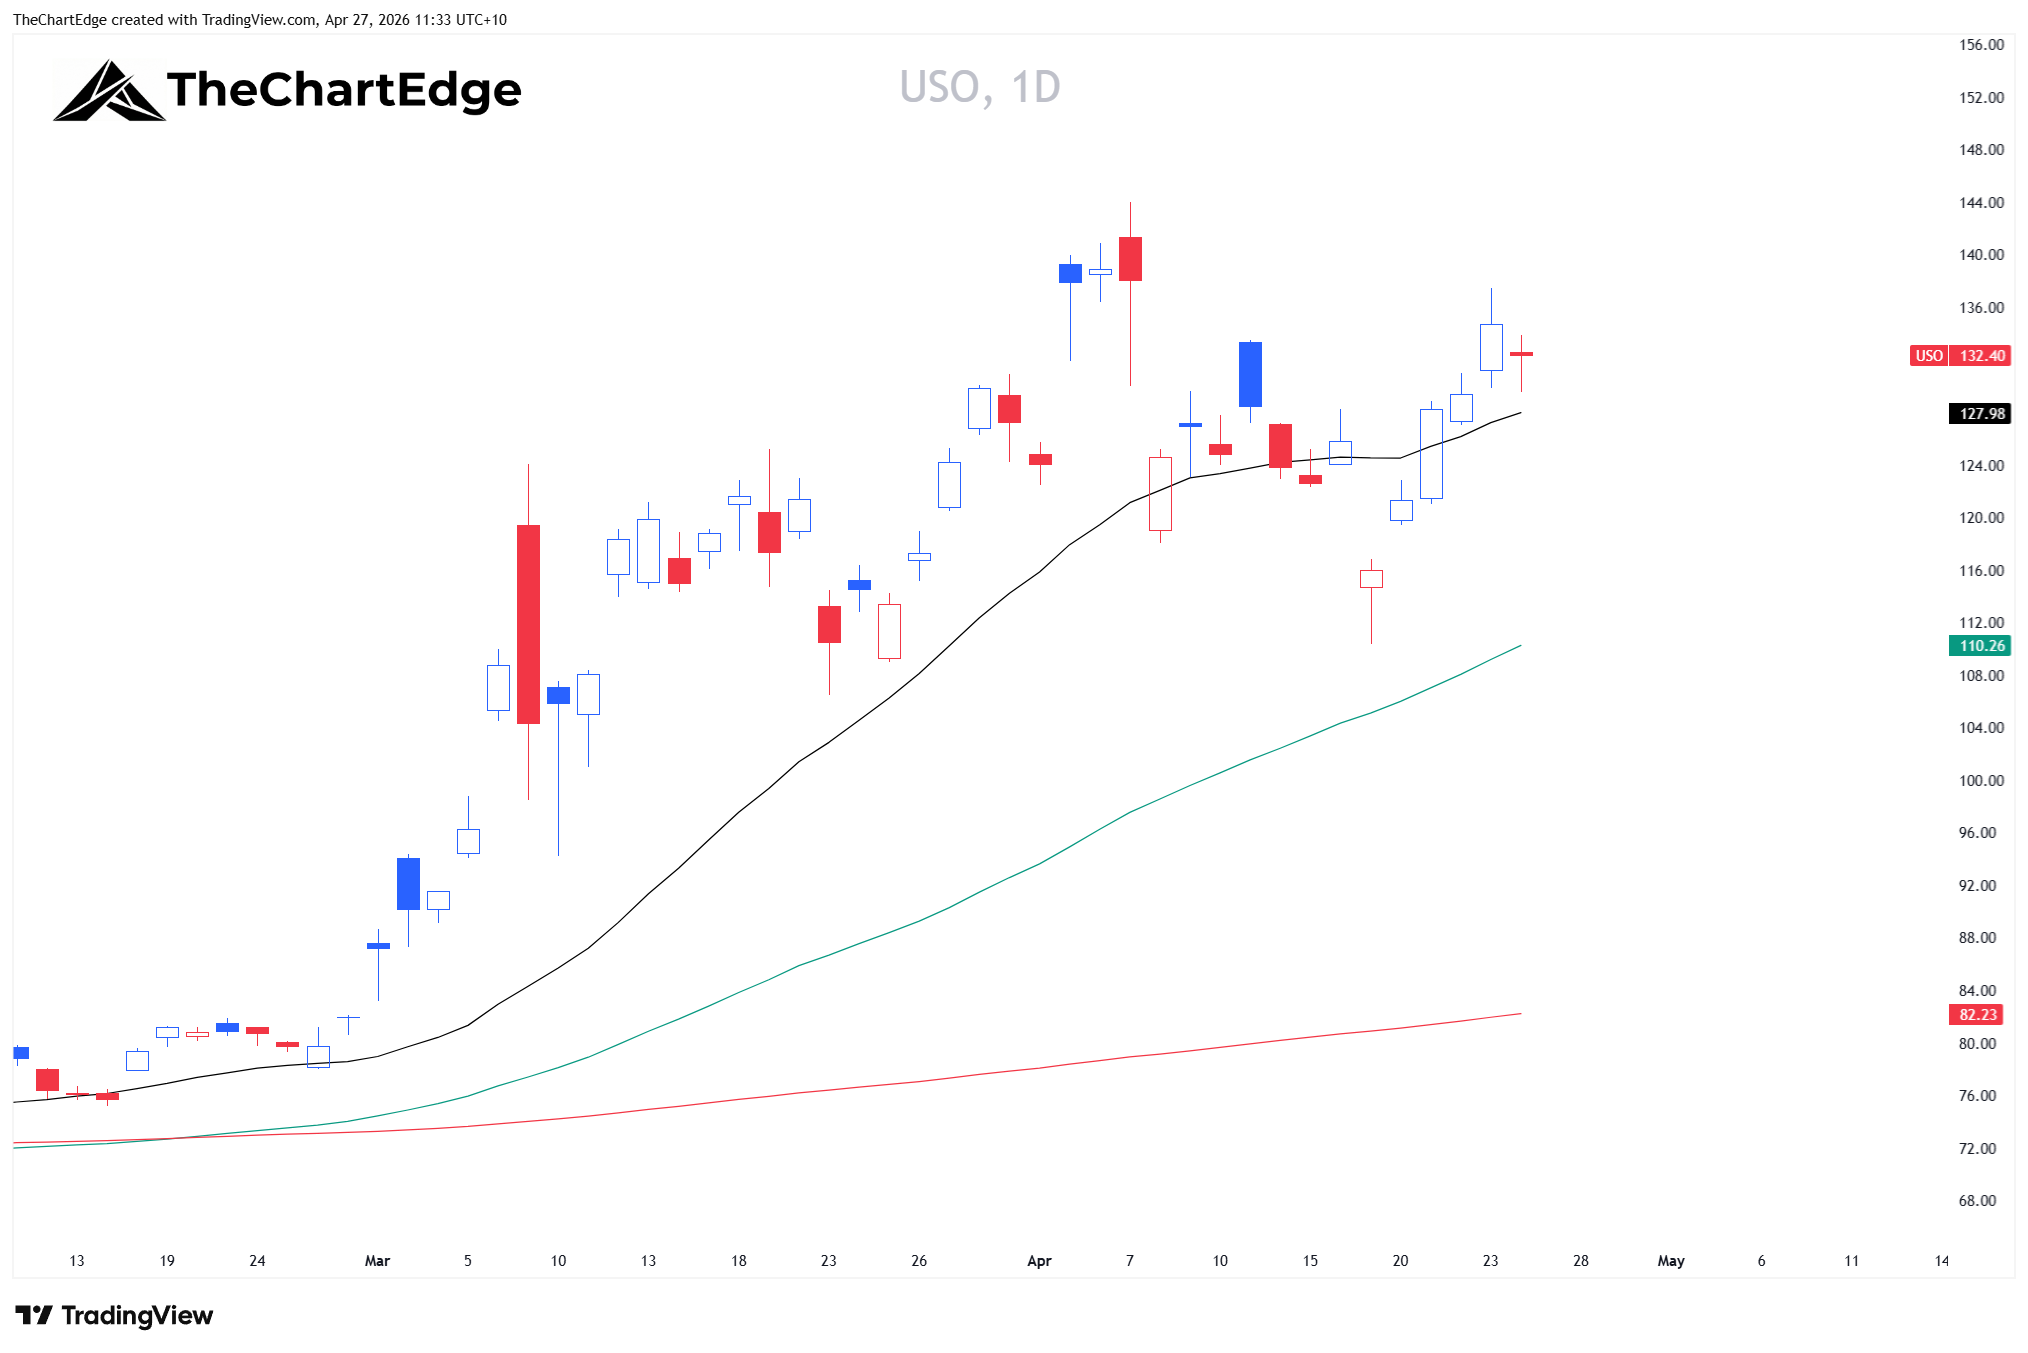
USO has the strongest longer-term relative performance reading in the entire 121-ETF universe. Meanwhile UNG (natural gas) continues to fall with a Strong Downtrend - two energy commodities, two completely different stories.
In the mining and metals space, the picture has shifted. Last week lithium (LIT), rare earths (REMX), and uranium (URA) were all Leading. This week all three lost that status as their momentum faded below 100, moving them into the Weakening quadrant (still outperforming on trend, but the acceleration has paused).
However, all three are still in Strong Uptrend trend states. The longer-term relative performance is intact; the acceleration has just paused. Worth keeping an eye on. That’s a different character from the precious metals complex. Gold (GLD) and gold miners (GDX) have dropped to Neutral trend states - the moving averages have lost their directional bullish alignment and price is below both the 20 and 50-day SMAs. Silver (SLV) and silver miners (SIL) are in slightly better shape at Recovering Uptrend, but the momentum declines were sharp across all four - GLD was down 2.84% last week, GDX down 5.98%, SLV down 6.57%, and SIL down 6.05%.
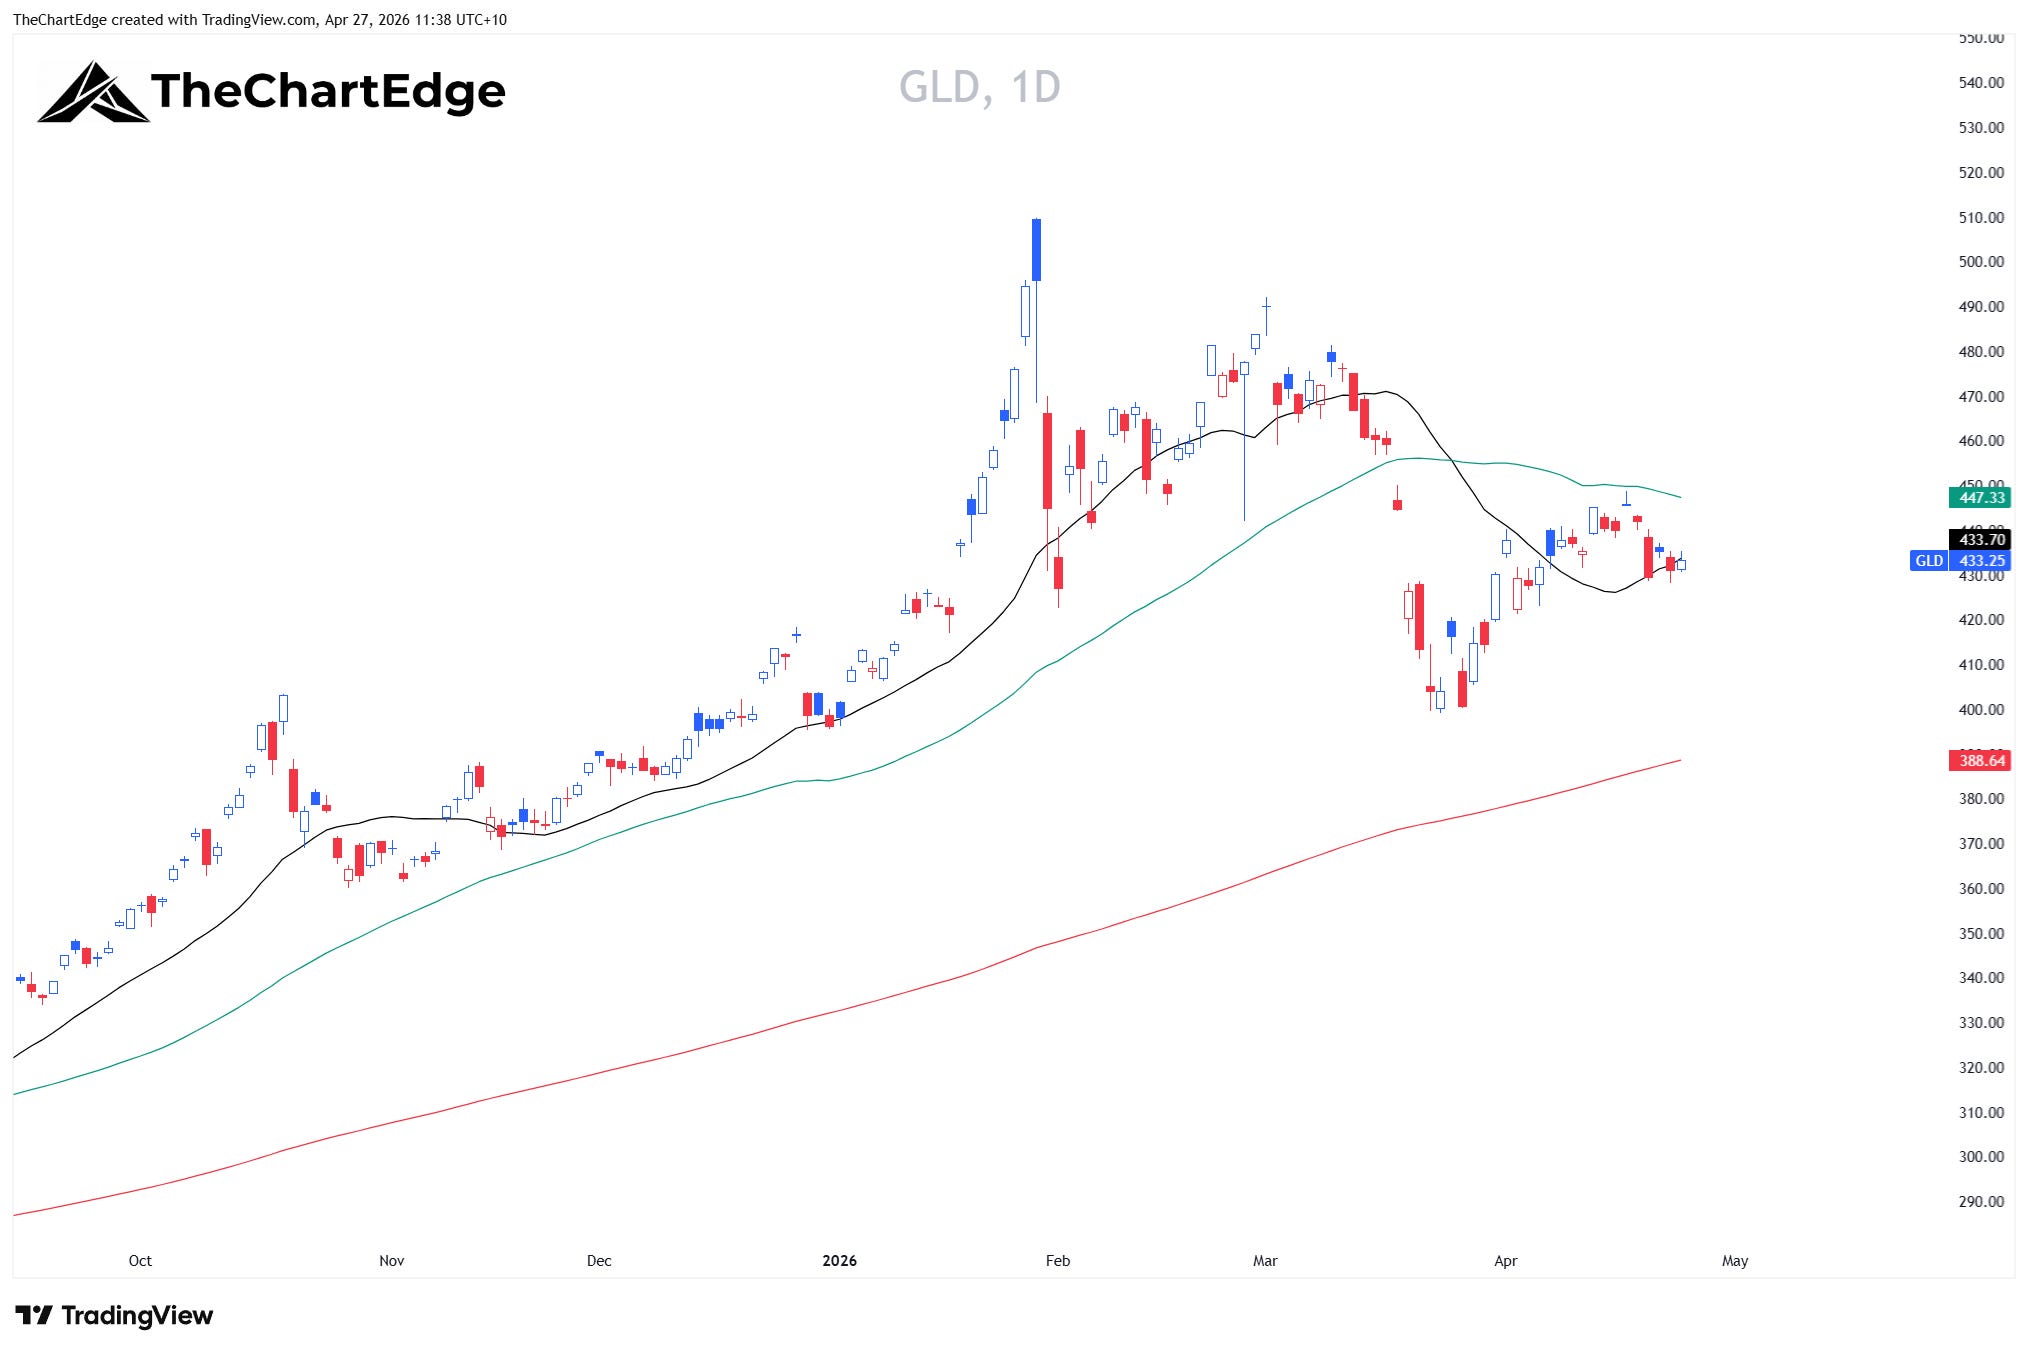
GLD’s relative strength reading on a trend basis is less than a point above the boundary between Weakening and Lagging. If it crosses below next week, it moves from “still outperforming but fading” to “underperforming.”
A few other notable moves. ARKK and ARKG, which I mentioned last week as approaching the Leading boundary after double-digit weekly gains, both dropped back to Lagging. ARKK fell 3.45% with a Weakening trend state, and ARKG fell 4.06% with a Recovering trend state. The deep-Lagging names to avoid remain the same as recent weeks: UNG, KWEB, and IHI (Medical Devices, down 15.12% YTD in a Strong Downtrend). Healthcare broadly remains the weakest GICS sector.
So we have the Market Temperature in Surge territory, with leadership concentrated in semiconductors and the AI hardware build-out, while breadth narrows and most major sectors lag. The leading groups are mostly all extended, as is QQQ and SPY. Some more consolidation or an orderly pullback in the coming week(s) would be optimal for any new entries. If we push higher from here without the SMAs catching up the risk of mean reversion increases.
I’ll be posting a drill-down piece later today or tomorrow looking at what the component-level data reveals underneath some of these ETFs.
As always, I am open to all possibilities. Stay open minded and manage risk tightly.
Hope everyone has a great week!
Cheers,
Marcus Grant, CFTe
Disclaimer: The content provided in this newsletter is for informational and educational purposes only and should not be considered as financial, investment, or legal advice. The information shared is based on our research and analysis, but we are not a licensed financial advisor, nor can we guarantee its accuracy, completeness, or timeliness. Market conditions and financial instruments can change rapidly, and any opinions expressed may not be suitable for all investors. Any opinions expressed and or securities mentioned do not constitute a recommendation to buy, sell, or hold that or any other security. You should conduct your own due diligence and consult with a licensed financial advisor or other professional before making any investment decisions. Past performance is not indicative of future results, and all investments carry the risk of loss. The authors and publishers of this newsletter are not responsible for any financial decisions made based on the content provided herein. By reading and or subscribing to this newsletter, you acknowledge and agree that you are using the information at your own risk.