


Last week (ending July 10) the S&P 500 (SPY) rose 1.4%, the Nasdaq 100 (QQQ) 1.8% and FANG+ (FNGS) 2.4%. The Dow (DIA) fell 0.4%, the equal-weight S&P 500 (RSP) 0.3%, the S&P MidCap 400 (MDY) 0.6%, the Russell 2000 (IWM) 0.5% and microcaps (IWC) 1.1%. A week after the all-time-high list was dominated by healthcare, financials, value and the Dow, money rotated back into the mega-caps, tech and AI.
SPY Chart
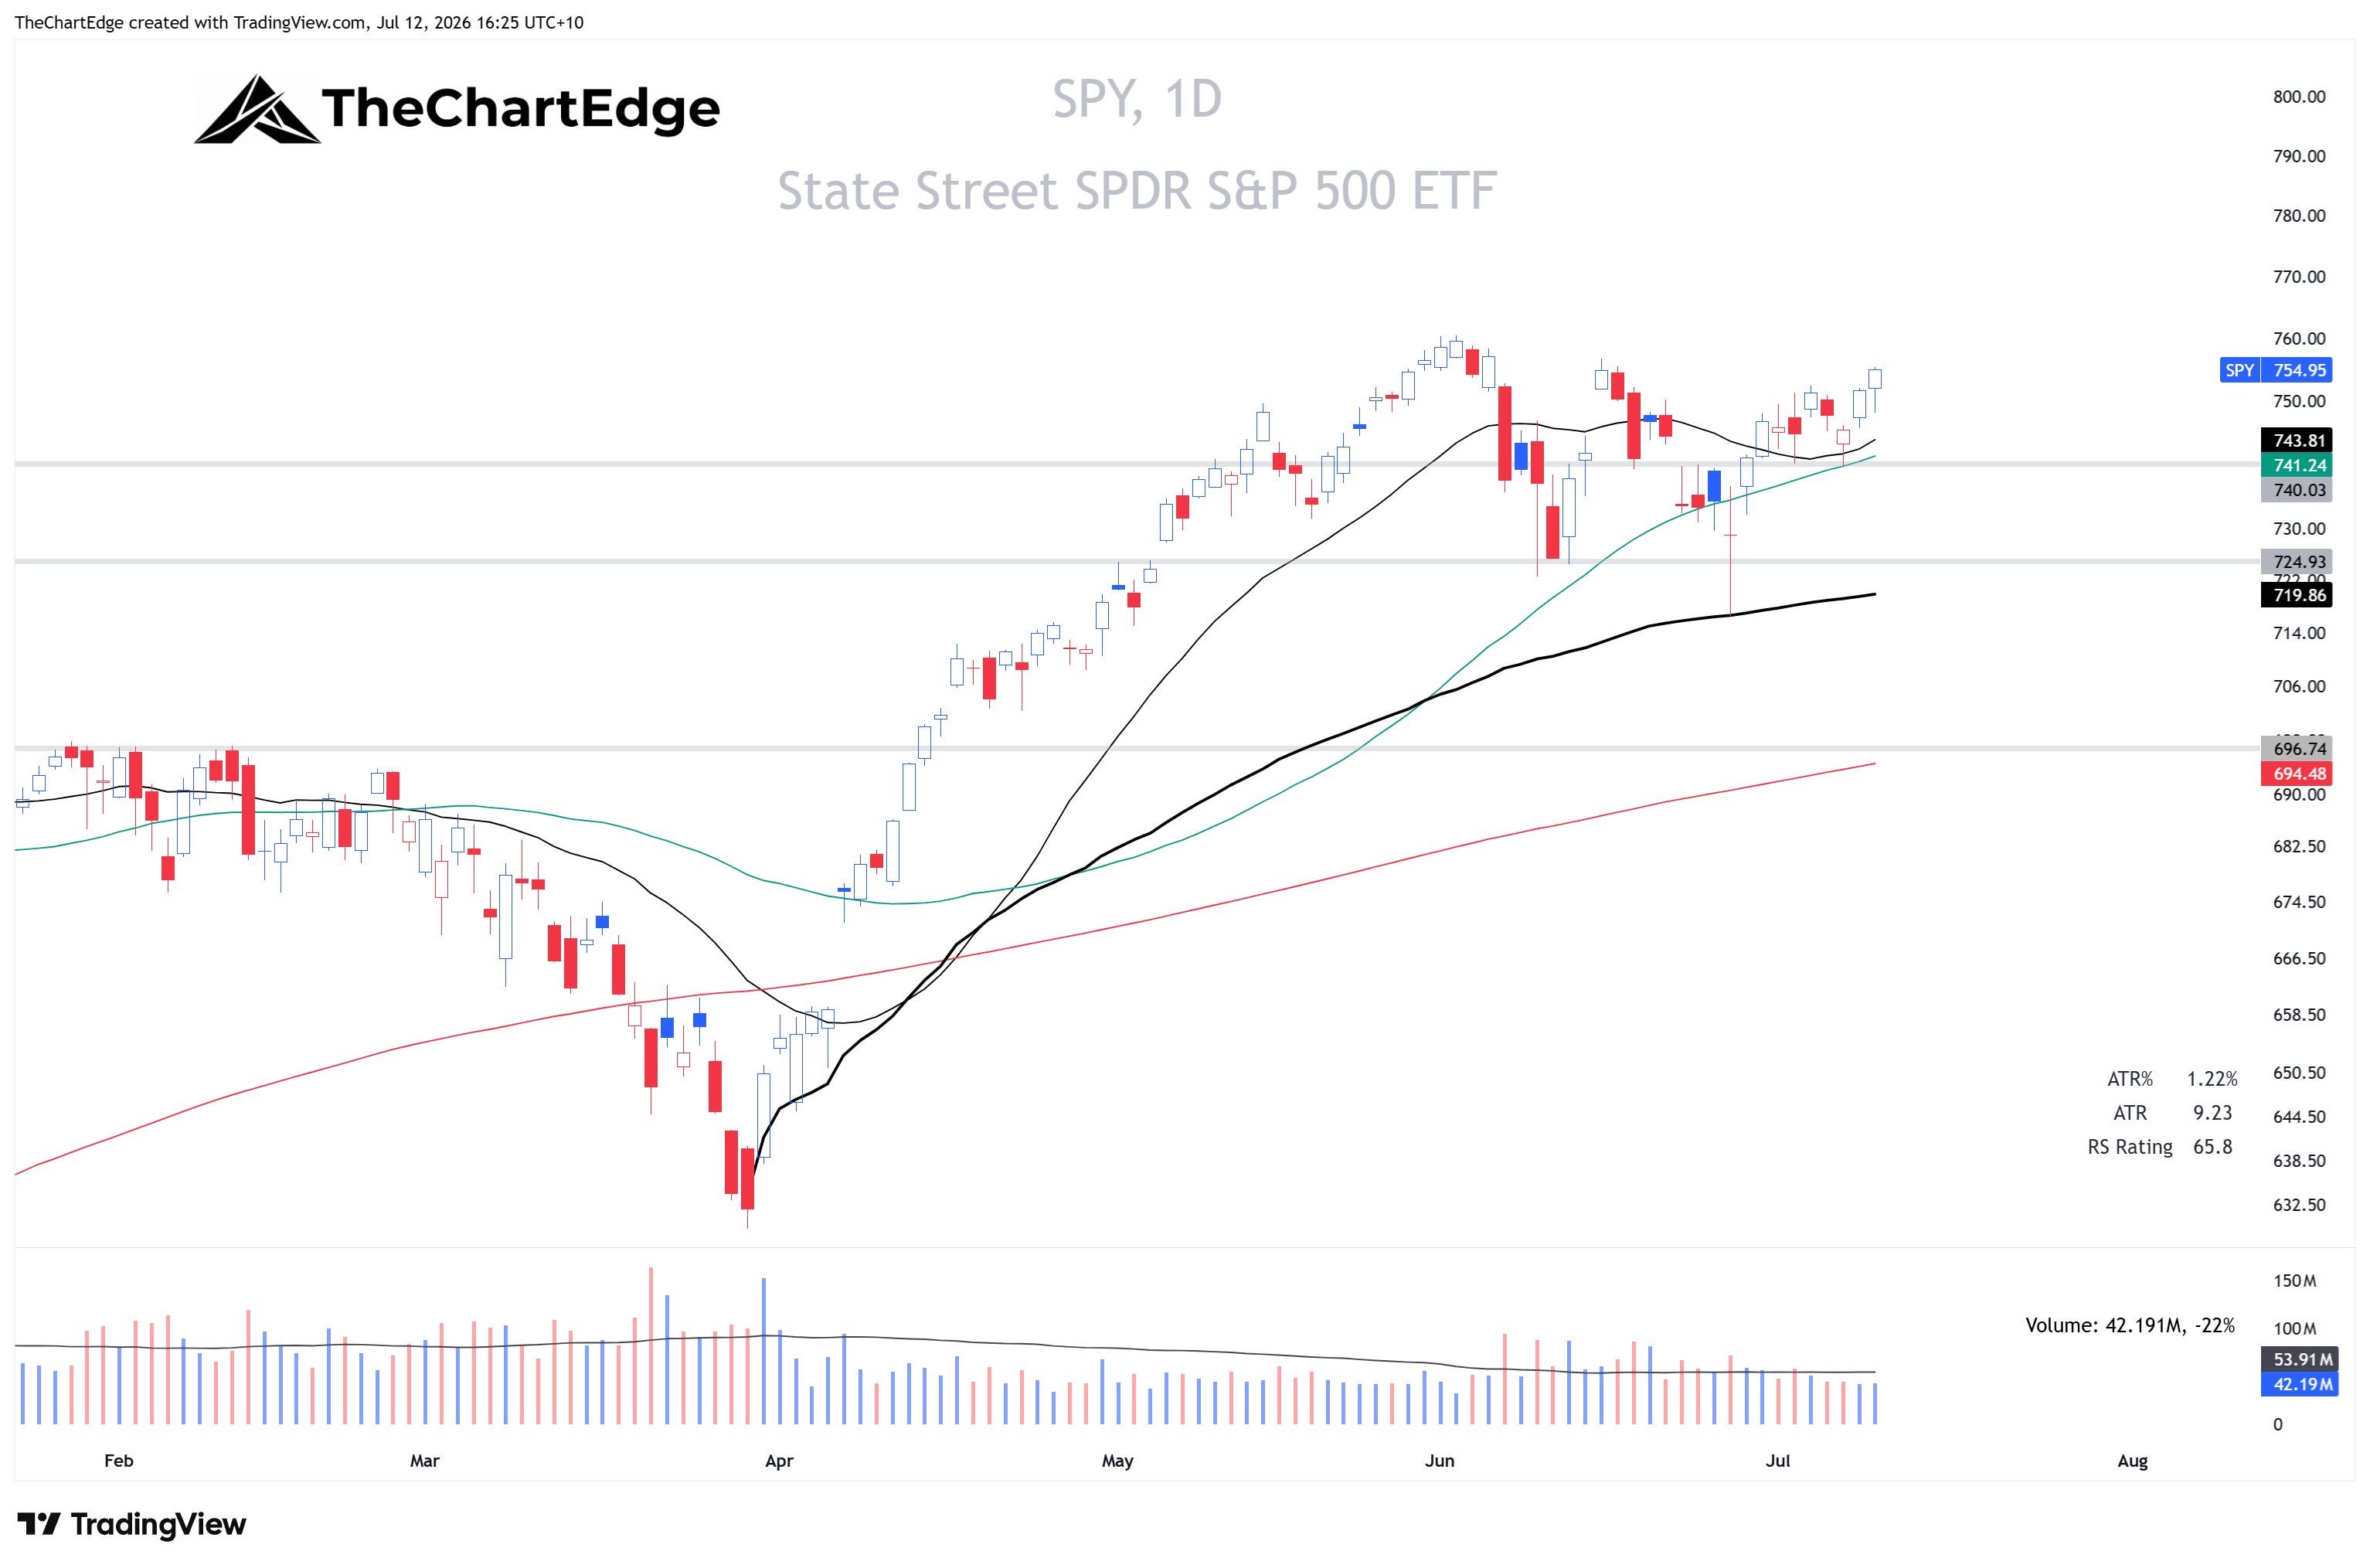
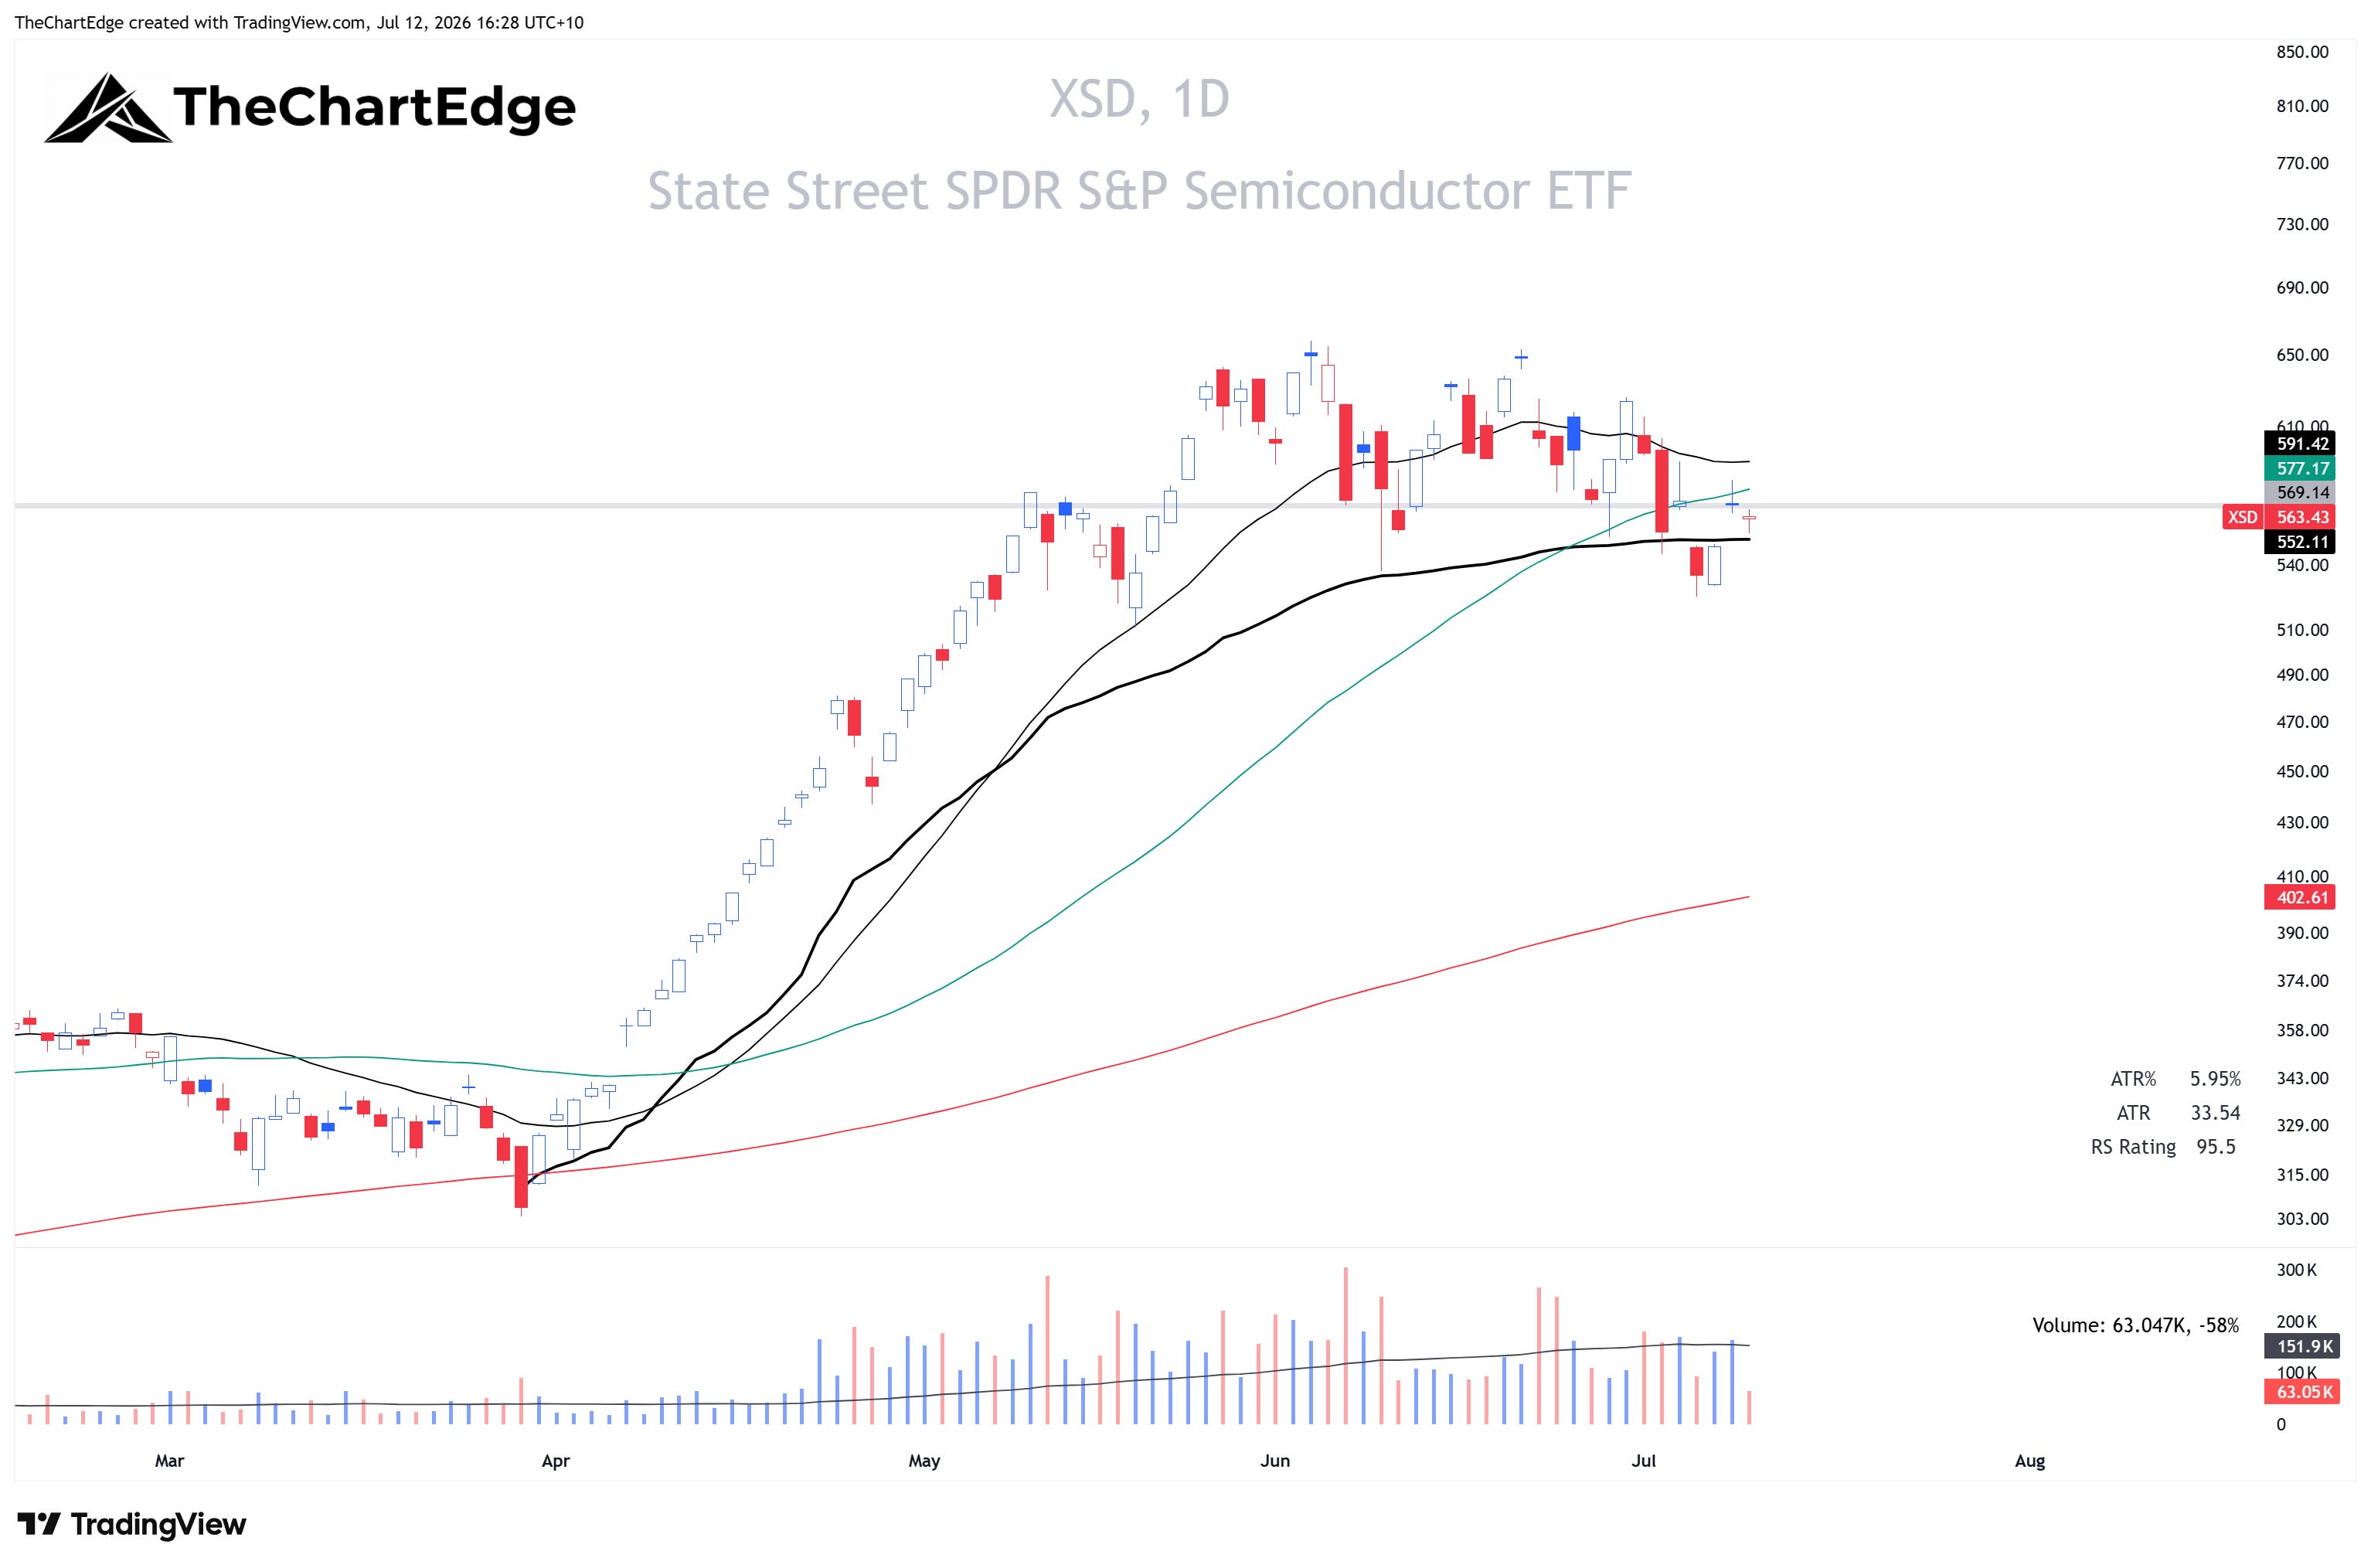
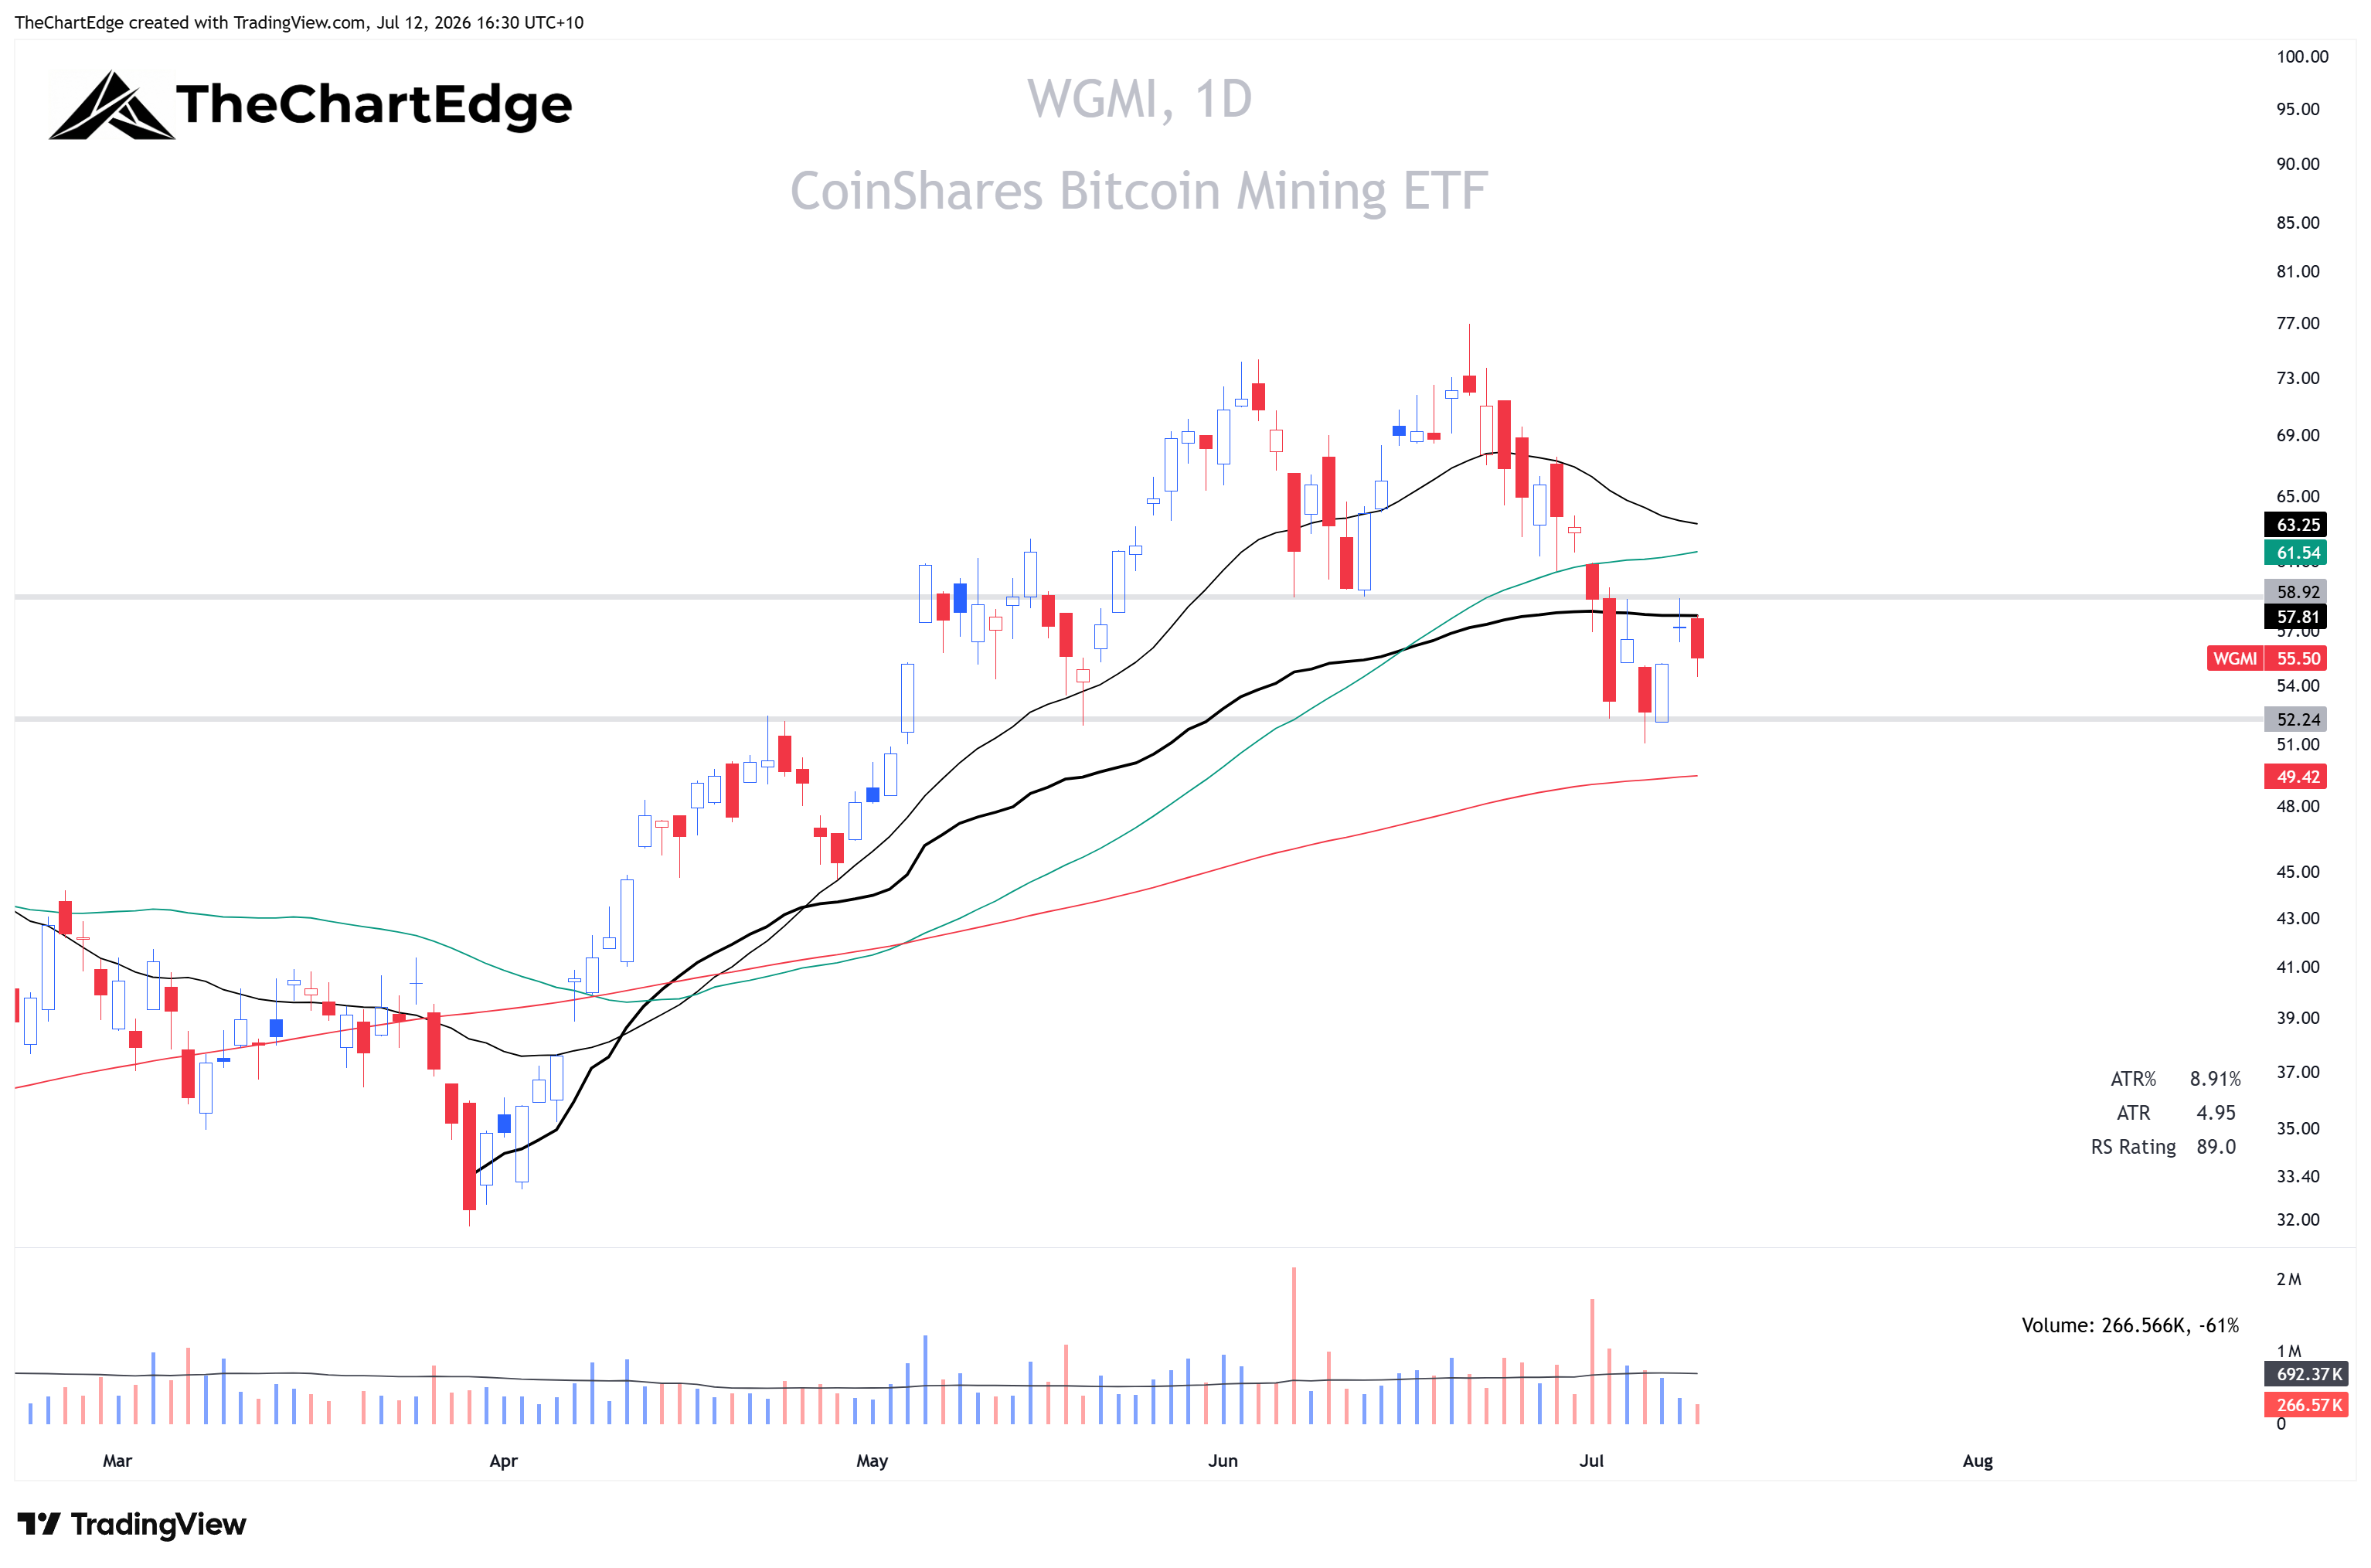
For all daily charts the black line is the 20-day SMA, the green is the 50-day, and the red is the 200-day. The thick black line is the AVWAP from the March 30 low.
SPY held its 50-day SMA on Wednesday during the midweek pullback and finished the week strongly, closing less than 1% from an all-time high.
QQQ Chart
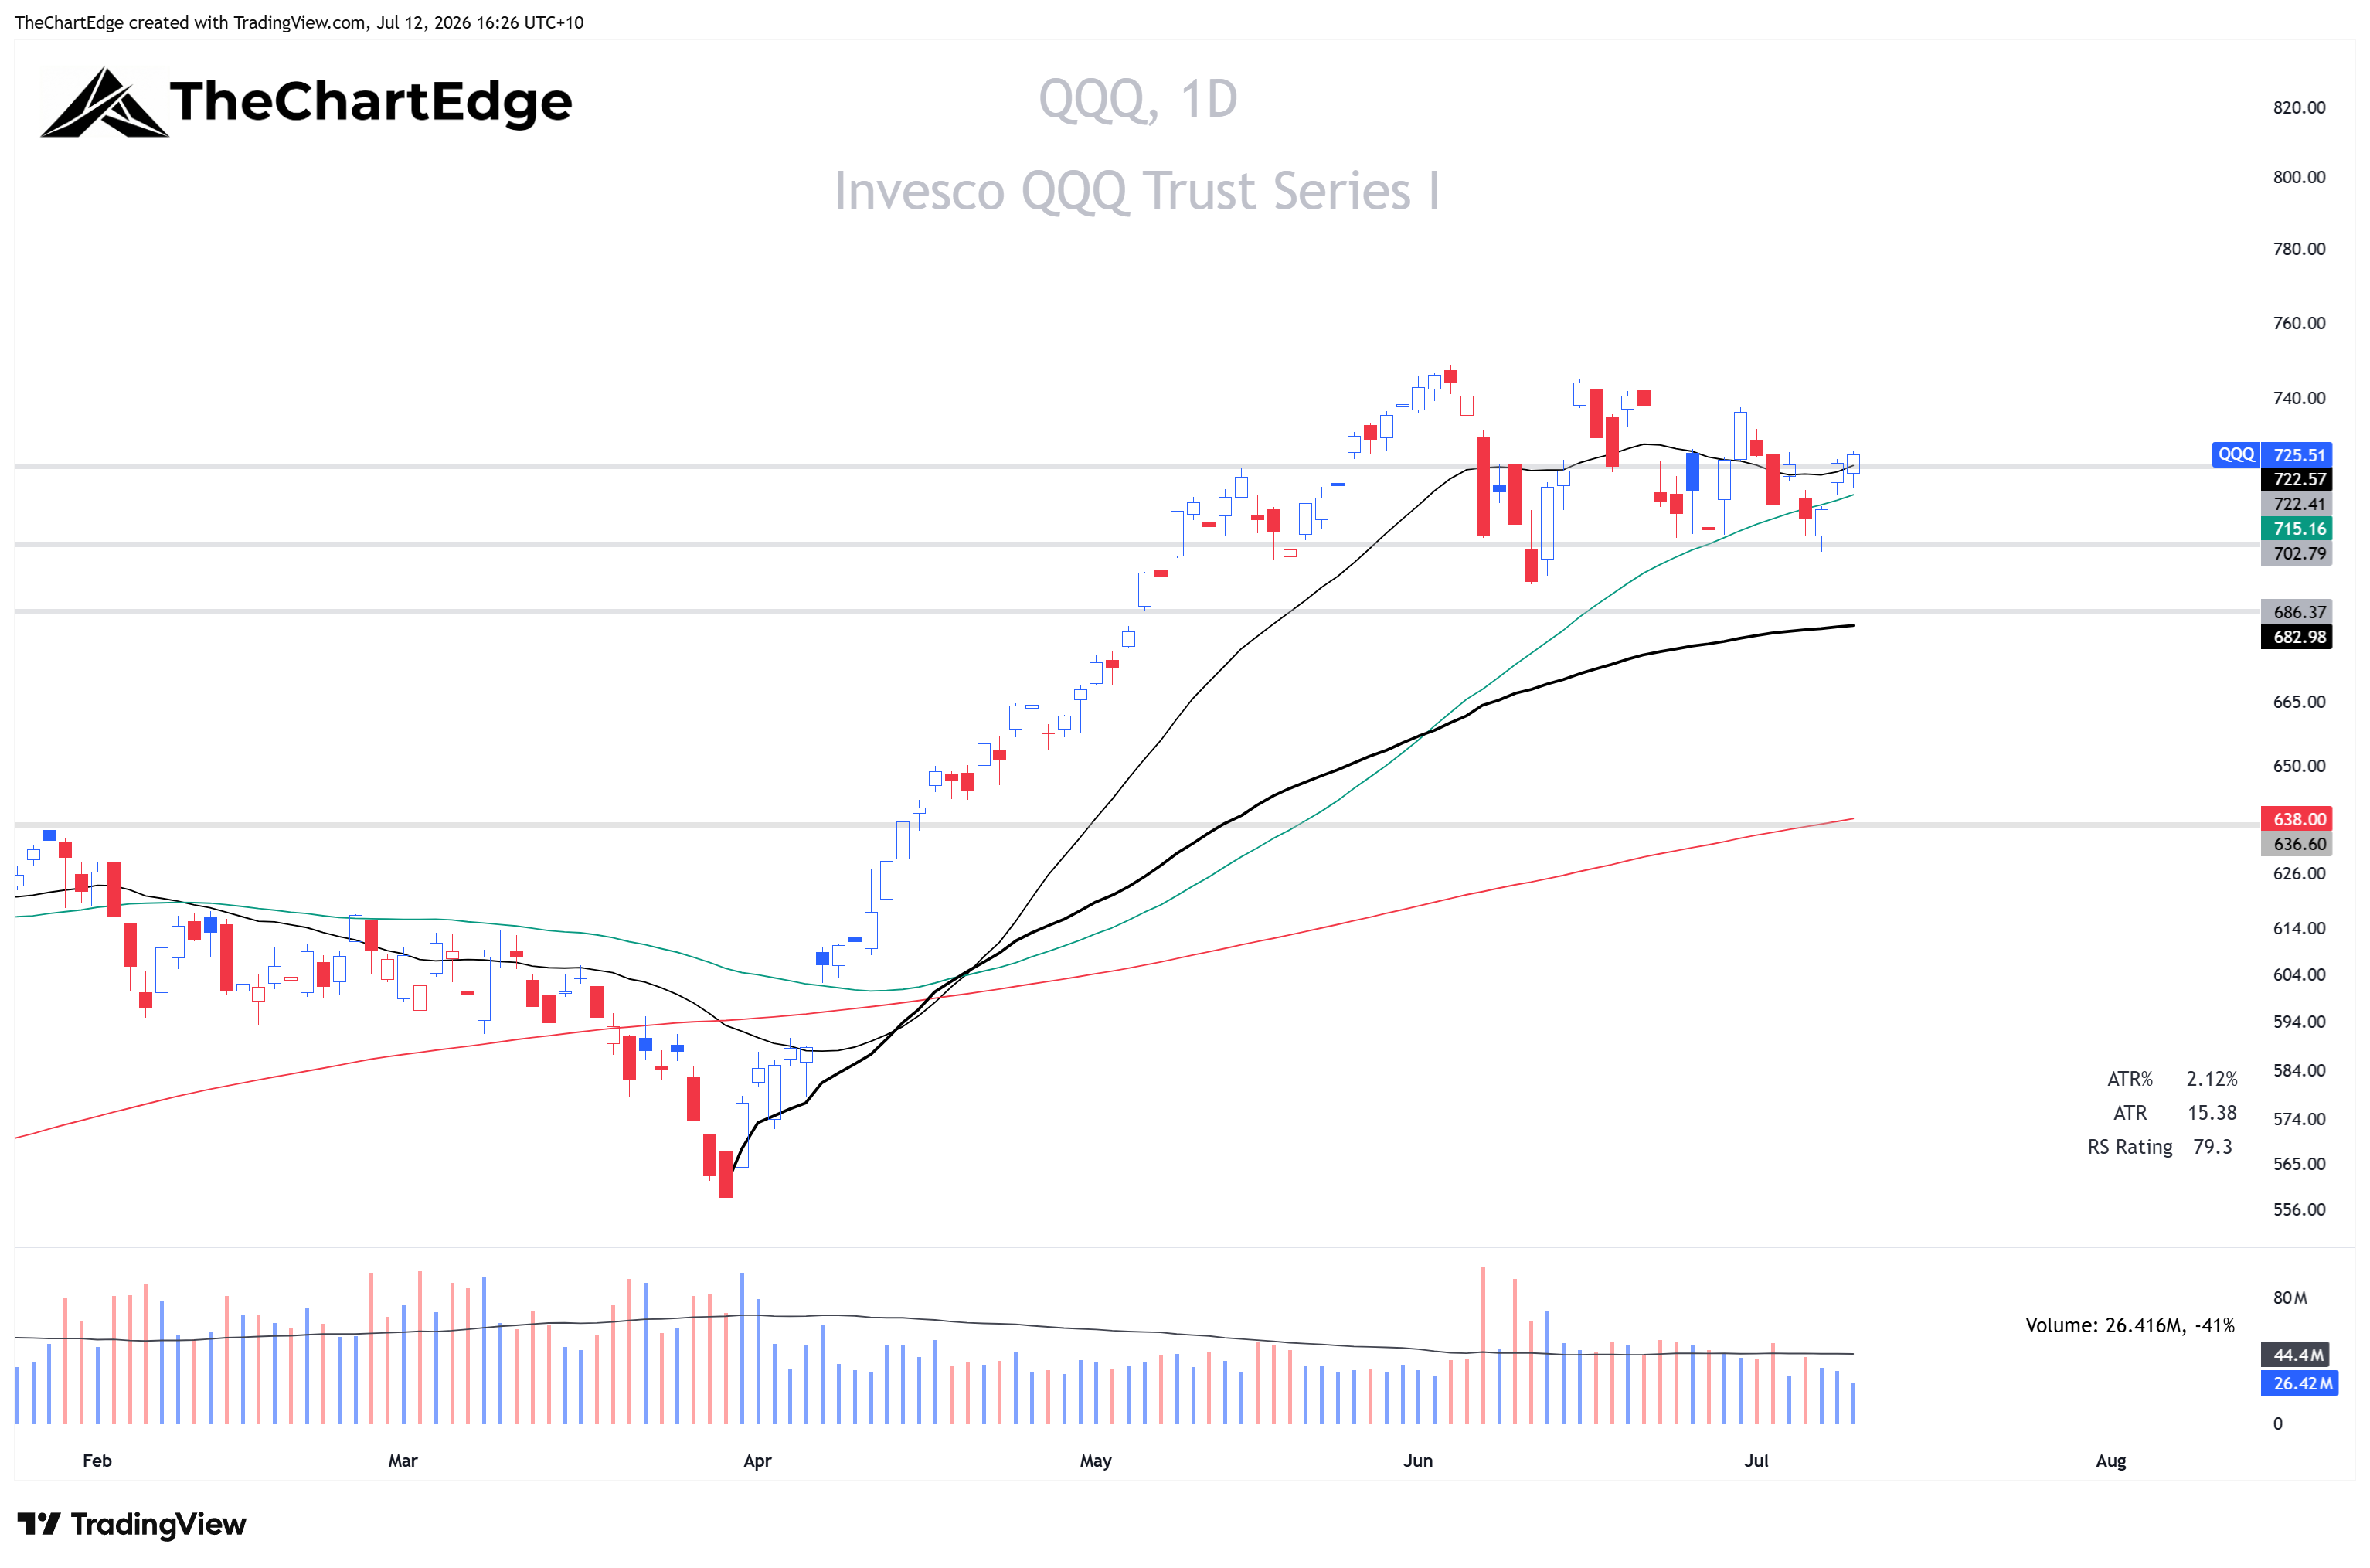
QQQ closed below its 50-day SMA on Tuesday and failed to reclaim it on Wednesday, despite having a strong day after the initial gap down. But it also finished the week strongly, closing just back above its 20-day SMA, and is back in a Strong Uptrend.
Market Temperature
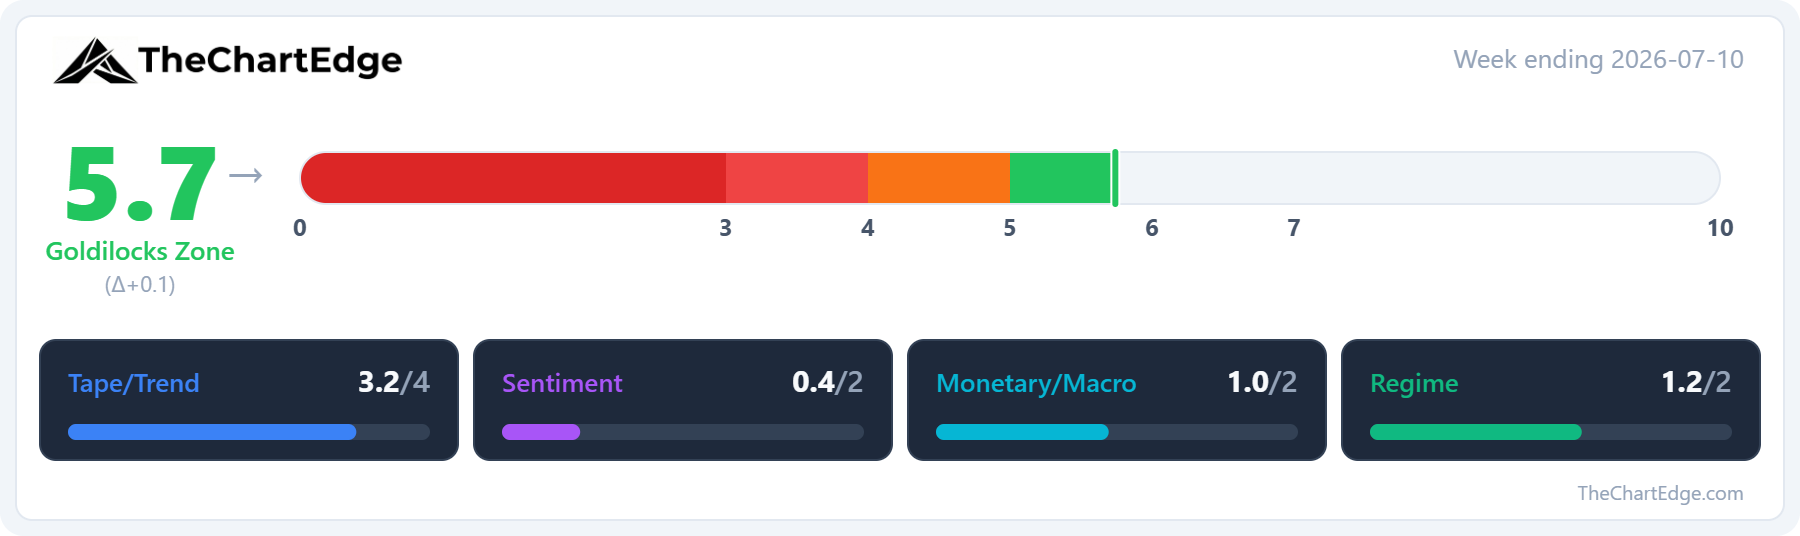
The Market Temperature came in at 5.7, up from 5.6, holding in the Goldilocks Zone. On the surface almost nothing changed. Underneath, the pillars mostly offset each other.
The Tape/Trend pillar firmed. The QQQ moved from an Uptrend back to a Strong Uptrend and the SPY’s weekly RSI rose to 65.1 from 62.7. Breadth eased slightly, with 58.4% of US stocks above their 50-day moving average, from 59.4%, and 57.9% above their 200-day, from 59.1%.
The Regime pillar improved as the discretionary vs staples ratio (XLY/XLP) continued to turn up. High beta vs low volatility remains risk-on, and growth vs value still scores in value’s favour - though growth outperformed on the week itself, with Russell 1000 Growth (IWF) up 2.3% and Value (IWD) flat, but the ratio is still below its moving averages, so the model’s signal hasn’t flipped.
Sentiment and Monetary/Macro went the other way. The VIX fell to 15.0 from 15.8, which the model reads as a contrarian negative. Bond volatility edged up, with the MOVE index at 69.6 from 65.4, and the dollar ticked higher.
GICS Sector Relative Strength
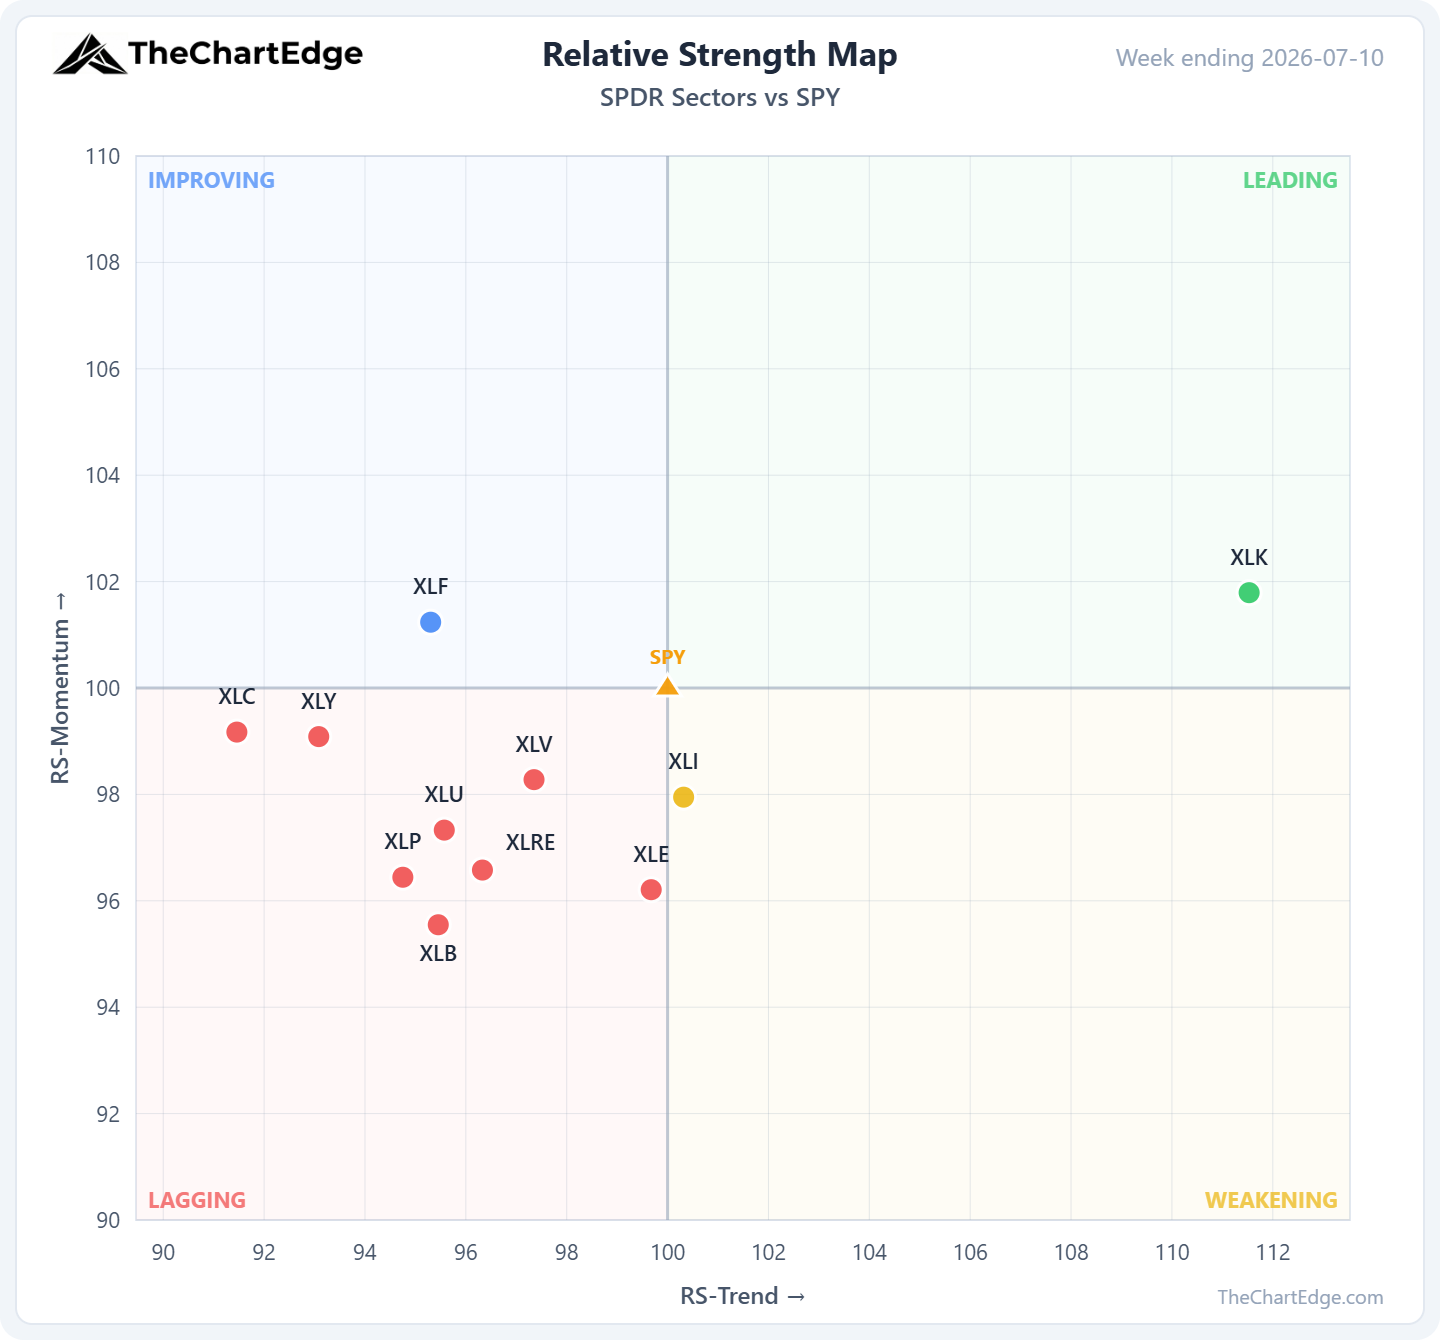
Technology (XLK) is back in Leading, up 2.9% on the week, after spending two weeks in Weakening. It’s the only sector there. Industrials (XLI) crossed out of Leading into Weakening after a 1.1% decline.
Financials (XLF) is the only sector in Improving, up 0.2% on the week.
The other eight sectors are all in Lagging. Health Care (XLV) fell 1.8% and dropped out of Improving, as did Discretionary (XLY), up 0.1%, and Communications (XLC), despite being up 1.9%. Energy (XLE) was the strongest sector on the week, up 3.5%, but remains in Lagging with its RS-Trend just under the 100 line. Materials (XLB) fell 2.2%, Staples (XLP) 1.0%, Utilities (XLU) 0.8% and Real Estate (XLRE) 0.5% - all remaining in Lagging.
Momentum Leaderboard
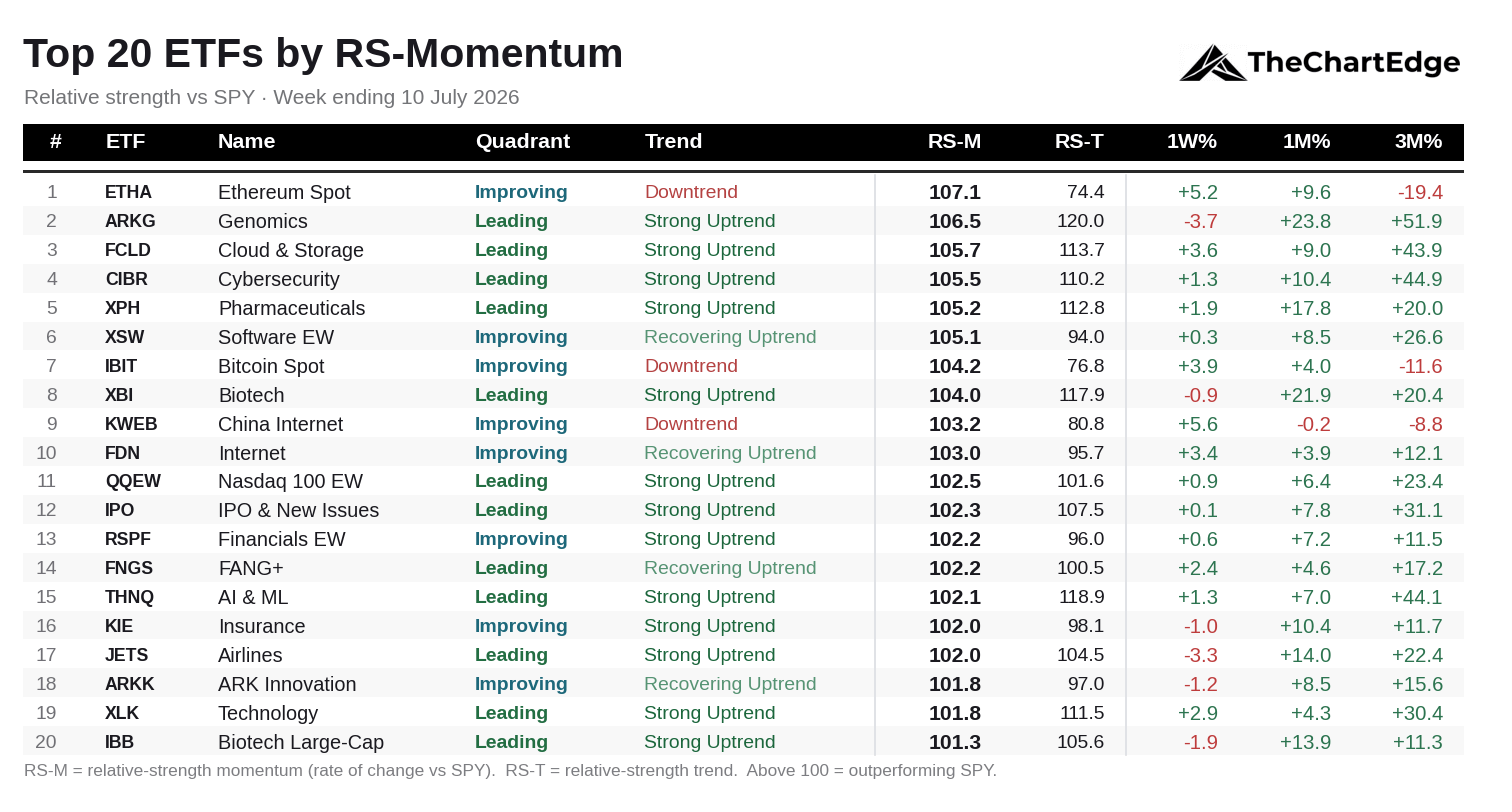
There are eight new names on the board this weekend. Ethereum (ETHA) now tops it, with Bitcoin (IBIT) and China Internet (KWEB) also on the board, but all three are still in downtrends and a long way off their highs.
Technology (XLK), Cloud & Storage (FCLD), AI & ML (THNQ), Internet (FDN), the equal-weight Nasdaq 100 (QQEW), FANG+ (FNGS) and IPOs (IPO) all rejoined the board. XLV fell off the board, but healthcare sub-sectors - ARK Genomics (ARKG), Biotech (XBI), Pharmaceuticals (XPH) and large-cap biotech (IBB) are all still there, as are equal-weight financials (RSPF) and Insurance (KIE).
Trend quality improved. Thirteen of the twenty are in Strong Uptrends, up from nine last week, and only three - ETHA, IBIT and KWEB - are in downtrend states.
Still no semiconductor names on the board for a third straight week. SMH and XSD have RS-Momentum readings of 99.4 and 97.0.
Trend States Across the Universe
Something new I’ll be tracking each week - the count of all 121 ETFs in my universe by trend state.
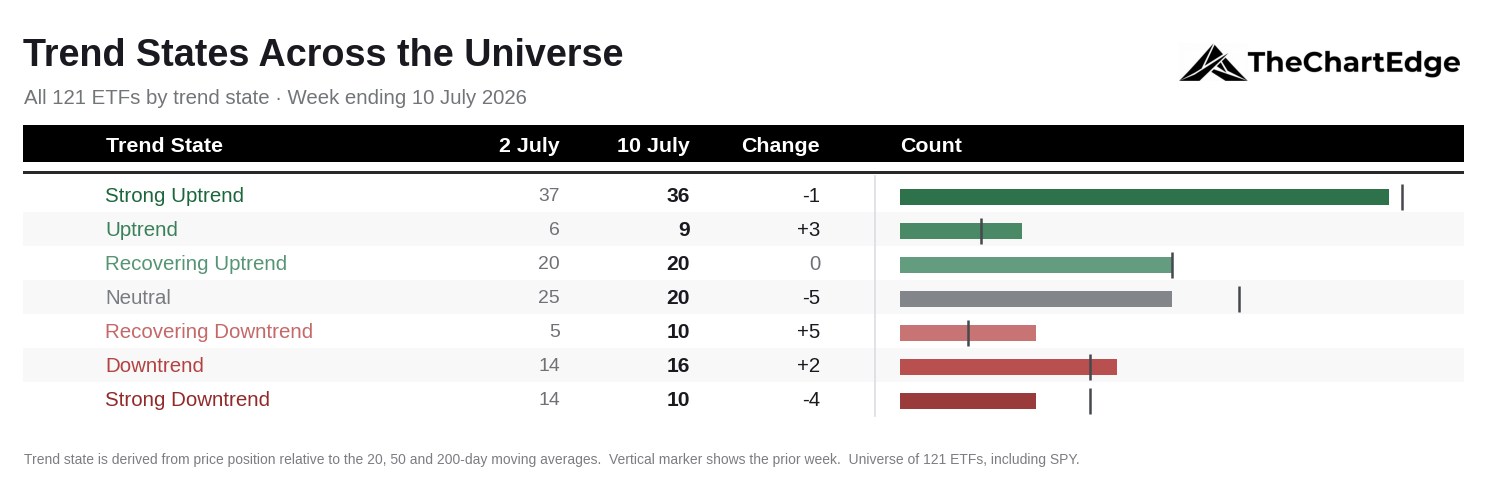
The reason I want to track this: the quadrant map narrowed last week. Lagging went from 40 names to 62, because most things lost ground against a strong SPY week. But the absolute picture barely moved - 65 names are in one of the three uptrend states versus 63 the week before. The narrowing is relative, not a breakdown in underlying trends.
China and Crypto Bounce - Within Downtrends
China Internet (KWEB) rose 5.6% and China Large-Cap (FXI) 4.9%, with FXI crossing into Improving to join KWEB. Bitcoin (IBIT) rose 3.9% and Ethereum (ETHA) 5.2%. KWEB, FXI and IBIT all upgraded from Strong Downtrends to Downtrends, and ETHA was already there. All four are still a long way underwater - IBIT and ETHA sit roughly 50% and 63% below their all-time highs.
Tech, Semis and AI Bounce
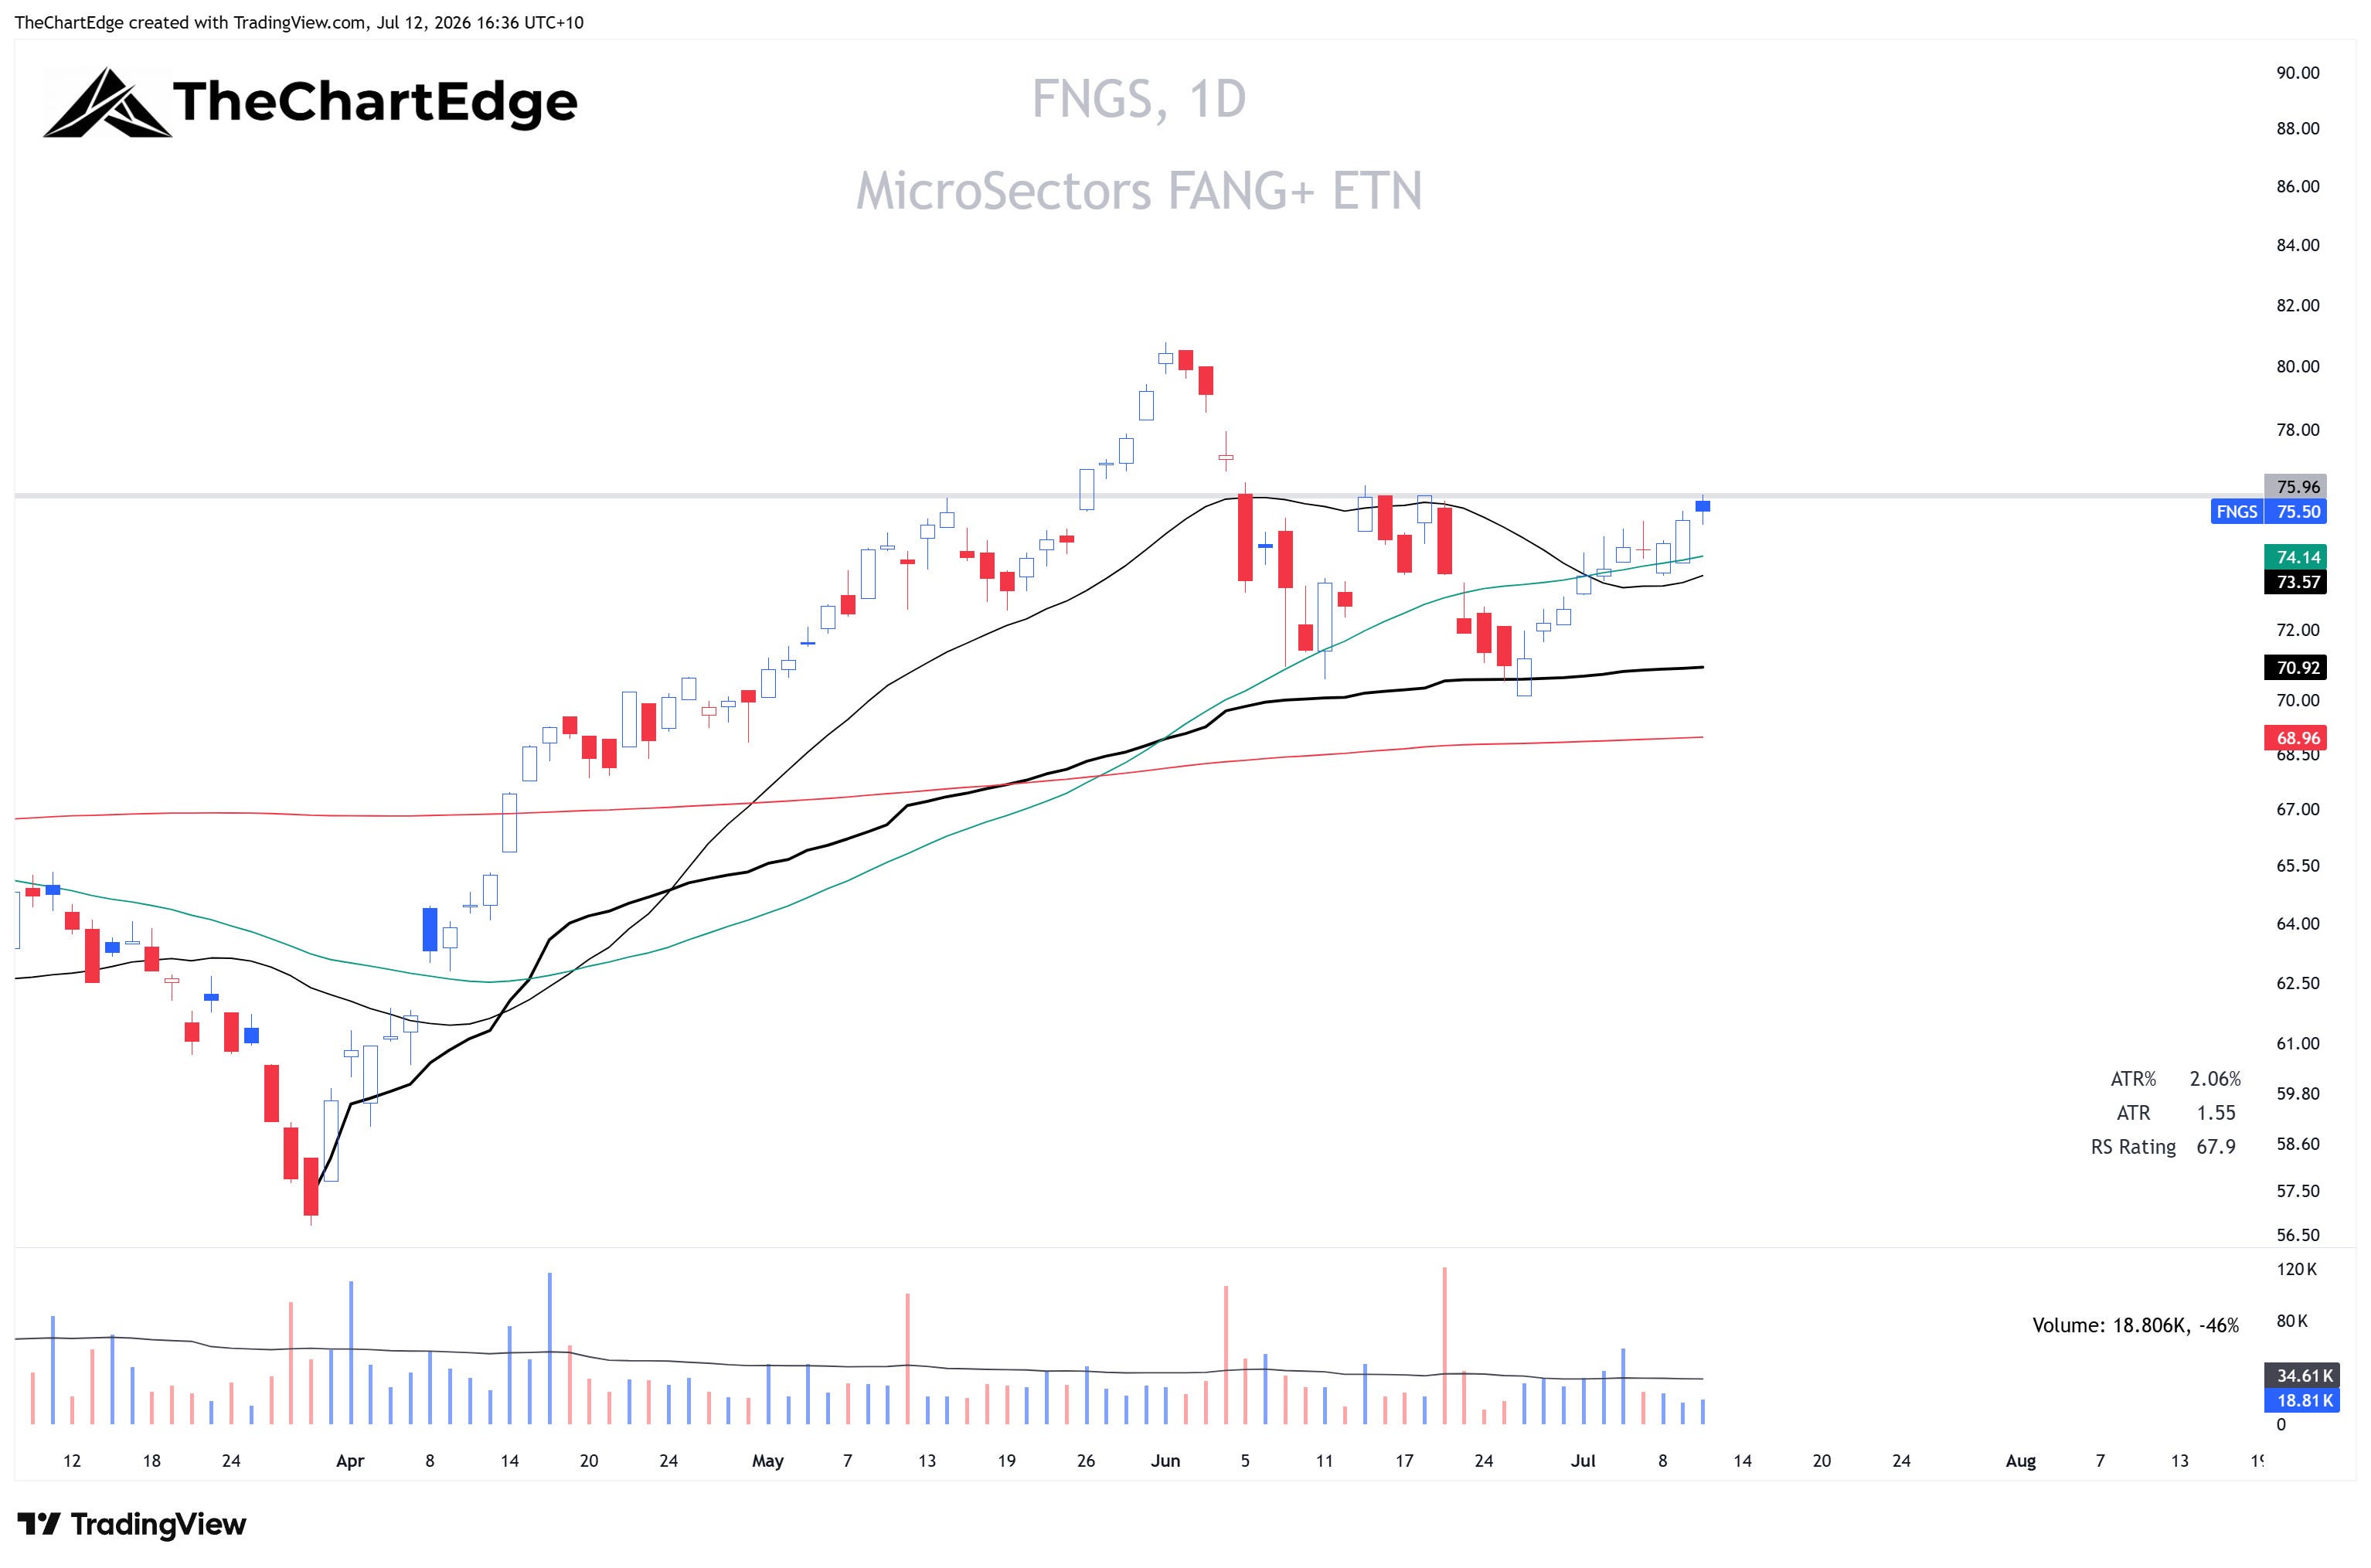
Mega-cap tech was strong, as seen in FANG+ (FNGS). It’s still in a Recovering Uptrend, but another strong week would likely flip it to a Strong Uptrend.
FNGS Chart
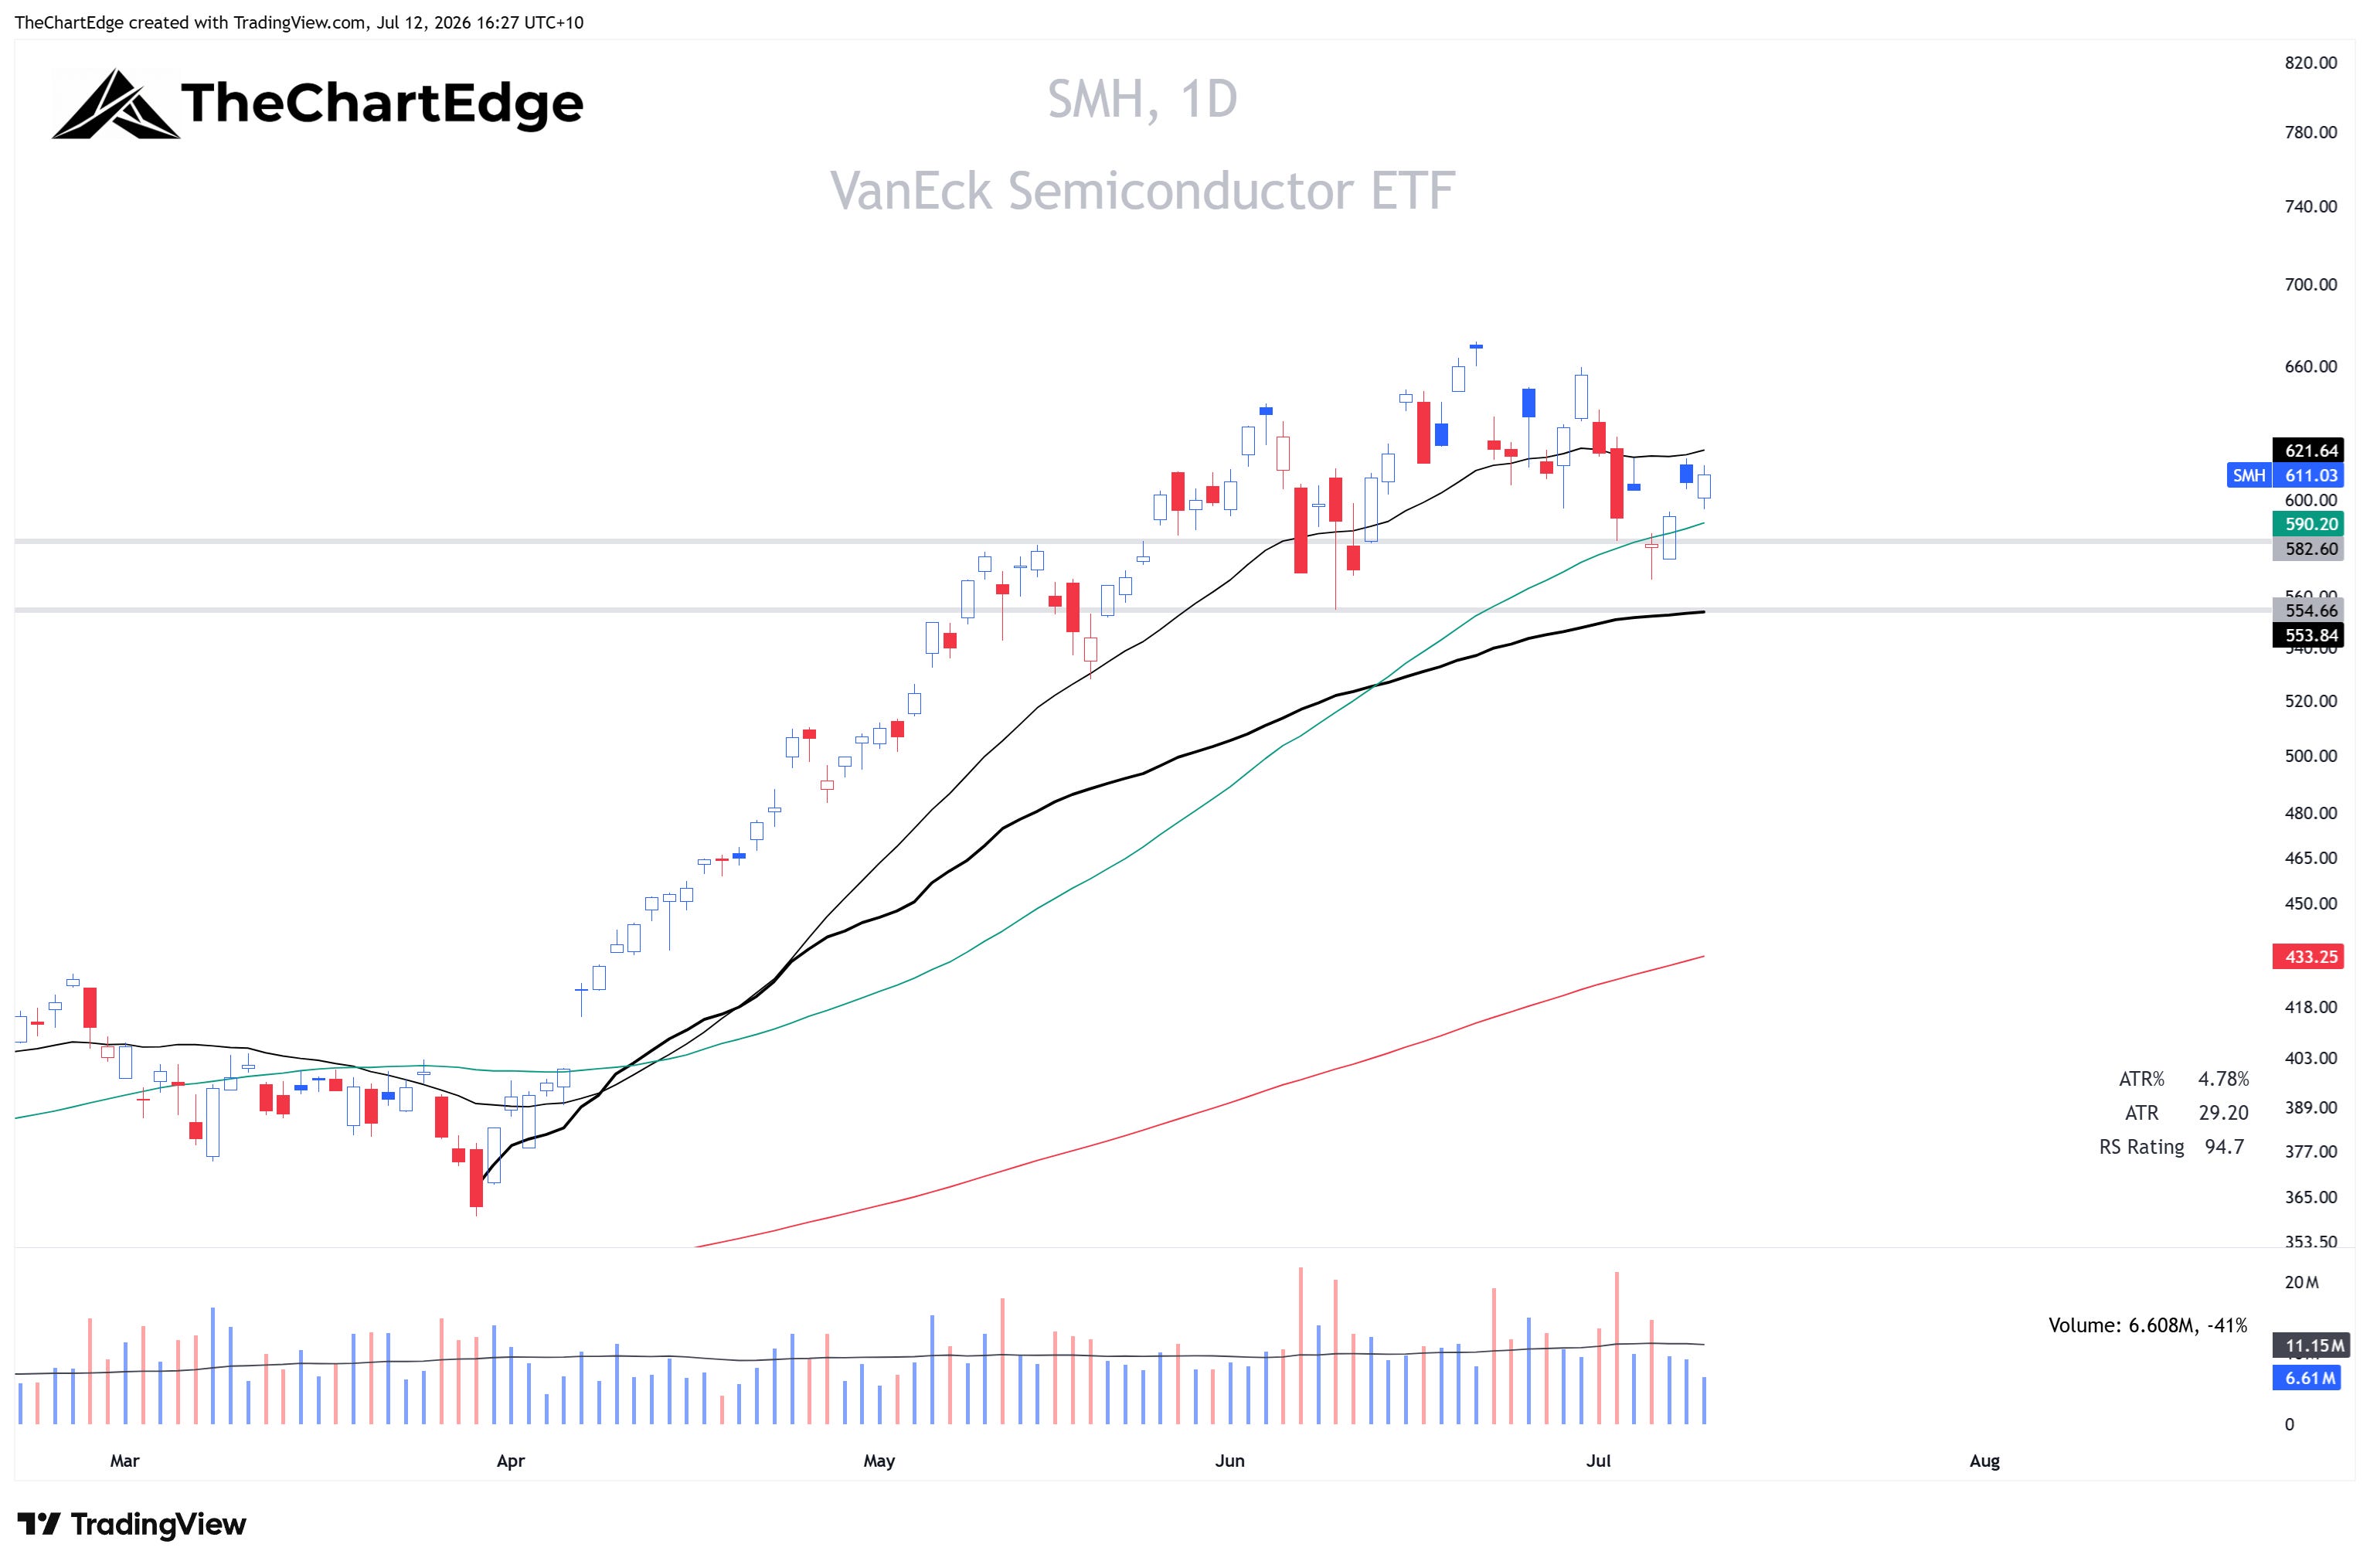
Semiconductors (SMH) rose 3.2% and sits above its rising 50-day SMA, though still below its 20-day. Equal-weight semis (XSD) added 1.4% but looks the weaker of the two.
SMH Chart
XSD Chart
Generative AI (CHAT) rose 3.3% after holding the AVWAP from the March 30 low, which is where I said last weekend I’d be watching for a bounce.
CHAT Chart
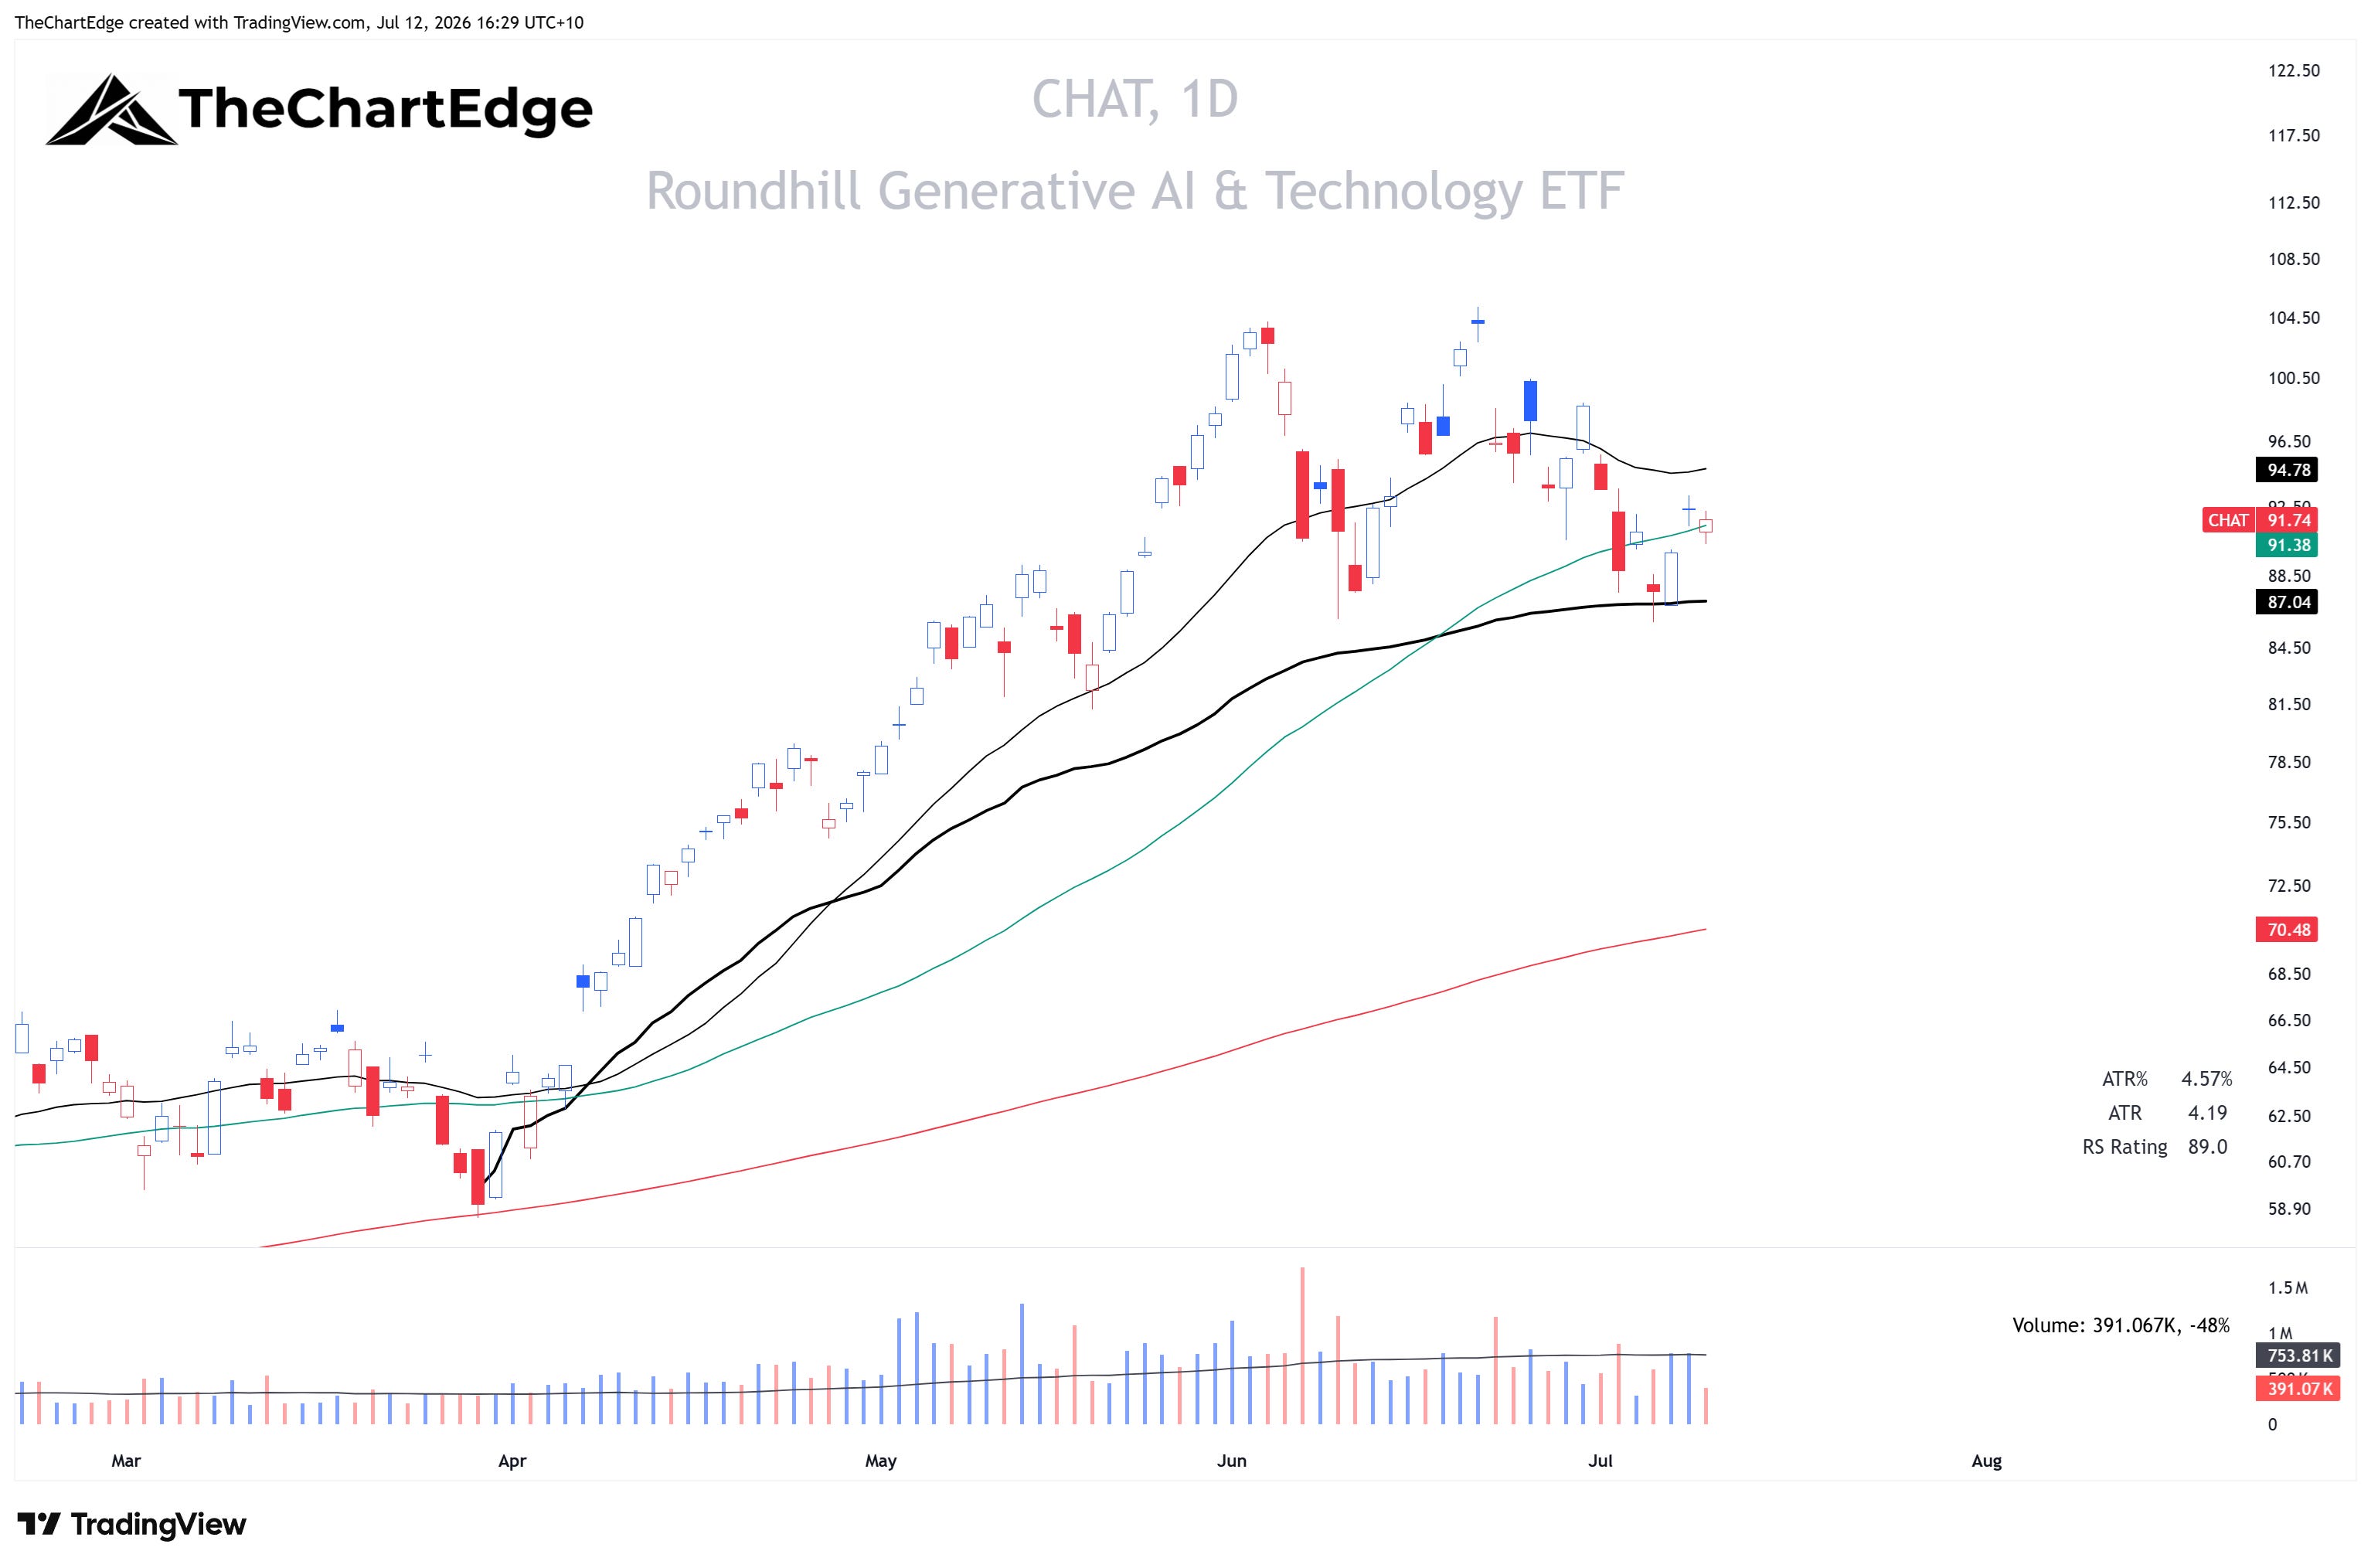
The RS-Momentum moves across the AI complex were the biggest of the week. CHAT went from 90.5 to 99.1, Digital Infrastructure (IDGT) from 91.0 to 99.0, Data Center Infrastructure (DTCR) from 89.0 to 95.6 and SMH from 92.9 to 99.4. Crypto miners (WGMI), which mostly trade as an AI compute proxy now, had the biggest RS-Momentum gain of any ETF I track, from 79.4 to 94.9 after a 4.3% week, but still looks weak, with price unable to close above the AVWAP from the March 30 low. None of them have crossed back above 100 yet. Re-accelerating, but not yet outperforming SPY on RS-Momentum.
WGMI Chart
Healthcare Slides and Biotech Hit on Friday
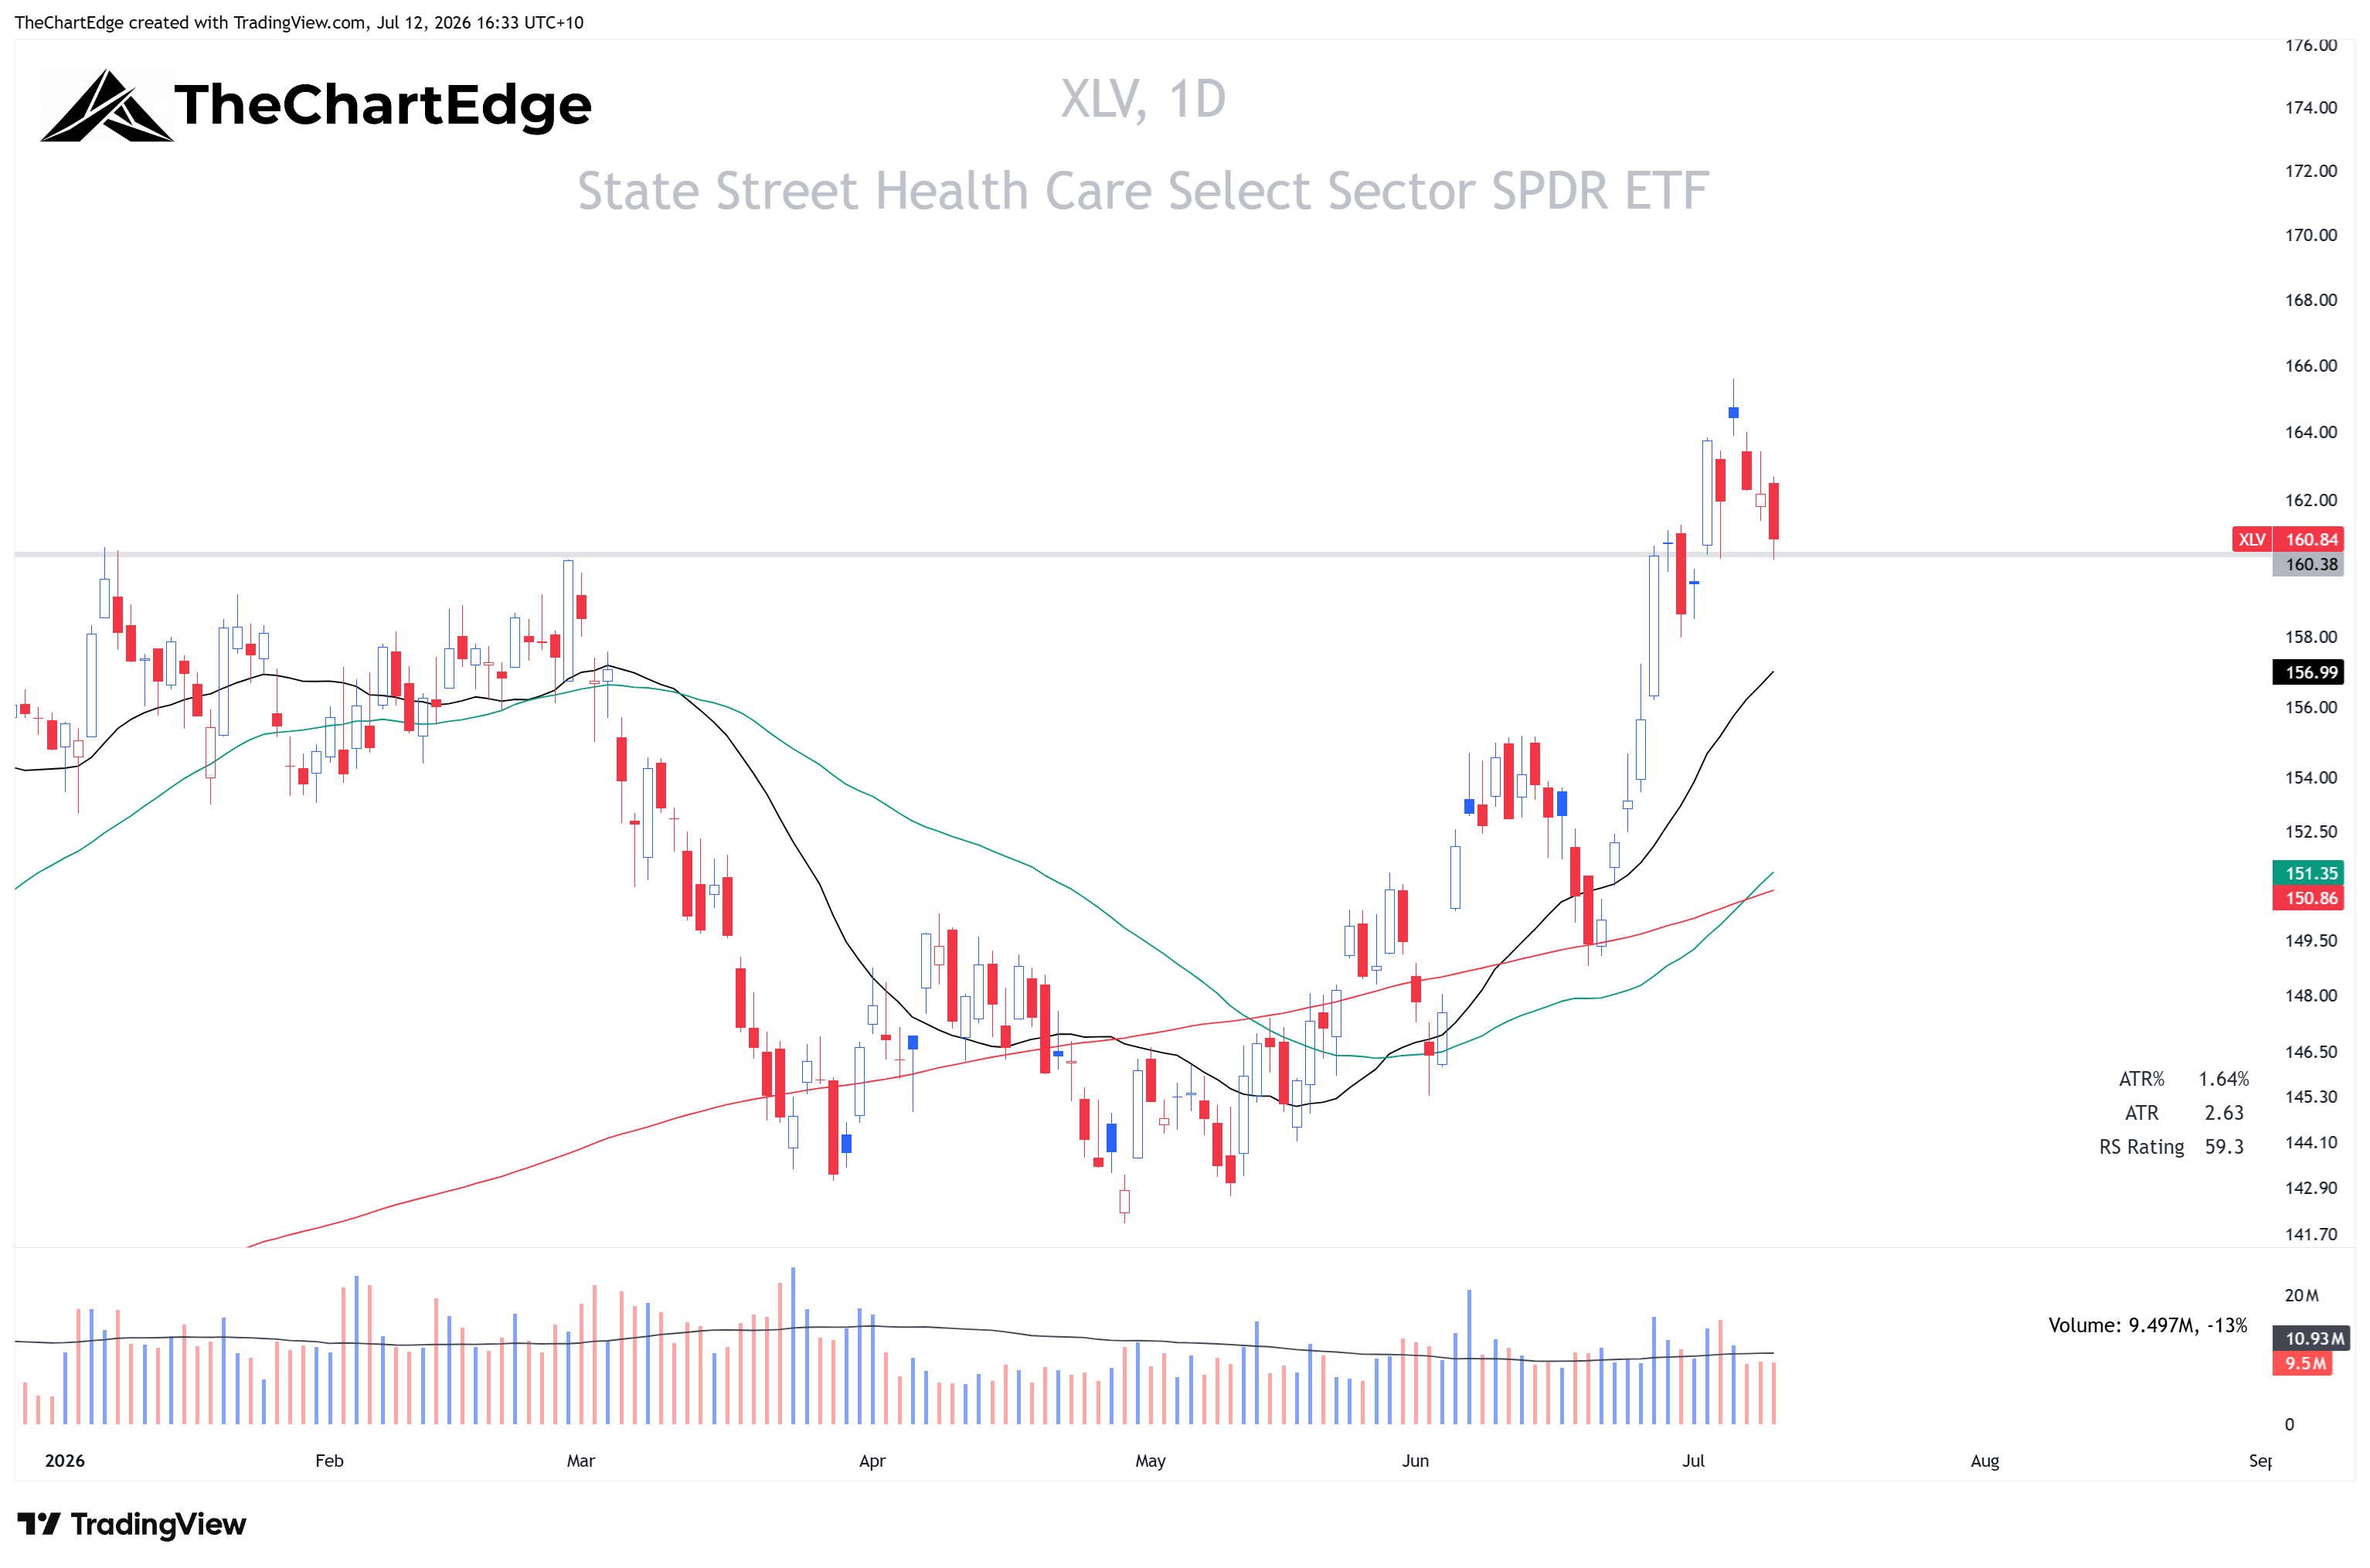
XLV was weak and dropped out of Improving, while equal-weight healthcare (RSPH), which was on the all-time-high list a week ago, fell out of Leading - both now sit in Lagging.
XLV Chart
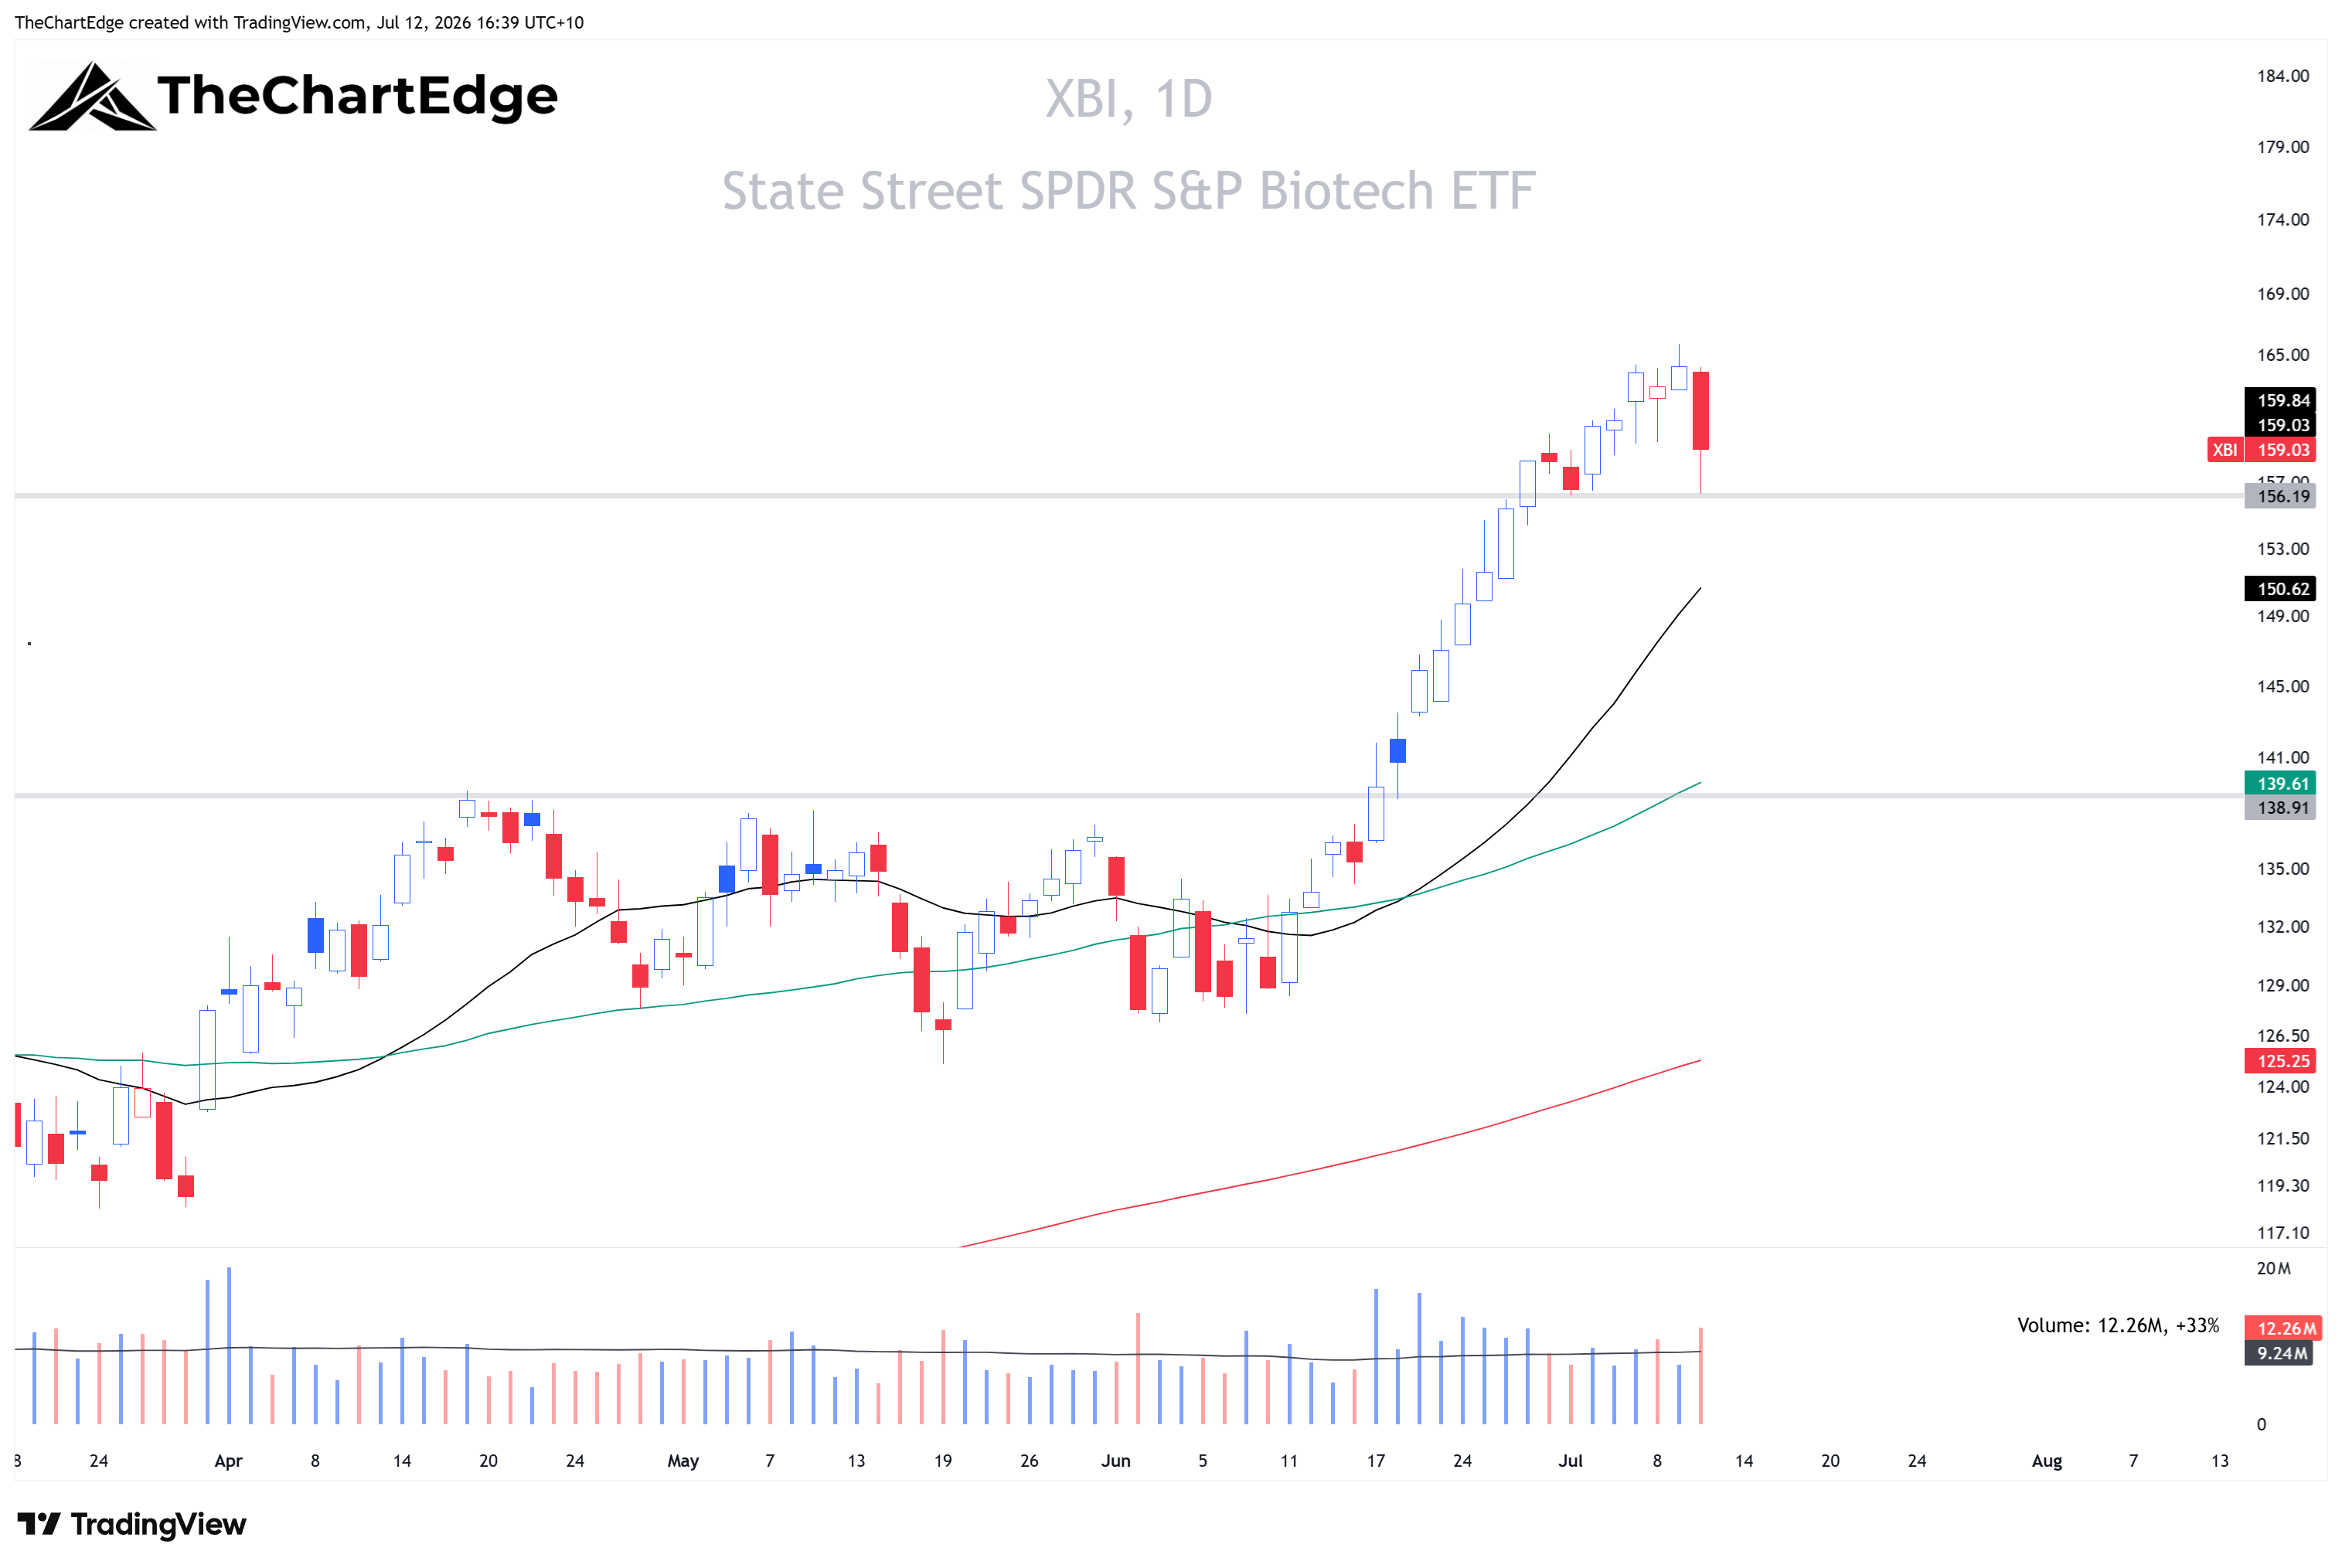
Biotech’s weekly numbers hide the story. XBI finished the week down only 0.9%, but 3.2% of that came on Friday - an ugly candle after the run it’s had since mid-June. Large-cap biotech (IBB) fell 1.9% and ARK Genomics (ARKG) 3.7%. Pharmaceuticals (XPH) was up 1.9%.
XBI Chart
Aerospace & Defense Rejected at ATHs
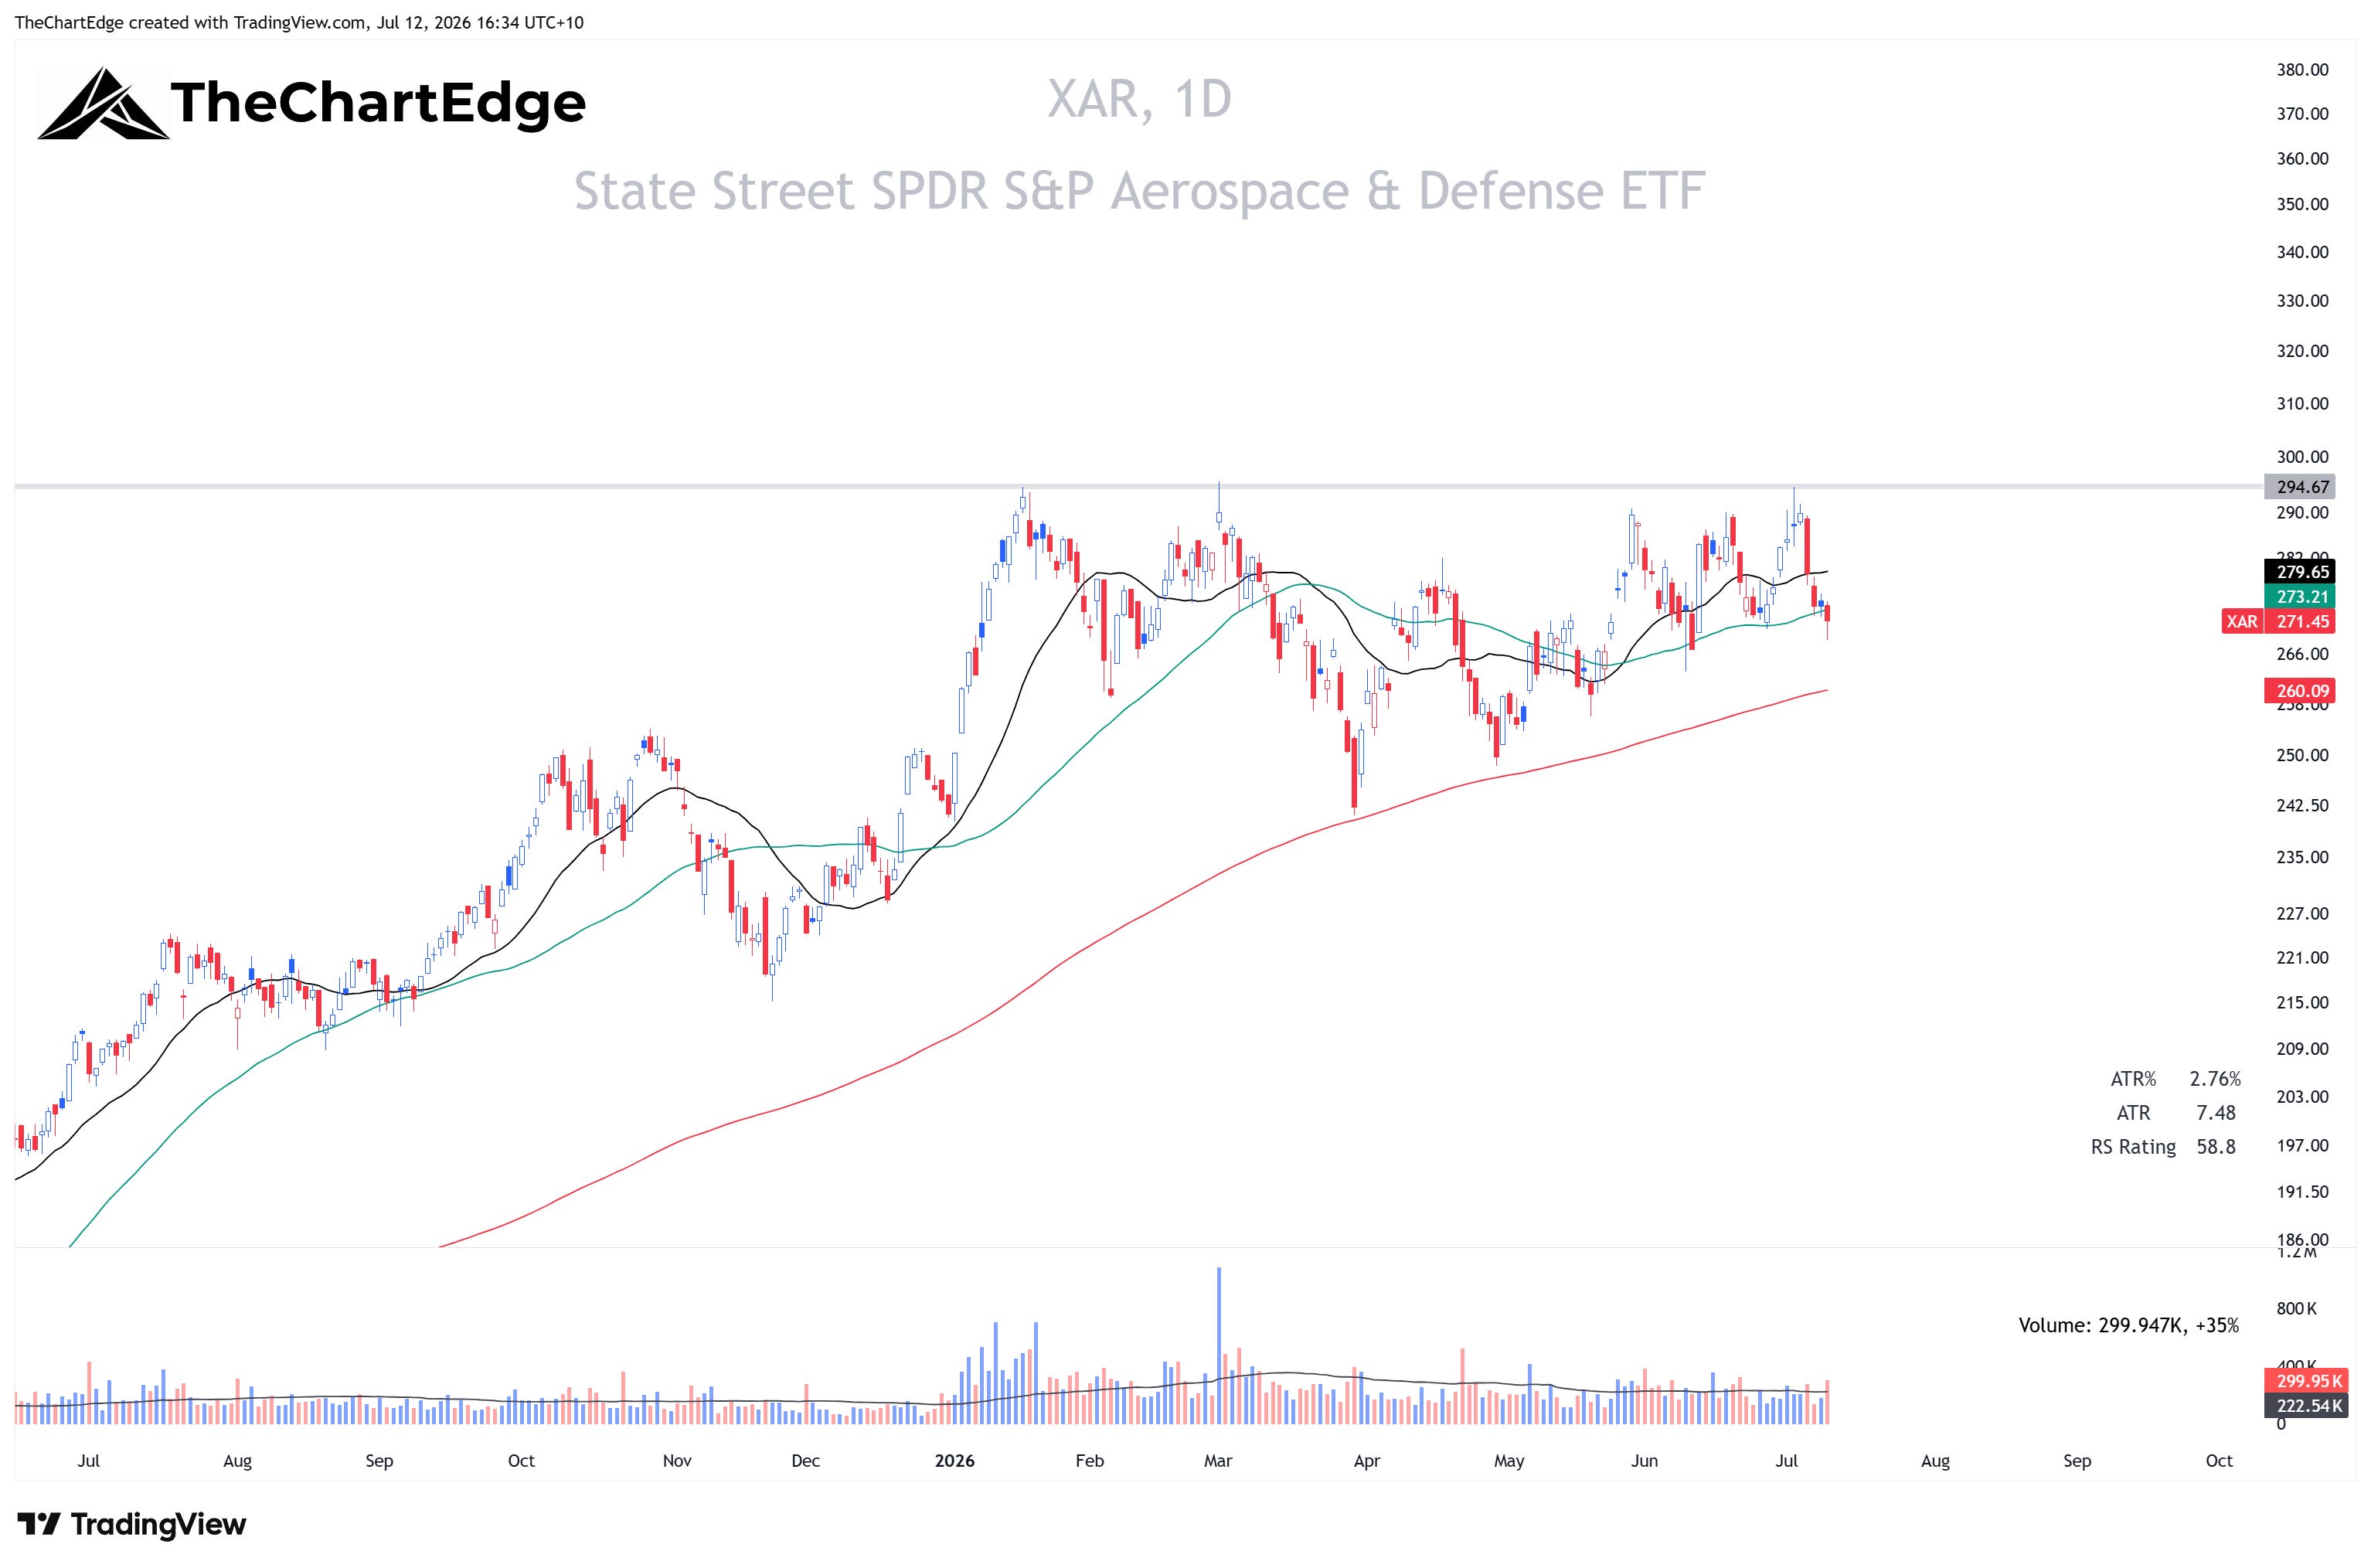
A week after crossing into Leading and sitting 2.7% from an all-time high, Aerospace & Defense (XAR) fell 5.6% and now sits in Lagging. Its trend state went from a Strong Uptrend to Neutral, and its RS-Trend fell more than 8 points.
XAR Chart
Financials Stall
Last weekend Insurance (KIE), equal-weight financials (RSPF), Financials (XLF) and Capital Markets (KCE) were all on the momentum leaderboard. Last week XLF rose 0.2%, RSPF 0.6%, KCE 1.7%, and KIE fell 1.0% - only equal-weight financials and insurance retained their place on the leaderboard but dropped nine and fourteen places respectively.
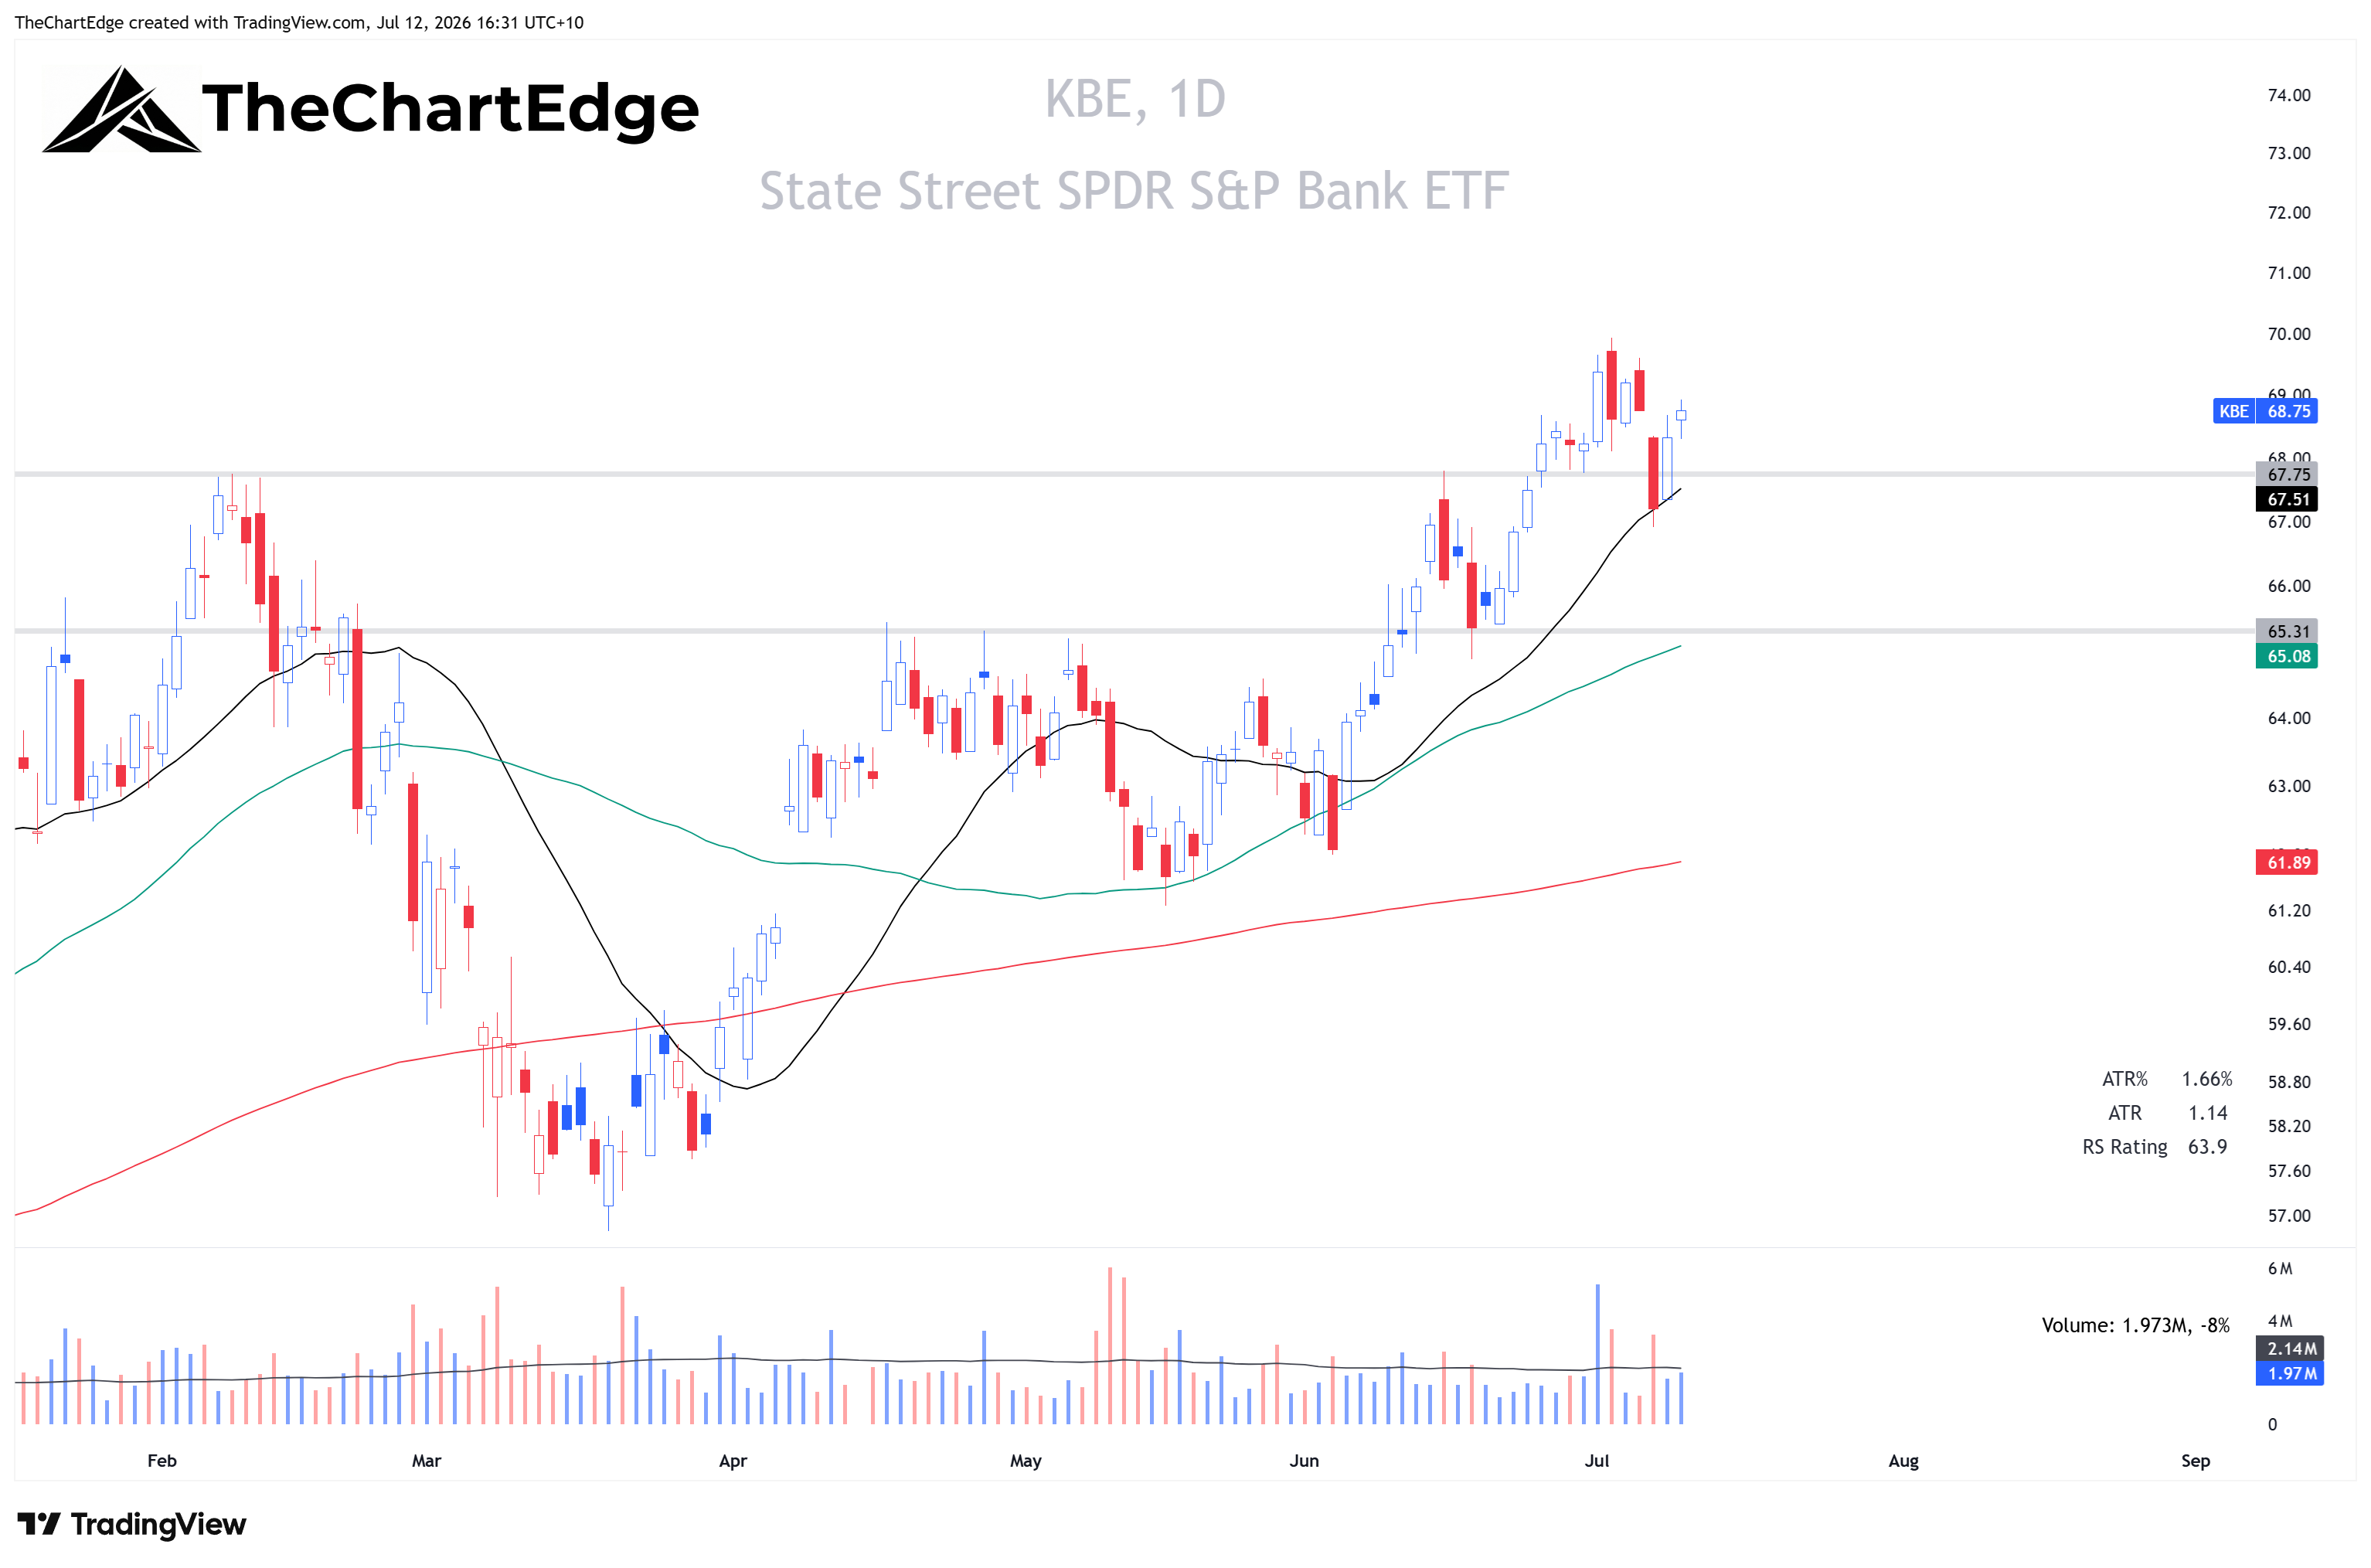
All six financial ETFs we track lost RS-Momentum. The big banks (KBE) were up 0.2% and the regional banks (KRE) finished flat, but both dropped out of Leading into Lagging, sitting right on the boundary.
Despite the slowing momentum, all six remain in Strong Uptrends. The big banks kick off earnings season on Tuesday next week.
KBE Chart
The Week Ahead
The temperature is steady in the Goldilocks Zone, SPY and QQQ are back above their 20-day SMAs in Strong Uptrends. However, both are still consolidating in a range and lack shorter term trend direction. The rotation swung back towards tech and AI names; I will be watching next week to see if that continues. I scaled out of my biotech (XBI) position and sold Eli Lilly (LLY) last week but would buy them back if they can consolidate here for a bit, or even on some strength after a deeper pullback to their 20 or 50-day moving averages. I am waiting for SPY and QQQ to resolve from their consolidations before aggressively entering new positions. I did enter the S&P 500 CFD on Monday, as I mentioned last weekend, but did not hold through Tuesday and Wednesday’s pullback. A few individual names I’m watching that have held up relatively well are Dell (DELL), Advanced Micro Devices (AMD), Cisco (CSCO), and Astera Labs (ALAB).
Stay open-minded and manage risk carefully.
Cheers,
Marcus Grant, CFTe
Disclaimer: The content provided in this newsletter is for informational and educational purposes only and should not be considered as financial, investment, or legal advice. The information shared is based on our research and analysis, but we are not a licensed financial advisor, nor can we guarantee its accuracy, completeness, or timeliness. Market conditions and financial instruments can change rapidly, and any opinions expressed may not be suitable for all investors. Any opinions expressed and or securities mentioned do not constitute a recommendation to buy, sell, or hold that or any other security. You should conduct your own due diligence and consult with a licensed financial advisor or other professional before making any investment decisions. Past performance is not indicative of future results, and all investments carry the risk of loss. The authors and publishers of this newsletter are not responsible for any financial decisions made based on the content provided herein. By reading and or subscribing to this newsletter, you acknowledge and agree that you are using the information at your own risk.