


Everything below is as of Friday September 4 close.
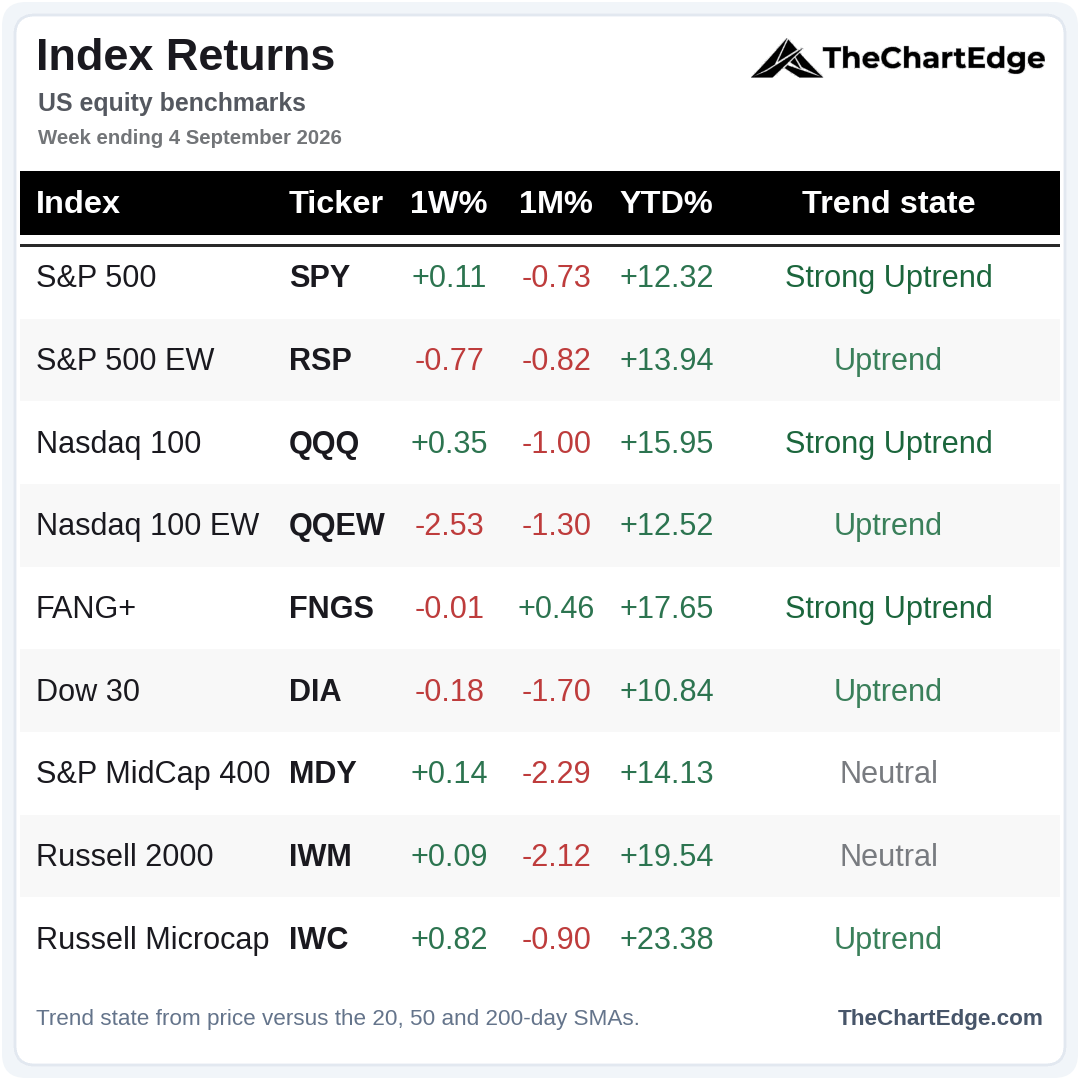
Of the major indices I track, 5 of the 9 finished the week higher, but nothing moved much in either direction, except the equal-weight Nasdaq 100 (QQEW) which was down 2.5%.
SPY Chart
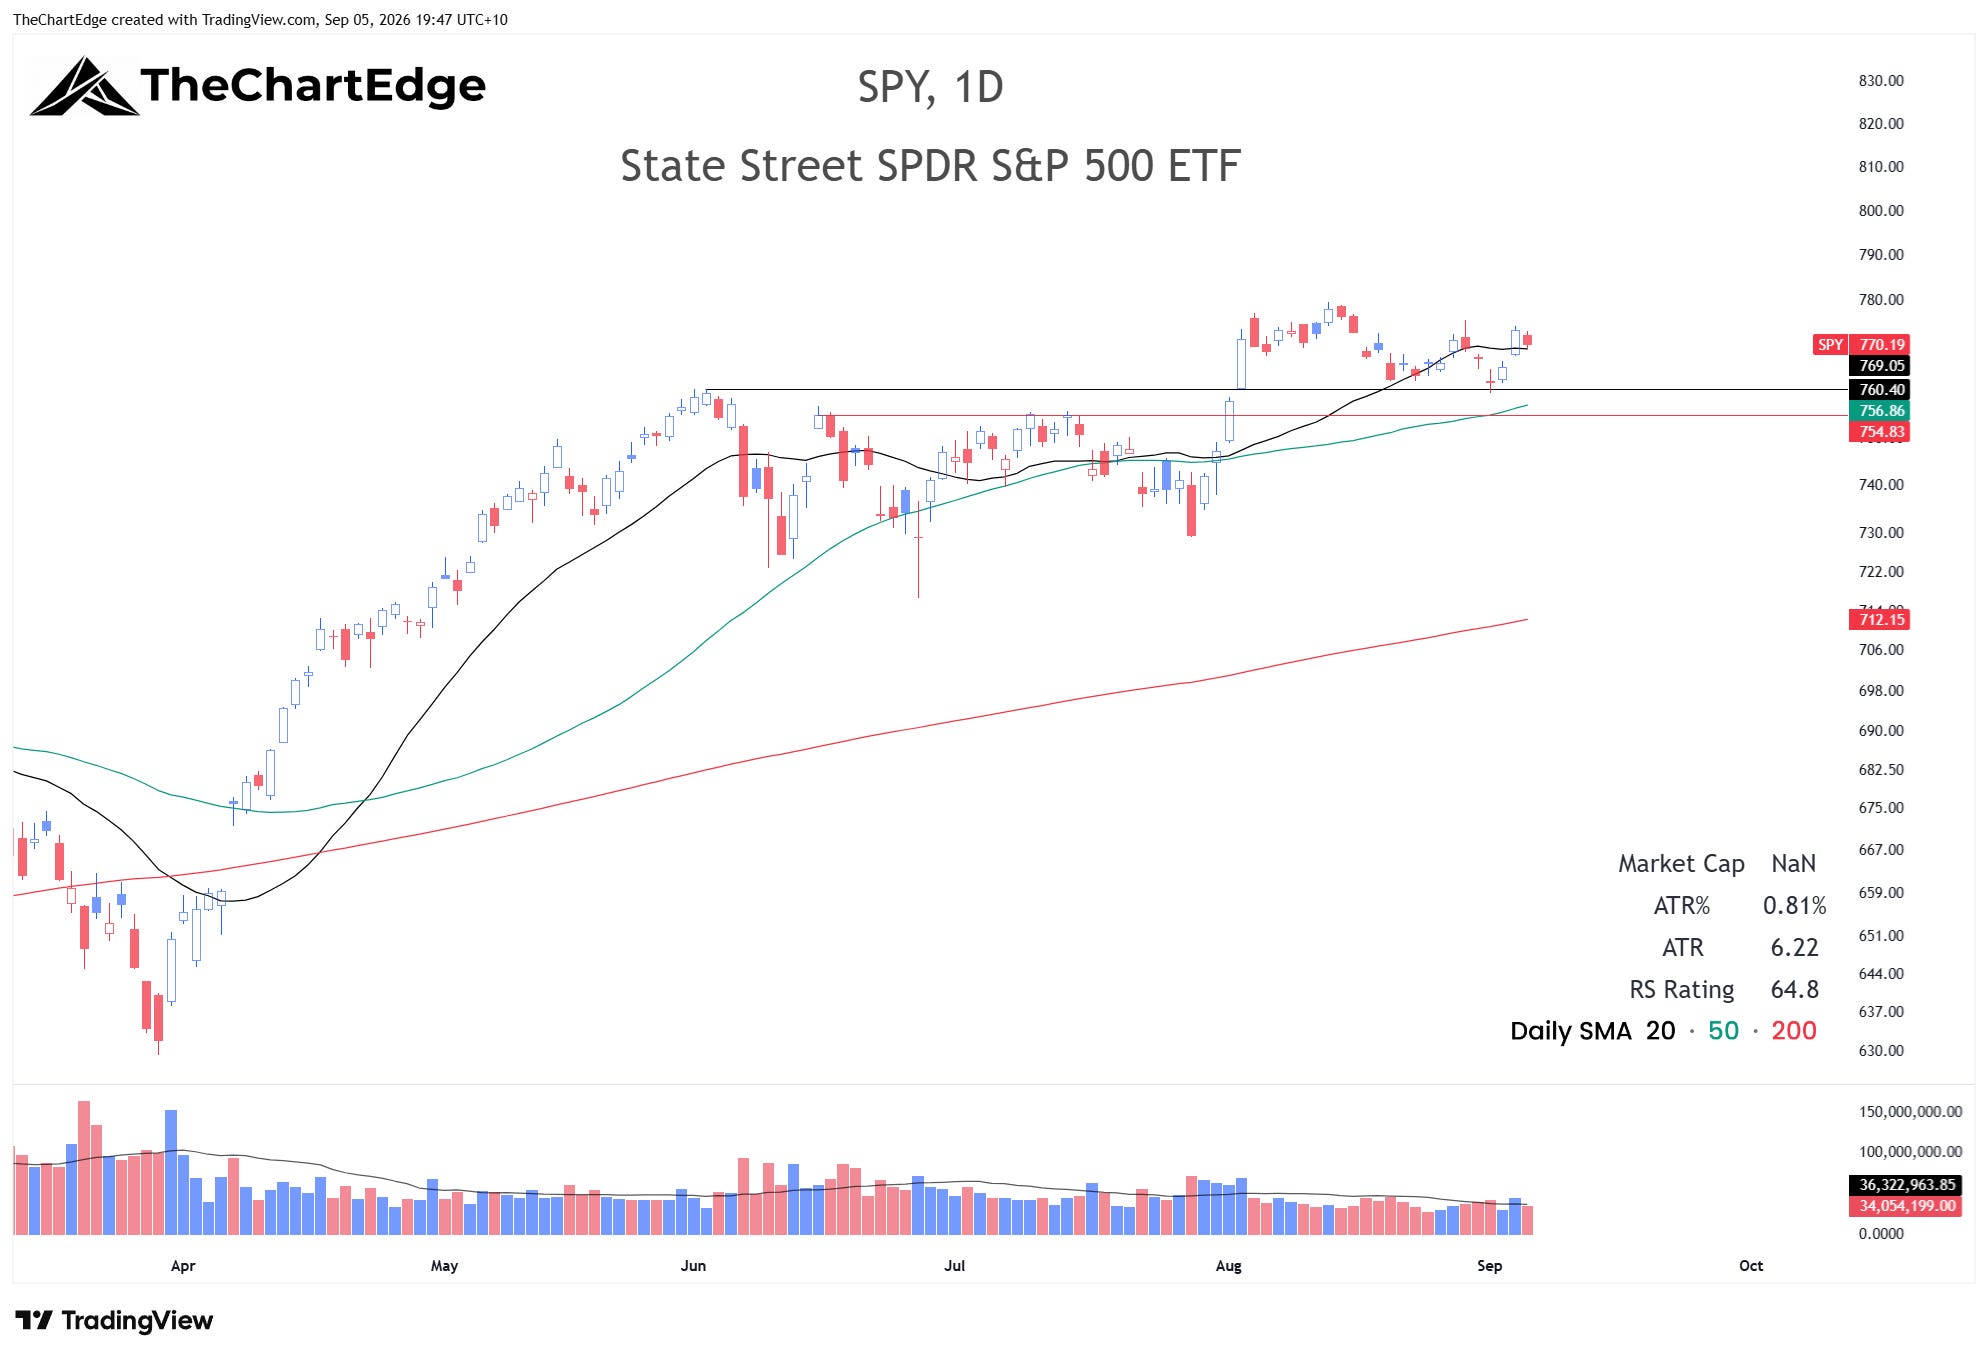
SPY closed at 770.19, 1.2% below its all-time high and still in a Strong Uptrend. After gapping down on Monday and Tuesday it looked like a test of the 50-day SMA was imminent, but it held and bounced right at 760 - the high from June 2 - pretty textbook. Wednesday and Thursday were strong, with a little bit of give back on Friday. Quite impressive, but at the same time we have been going sideways for a month after the big two-day pop in early August.
My resting buy order for the S&P 500 CFD at 7580 didn’t fill. The low for the week was just under 7610. The 50-day SMA is now above my bid, so I cancelled it and have placed a couple of new orders with that risk capital (more on that below).
QQQ Chart
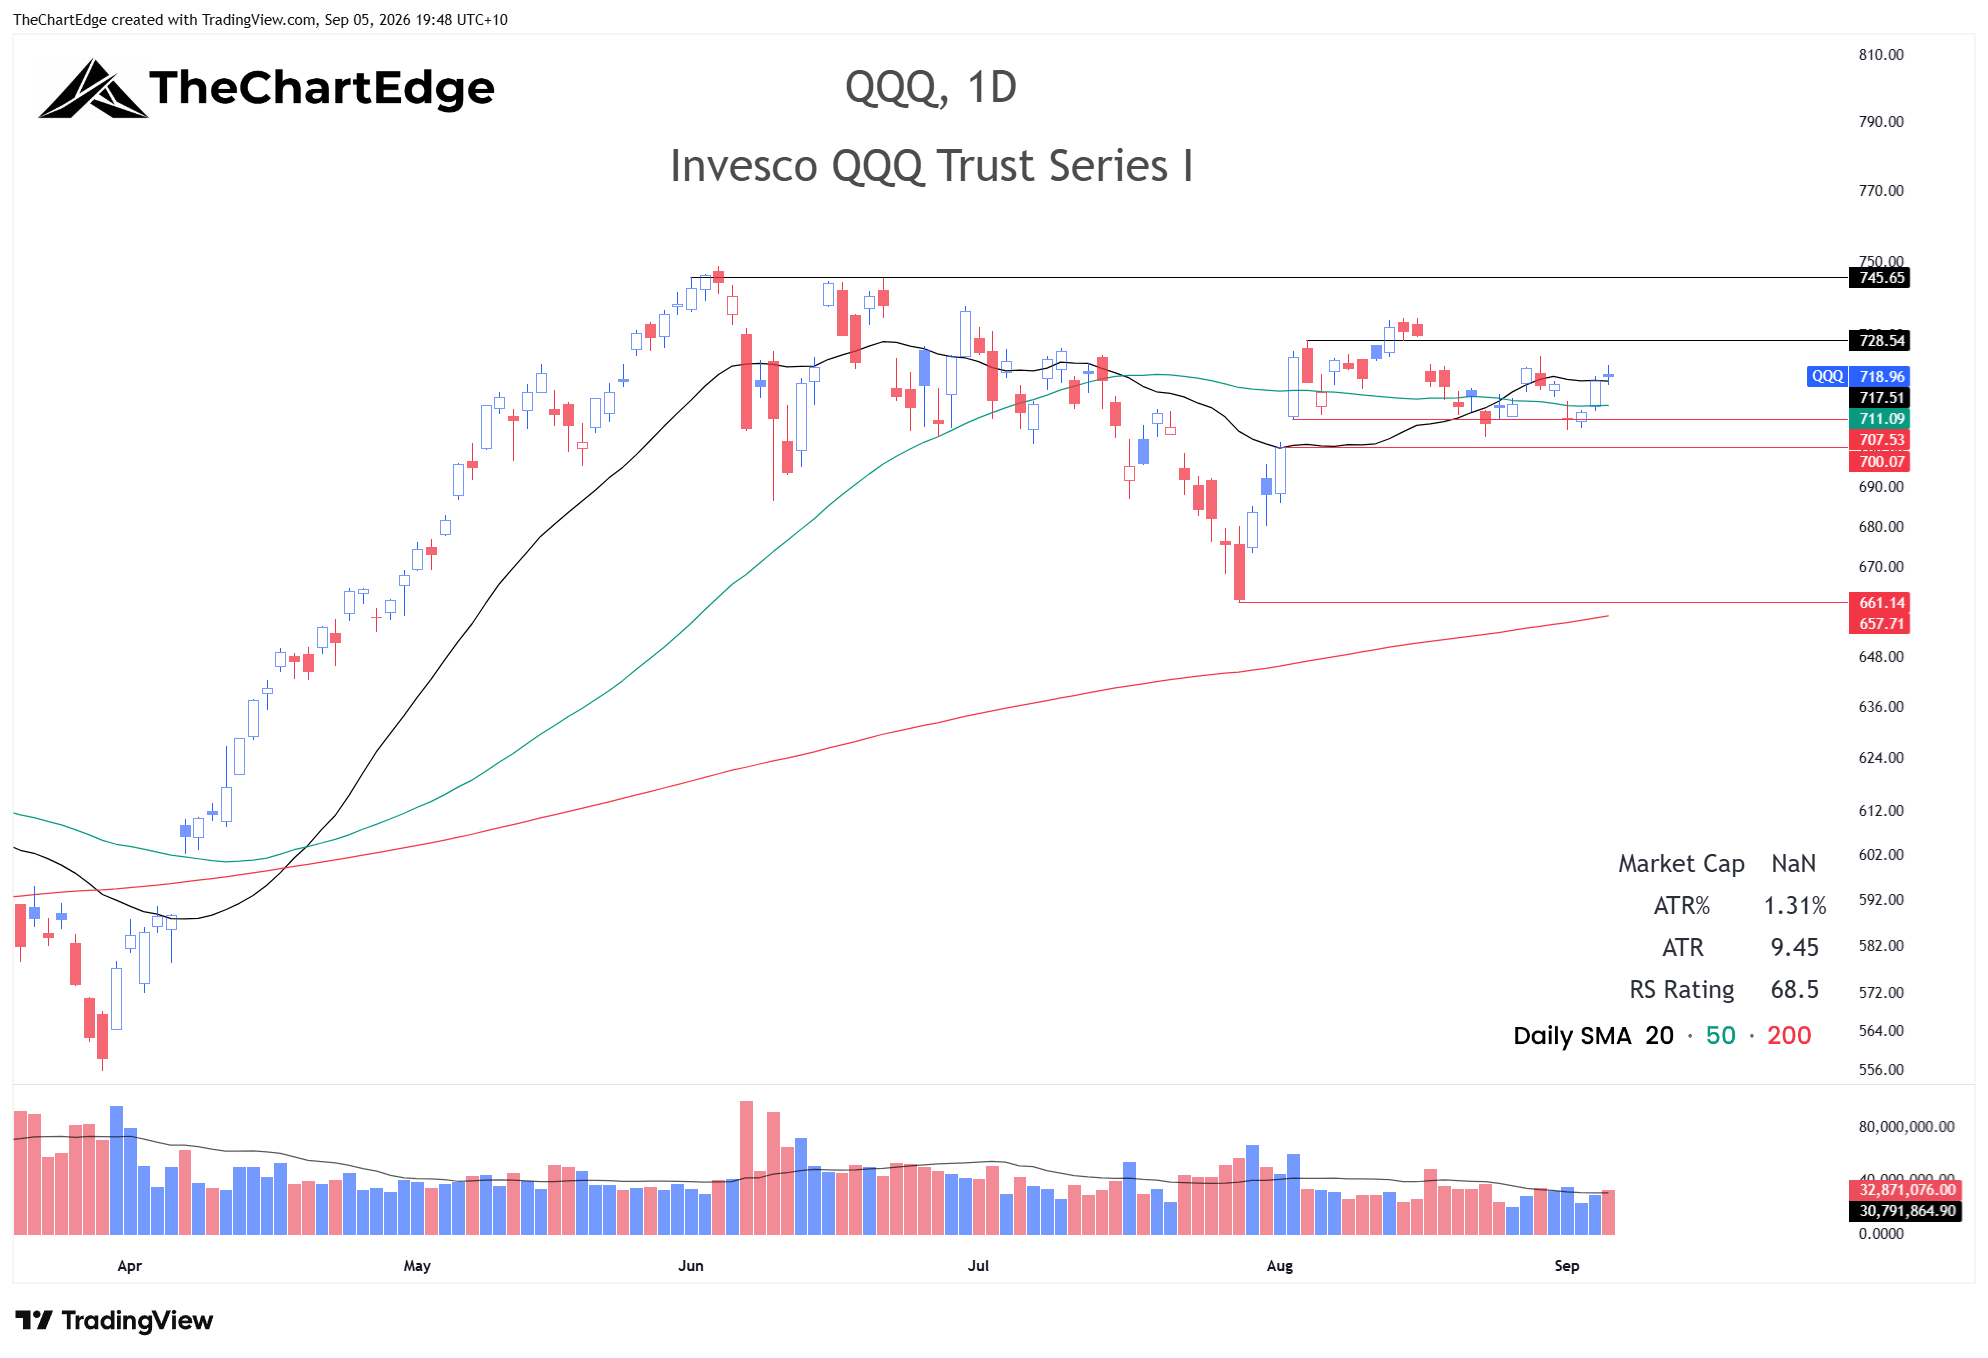
QQQ closed at 718.96 and is back in a Strong Uptrend, above its 20 and 50-day SMAs, which are now bullishly aligned. It held the 700-707 zone on Tuesday and Wednesday, bounced nicely on Thursday and was up slightly on Friday. The chart doesn’t look very bullish, but it doesn’t look bearish either. It’s a big consolidation that’s been going for three months now - probably exactly what was needed after the fast and furious rally off the March 30 low. If we get a close decisively below 700, I will become far more cautious with all my positions, but even more so with any tech ones.
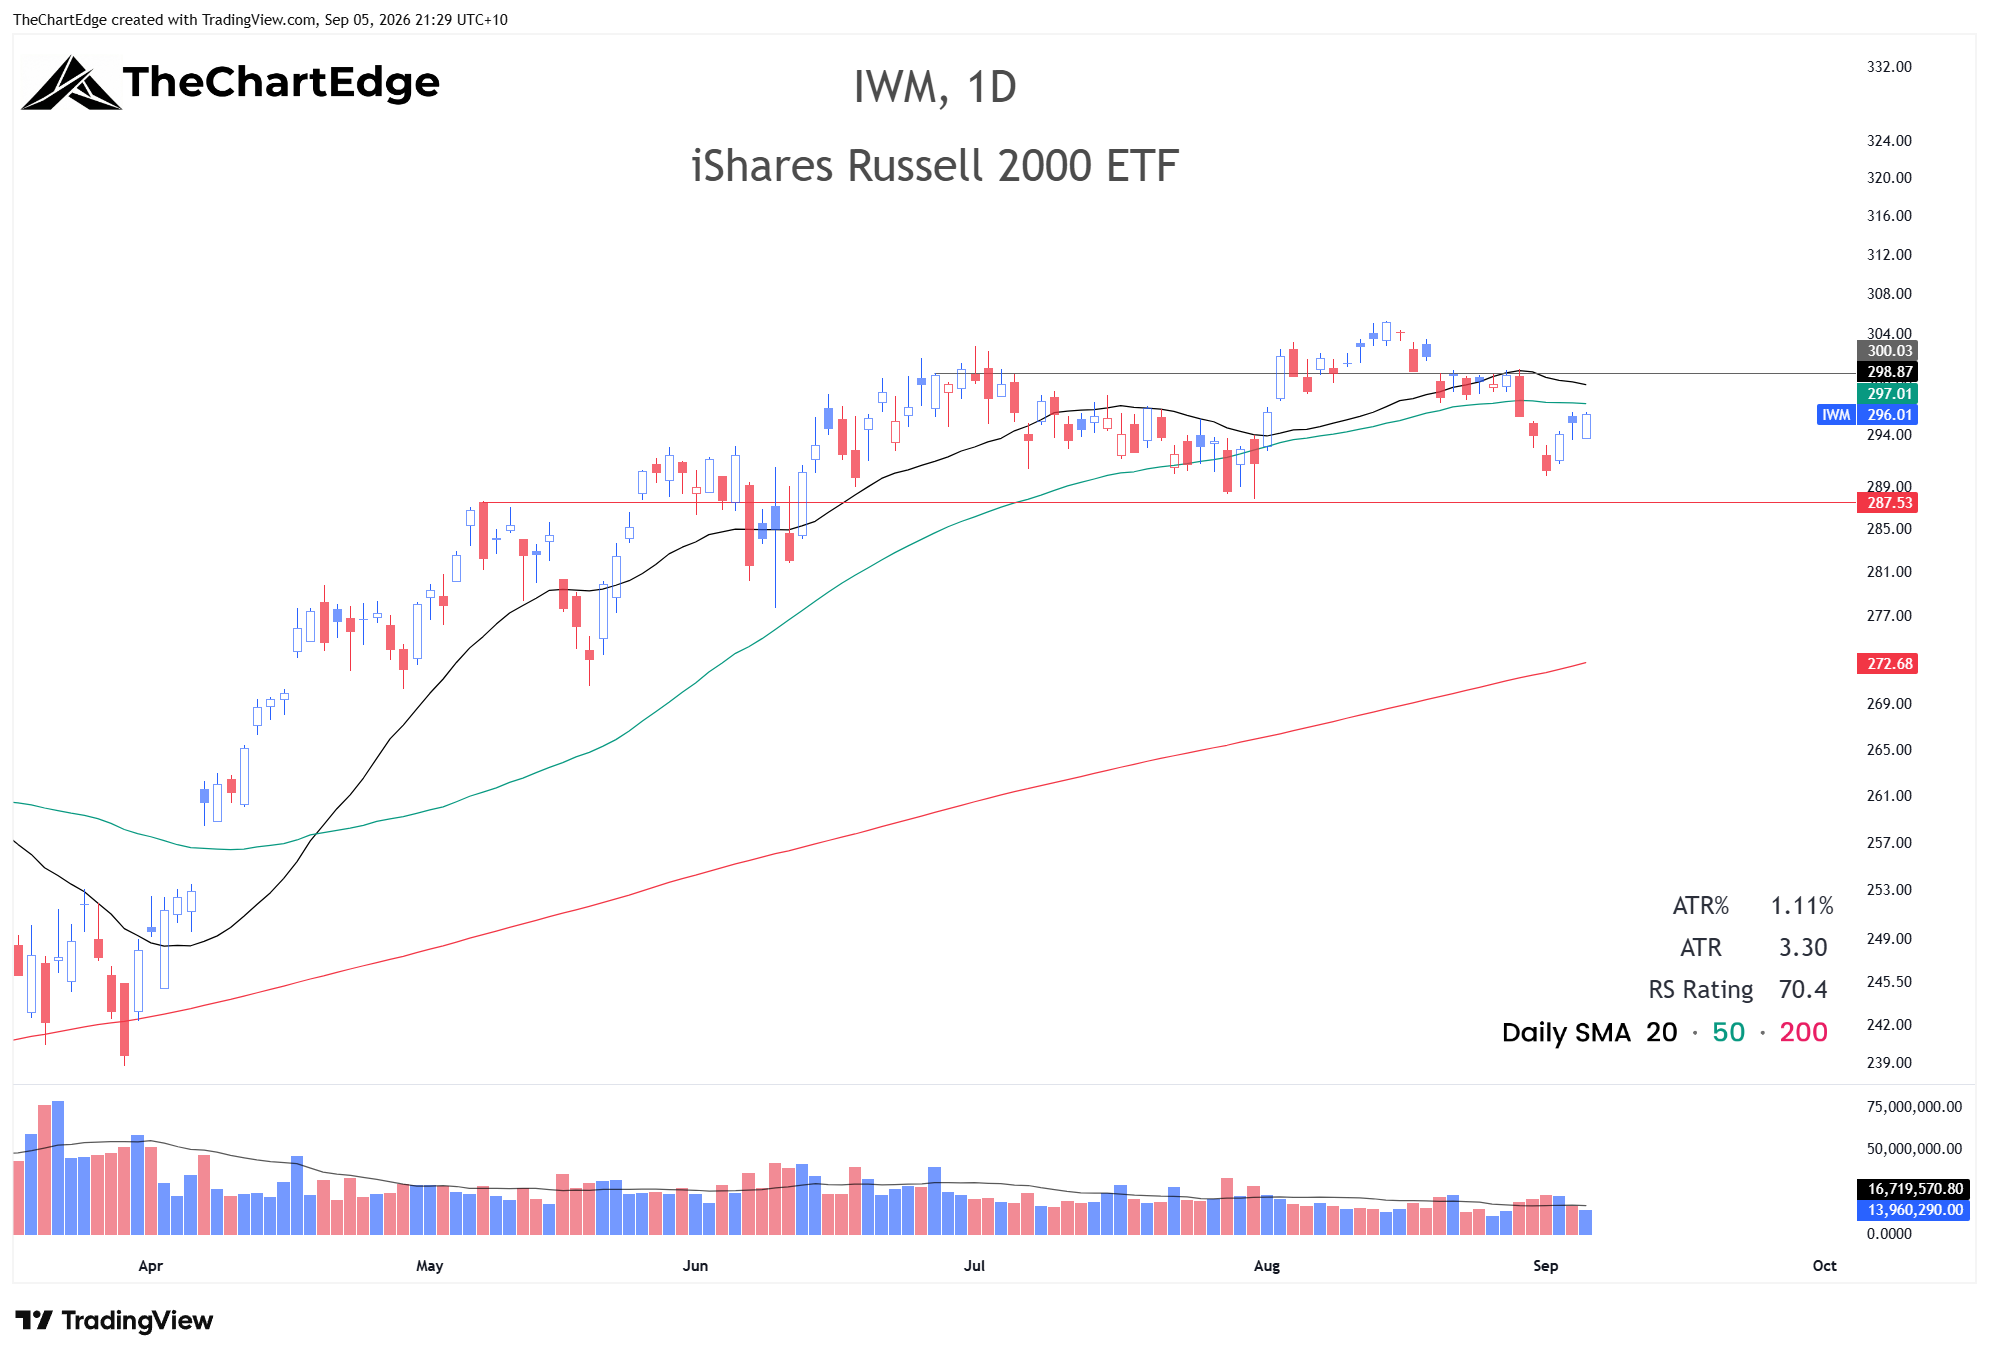
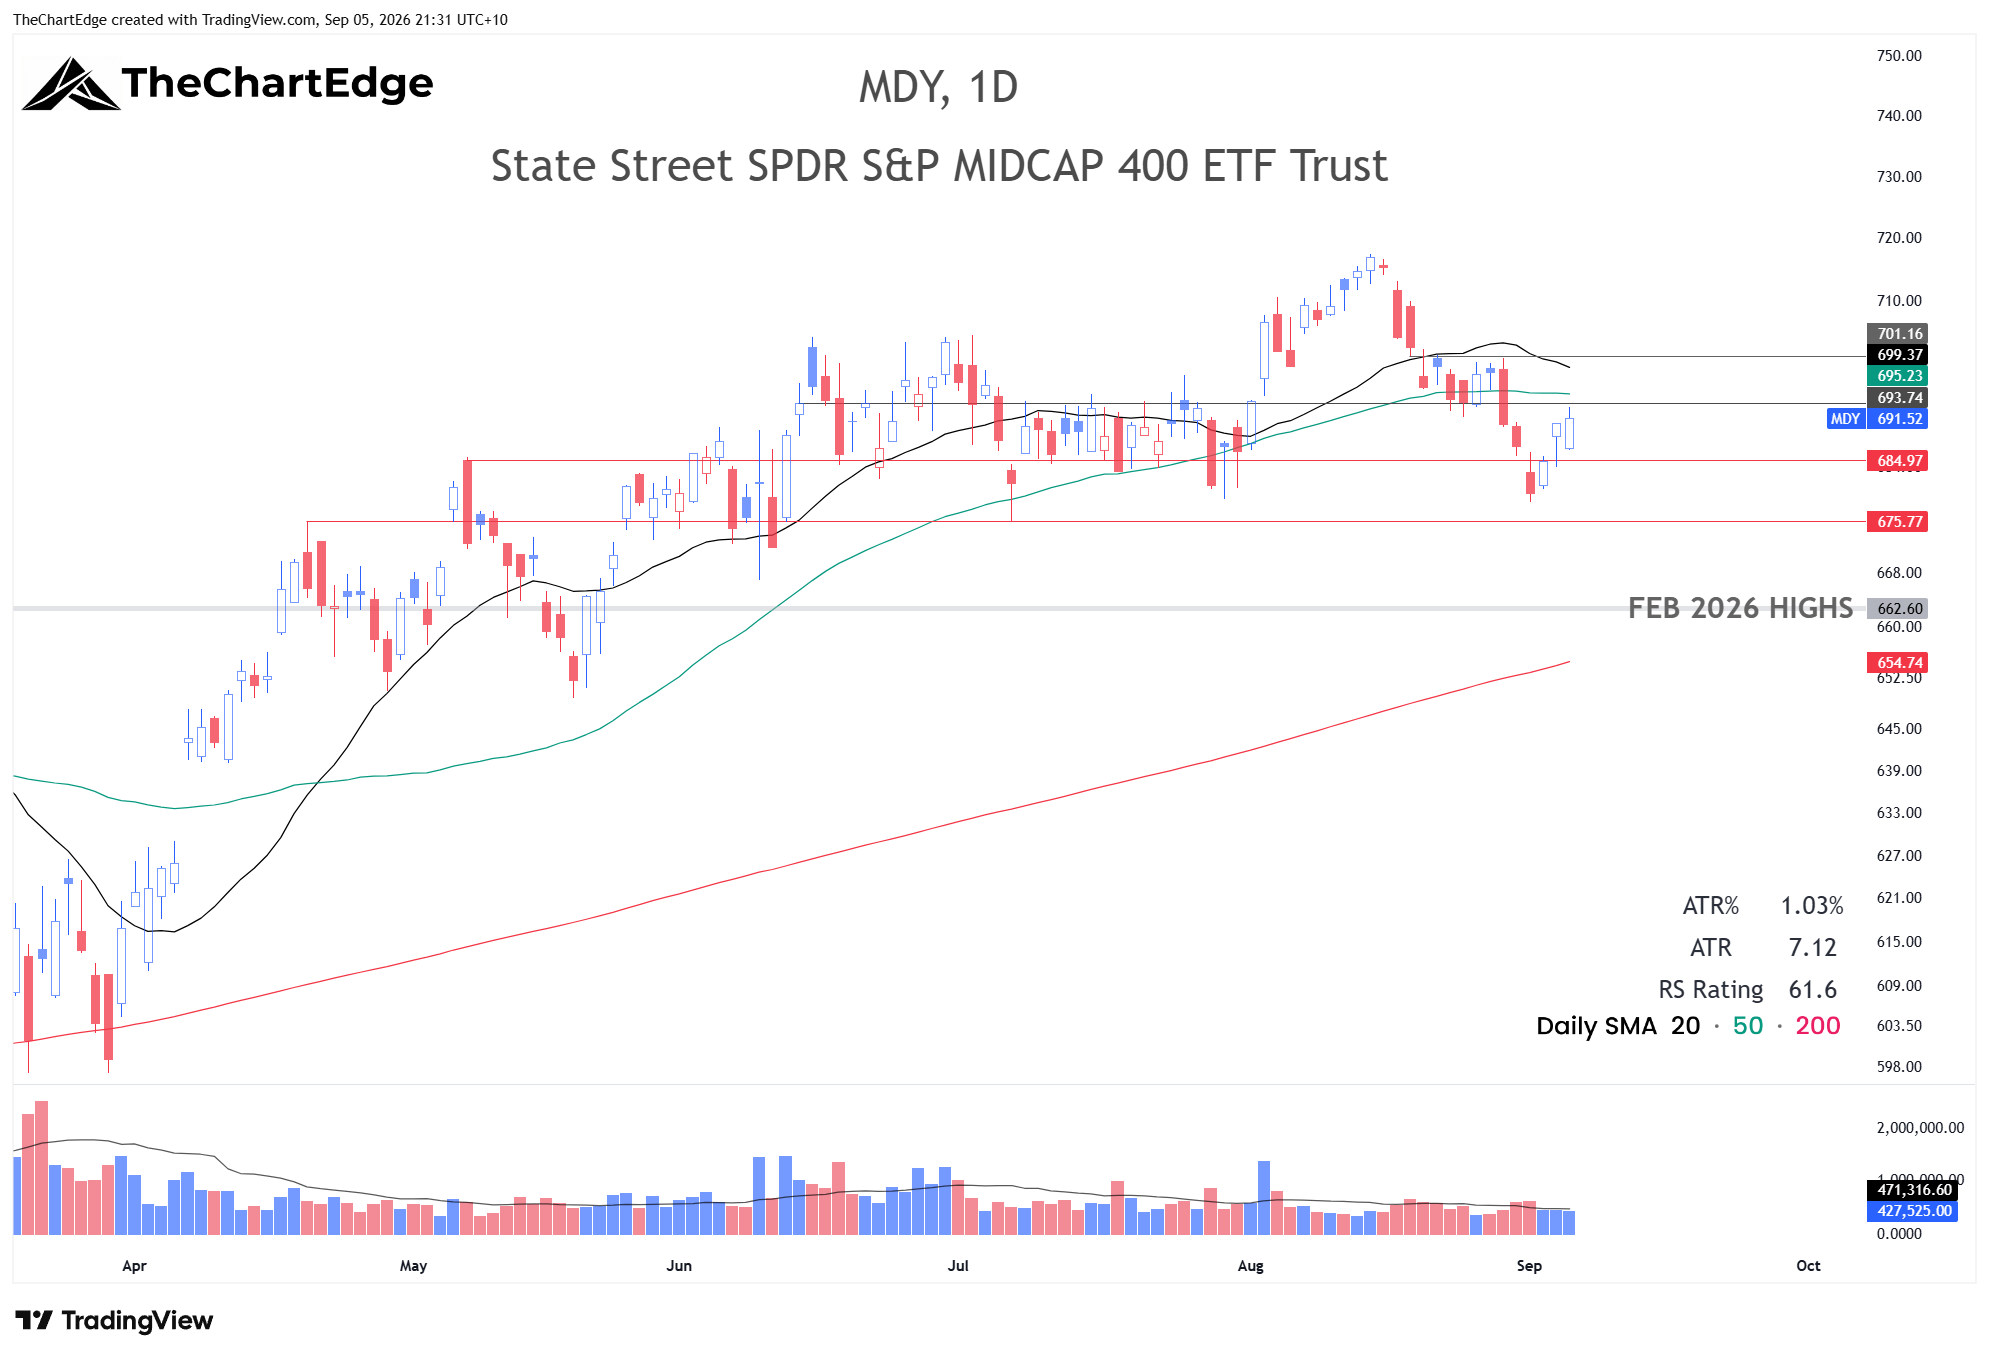
Small and mid caps had a bad start to the week. They looked in trouble after gapping down on Monday and Tuesday, but both bounced back to finish the week slightly in the green. But both are still in Neutral trend states, below their 20 and 50-day SMAs.
IWM Chart
MDY Chart
Market Temperature
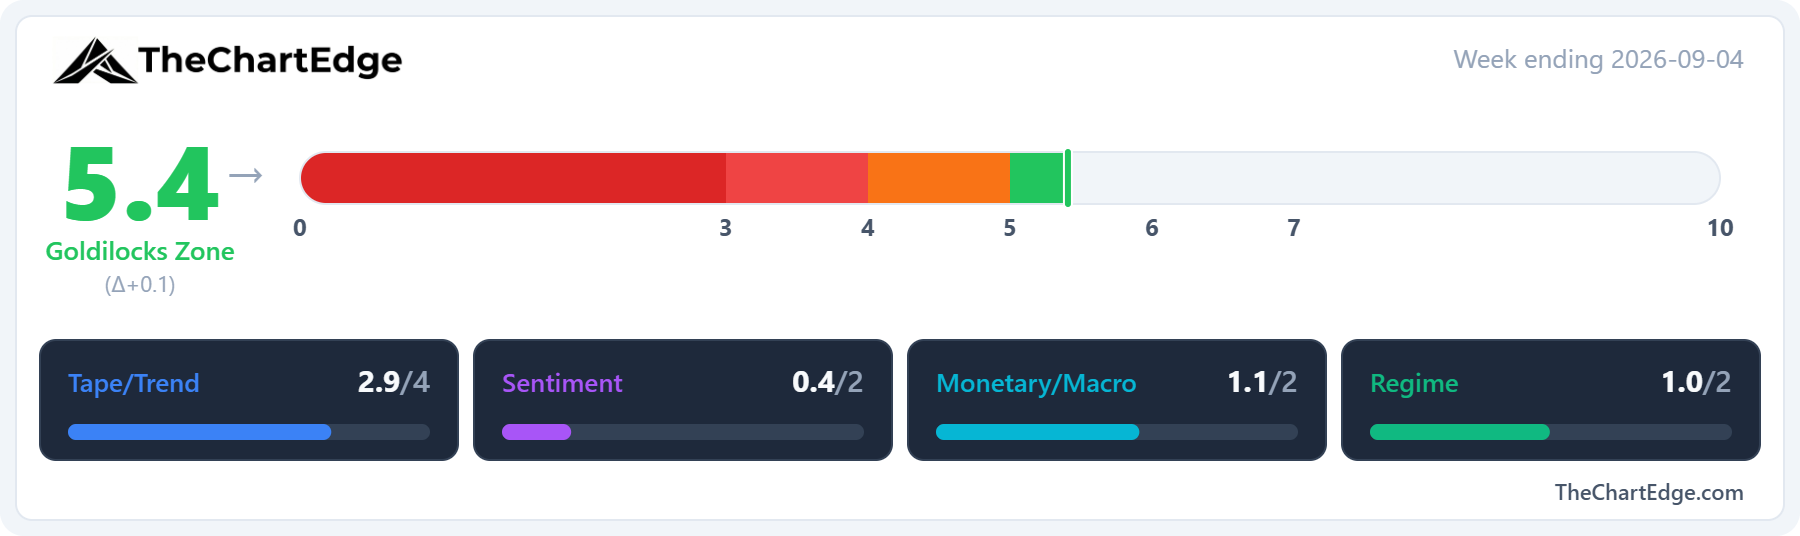
The Market Temperature came in at 5.4, up from 5.3, a fifth straight week in the Goldilocks Zone.
The Tape/Trend pillar rose, although half the move was due to QQQ moving back into the Strong Uptrend state. SPY’s weekly RSI accounted for about a quarter of the pillar increase - it rose to 64.2 from 64.0 but scored higher due to the 2-week lookback which had a lower comparison of 63.1. Week on week breadth was little changed on multiple measures. 50.3% of US stocks finished above their 50-day moving average, from 50.7%, and 56.2% two weeks ago. Overall, the breadth measures in the model still scored negatively due to the two-week look-back. However, they were less negative than last weekend and therefore added slightly to the pillar’s score relative to last week.
The Monetary/Macro pillar fell slightly - the majority due to the MOVE index rising to 73 from 71.
The Regime pillar also fell a touch. The XLY/XLP ratio was down about 1% on the week and scored even lower due to the four-week lookback which compares against the higher reading from the first week of August.
Sentiment was unchanged to one decimal place as the VIX edged up to 14.5 from 14.4.
GICS Sector Relative Strength
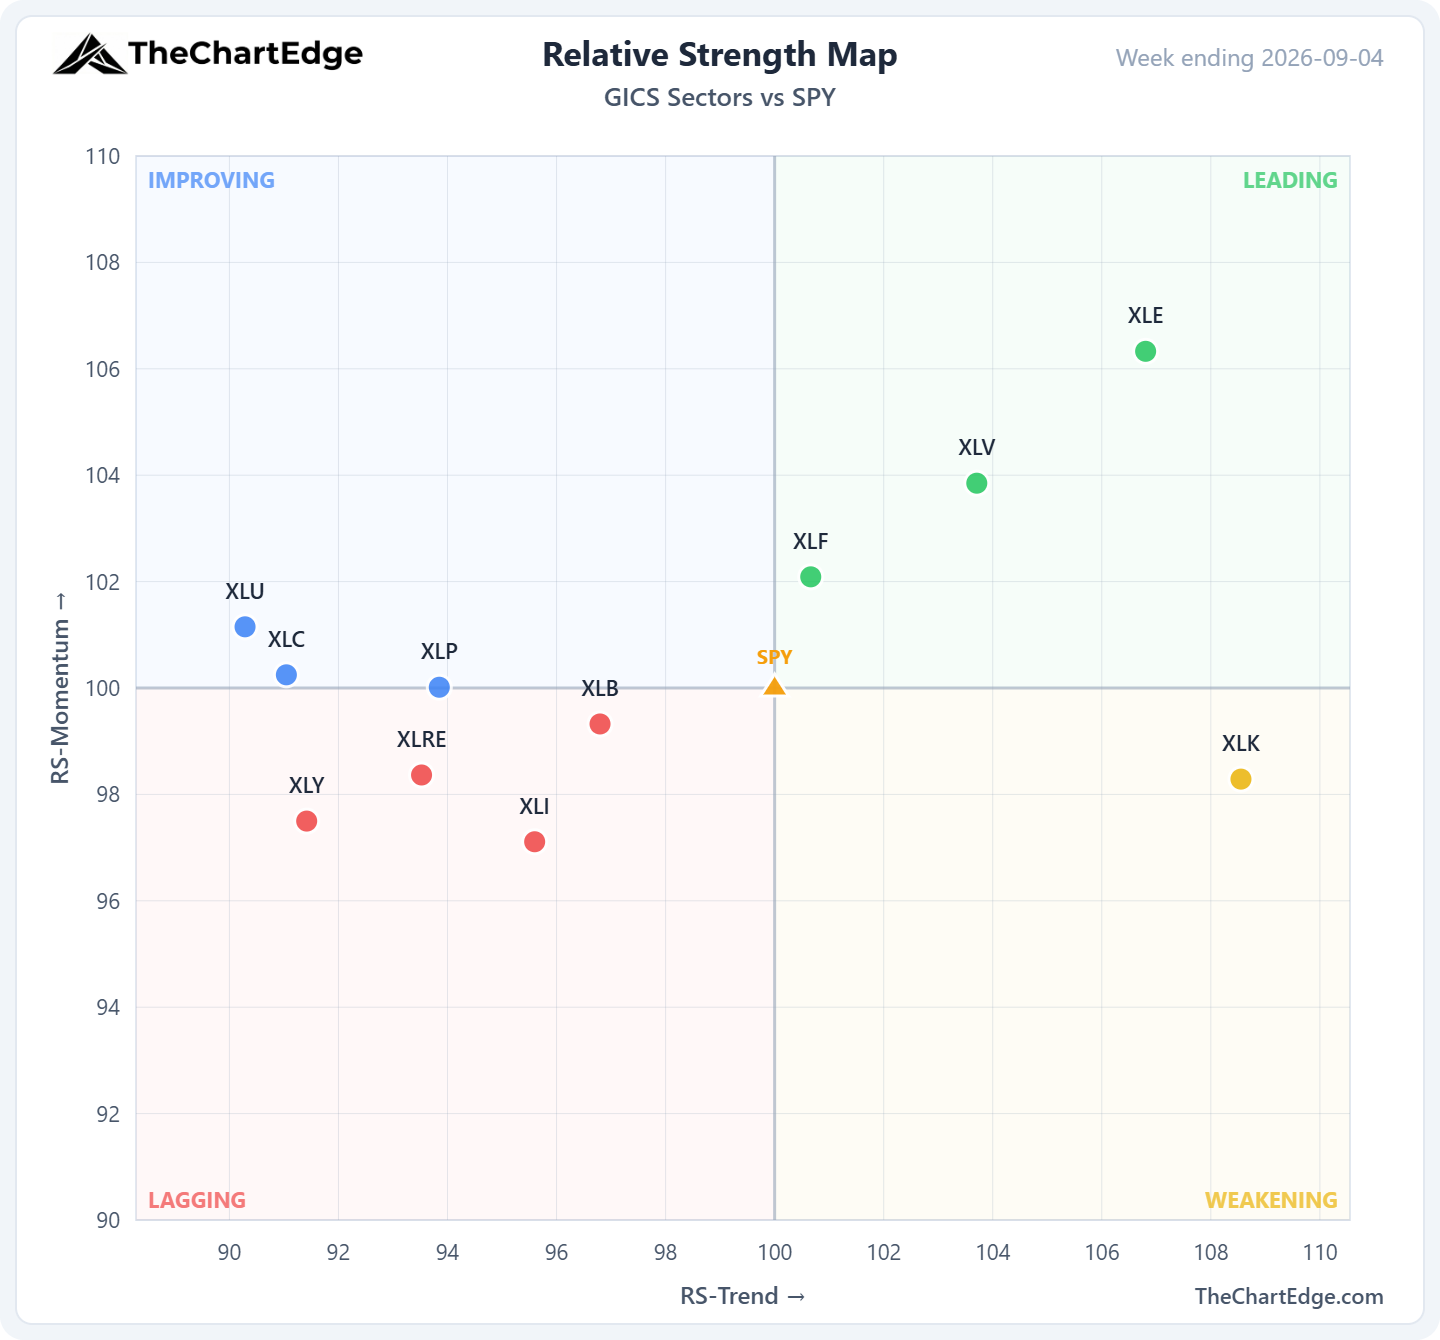
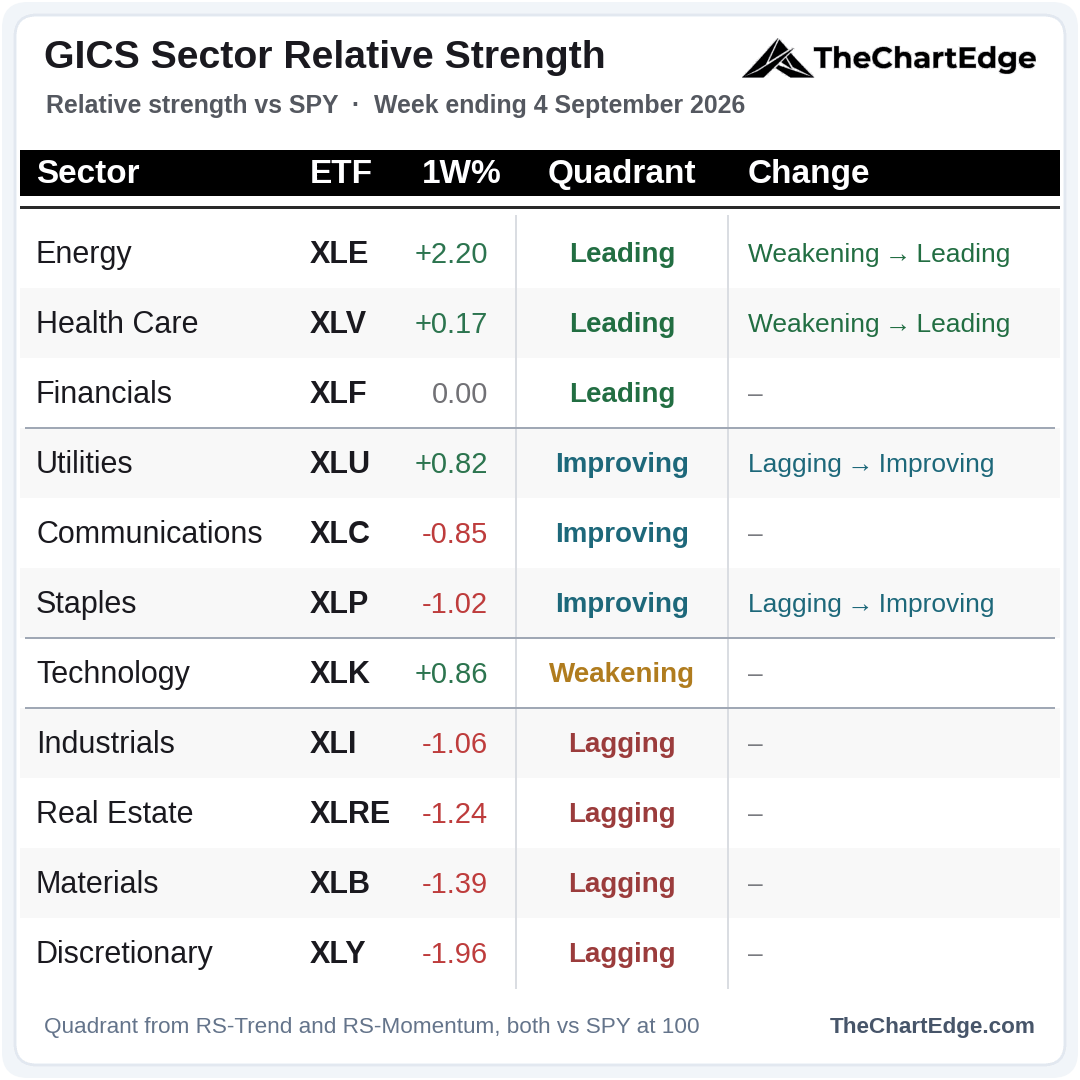
Energy, technology, utilities and health care finished higher, and financials were flat.
Energy and health care moved back into Leading after one week in Weakening, joining financials.
Utilities and staples moved from Lagging into Improving.
Technology is in Weakening for a fourth week.
Momentum Leaderboard
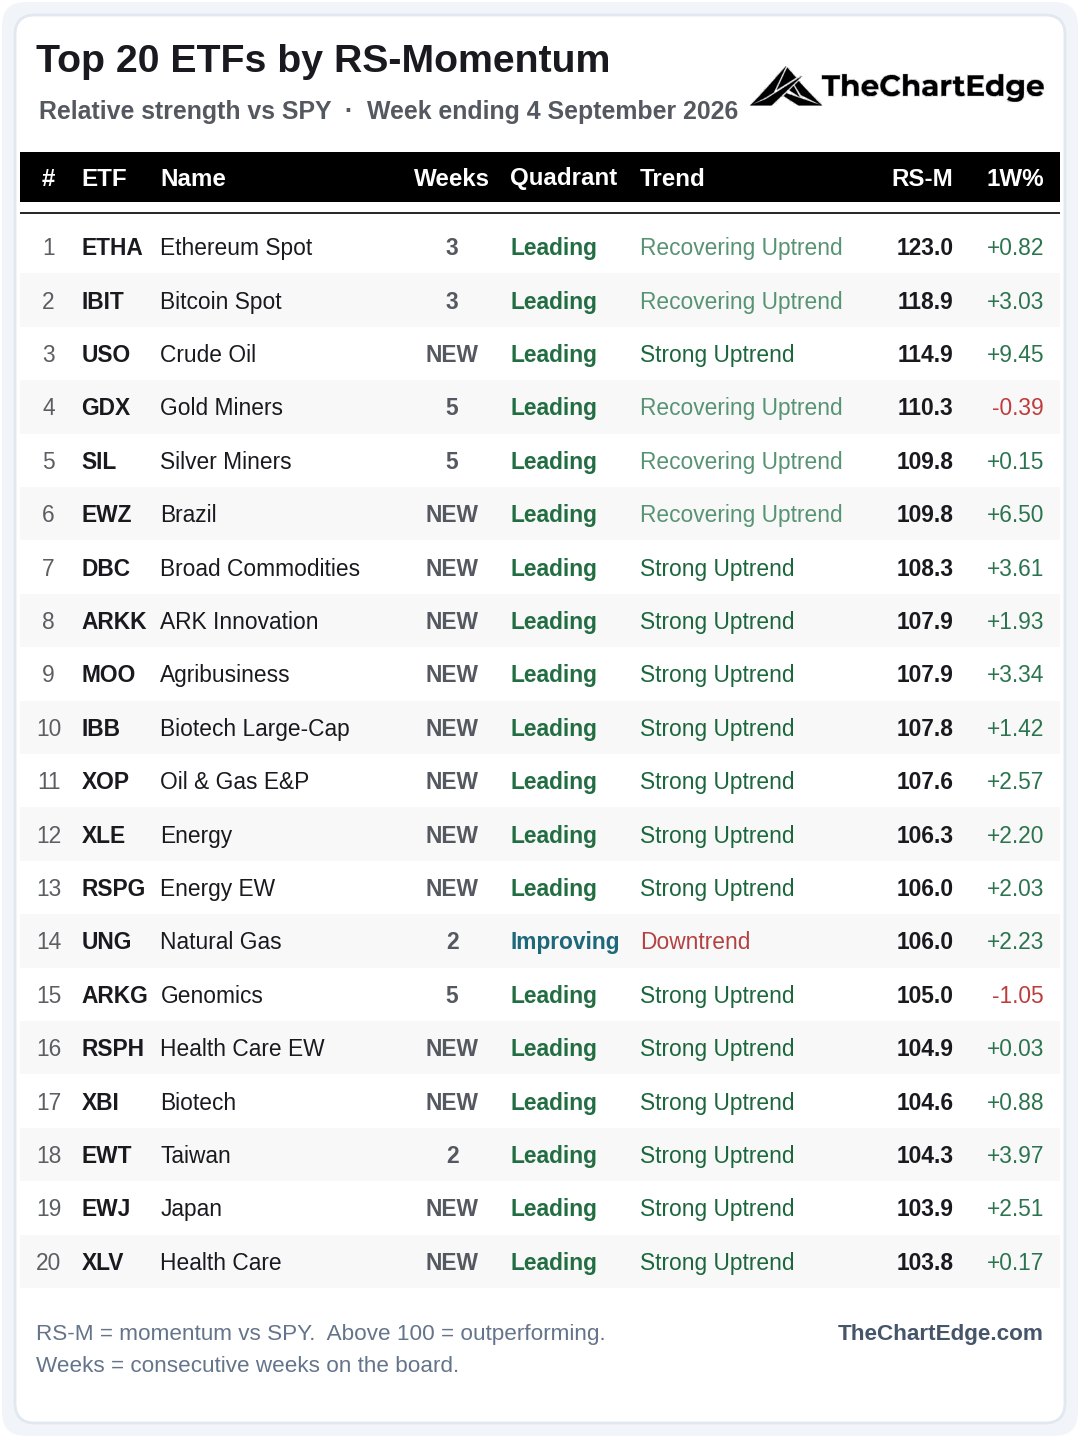
13 of the 20 are new this weekend. All 5 of the software and tech names that arrived last weekend are gone - IGV, FCLD, CIBR, FDN, FNGS - as well as equal-weight software (XSW) which had the longest streak at five last weekend. The financials (KCE and XLF), Germany (EWG), Copper Miners (COPX), Palladium (PALL), Uranium (URA) and Anti-Beta (BTAL) are also gone.
Energy is back, yet again - Crude (USO) is at number three, Oil & Gas E&P (XOP), Energy (XLE) and equal-weight energy (RSPG) at numbers 11, 12 and 13.
Health care and biotech are back too, after dropping off for a week - Biotech Large-Cap (IBB), Biotech (XBI), equal-weight health care (RSPH) and Health Care (XLV), rejoin Genomics (ARKG).
Ethereum (ETHA) and Bitcoin (IBIT) take the top 2 spots this weekend, despite not having large weekly moves.
Gold Miners (GDX), Silver Miners (SIL) and Genomics (ARKG) share the longest streak at five weeks.
14 of the 20 are in Strong Uptrends, from 12 last weekend.
Trend States Across the Universe
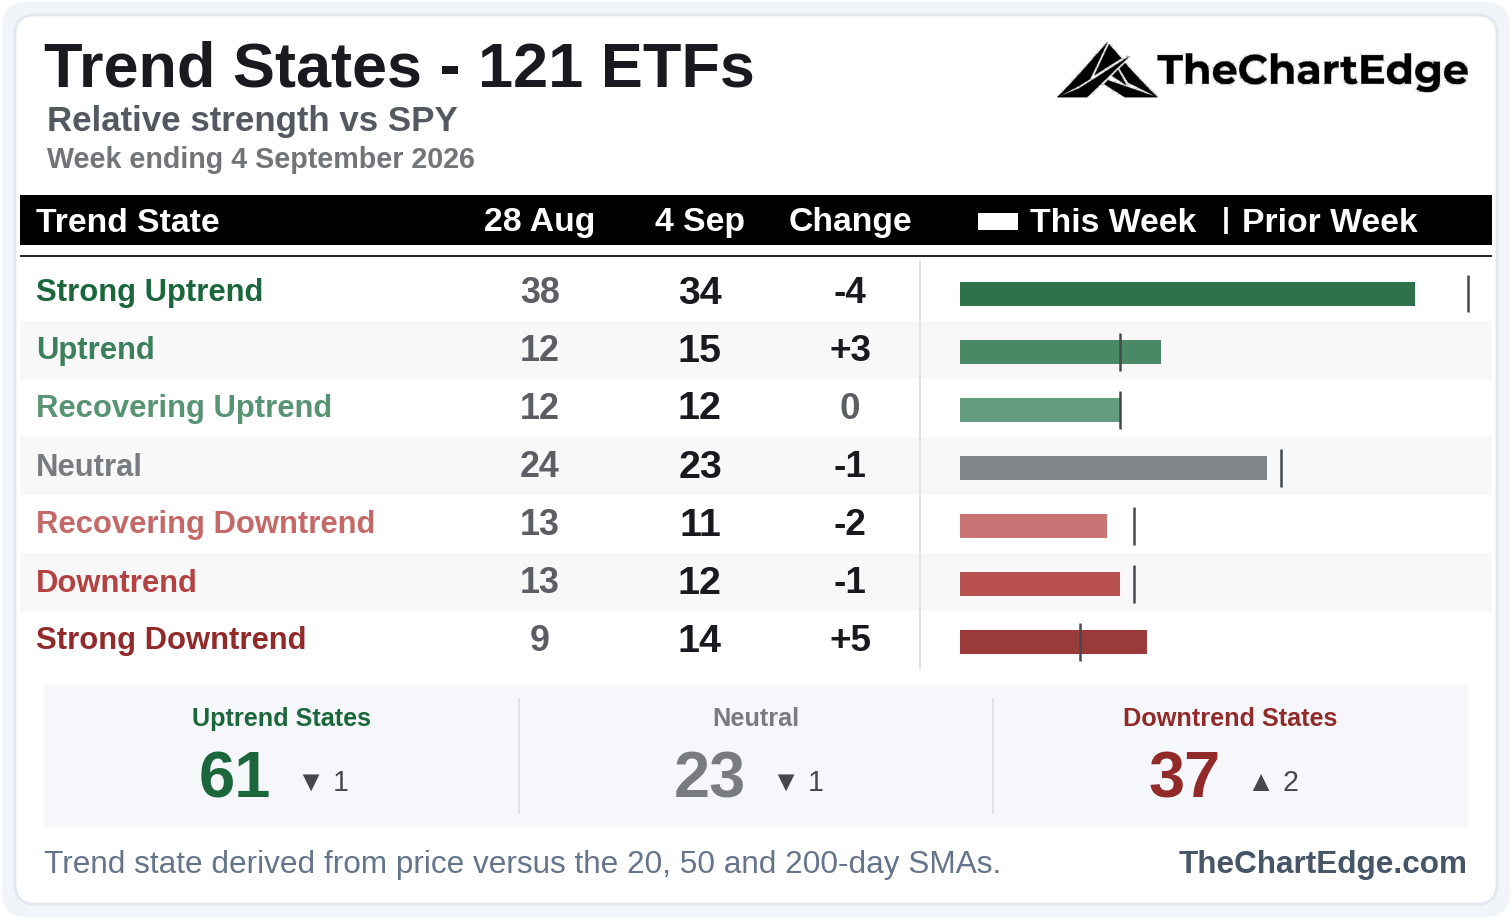
At the aggregate level things were basically unchanged. Underneath, Strong Uptrends fell from 38 to 34 - some notable ETFs that slipped from Strong Uptrend to Uptrend include software (IGV), cyber, copper miners and the equal-weight Nasdaq 100, while those that moved up to a Strong Uptrend include QQQ, Generative AI (CHAT) and High Beta (SPHB).
Strong Downtrends rose from 9 to 14, including all four of the US government bond ETFs I track.
Industry Breadth - Leading Stocks
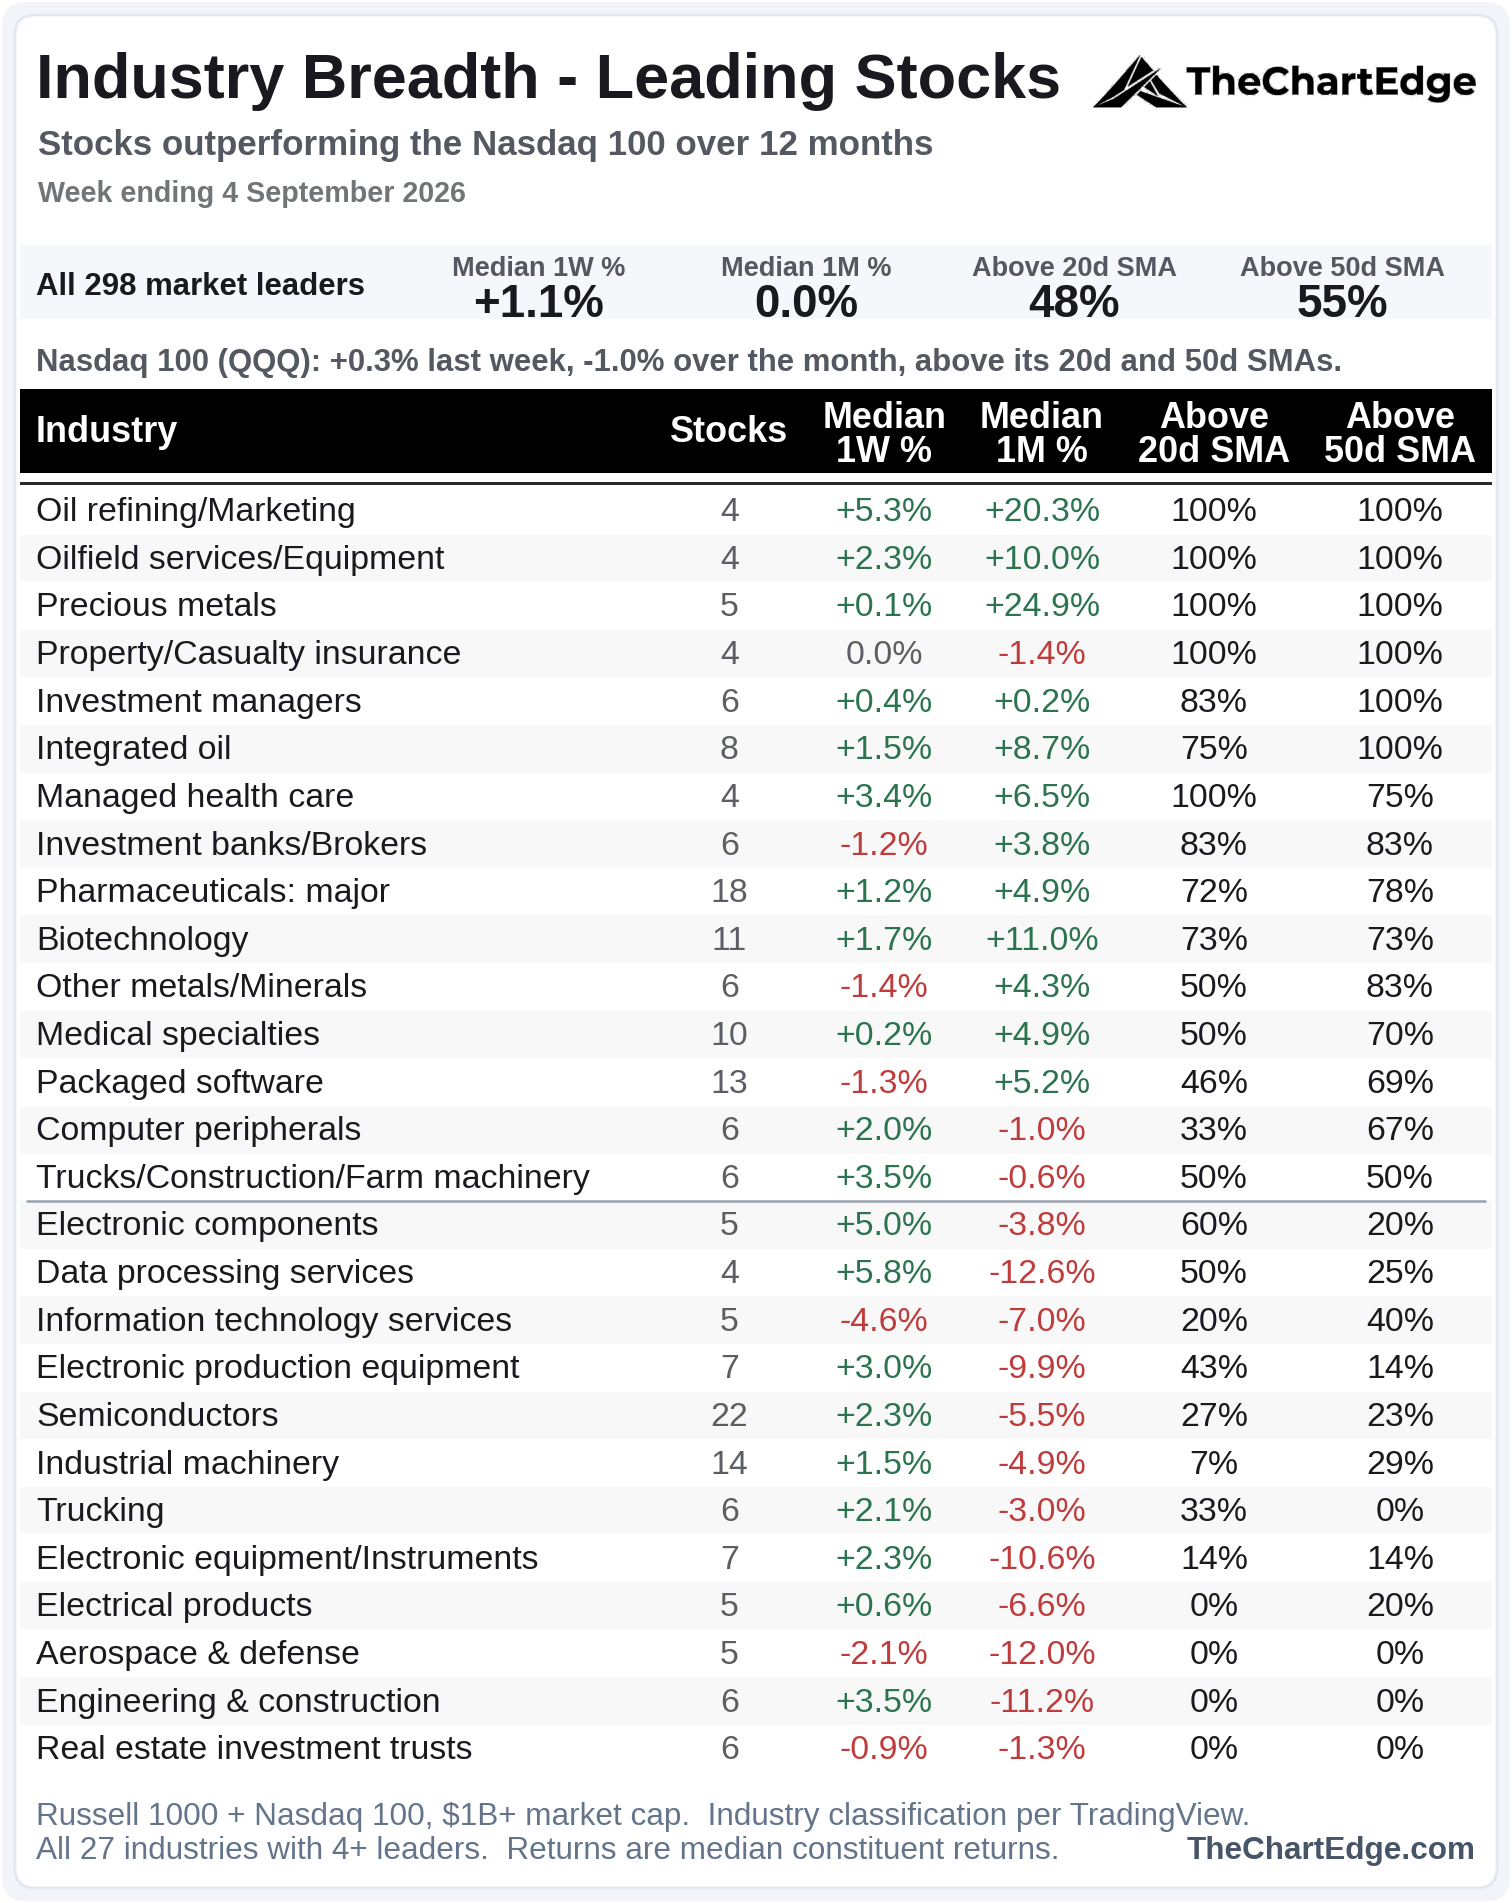
This board looks a bit better than last weekend. 12 of 27 industries sit below the line, from 13 of 29, and the percentage of leaders above their 20-day SMA rose to 48% from 44%. The universe barely changed - 298 names versus 300.
Oil, precious metals and P/C insurance are still at the top of the board, and managed health care jumped from 21st to 7th.
Semiconductors improved a little, now with 6 of its 22 names above the 20-day SMA, from 1 last weekend. Packaged software lost ground, now with only 46% of names above the 20-day, down from 71%.
Semis & AI Looking Better
SMH Chart
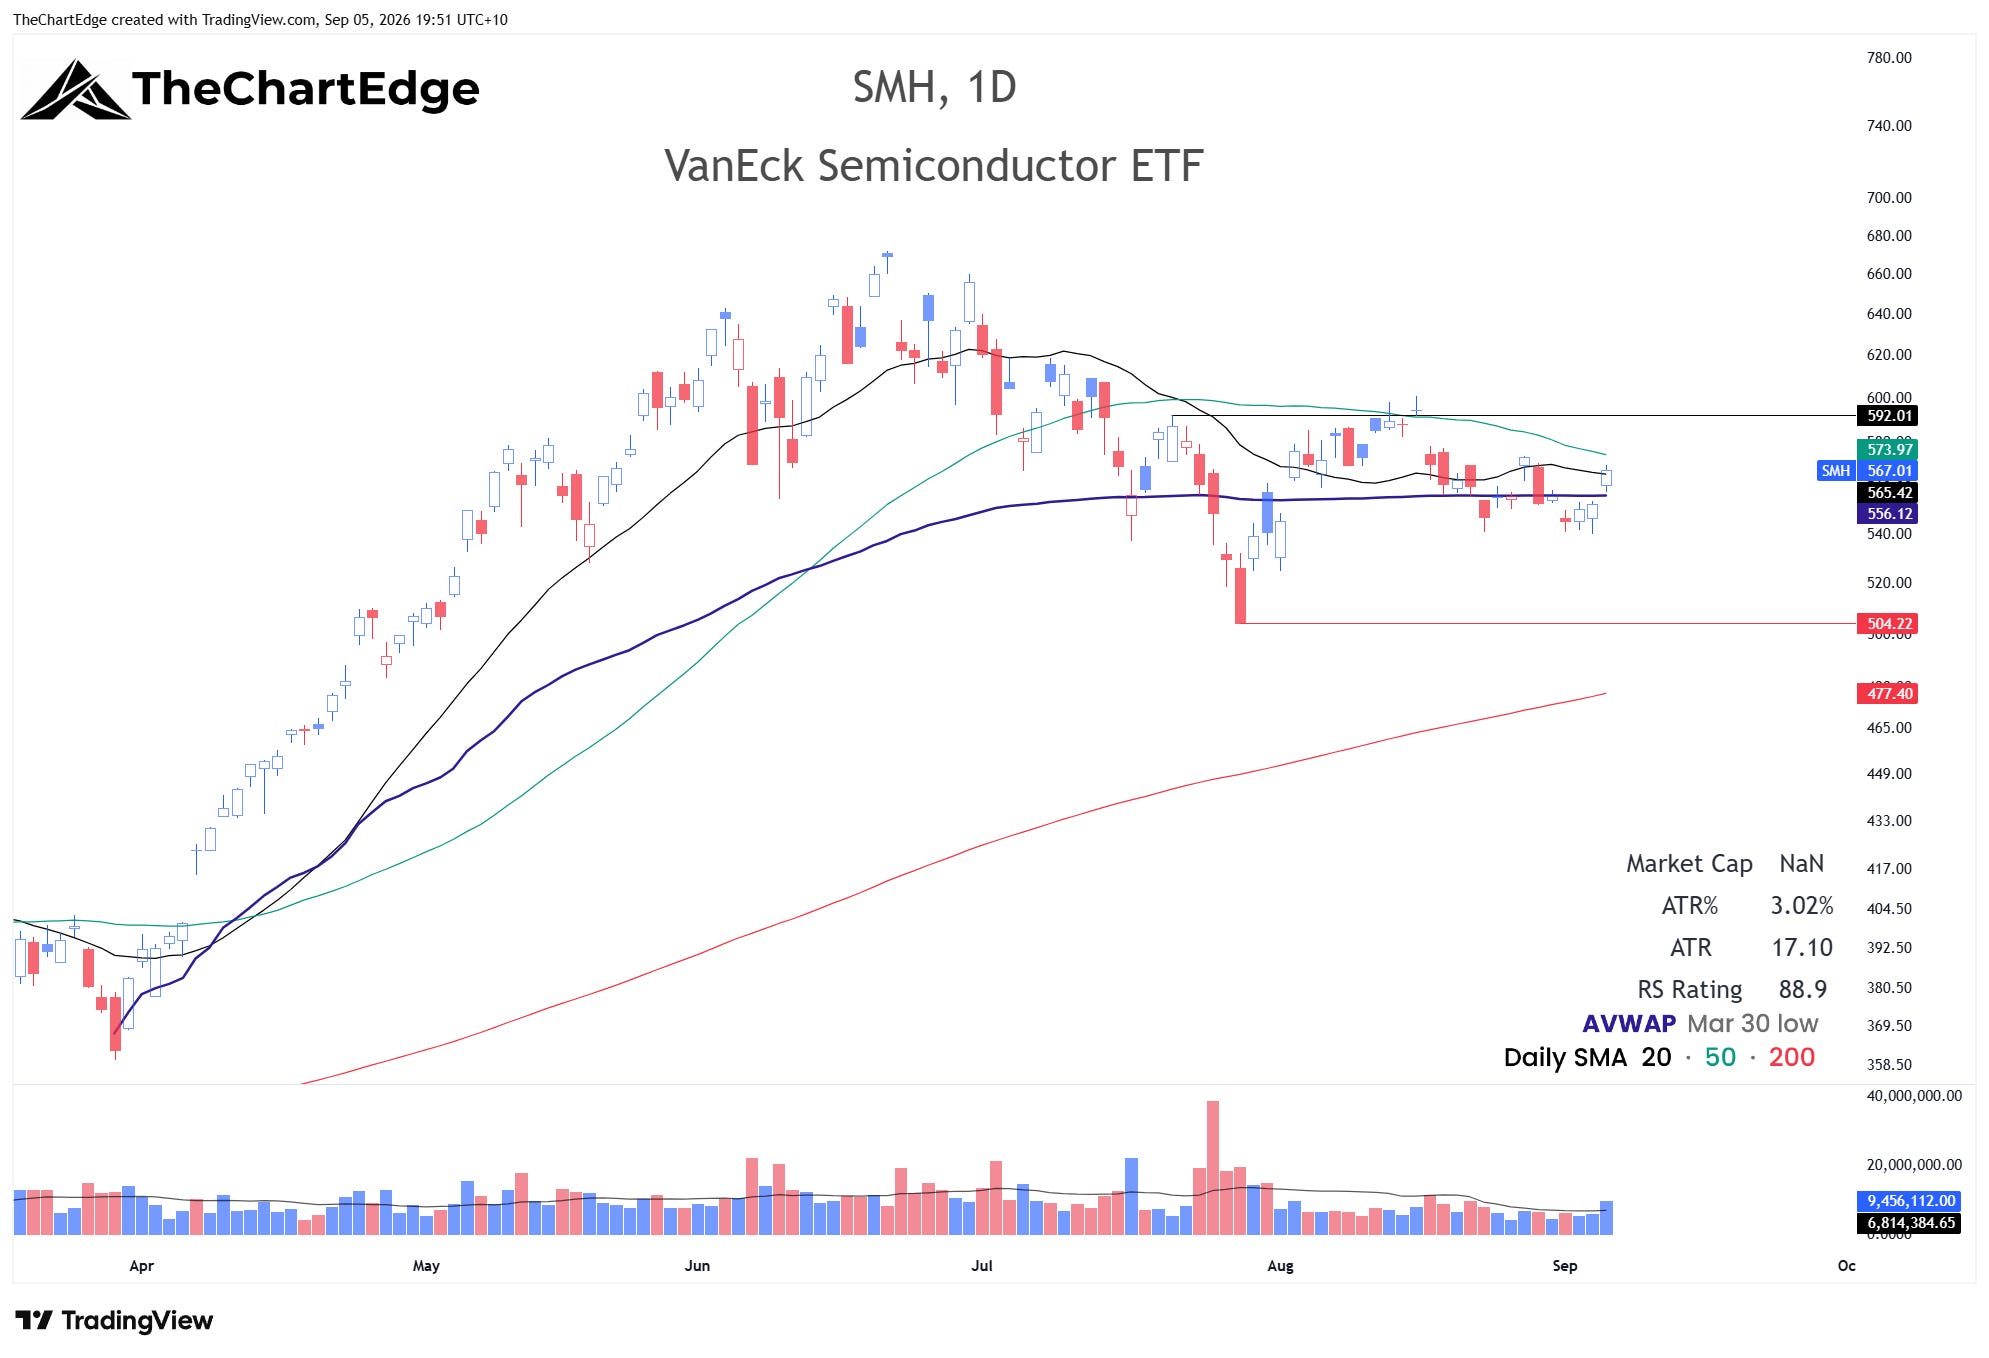
SMH rose 2.5% and closed at 567.01, above its 20-day SMA and the AVWAP from the March 30 low. I’m not too excited yet with the 20 and 50-day SMAs still declining. But if it can close above 592, I’ll be paying a lot more attention.
Generative AI (CHAT) Chart
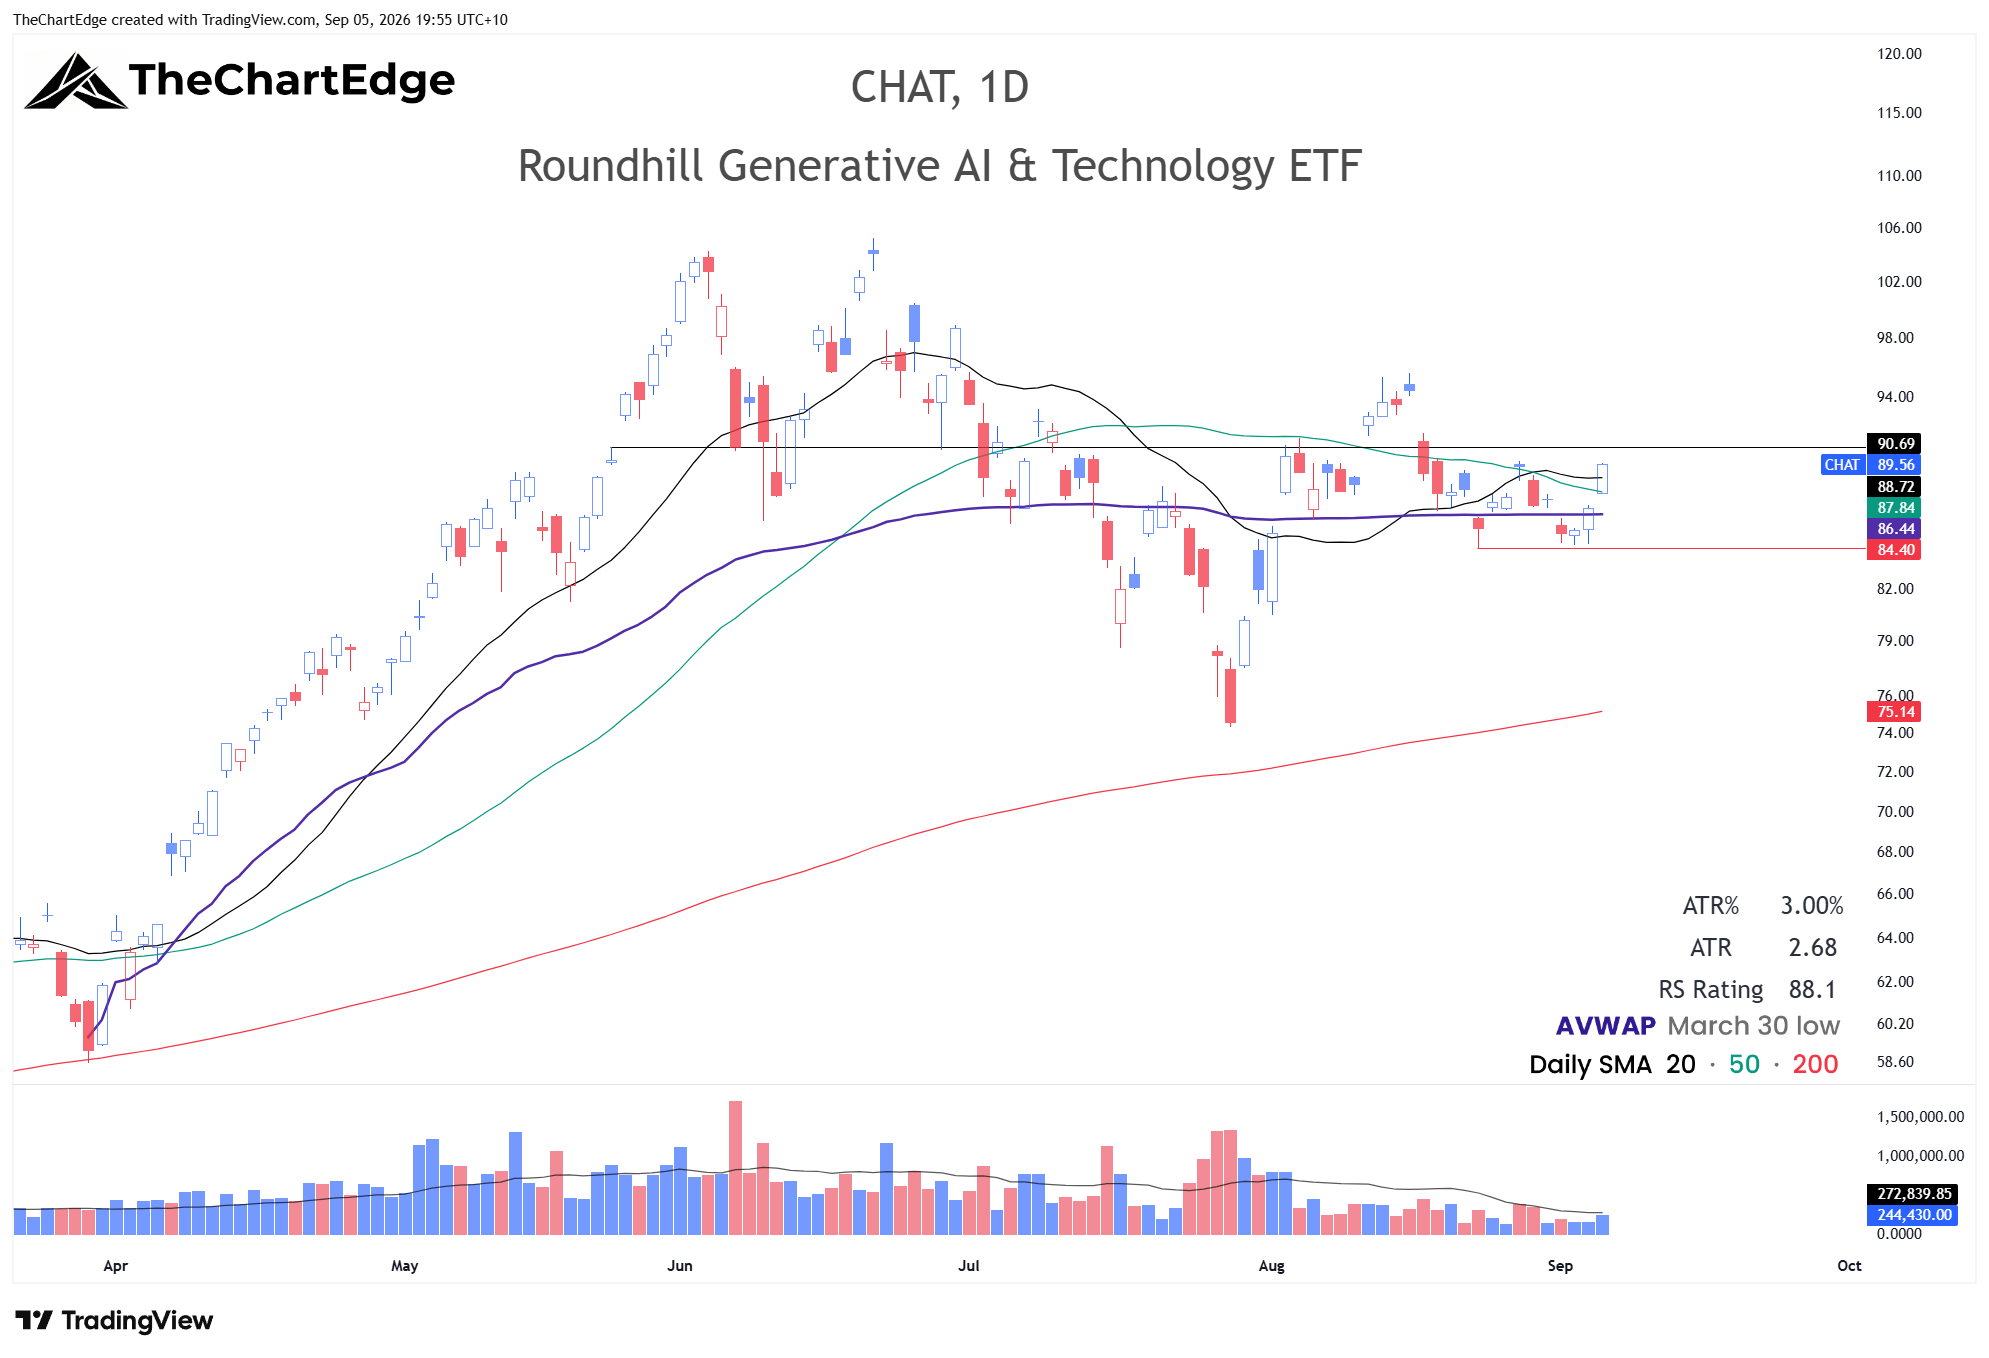
Generative AI (CHAT) jumped from Neutral to a Strong Uptrend, up 2.9%, closing at 89.56. This is the first AI hardware dominated ETF I track that has returned to the Strong Uptrend state in the last couple of months. I will be watching to see if it holds and whether other AI ETFs also start improving.
ROBO Global Artificial Intelligence (THNQ) Chart
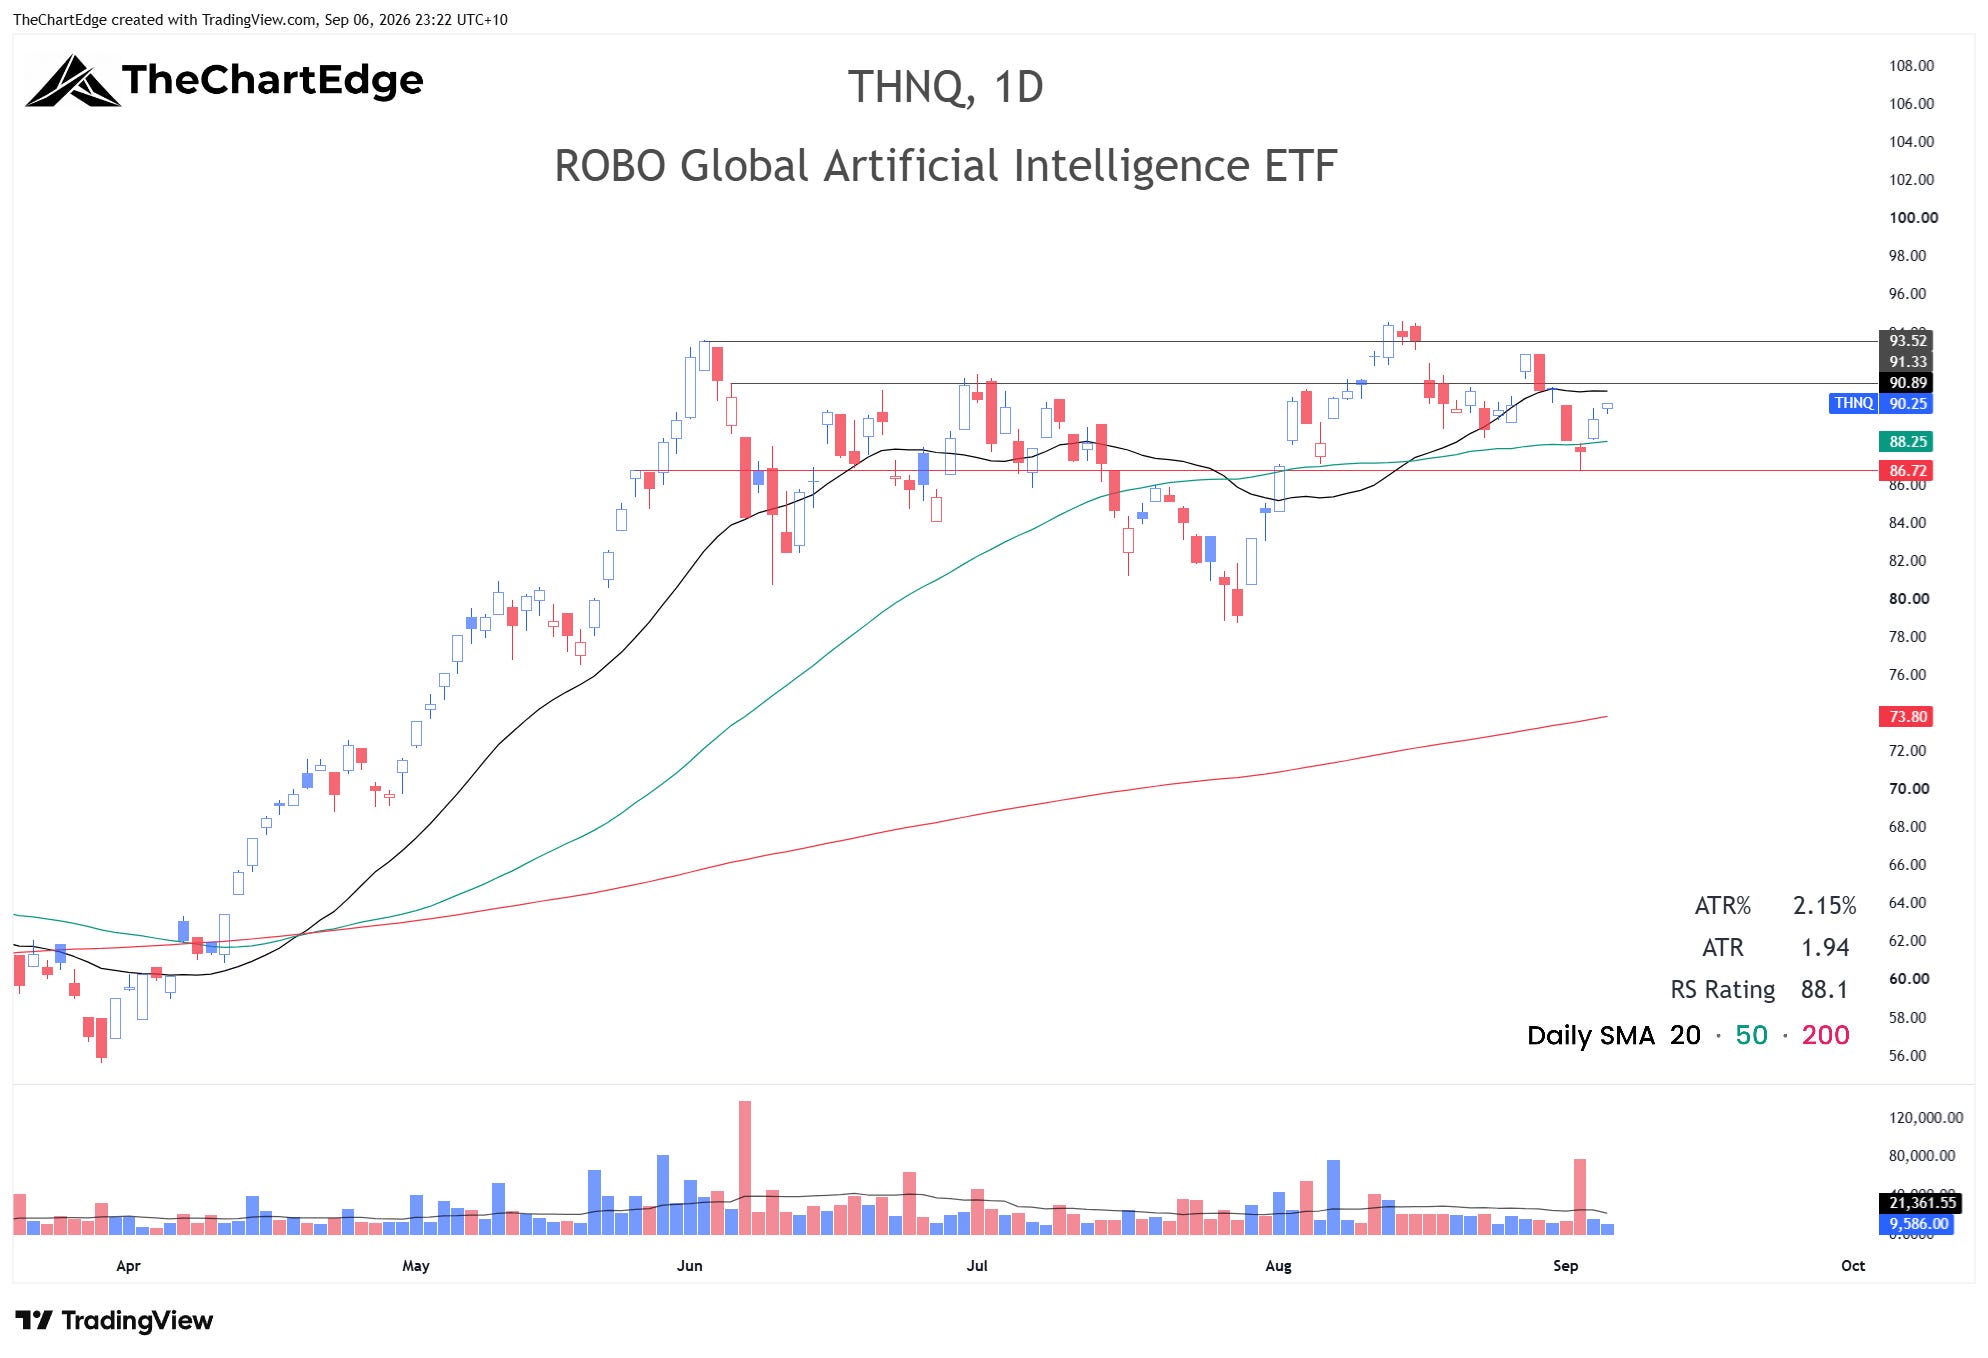
THNQ, an AI ETF that is more heavily weighted towards software names, held its Strong Uptrend state until July 10 - a week or two longer than the other AI ETFs I track. It also regained the Strong Uptrend state on August 21 and held there for two weeks. However, it slipped back to Uptrend last week. The chart still looks pretty good though, particularly relative to other AI.
I wouldn’t be surprised to see a rotation back into AI and hardware names at some stage in the next month or two.
Software (IGV) Gives Back Most of Last Week’s Gains
Software (IGV) Chart
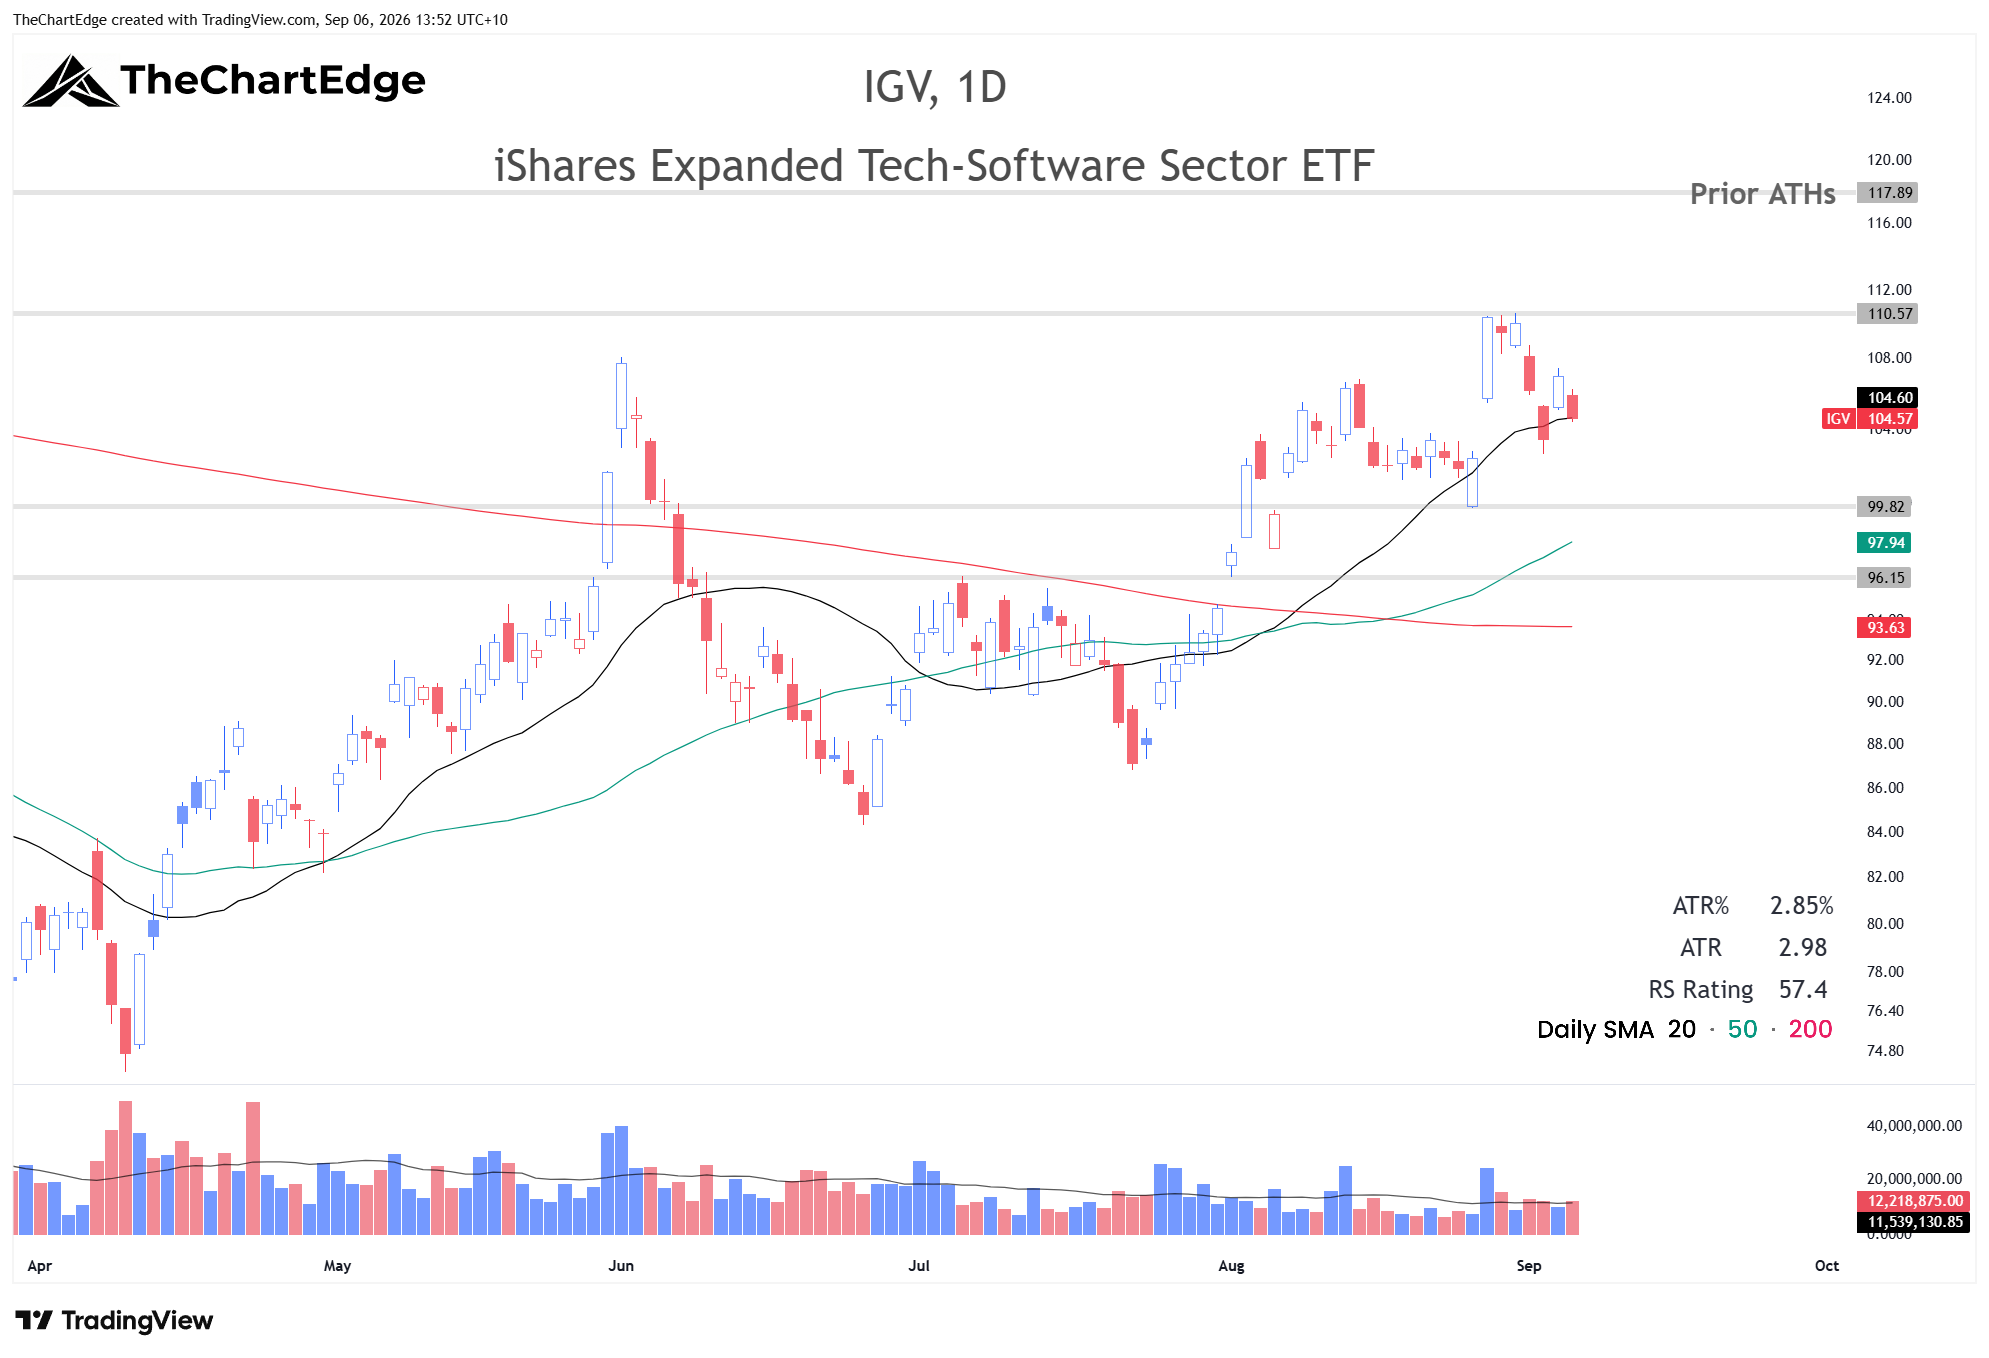
Software (IGV) was the worst ETF in the universe, down 4.5%, one week after being the best. It dropped from Strong Uptrend to Uptrend, as it closed just under its 20-day SMA. If I were long, I would want it to hold Friday’s low, or at worst Wednesday’s low around 102.50, before potentially making a run at 110.50 and then its prior ATHs around 117.90. Its uptrend off the April 10 low hasn’t been the cleanest, dropping below its 50-day SMA both in June and July. So, a deeper pullback to somewhere around the 50-day, which currently sits at around 98 (anywhere between 96-100) wouldn’t be out of character.
Follow-Up on Ethereum
Ethereum Chart
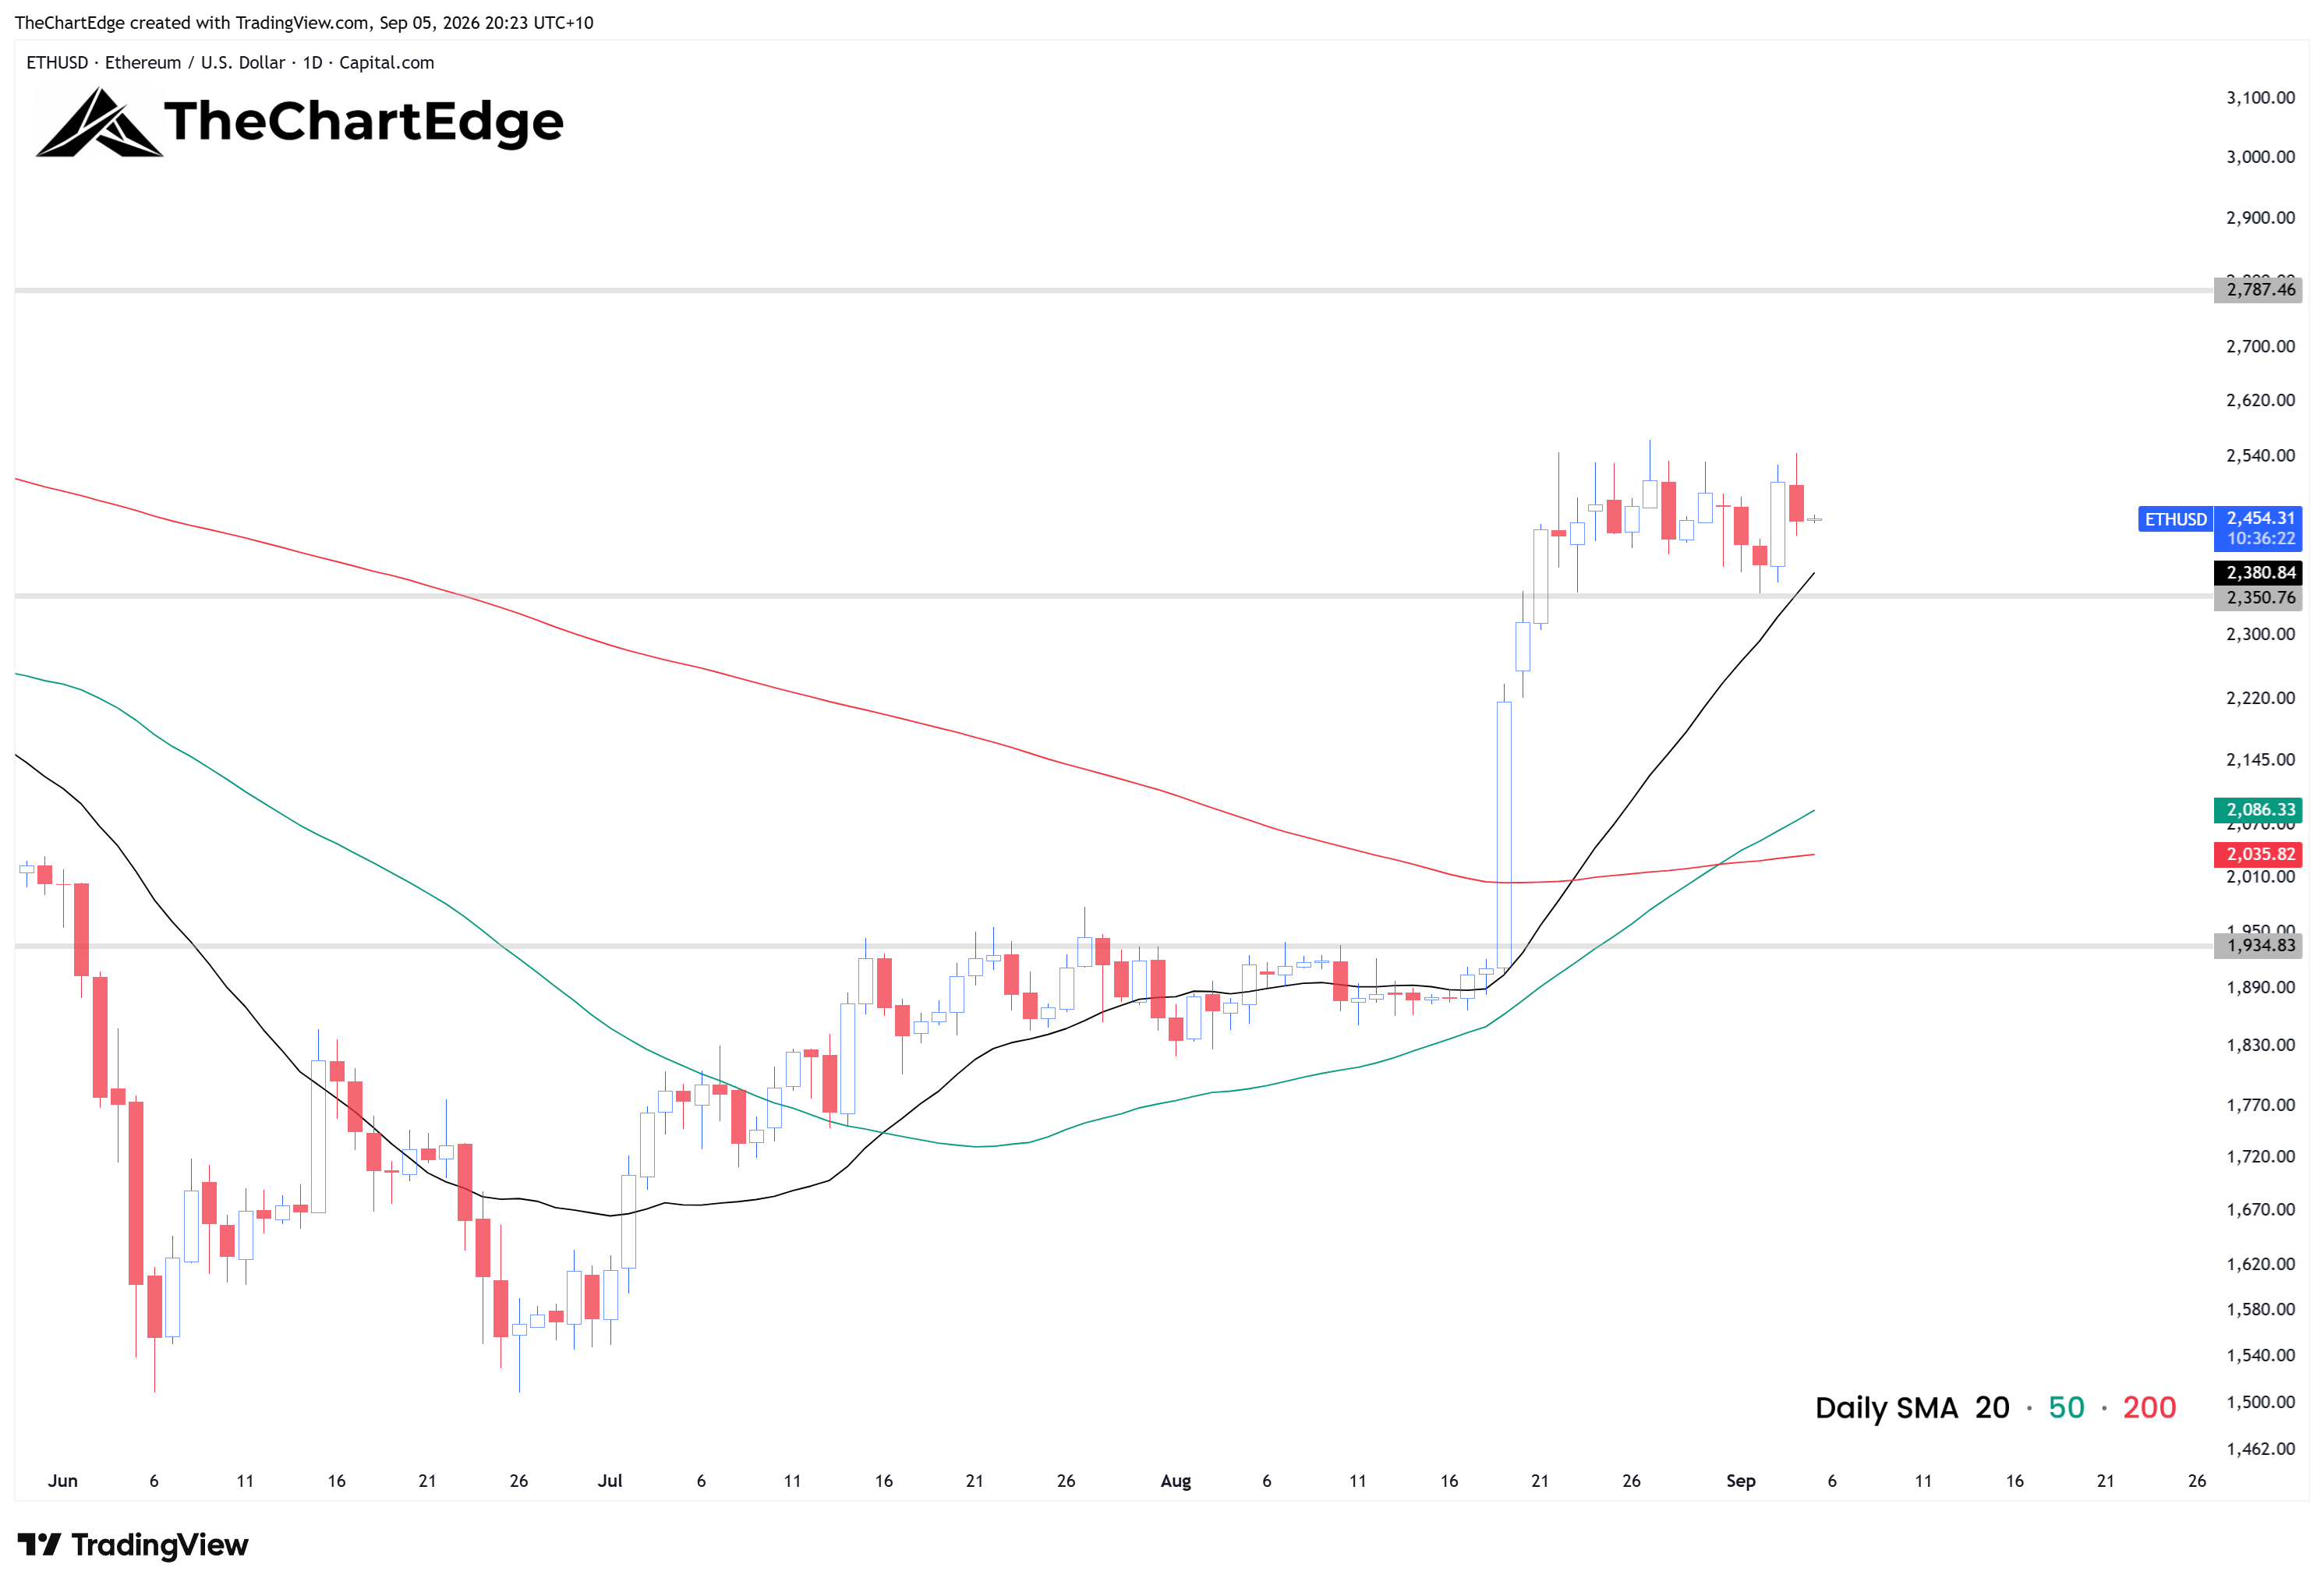
Spot Ethereum tested 2350 on Wednesday. It held successfully and is trading around 2475 as I get ready to post this. I was looking for an undercut and reclaim of 2350 to shake out those with stops sitting under 2350, but it didn’t happen. I am still looking to enter a new position, but I can finesse my entries a bit more given it trades 24/7. I may even look to do a day-trade entry in larger size and then take some off if it goes higher to lock in breakeven or close to on the trade, letting the rest run for a bigger potential move. If it’s still in the 2350-2550 range, I’d want my stop under 2350 for any swing trade portion. However, if it clears 2550, I’d most likely look to use the most recent swing low on a 30-minute timeframe. I am also considering placing a buy stop order above the recent range highs at 2570, with a stop at 2460.
Trades & Follow-Ups
Three of last week’s resting orders triggered - XSW, LIT and ATI. I had open positions in LLY and XPH which had filled the prior week, but was stopped out of LLY.
Eli Lilly (LLY) Chart
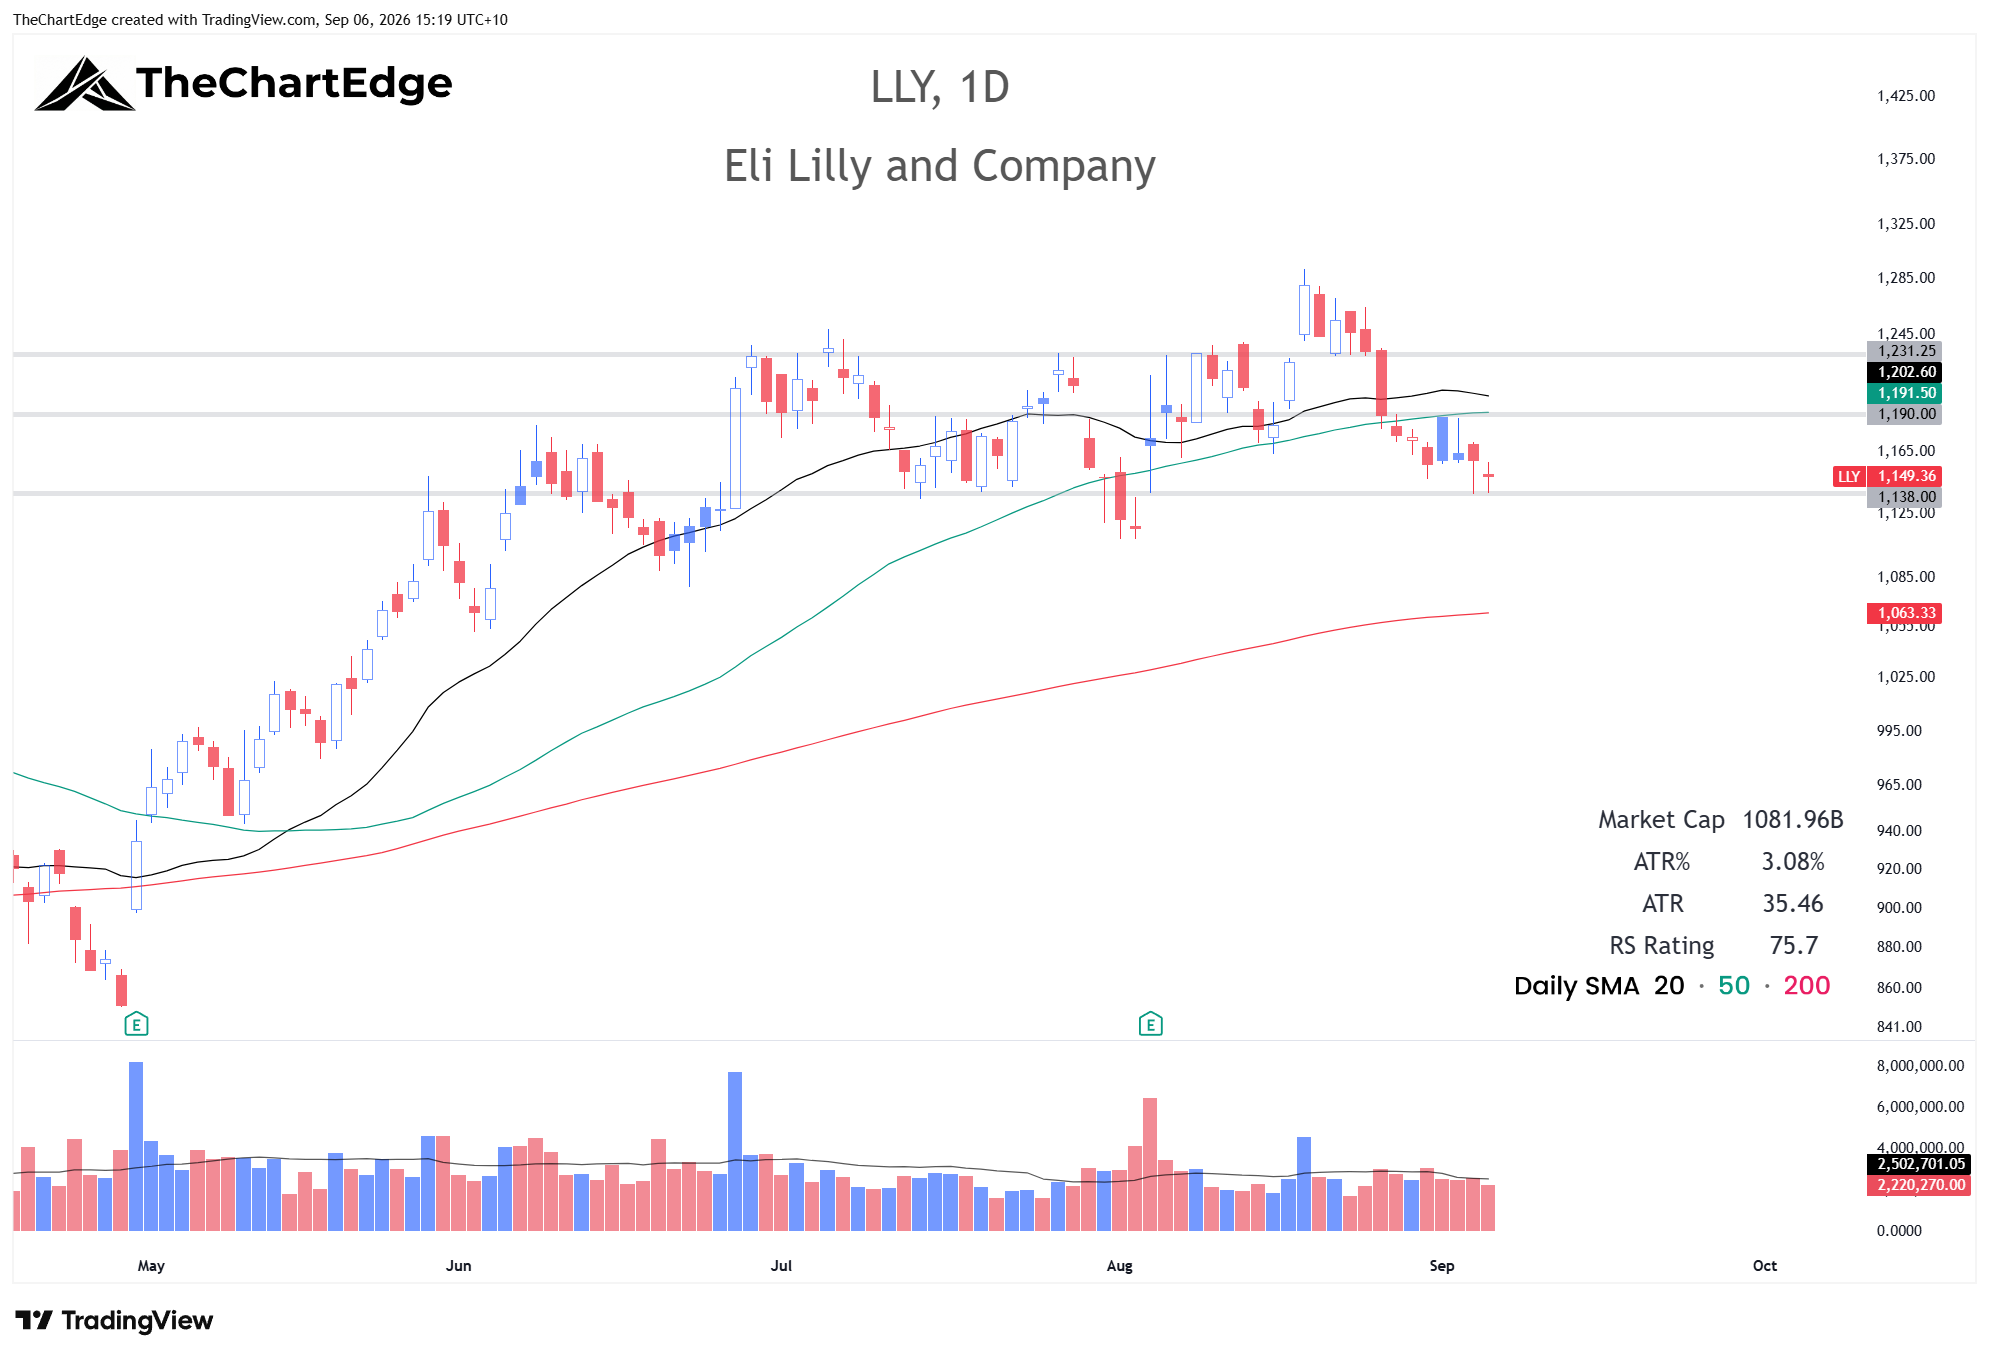
I was stopped out of Eli Lilly (LLY) at 1150 on Monday last week in the first 30 minutes of trading. The low was around 1147 and reclaimed 1150 quickly. I nearly bought it back with a stop under that low but decided not to - the right decision as it turned out. It tried and failed to reclaim the 50-day SMA on Tuesday and Wednesday and closed the week near the lows at 1149.36. It’s been living under the 50-day SMA for 7 trading days now and doesn’t look very good. If it holds 1138 it may make another attempt to go higher, but I generally don’t buy anything living under the 50-day. Even though 1 or 2 big up days would see it reclaim both the 20 and 50-day SMAs, I’m happy to wait and watch for now.
Pharmaceuticals (XPH) Chart
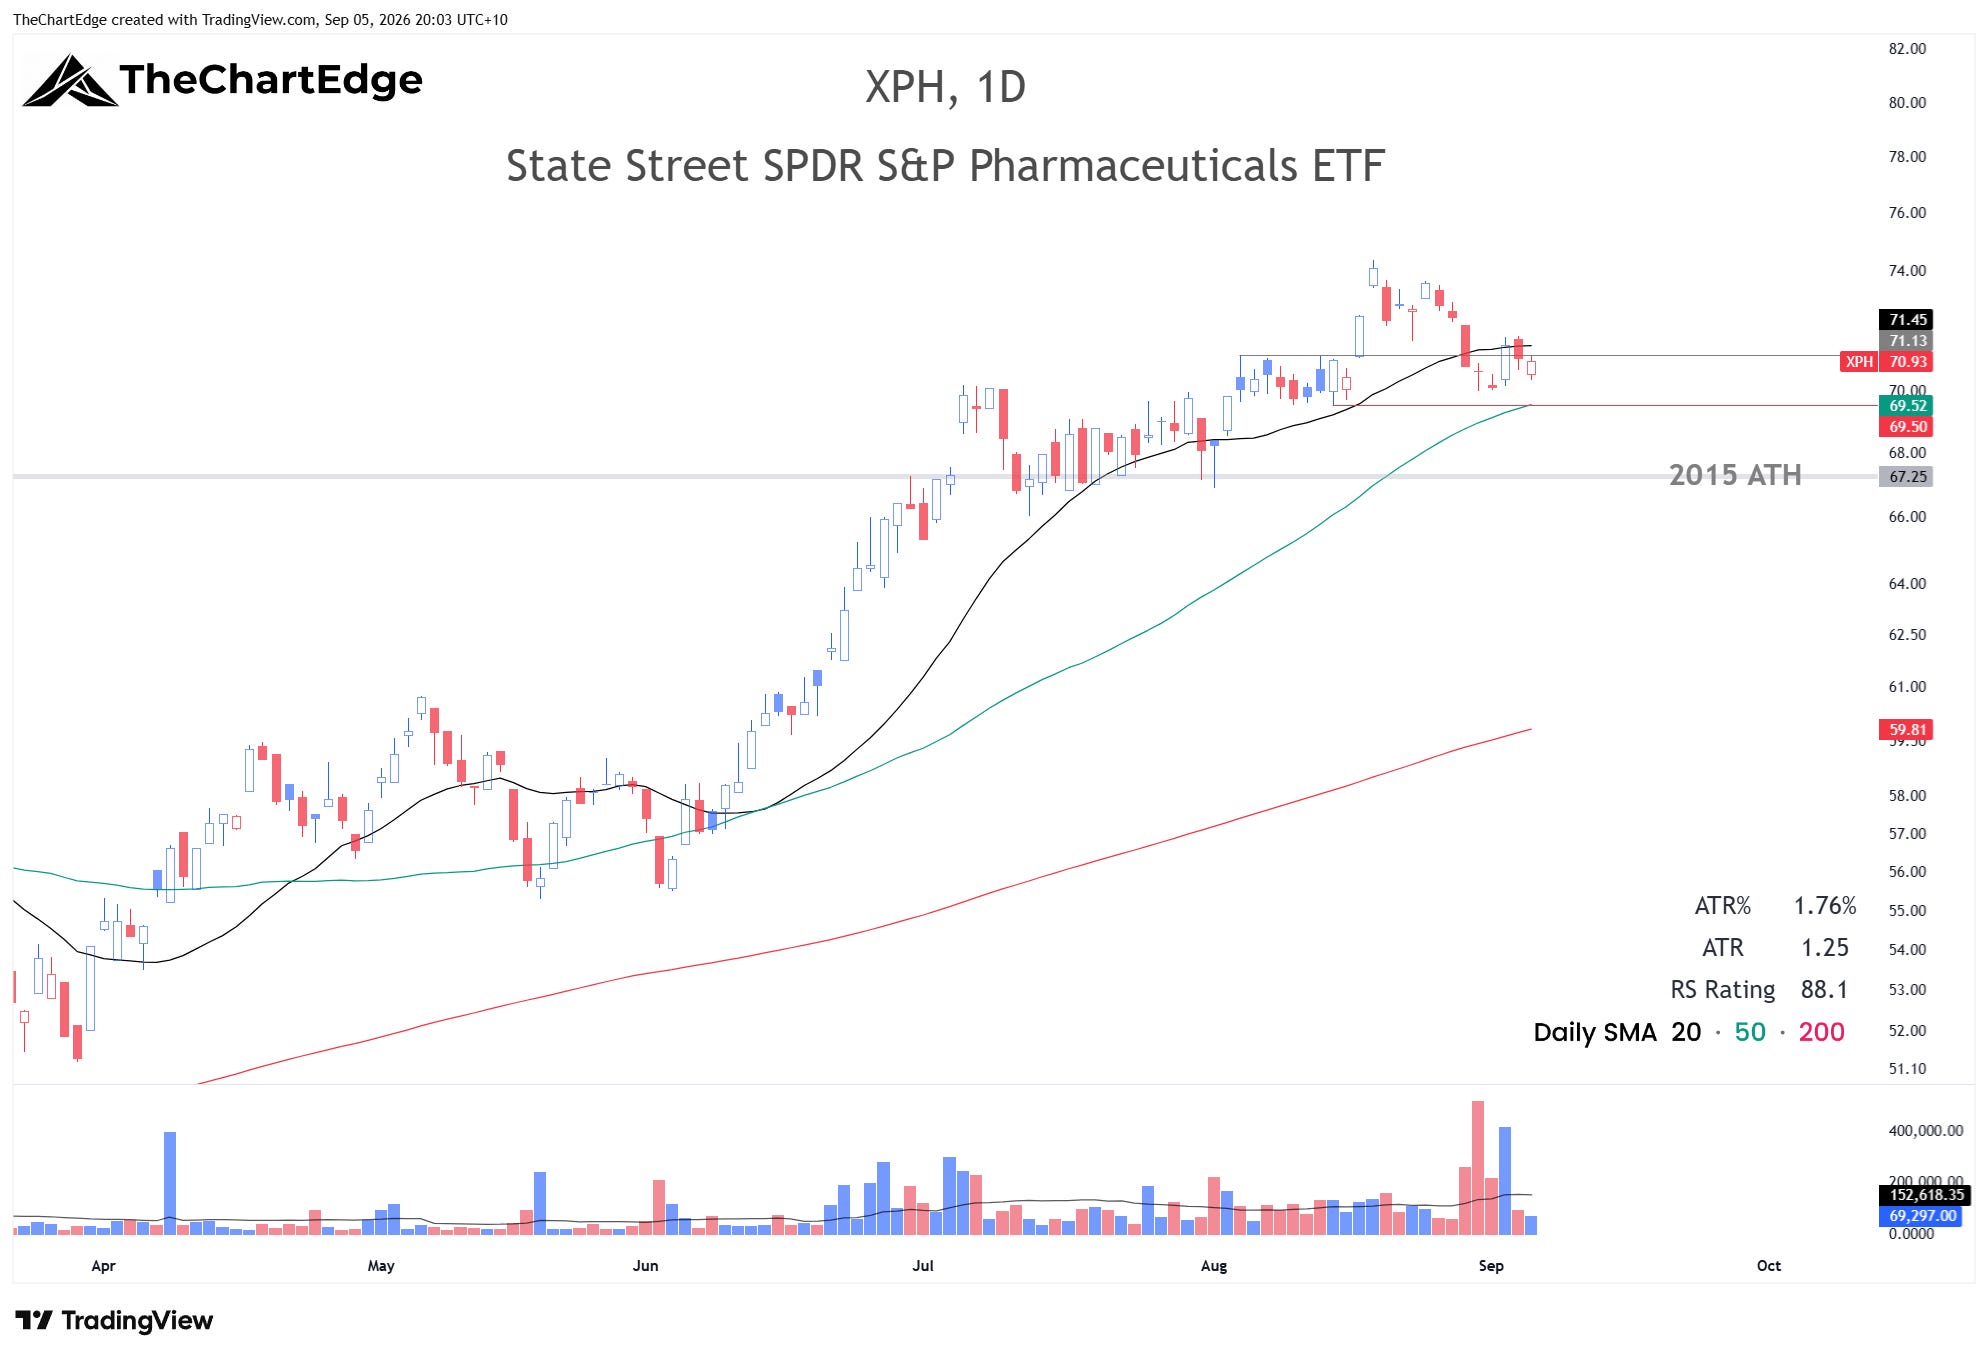
My entry on Pharmaceuticals (XPH) was at 70.95. It closed at 70.93, just under its 20-day SMA but above the 50-day at 69.52. My original stop is at 68.90. I must admit I do not particularly like the fact it spent pretty much all last week living under the 20-day. I am considering raising my stop closer to 69.50 but it’s probably not worth it, given I could only raise it at most 50 cents at this stage and would increase my odds of getting stopped out if it wicks below the 50-day. I will watch the price action early next week before making any decisions. However currently XBI, IBB and ARKG are all holding their 20-day SMA and look better than XPH.
Equal-weight software (XSW) Chart
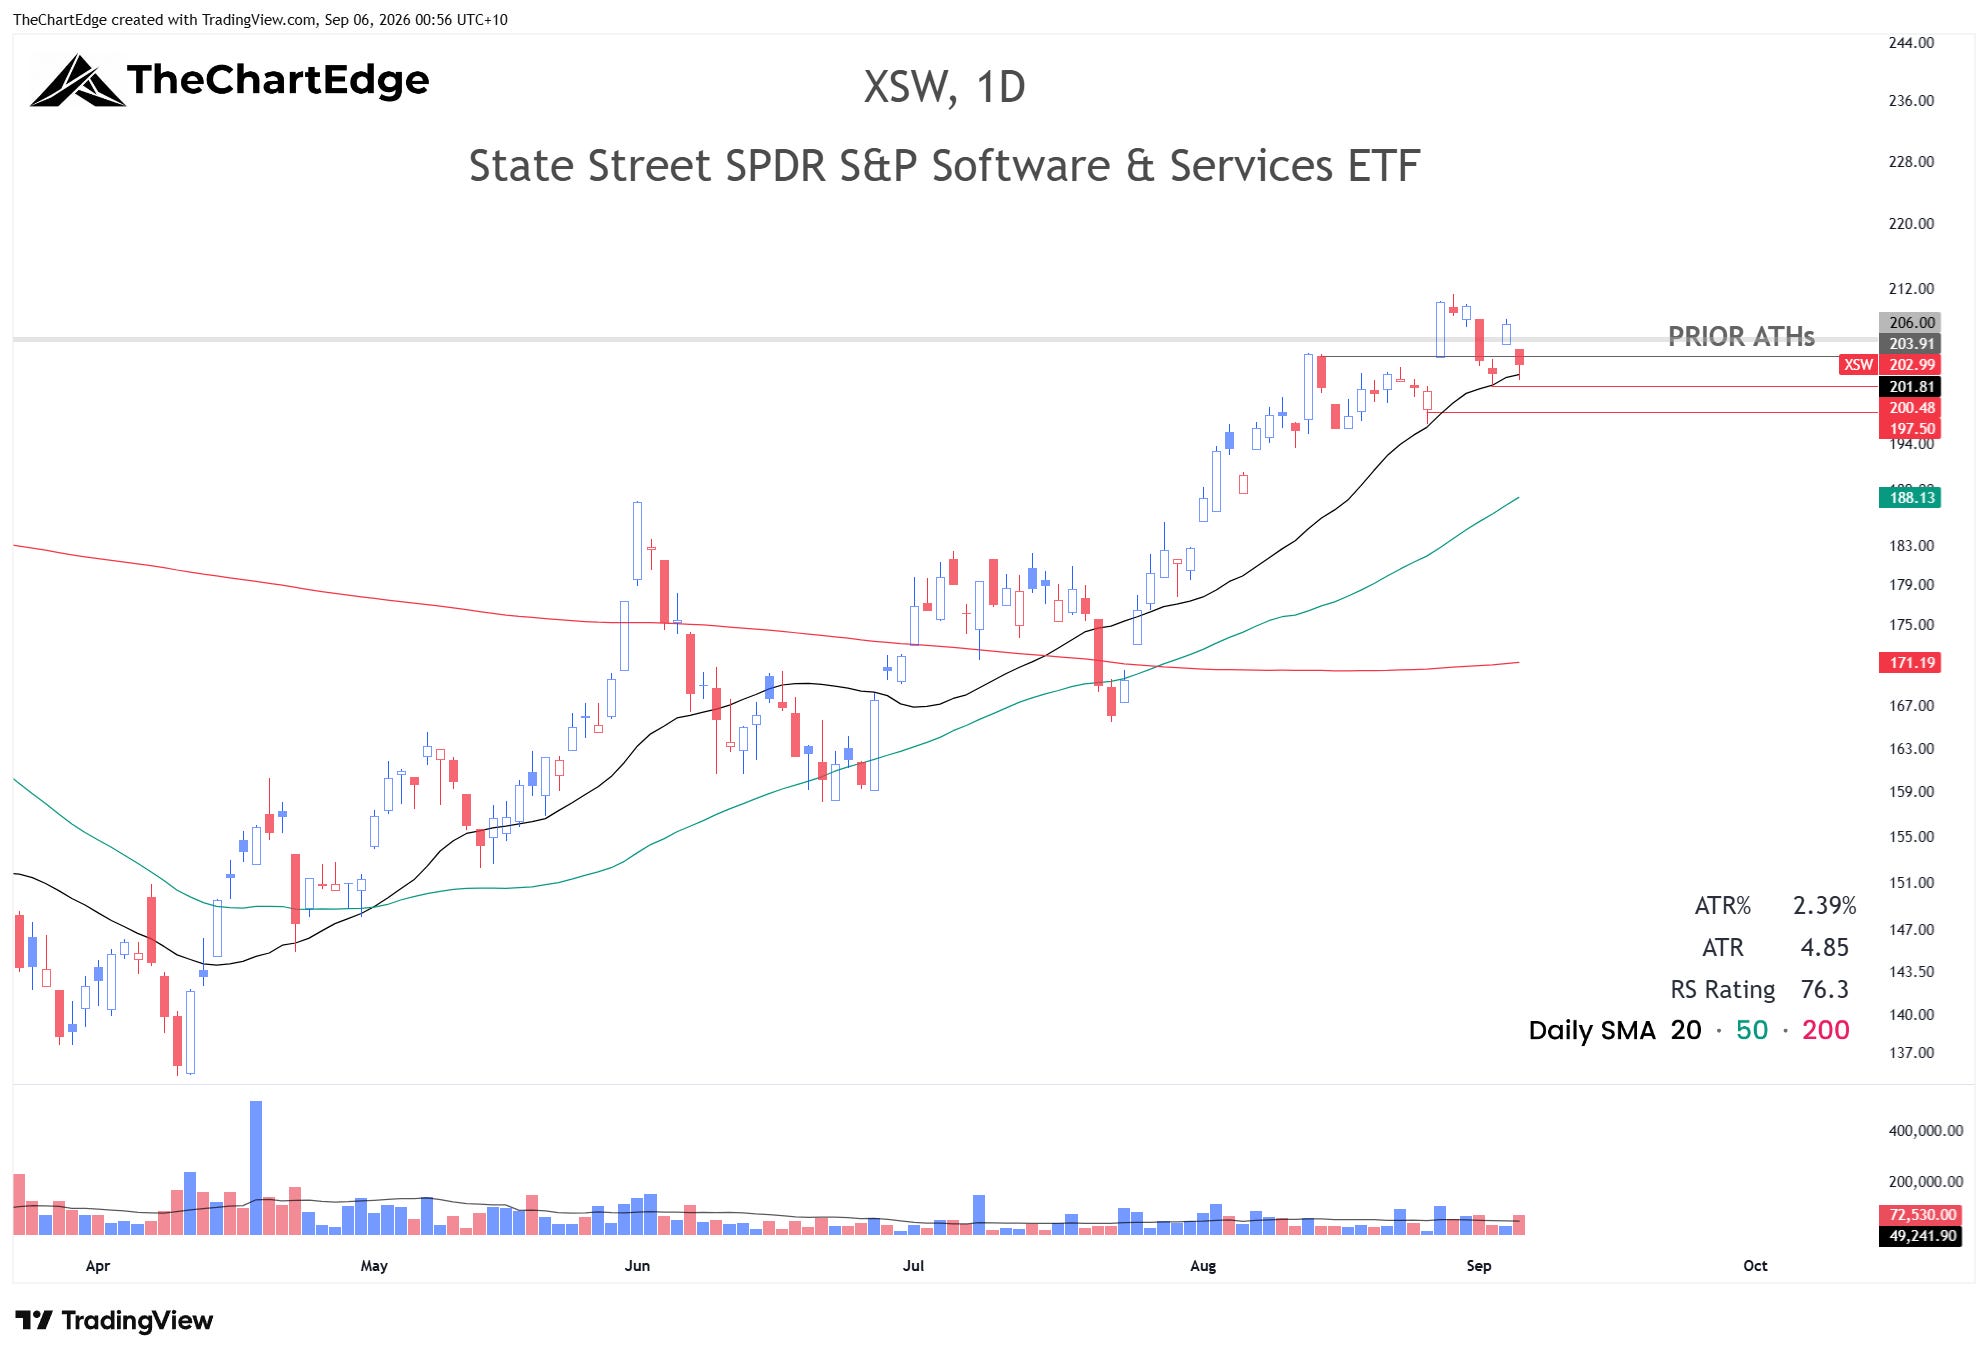
Equal-weight software (XSW) fell 3.0% to 202.99, back under the prior all-time highs at 206. It bounced perfectly off the 20-day SMA on Wednesday and followed through strongly on Thursday. But Friday’s giveback and close below the breakout level wasn’t what bulls wanted to see. The only positives about Friday were holding above Wednesday’s low and closing mid-range for the day after dipping below the 20-day SMA briefly within the first 30 minutes of trading. My position triggered at 204.50 and my original stop-loss is at 197.50. However, I am considering getting a little more aggressive and raising it closer to Wednesday’s low around 200.50 - although that’s maybe getting a little cute and increases the chance of getting shaken out. The other option would be to sell if it closes below 200.50 without hitting my original stop-loss. I’ll monitor this one closely next week, as I am open-minded to a failed breakout here, or even just requiring more time to consolidate to build energy for an eventual clean breakout. With the benefit of hindsight, the entry was probably a little on the aggressive side, but I didn’t want to miss it if it took off over a few dollars on the entry price.
Lithium (LIT) Chart
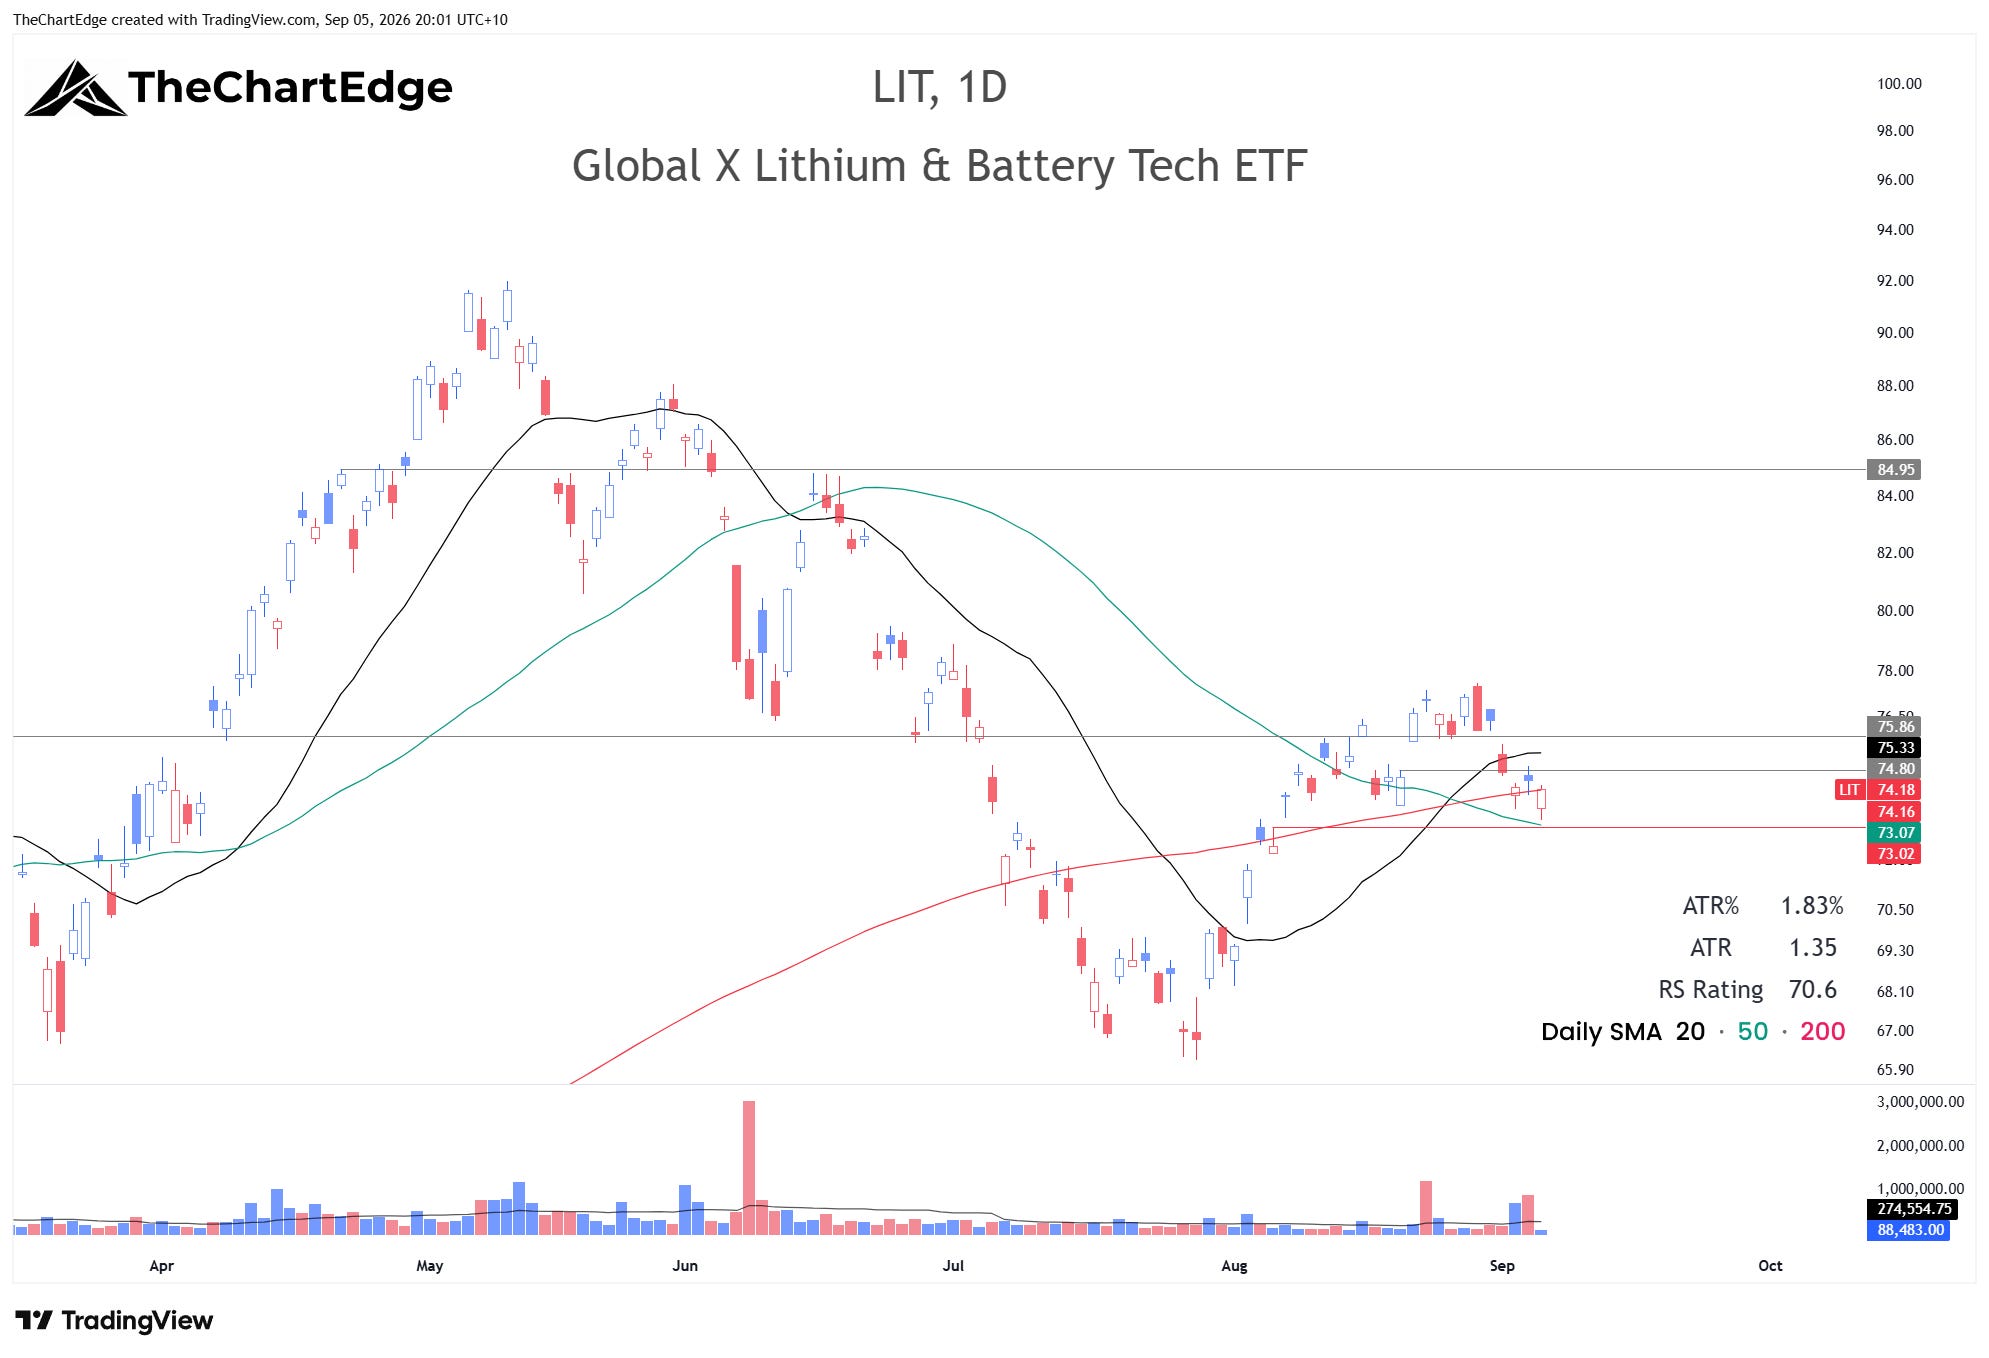
Lithium (LIT) triggered at 75, with a stop at 72.20. It closed at 74.18 and Friday’s low was 73.25, so not far off stopping me out. This is my least favourite position now due to the price action (and a reminder why I prefer to buy things when the SMAs are bullishly aligned - even on a pullback to the 50-day). I was hoping to get in on a wick down under the 20-day SMA that reclaimed quickly and would like to see it living above the moving averages and 75.85. Might kick it if I don’t get stopped out by Thursday or Friday and it still hasn’t reclaimed at least all the SMAs. I try to always enter positions expecting to get stopped out - to help with the mental side of things - but I have the least confidence in this position due to the relatively poor price action last week.
ATI Chart
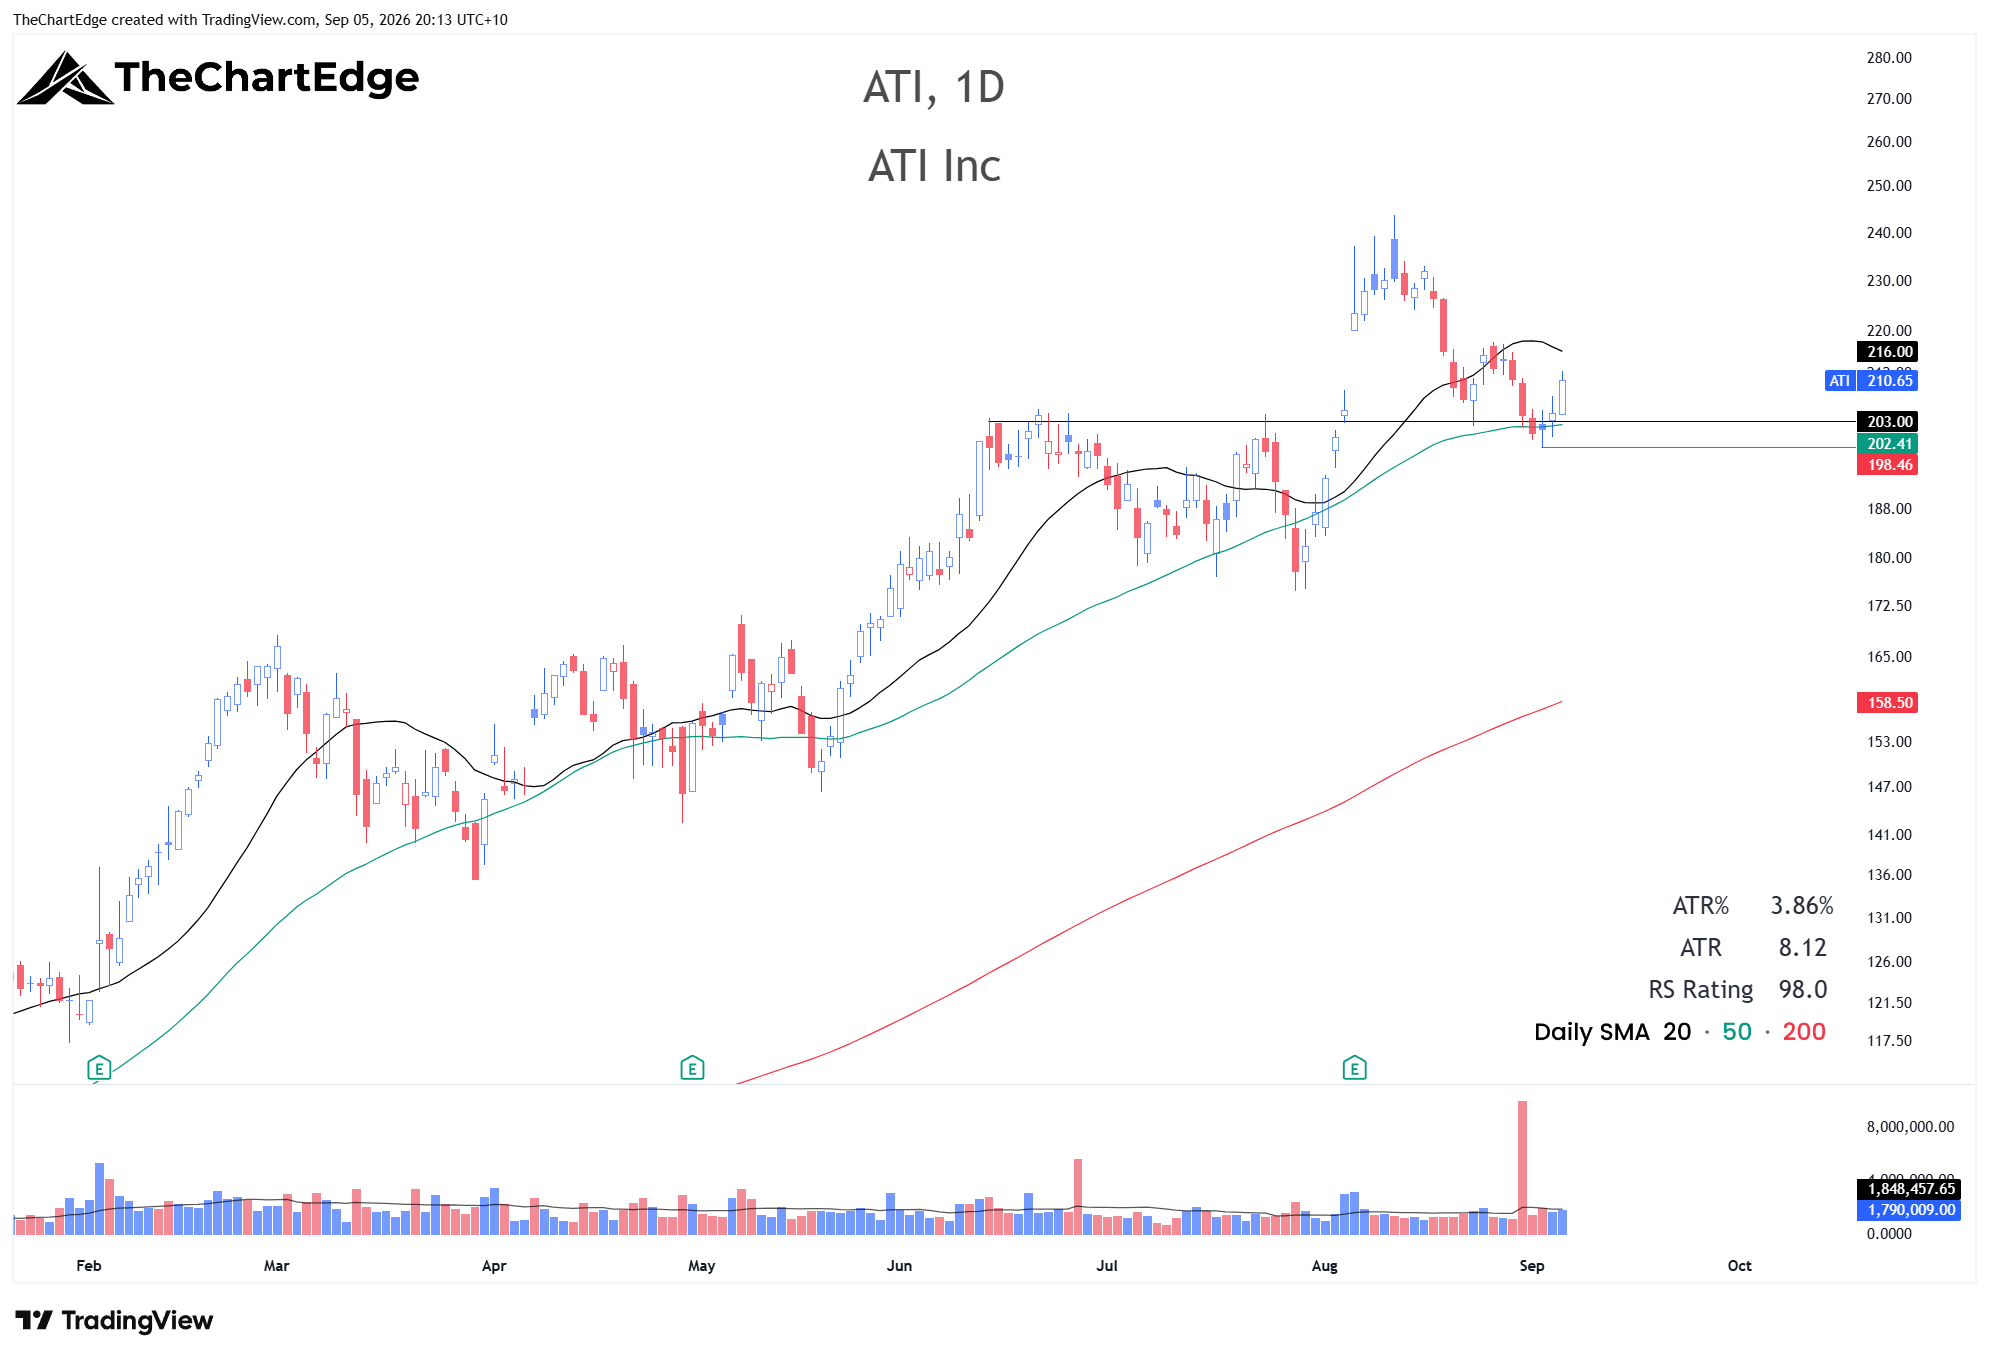
ATI triggered at 202.98 - I changed the buy limit from 205 to 203 during the week - with my original stop at 196.90. It closed at 210.65. I am considering raising my stop to just under Wednesday’s low of 198.46 - however I don’t want to choke off the trade too early raising my stop $1 or so, as it wasn’t a big position anyway. If it clears the 20-day currently around 216, I’ll definitely raise my stop then.
FANG+ (FNGS) Chart
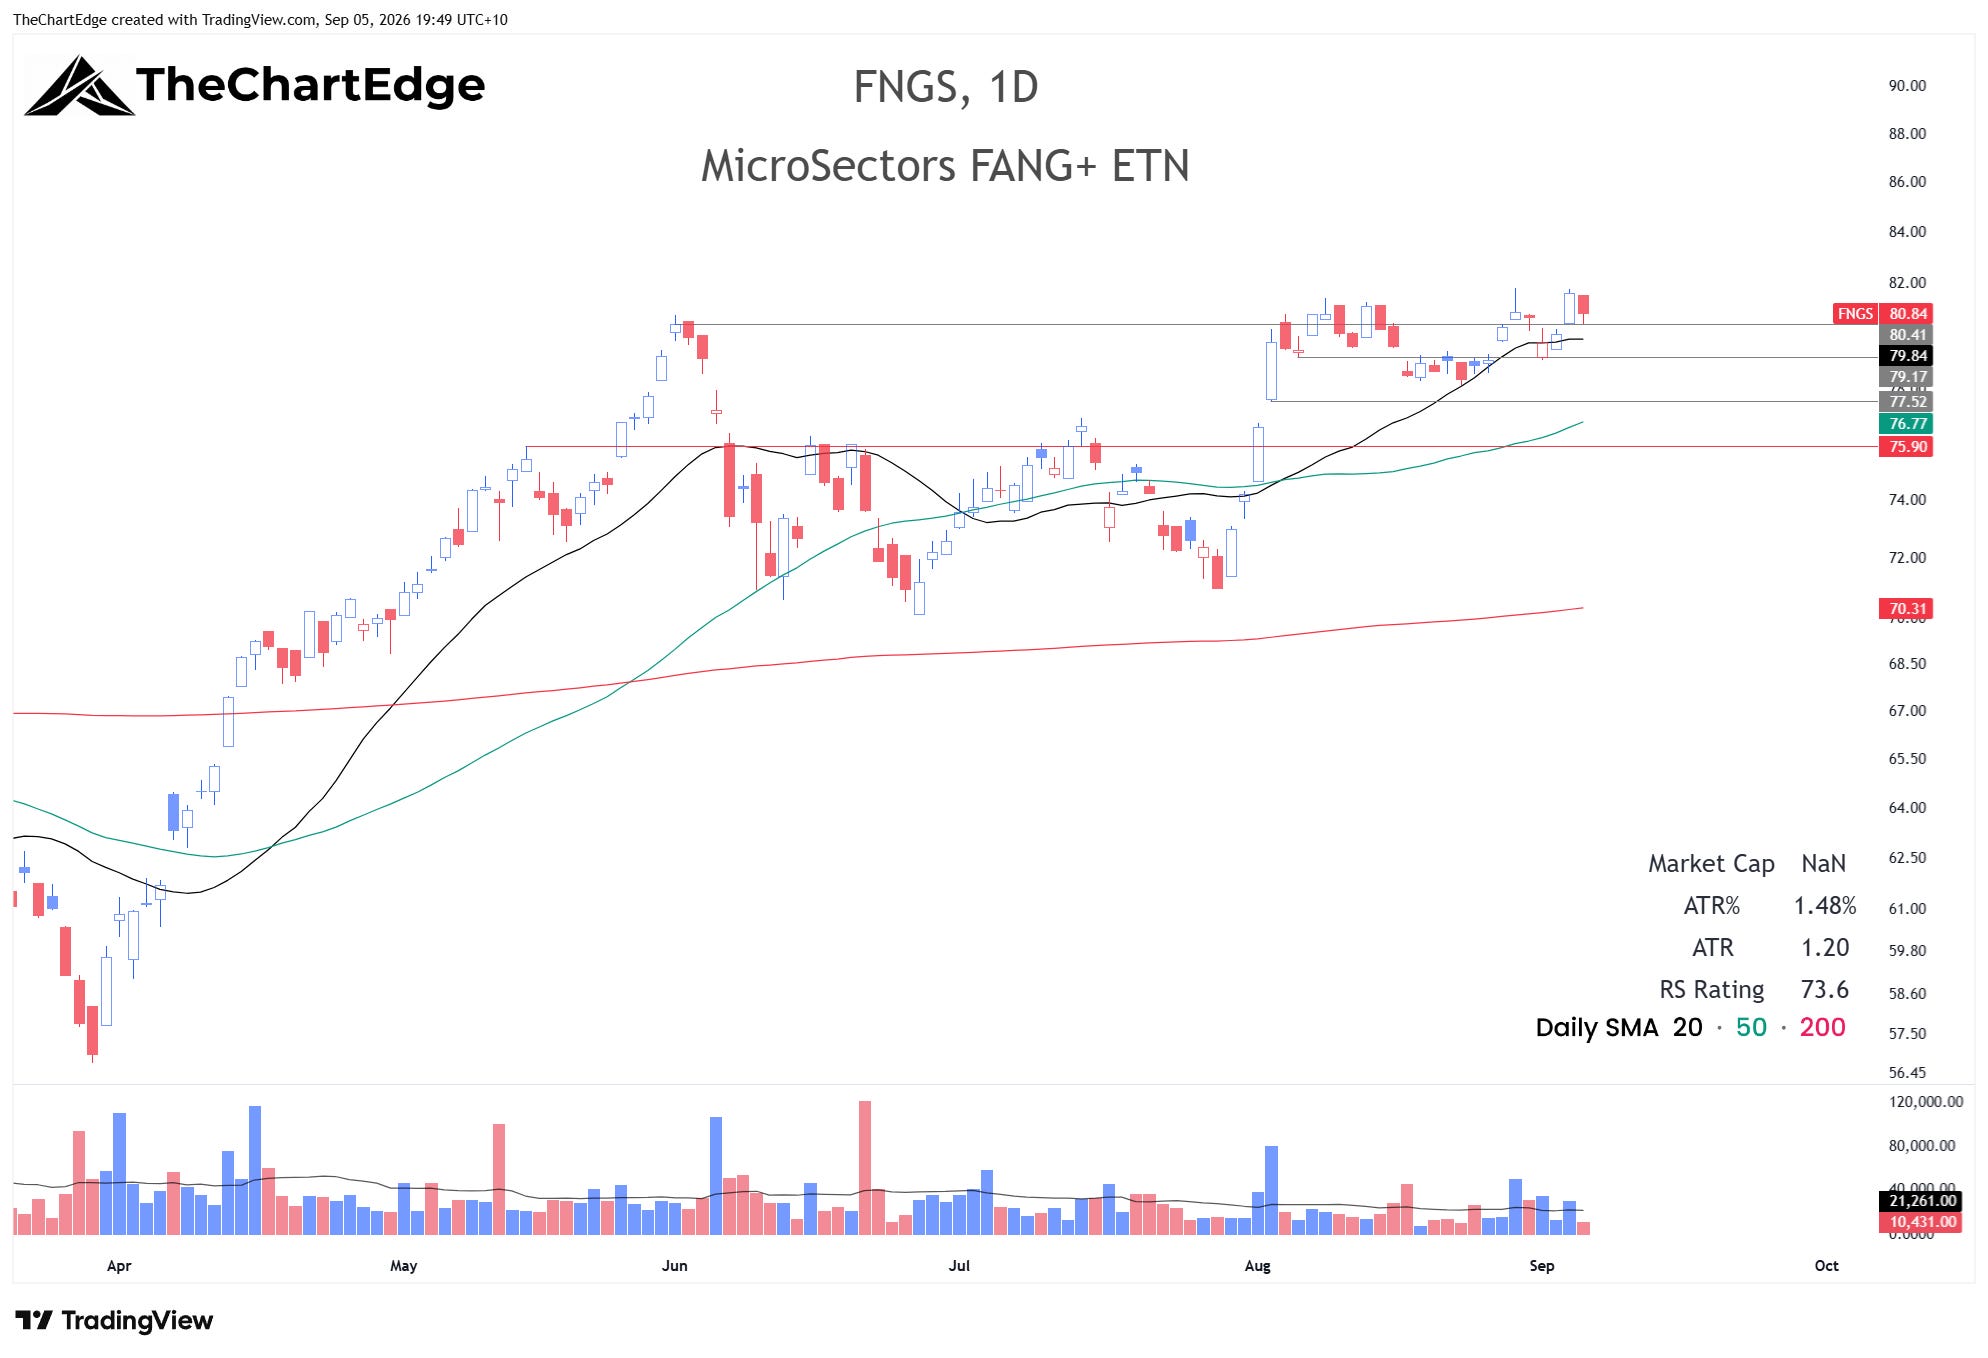
I didn’t take the FANG+ (FNGS) trade. By Tuesday I already had four positions on and a resting order for the S&P 500 in decent size, which I felt was enough. Also, I felt the price action was a little loose - will keep it on the watchlist next week though.
Cloud Computing (FCLD) Chart
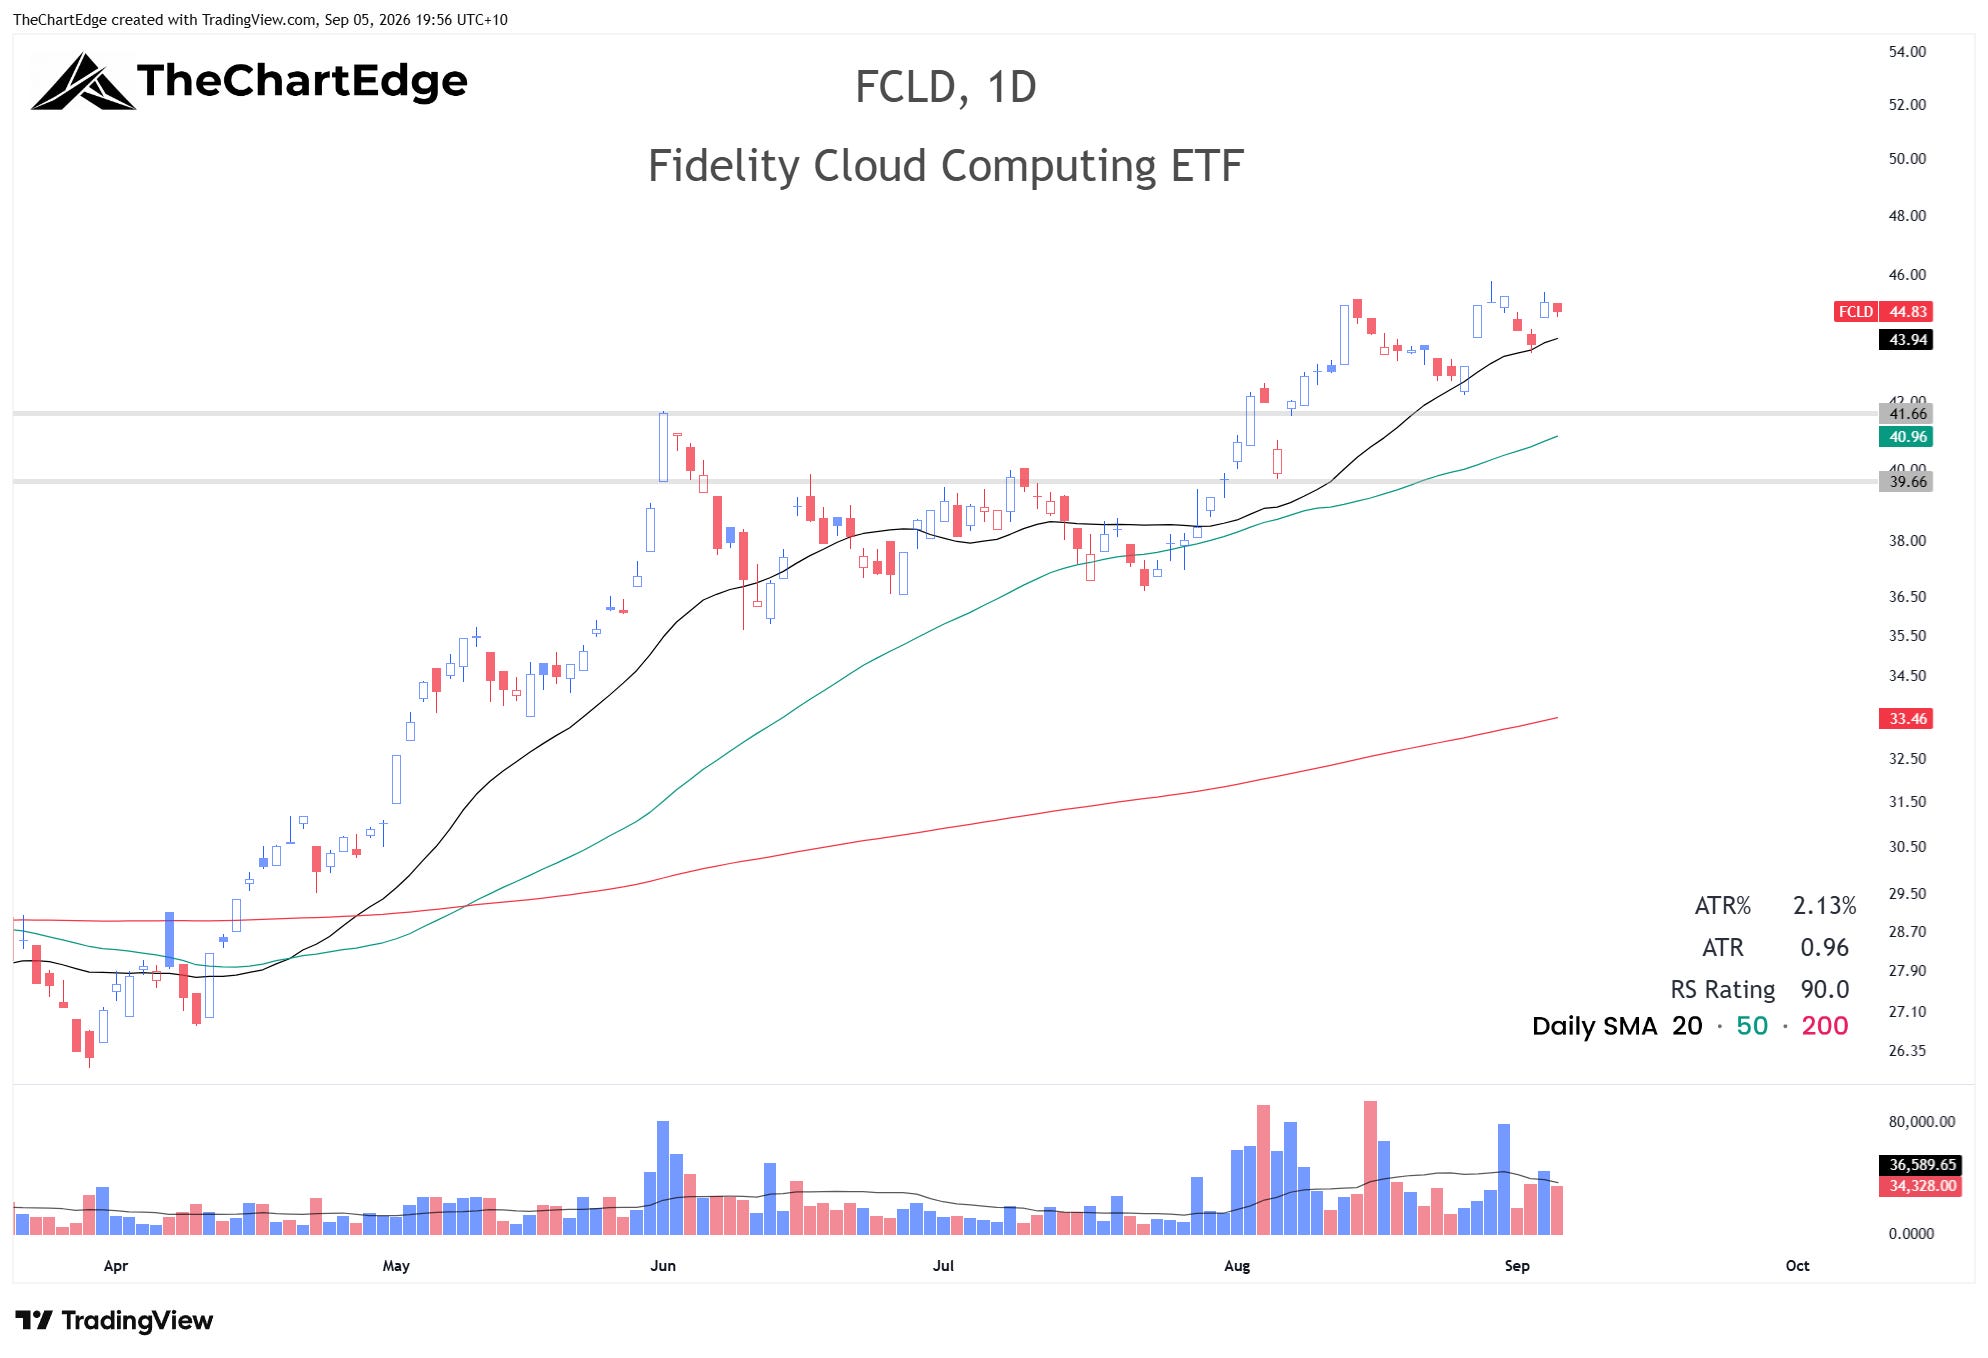
Cloud Computing (FCLD) was down just 0.6%, still in a Strong Uptrend and 2.1% off its all-time high. It’s an interesting mix - it includes the memory names like SanDisk, Western Digital and Seagate, alongside some of the larger software names that have been doing well recently, like Microsoft, Salesforce, Snowflake and Atlassian. Over the trailing 6 and 12 months it has outperformed IGV, XSW and CIBR by a wide margin. I’ve placed an order for this, looking to buy some weakness back towards the 20-day SMA closer to 44. I have a bid at 44.25 and a relatively tight stop at 42.90. If that doesn’t play out next week, I may buy strength on a close above 45.50 or so - the same stop under 43 makes sense (or maybe the 20-day SMA), but buying strength would reduce my position size due to the wider stop-loss.
Gold Miners (GDX) Chart
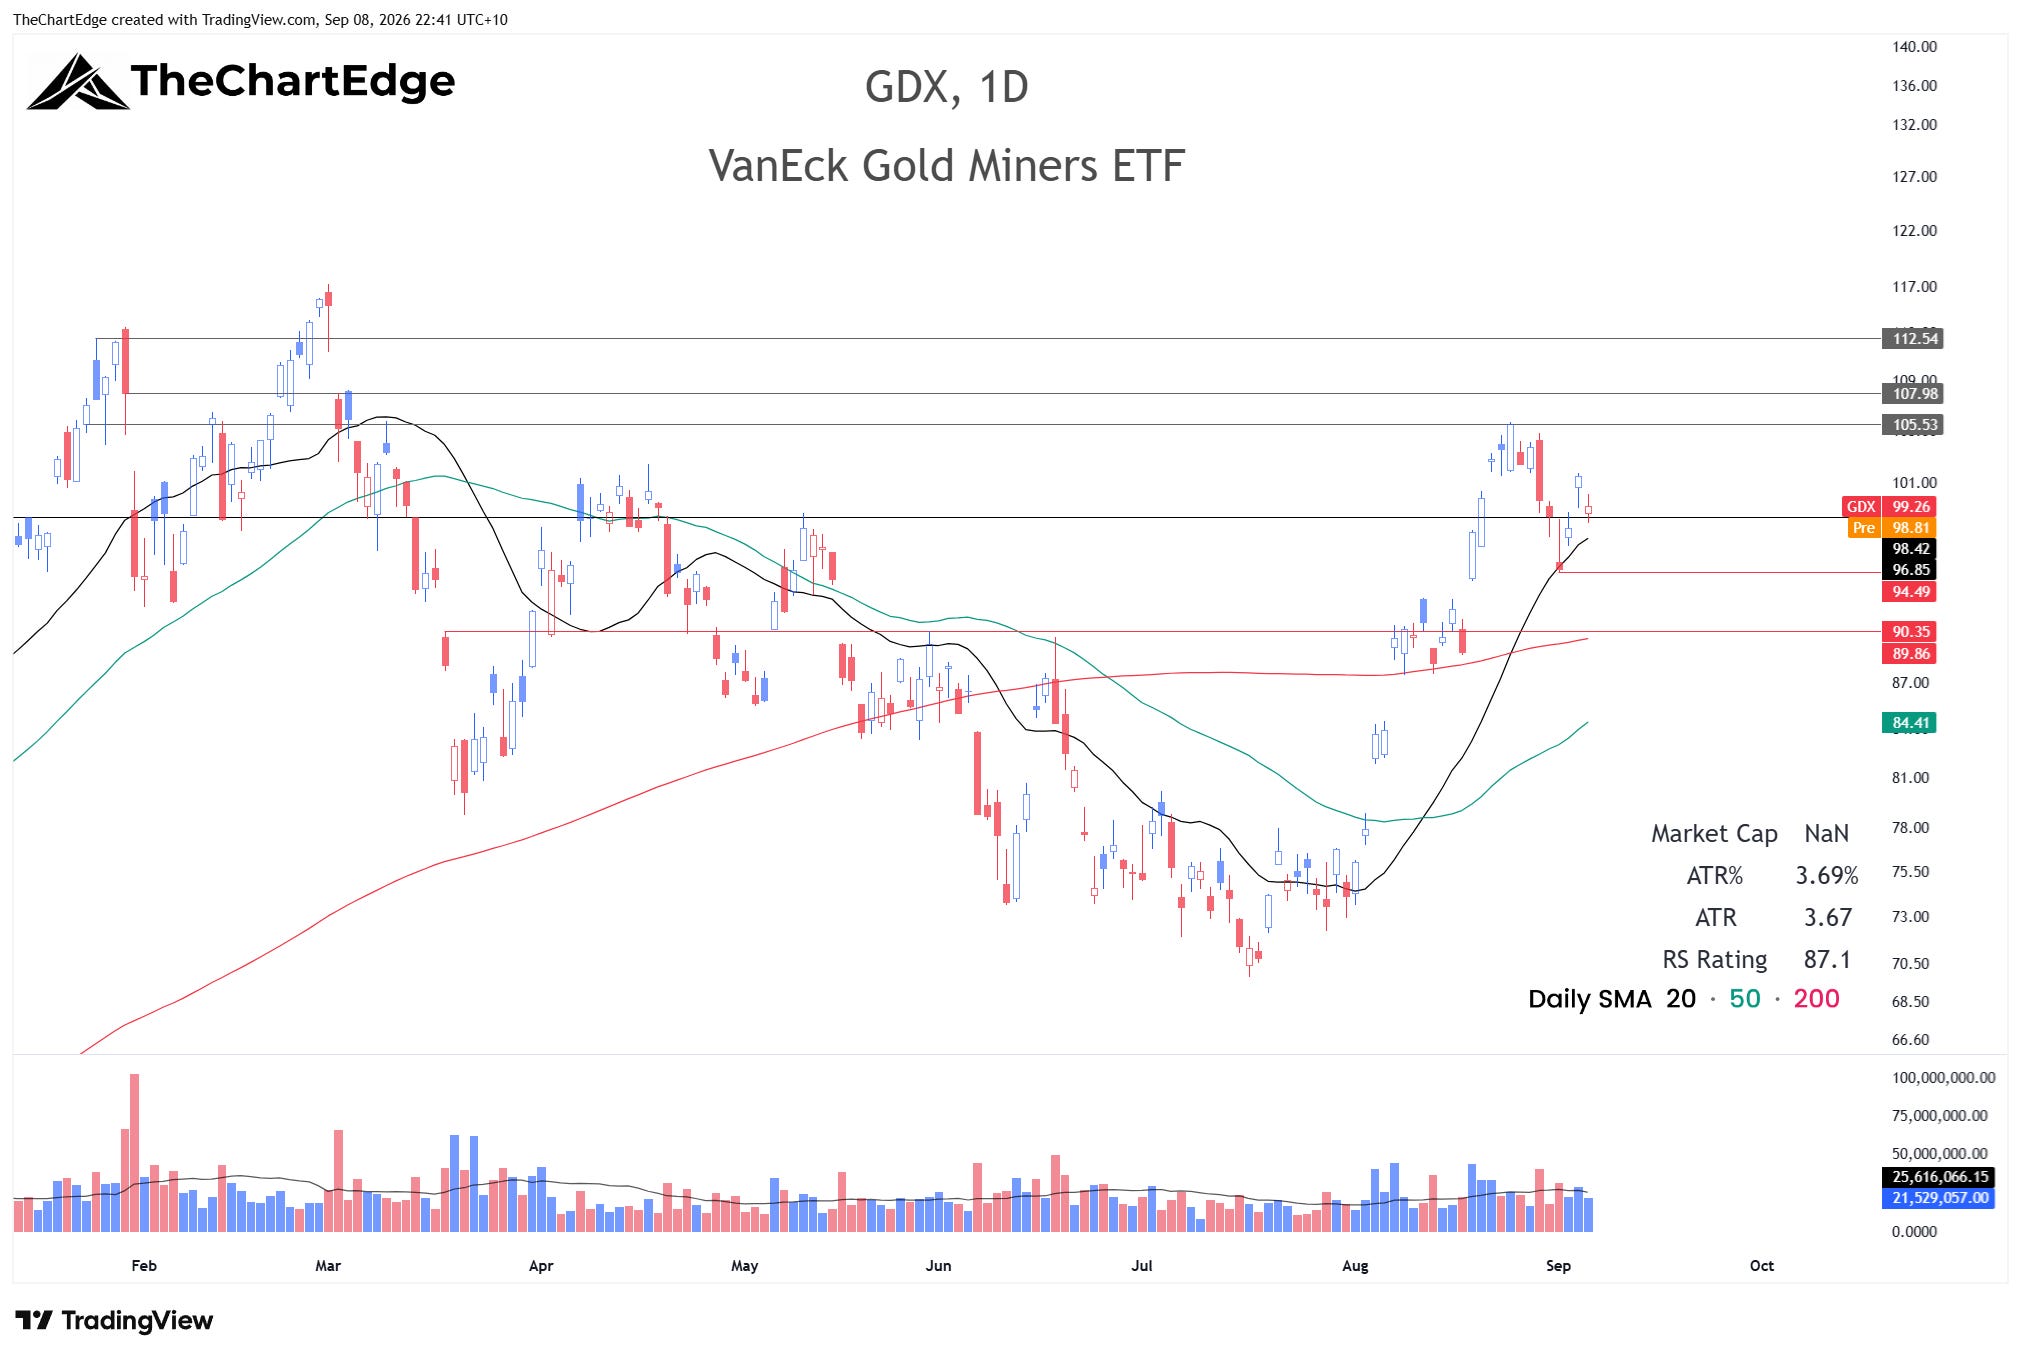
Gold (GLD) doesn’t look great - down 0.5%, back below its 200-day SMA and now in a Downtrend. However, the miners look better. Gold Miners (GDX) was down 0.4% on the week, and Tuesday’s candle looked a little ugly, but it ended up bouncing off its 20-day SMA on Wednesday and Thursday. It gave back a bit on Friday but looks like it could continue higher. I’m looking to take a position, and have an order at 97, around the 20-day SMA, with a stop-loss at 93, below Tuesday’s low. Since it tends to be pretty gappy I will keep the position size relatively small, possibly adding more if it continues higher. Targets would be around 108 and then 112.50.
The Week Ahead
SPY held 760 and bounced, QQQ is back in a Strong Uptrend, and the Market Temperature sits in the Goldilocks Zone for a fifth straight week. However, the rotation continues to be fast - more than half of the momentum leaderboard turned over again, software went from best to worst performer in a week, and energy is back on the momentum leaderboard for the third time since mid-July. I’m not bearish and don’t see any compelling reasons on the charts to be so now, but I’m being conservative in my trading given the sideways, choppy action in the indices and the relatively quick rotations happening underneath.
The 10-year yield closed at 4.79%, through the 4.74% level I flagged a few weeks ago, while the 30-year closed at 5.25%, still just under the 5.27% level I was watching. The moves remain relatively small and contained, so I’m not overly concerned yet, but keeping an eye on both.
In terms of positioning, I’ll be looking to tighten my risk on ATI, XPH and XSW if they move higher next week. Same with LIT - but if it just chops sideways without stopping me out or clearing 75.85 or so, I might cut it loose - depending on how my other positions and watchlist names are going. Lastly, I have cancelled my S&P 500 CFD bid and am using that risk trying to enter GDX and FCLD as outlined above. Ethereum also stays high on my watchlist for a new entry. If I can’t day trade my way into it, I’ll place the buy stop order.
Stay open-minded and manage risk carefully.
Cheers,
Marcus Grant, CFTe
Disclaimer: The content provided in this newsletter is for informational and educational purposes only and should not be considered as financial, investment, or legal advice. It is general information only and does not take into account your objectives, financial situation or needs. The information shared is based on our research and analysis, but we are not a licensed financial advisor, nor can we guarantee its accuracy, completeness, or timeliness. Market conditions and financial instruments can change rapidly, and any opinions expressed may not be suitable for all investors. Any opinions expressed and/or securities mentioned do not constitute a recommendation to buy, sell, or hold that or any other security. You should conduct your own due diligence and consult with a licensed financial advisor or other professional before making any investment decisions. Past performance is not indicative of future results, and all investments carry the risk of loss. The authors and publishers of this newsletter are not responsible for any financial decisions made based on the content provided herein. By reading and/or subscribing to this newsletter, you acknowledge and agree that you are using the information at your own risk.