


Everything below is as of Friday October 9 close.
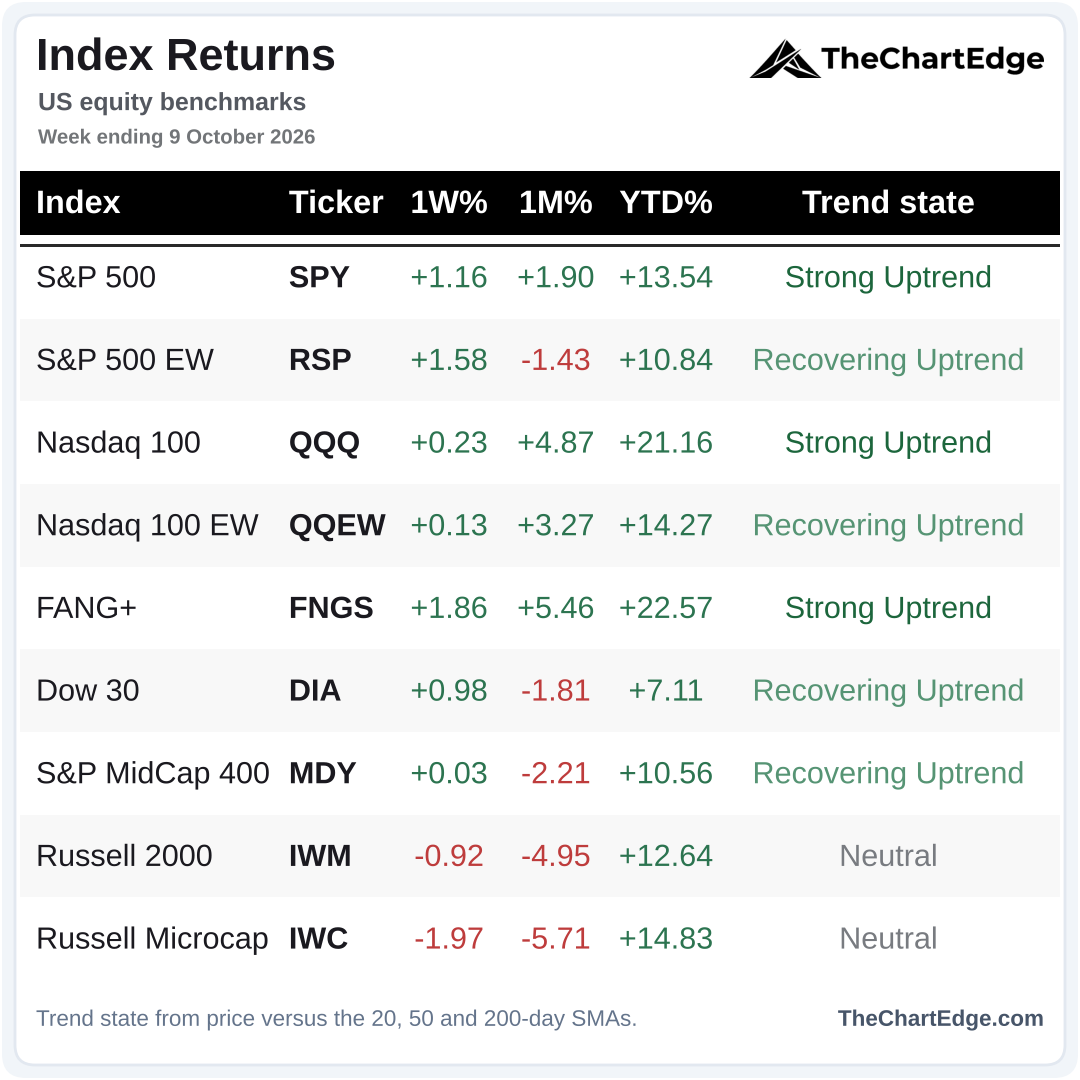
Of the major indices I track, 7 of the 9 finished the week higher - only small caps (IWM) and micro-caps (IWC) were down. The equal-weight S&P 500 (RSP) outperformed SPY for a change, while QQQ lagged.
S&P 500 (SPY) Chart
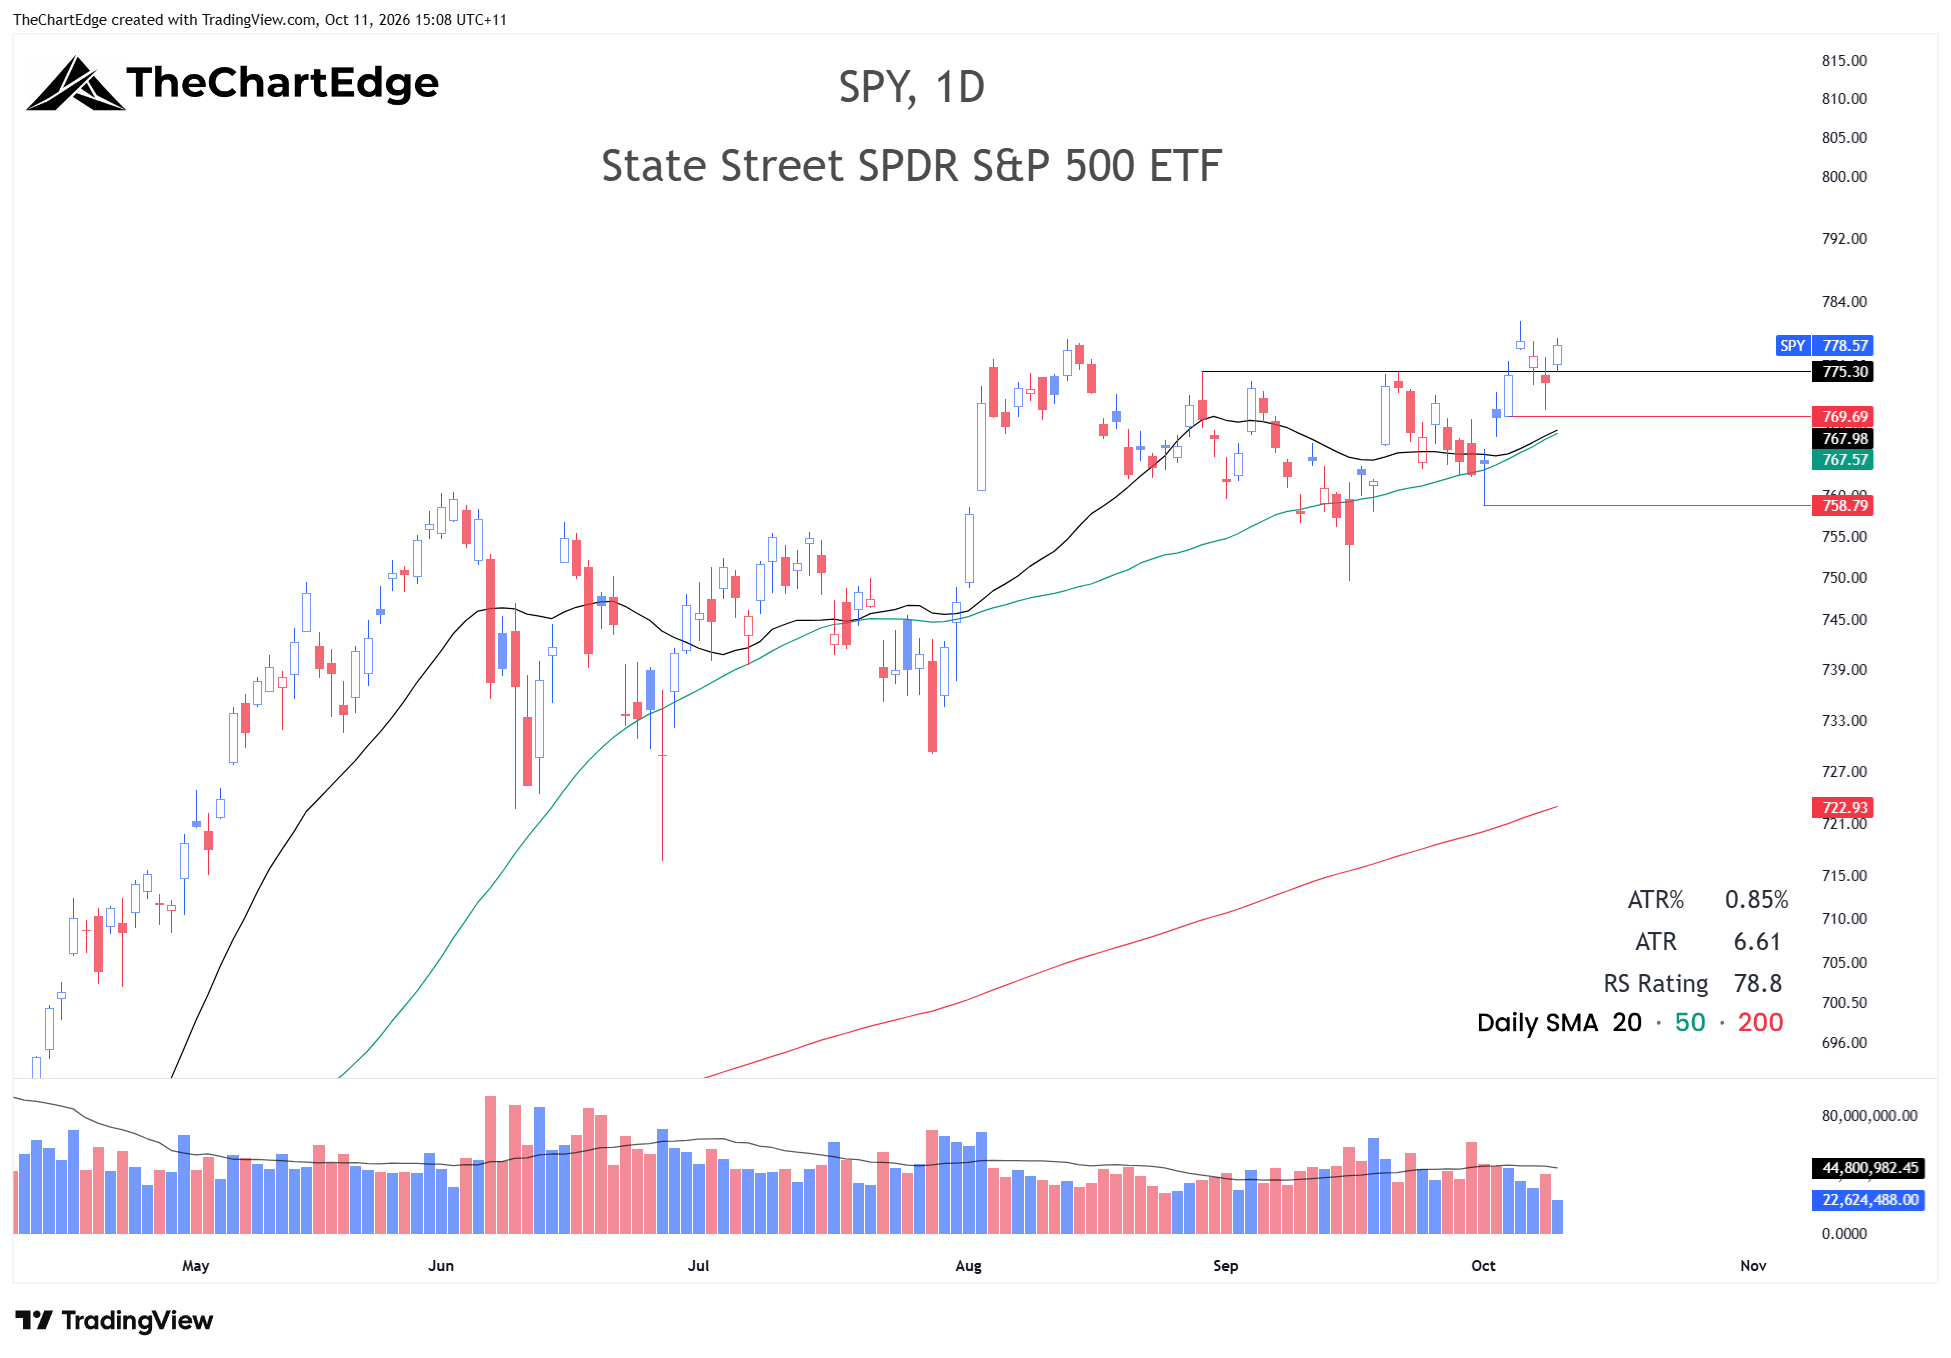
SPY closed at 778.57, an all-time weekly closing high, and is in a Strong Uptrend. It finally broke above 775, the level I’ve been watching on the upside for the past few weeks. If we get some follow-through this coming week and hold above 775 on any pullbacks, that would be very bullish. Below that, 770 is the level I’m watching, with the 20 and 50-day SMAs currently around 768 and rising.
Nasdaq 100 (QQQ) Chart
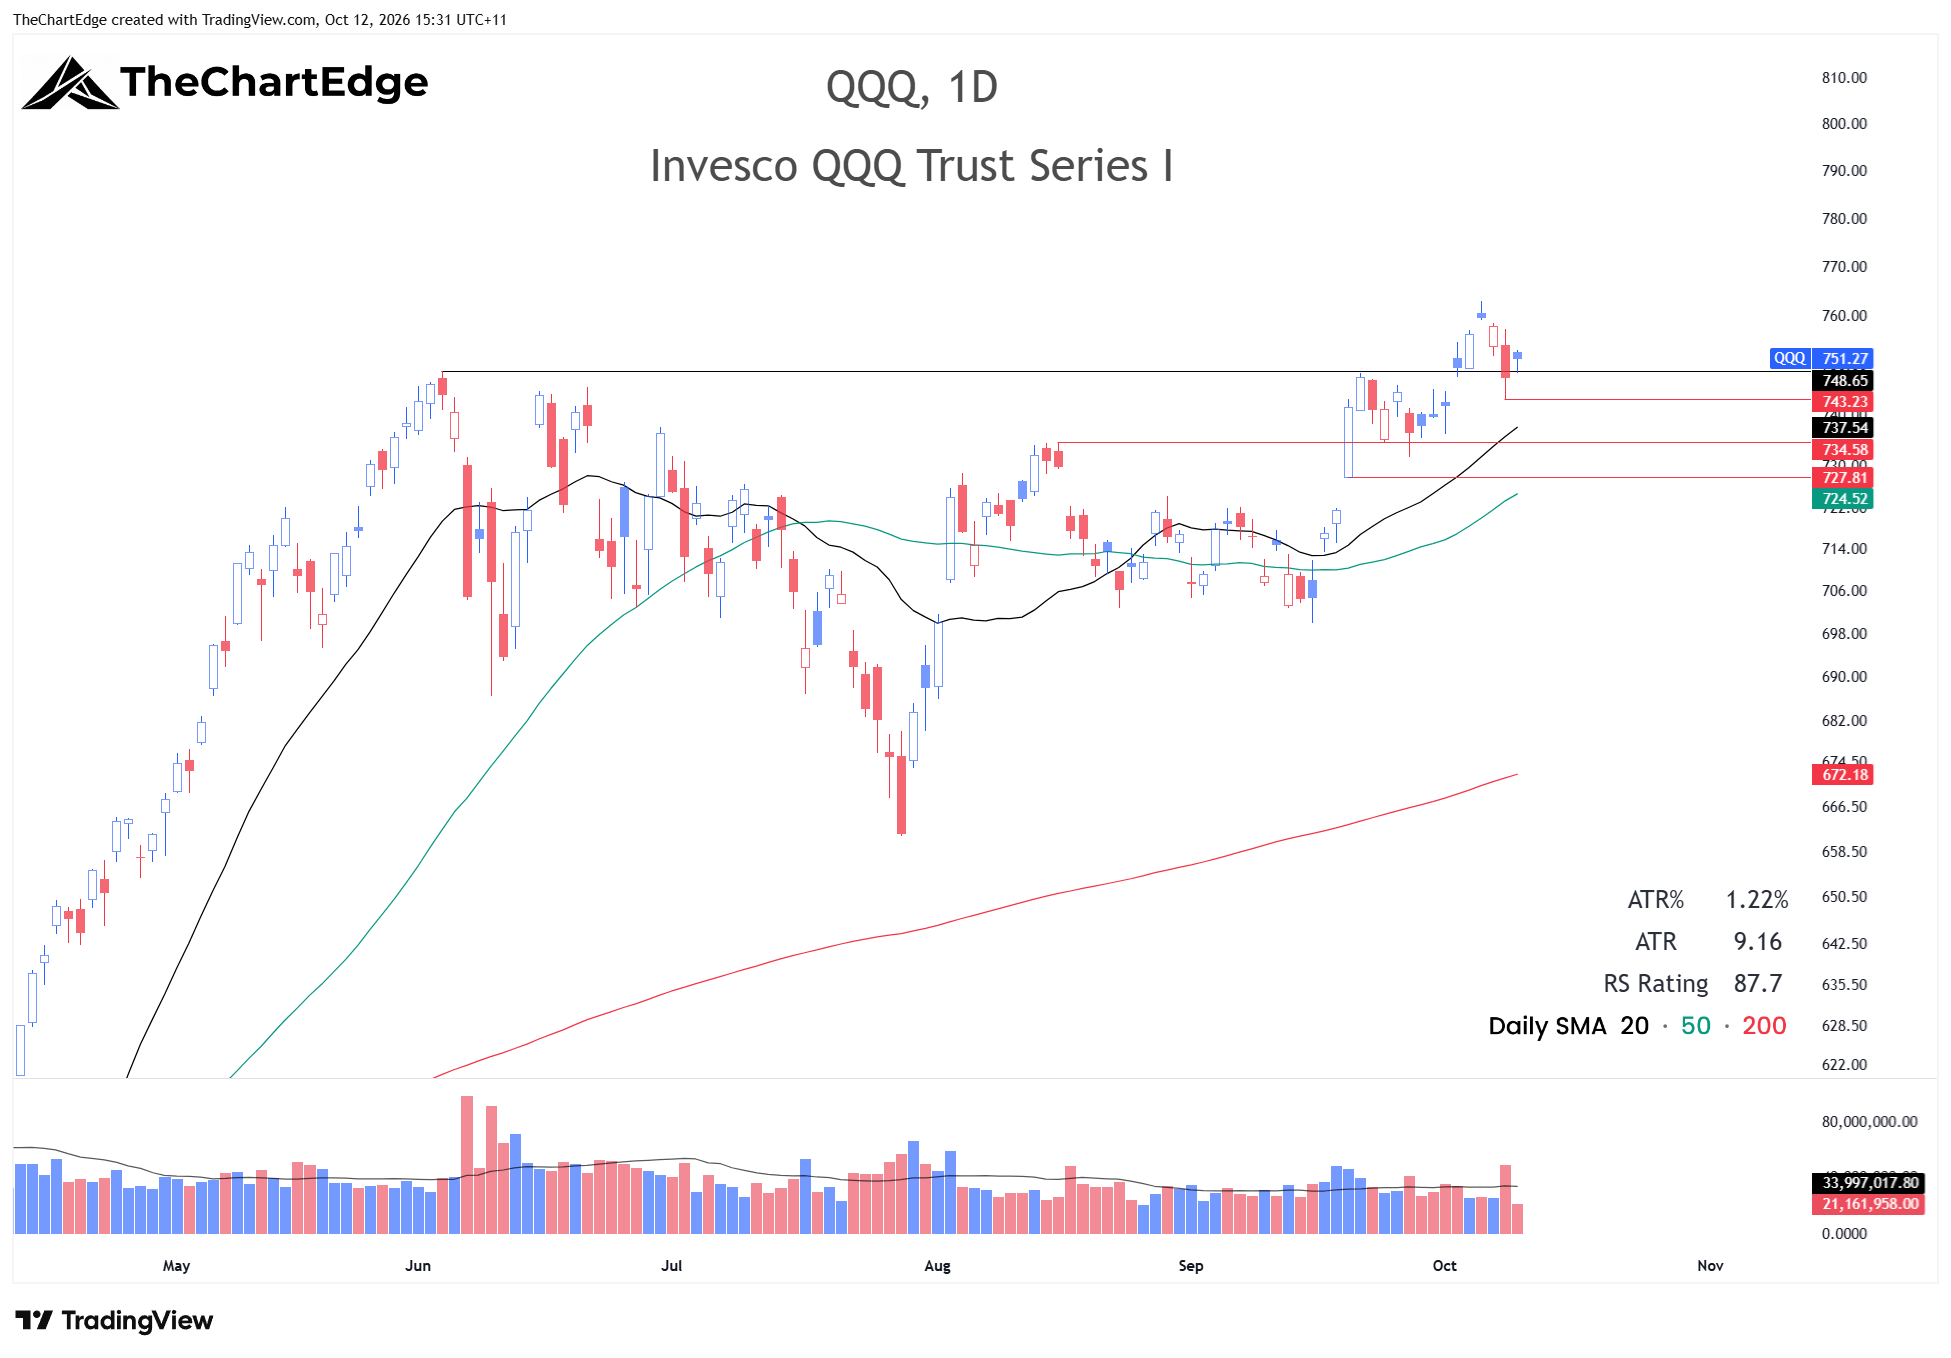
QQQ closed at 751.27, another all-time weekly closing high. It pushed out to new highs early in the week, then pulled back, retesting the breakout level around 748.65, dipping below it on Thursday before closing back above it on Friday. If we stay above Thursday’s low just above 743 and a rising 20-day SMA which currently sits around 737.5, that would be bullish.
Market Temperature
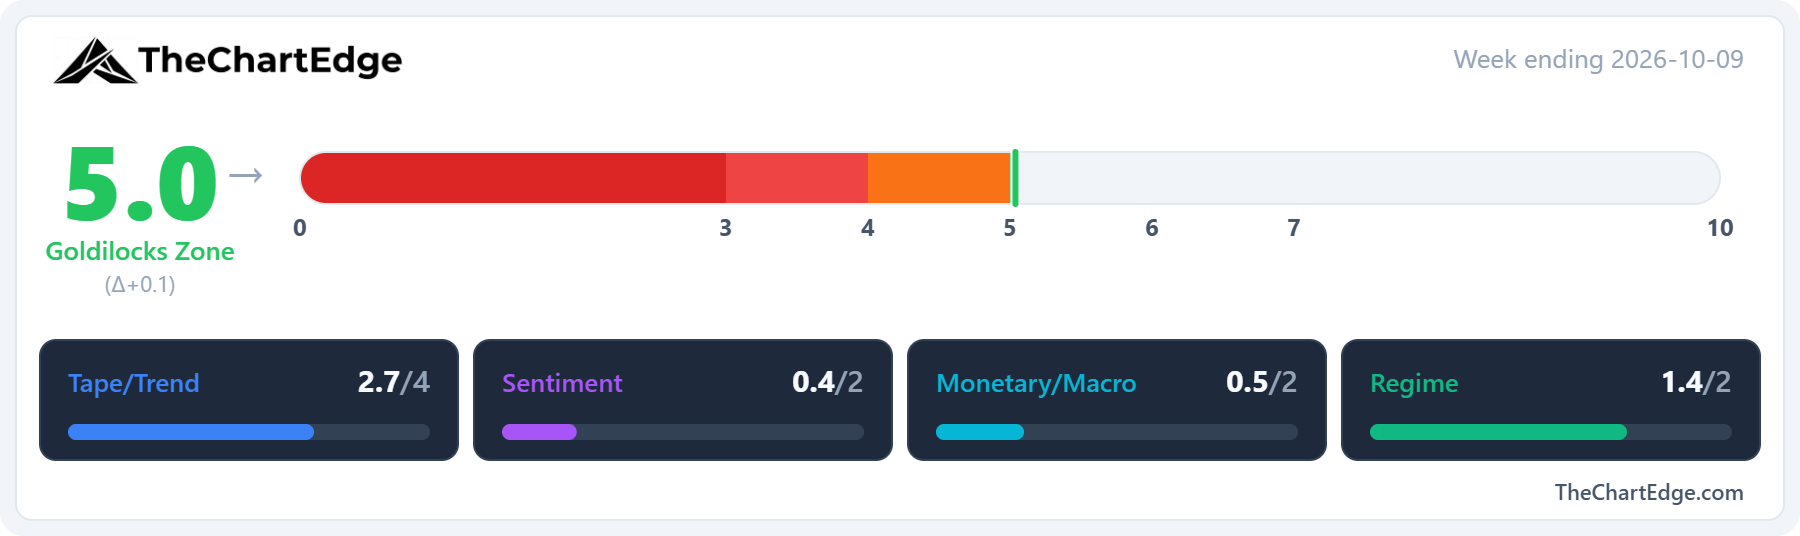
The Market Temperature came in at 5.0, up from 4.9, and is back in the Goldilocks Zone after one week in Cautious.
The Tape/Trend and Monetary/Macro pillars did the lifting. About three-quarters of the Tape/Trend gain came from breadth. The share of US stocks above their 50-day moving average rose to 28.9% from 27.9% - the first weekly rise after 7 straight declines. The 200-day measure was basically flat at 43.3% from 43.2%. Both scored better as the two-week look-back compares against lower readings. SPY’s weekly RSI also rose to 65.1 from 62.2.
The Monetary/Macro gain was all the MOVE index, which eased to 98.5 from 107.3 - although it’s still well above the 82.2 of four weeks ago. The US dollar is still the biggest drag in the model, with UUP up 3.4% against its four-week comparison. The 10 and 30-year yields fell on the week, closing at 5.24% and 5.60%, respectively.
The Sentiment pillar slipped as the VIX fell to 14.8 from 15.3, which the model reads as a contrarian negative.
The Regime pillar score was unchanged to one decimal place, despite the XLY/XLP ratio being down 1.0% on the week, as staples outperformed consumer discretionary.
GICS Sector Relative Strength
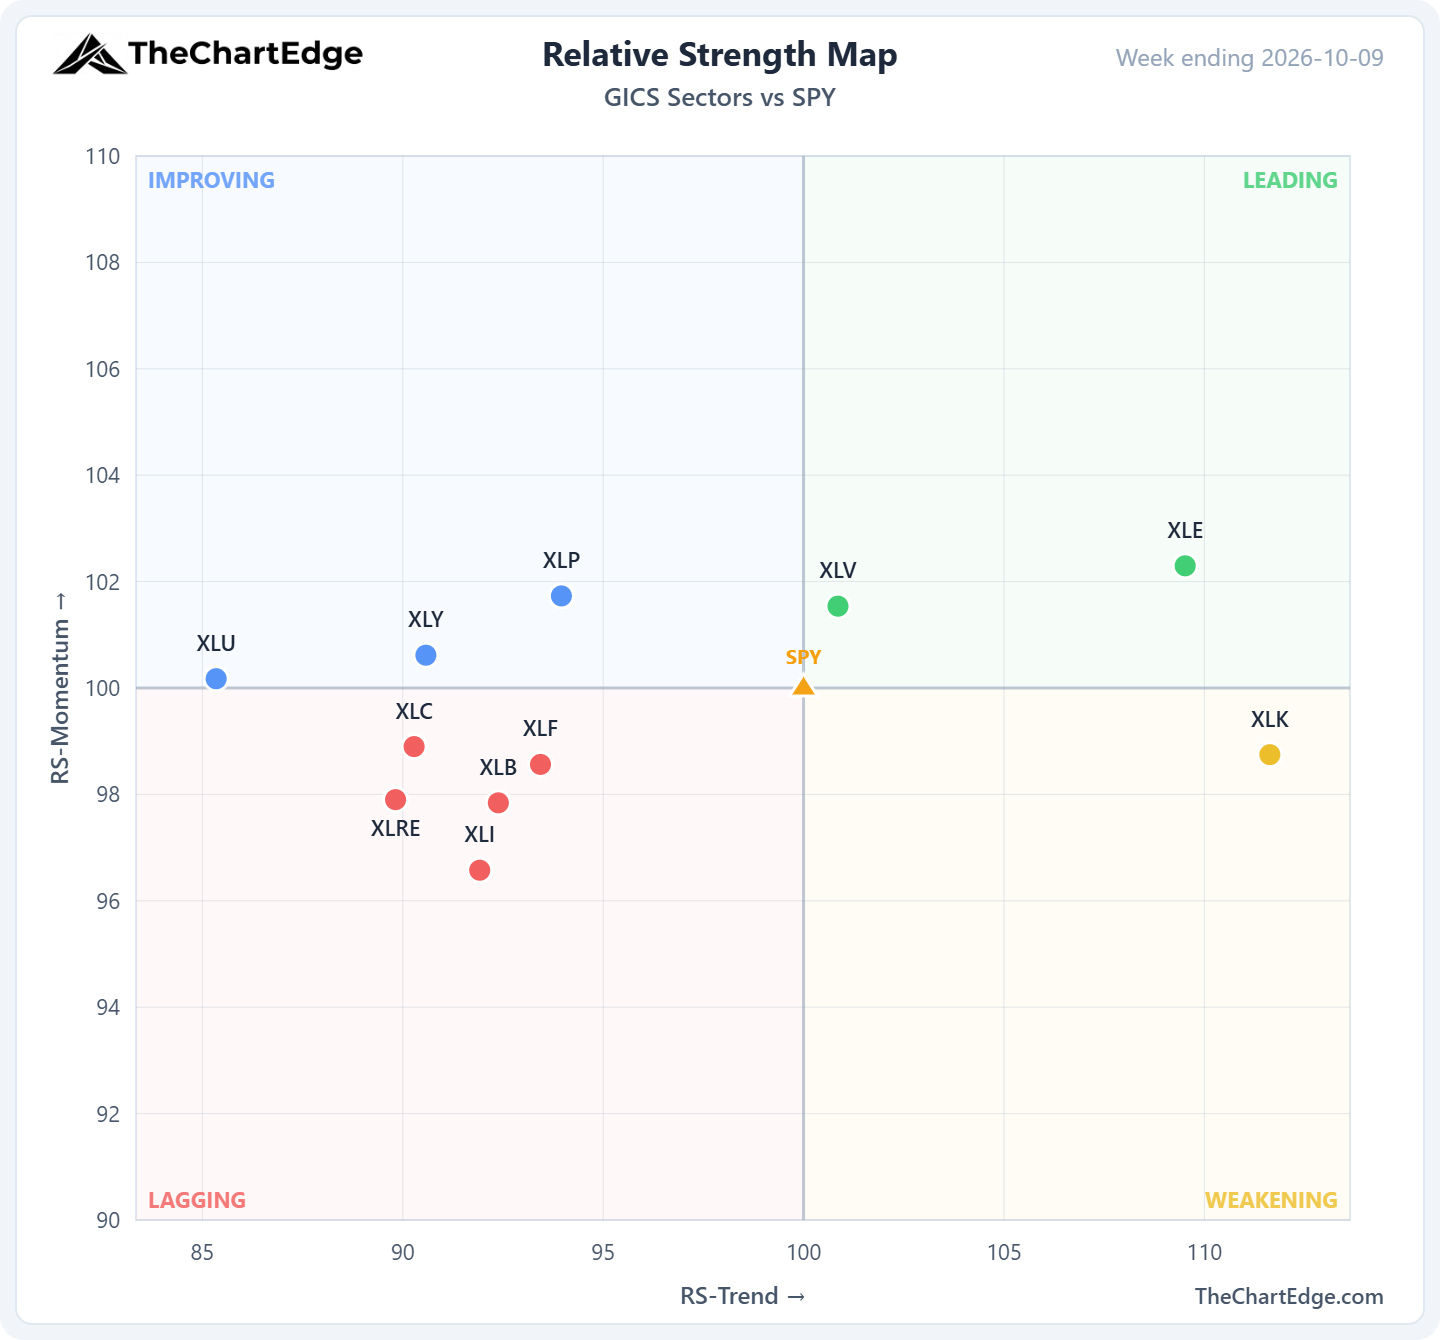
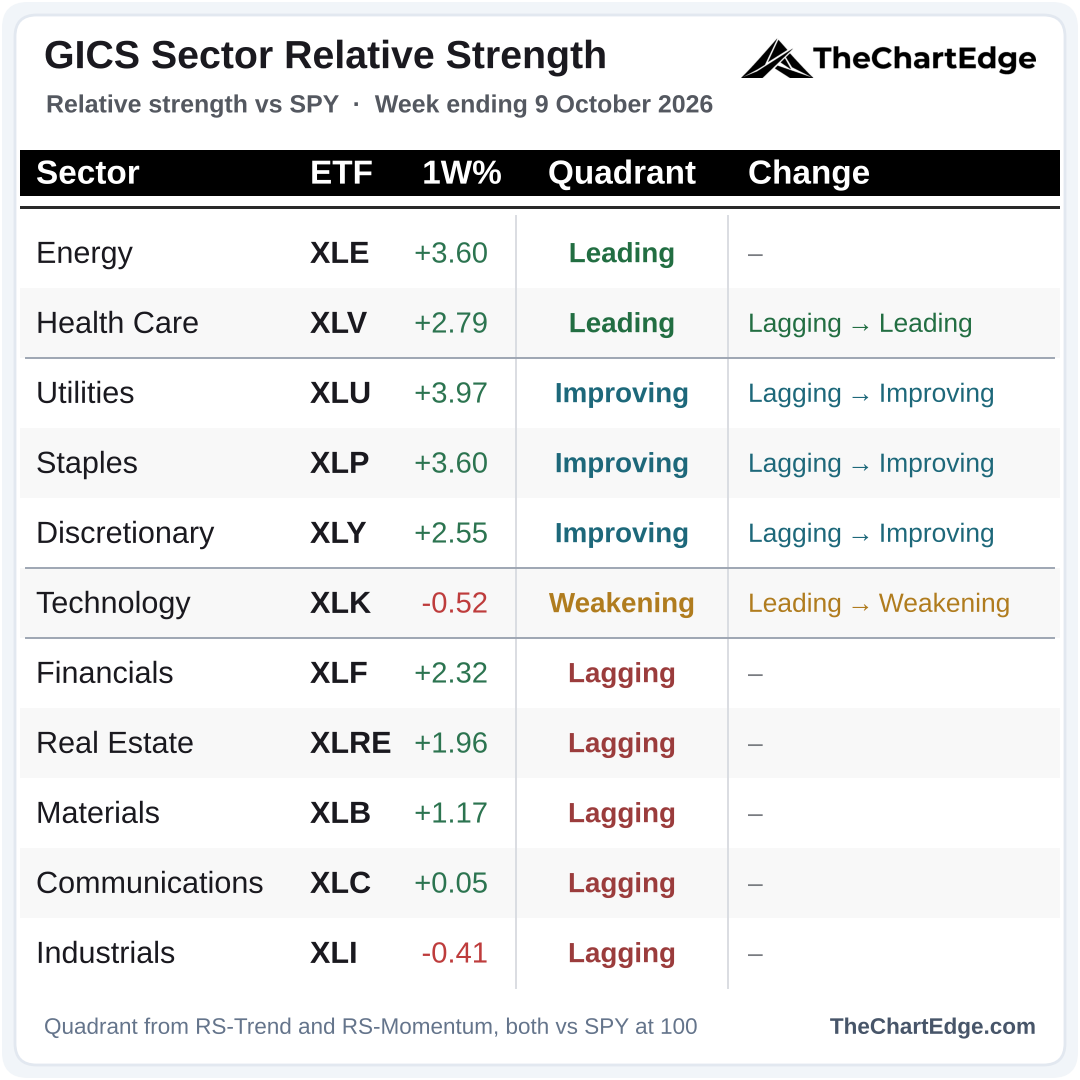
Utilities, staples and energy led the sectors, while technology and industrials were the only two to finish lower. Health care went straight from Lagging to Leading, crossing both RS axes in a single week, joining energy as the only two sectors in Leading. Technology slipped into Weakening, and utilities, staples and discretionary all moved up into Improving.
It’s slightly unusual to see utilities, staples, energy and health care as the leaders for the week, whilst the S&P 500 and Nasdaq 100 both finished at all-time weekly closing highs.
Momentum Leaderboard
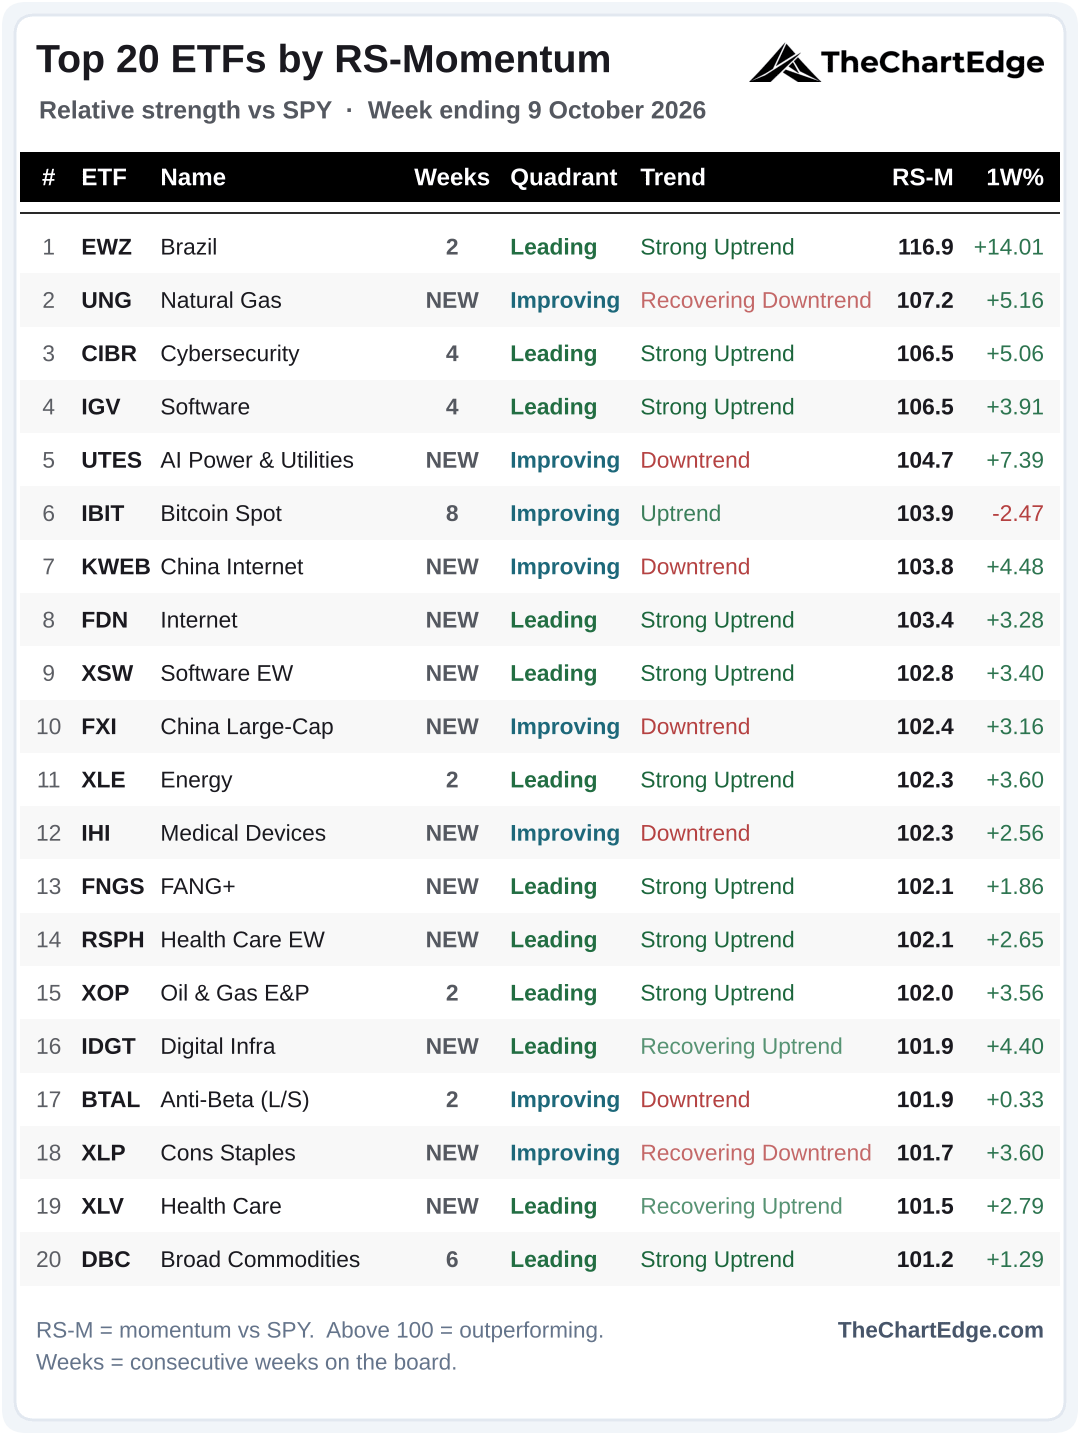
12 of the 20 are new again. Semis and AI hardware are gone - SMH, generative AI (CHAT), AI innovation (BAI), technology (XLK) and equal-weight technology (RSPT) - along with Ethereum (ETHA), crude (USO), genomics (ARKG), ARK Innovation (ARKK), the US dollar (UUP), growth (IWF) and Japan (EWJ).
Internet (FDN), equal-weight software (XSW) and FANG+ (FNGS) are back on the board, while software (IGV) and cybersecurity (CIBR) stay on for a 4th week. Health care is back too - XLV, equal-weight health care (RSPH) and medical devices (IHI) - along with staples (XLP), natural gas (UNG), China (KWEB and FXI), AI power & utilities (UTES) and digital infrastructure (IDGT).
Brazil (EWZ) takes number 1, and Ethereum drops off the board after 7 straight weeks at the top. Bitcoin (IBIT) now holds the longest streak on its own at 8.
7 of the 20 are in downtrend states - so a lot of the board this weekend is made up of bounces in downtrends rather than new leadership. 10 are in Strong Uptrends, from 14 last weekend.
Trend States Across the Universe
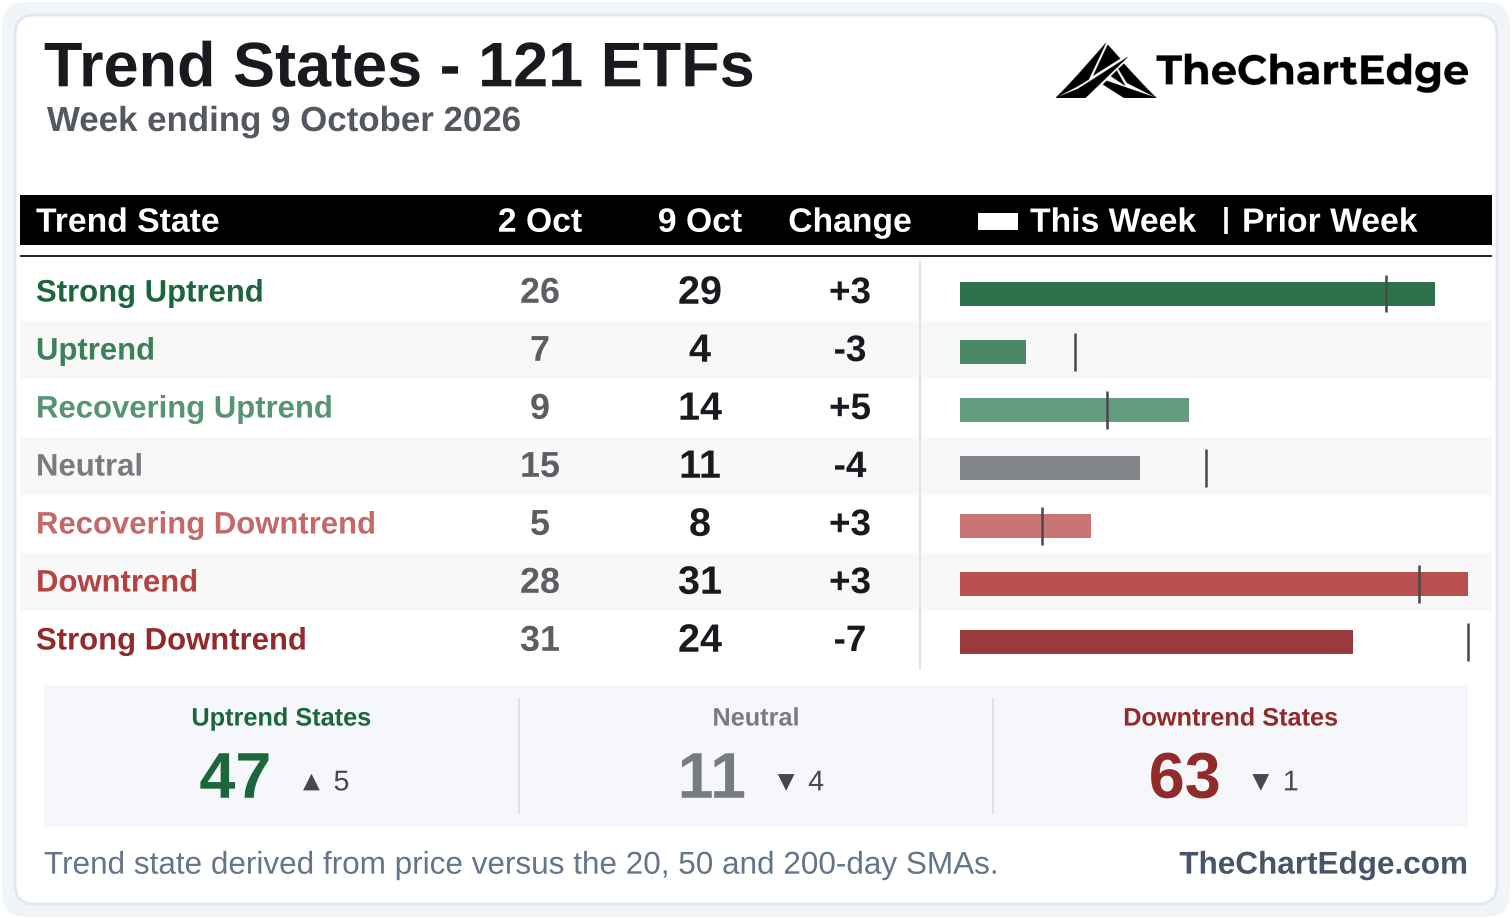
Uptrend states rose and Strong Downtrends fell, but downtrend states still outnumber uptrend states.
Energy (XLE, XOP and RSPG), broad commodities (DBC), Brazil (EWZ), equal-weight software (XSW), equal-weight health care (RSPH) and large-cap biotech (IBB) all moved up into Strong Uptrends, while Bitcoin (IBIT) and Ethereum (ETHA) slipped back to Uptrend.
Industry Breadth - Leading Stocks
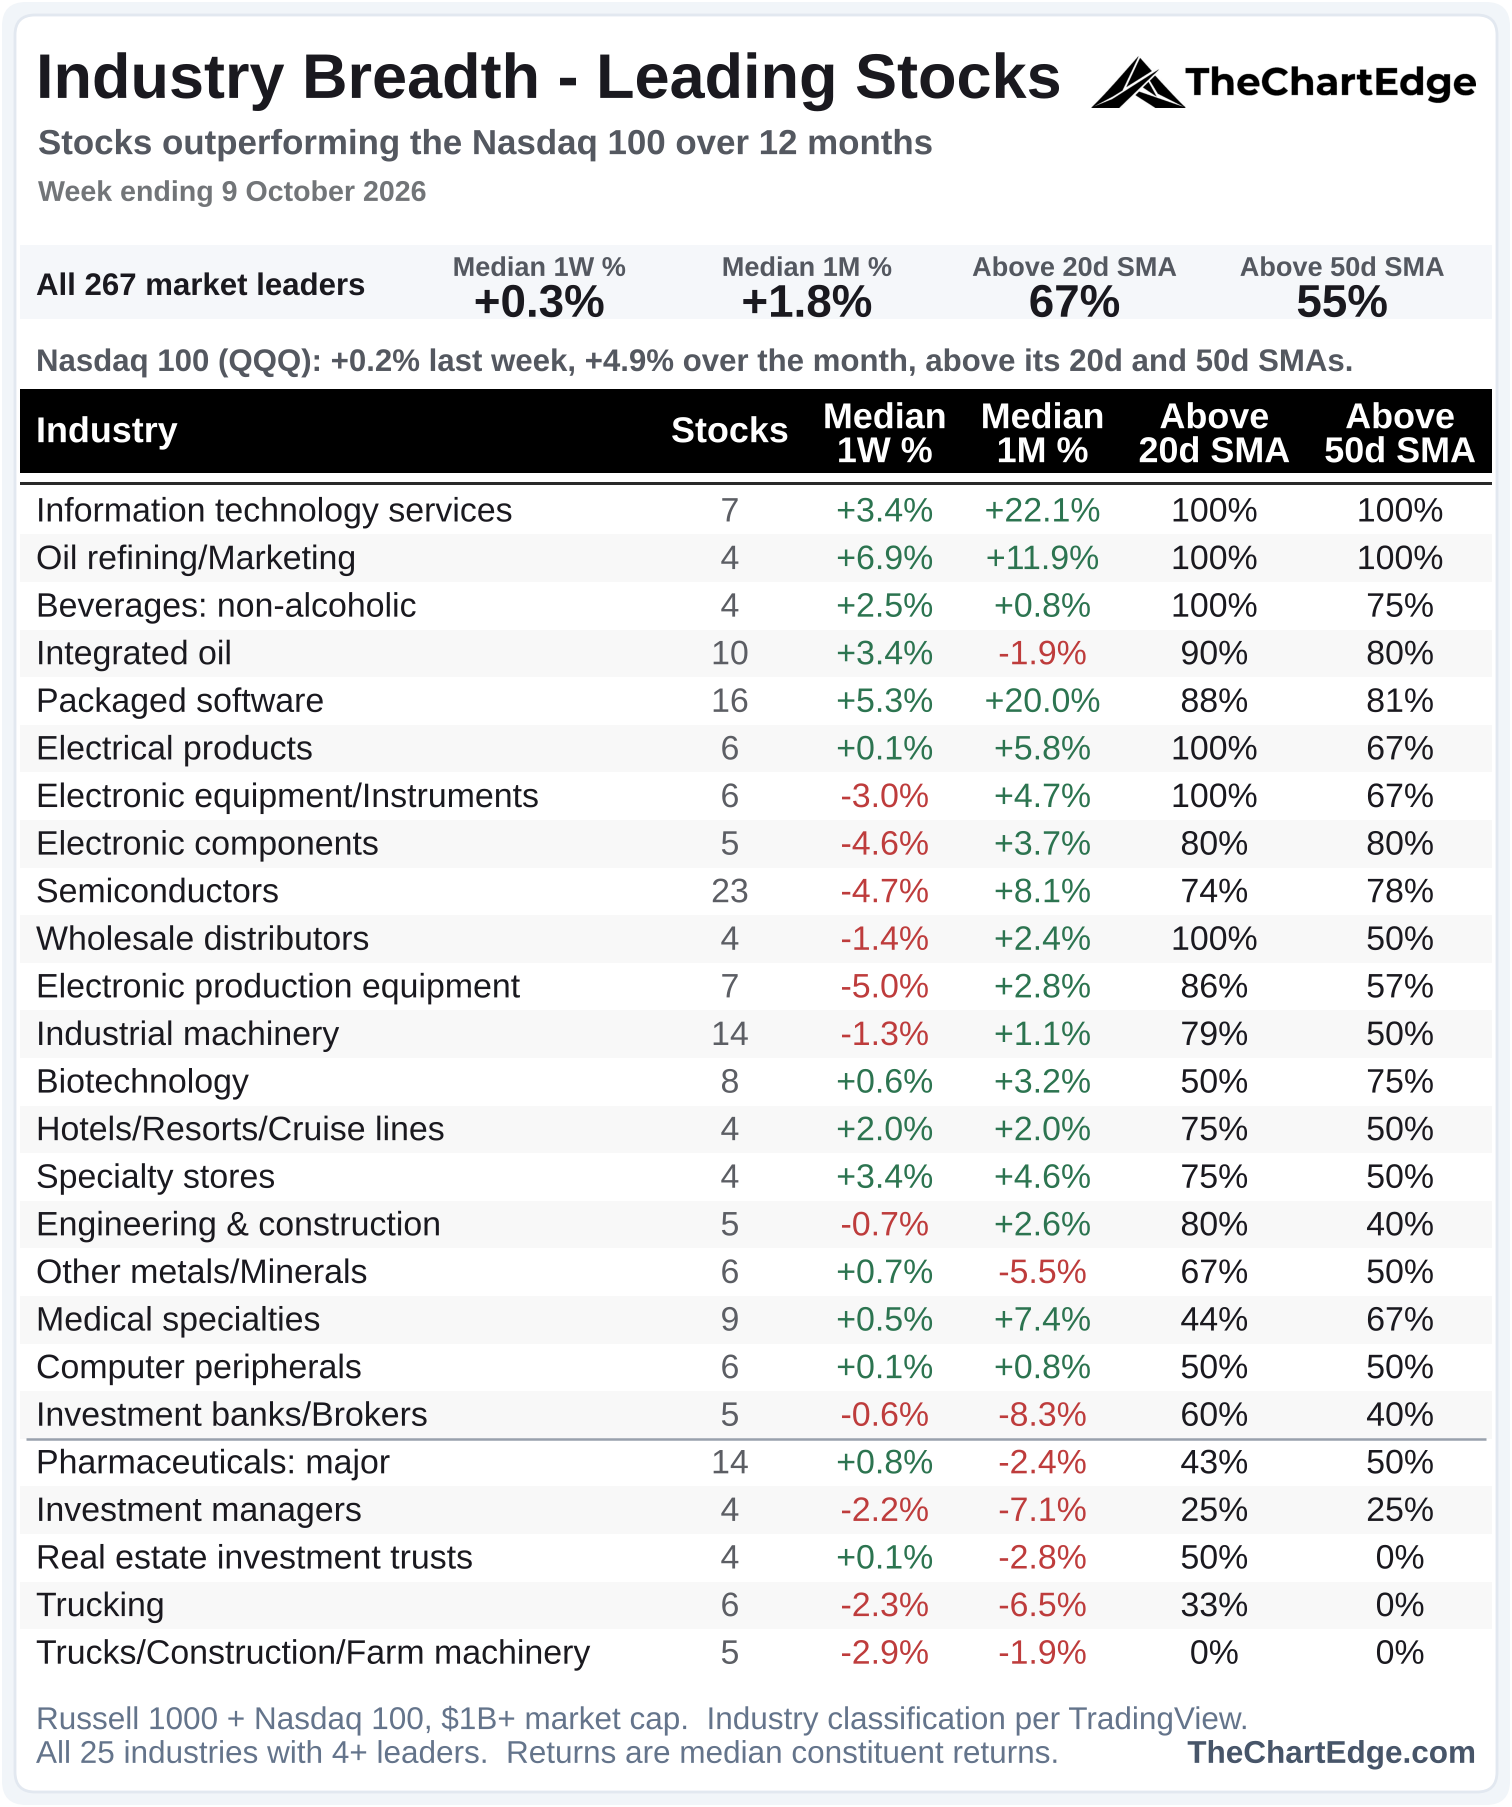
Semiconductors no longer have every name above their 20 and 50-day SMAs and slipped to 9th. IT services and oil refining are now the only industries with all names above both. Integrated oil and investment banks climbed back above the 50% line.
Semis Pull Back, Software Picks Up
Semiconductors (SMH) Chart
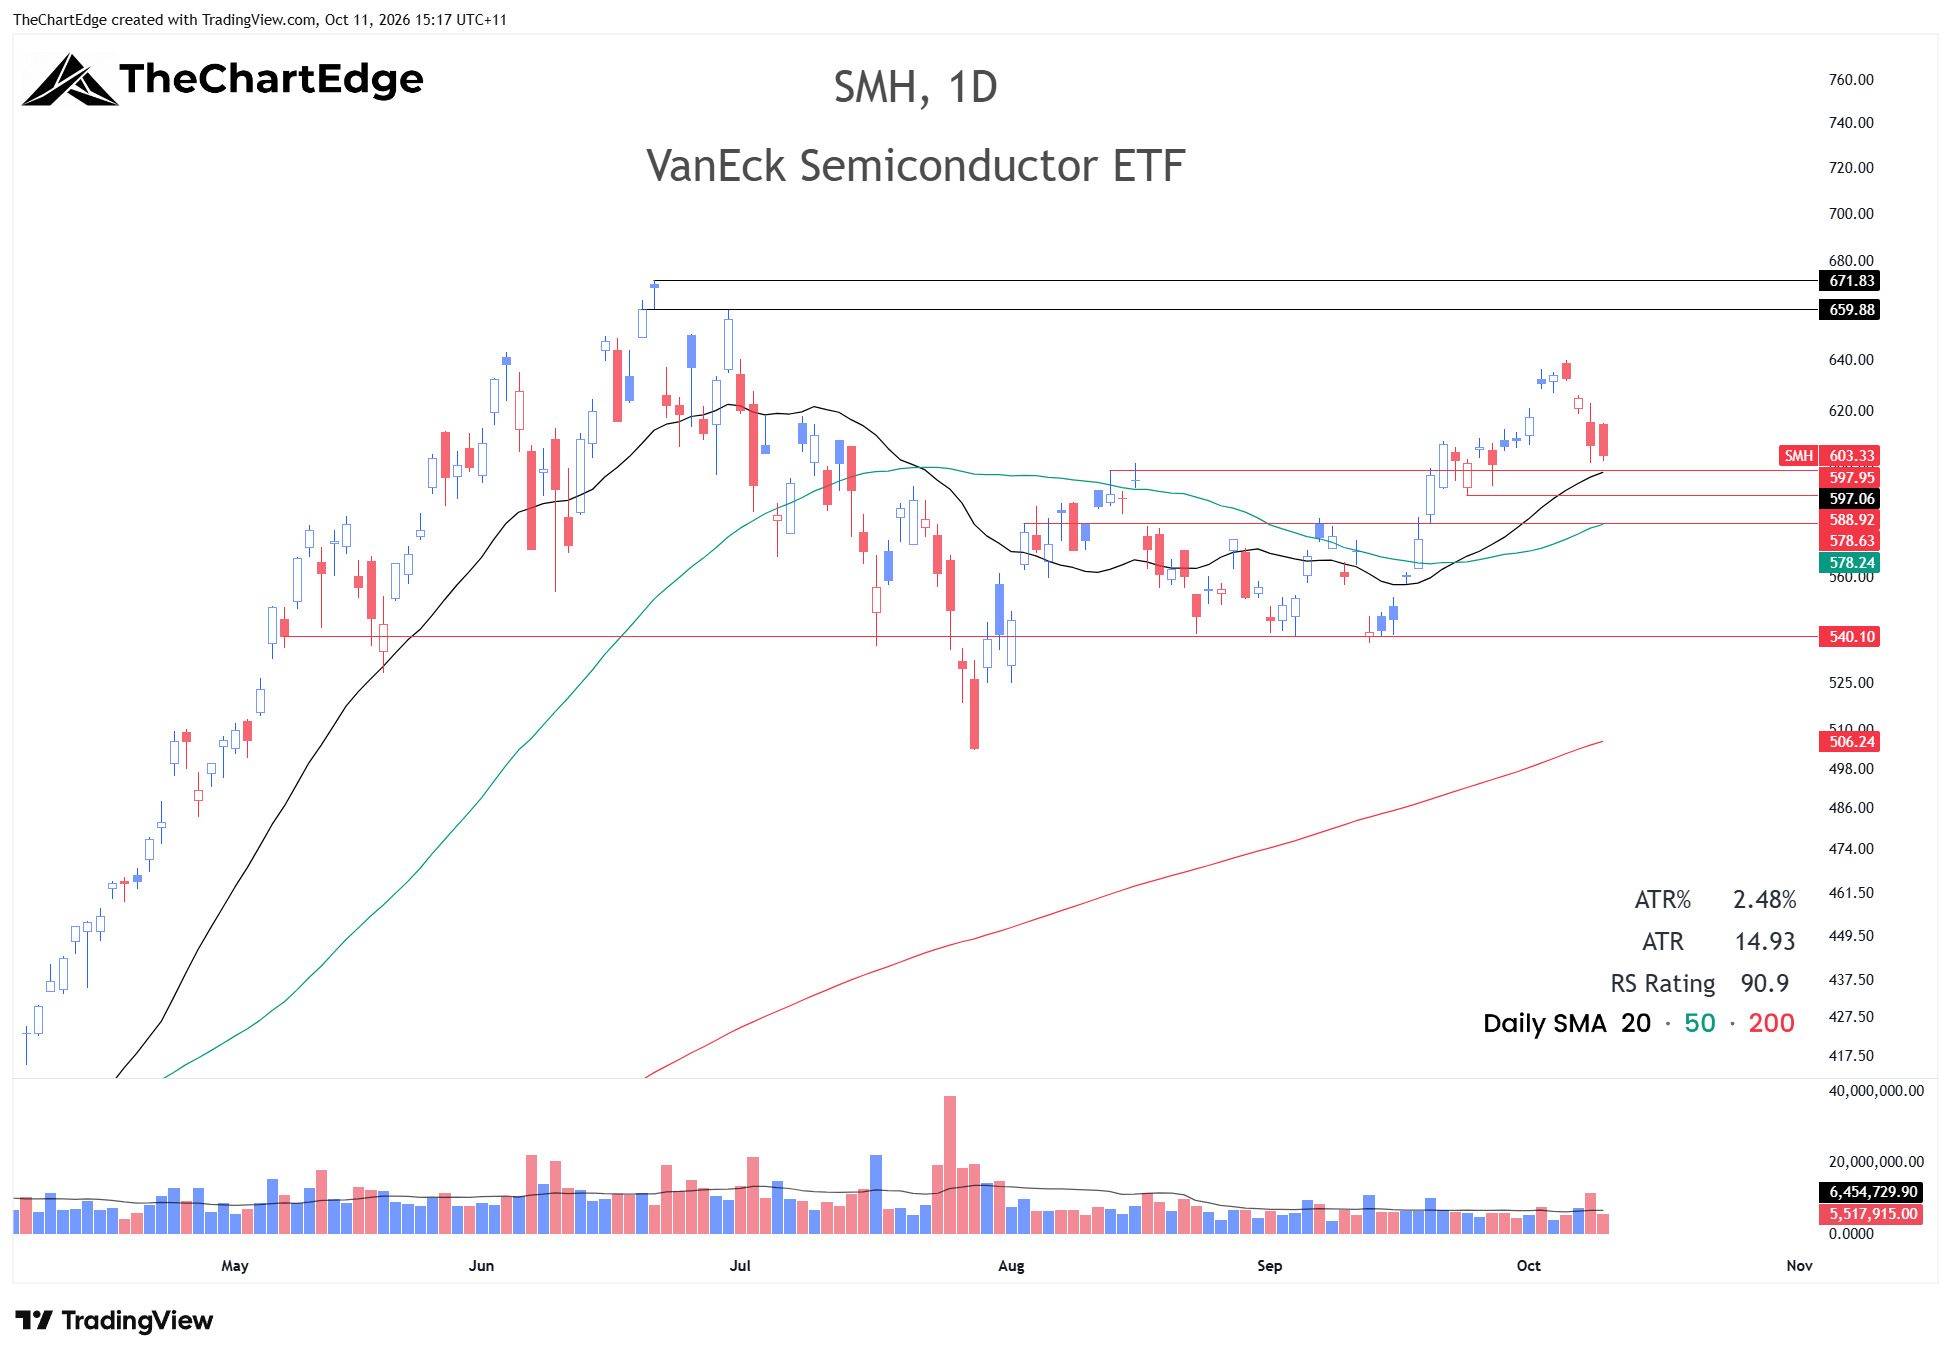
I’ve been waiting for a pullback in SMH, which came last week. It fell 4.3% to close at 603.33. Friday’s close was weak, finishing near the lows of the day. Further weakness and a close below 598 would be a red flag. However, if it can hold this level and set a higher low, I may take a new long position, with a target around 660 and stop under 598.
Software (IGV) Chart
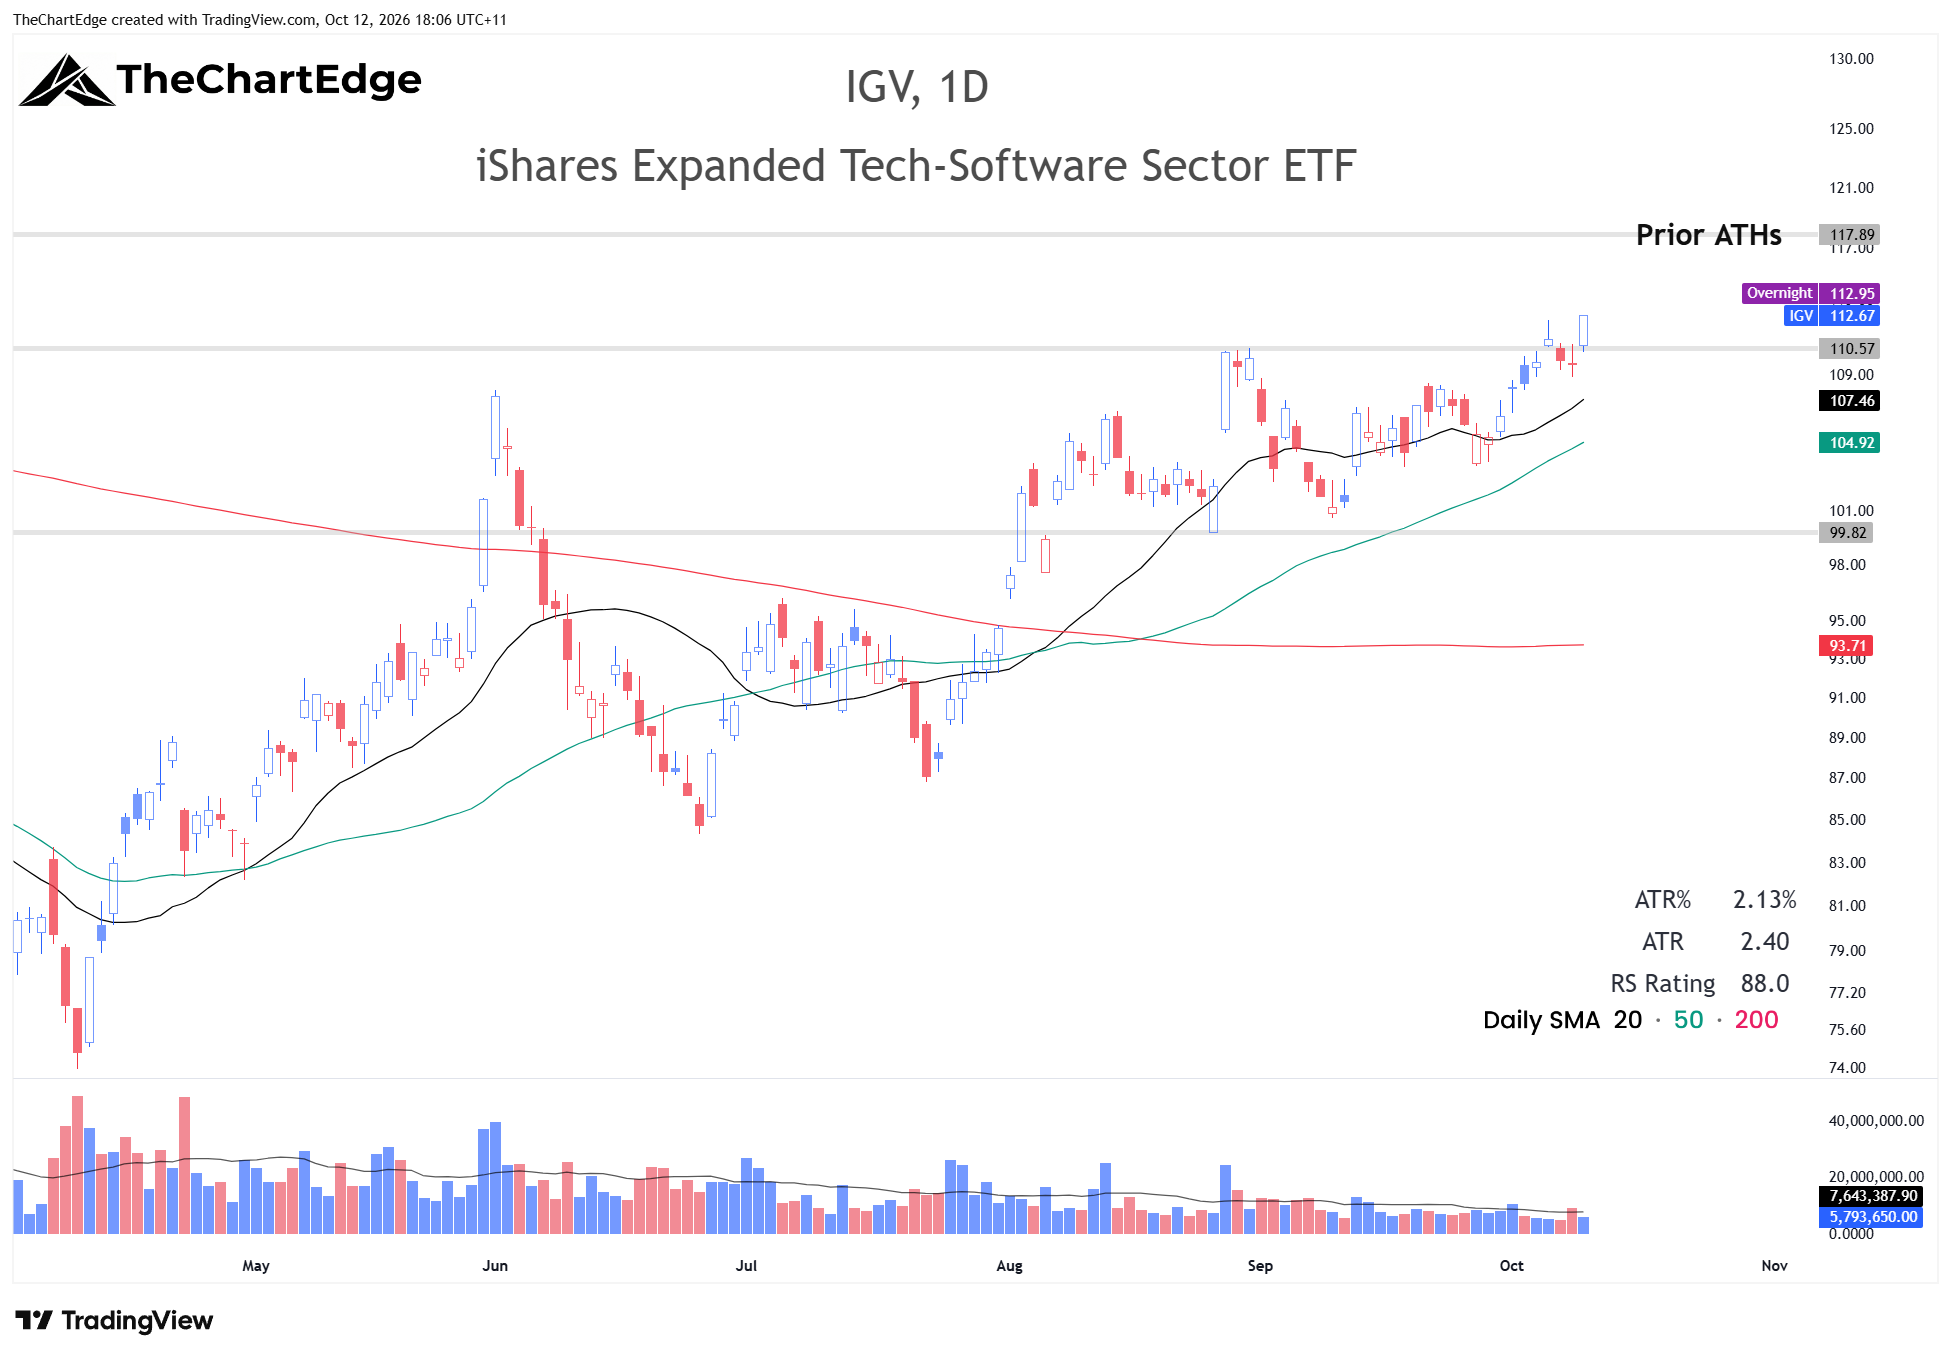
Software had a strong week. Cybersecurity (CIBR) was the 4th best ETF in the universe, and IGV closed above resistance around 110.50 and looks like it may make a run towards its 2025 all-time high just under 118.
Crypto
Bitcoin Chart
Ethereum Chart
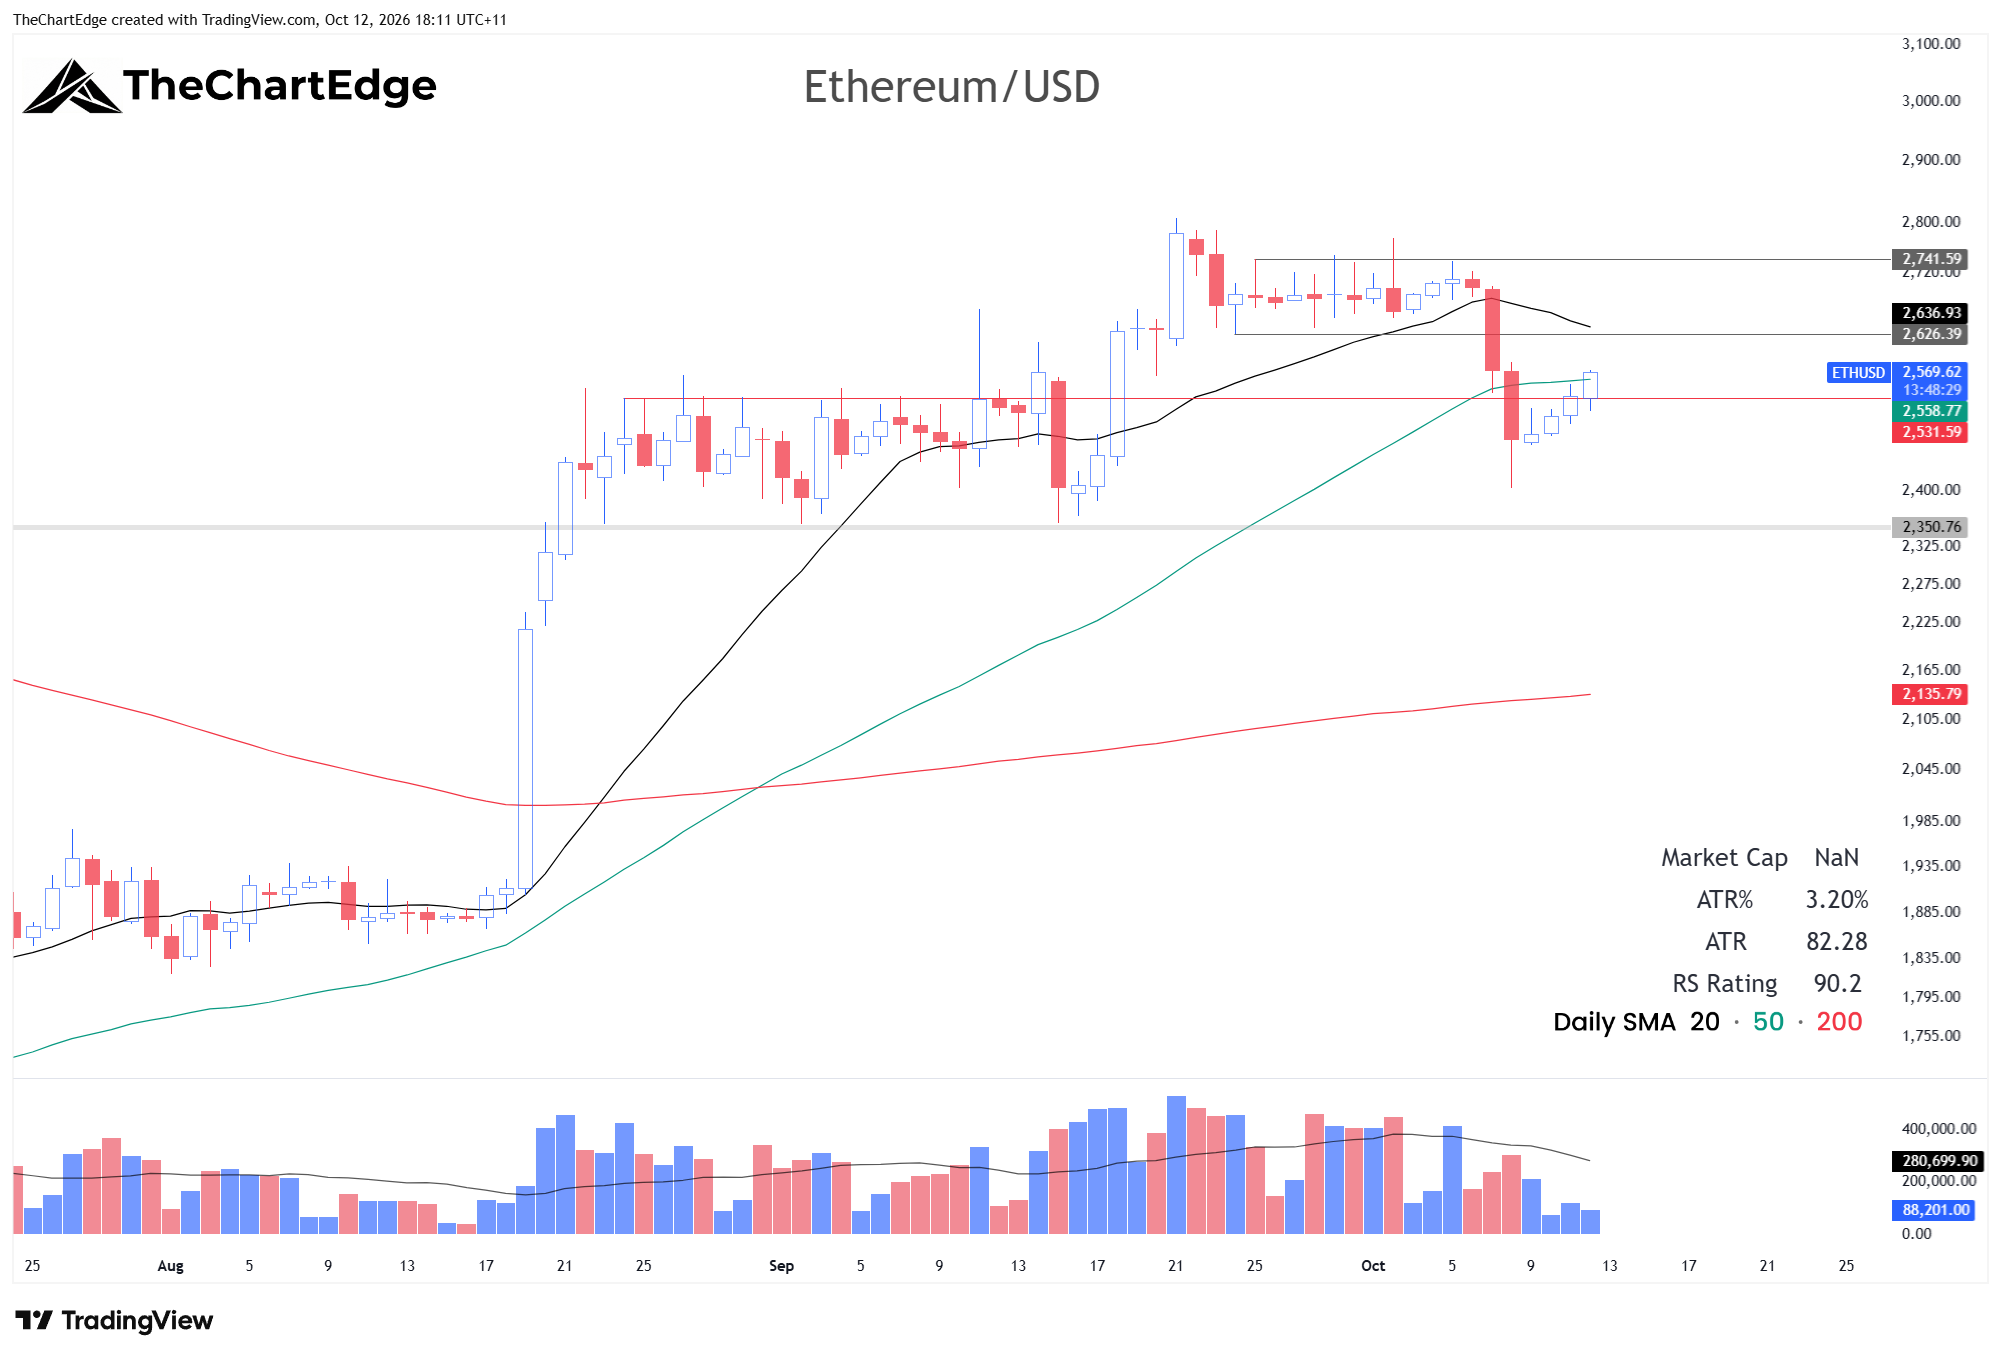
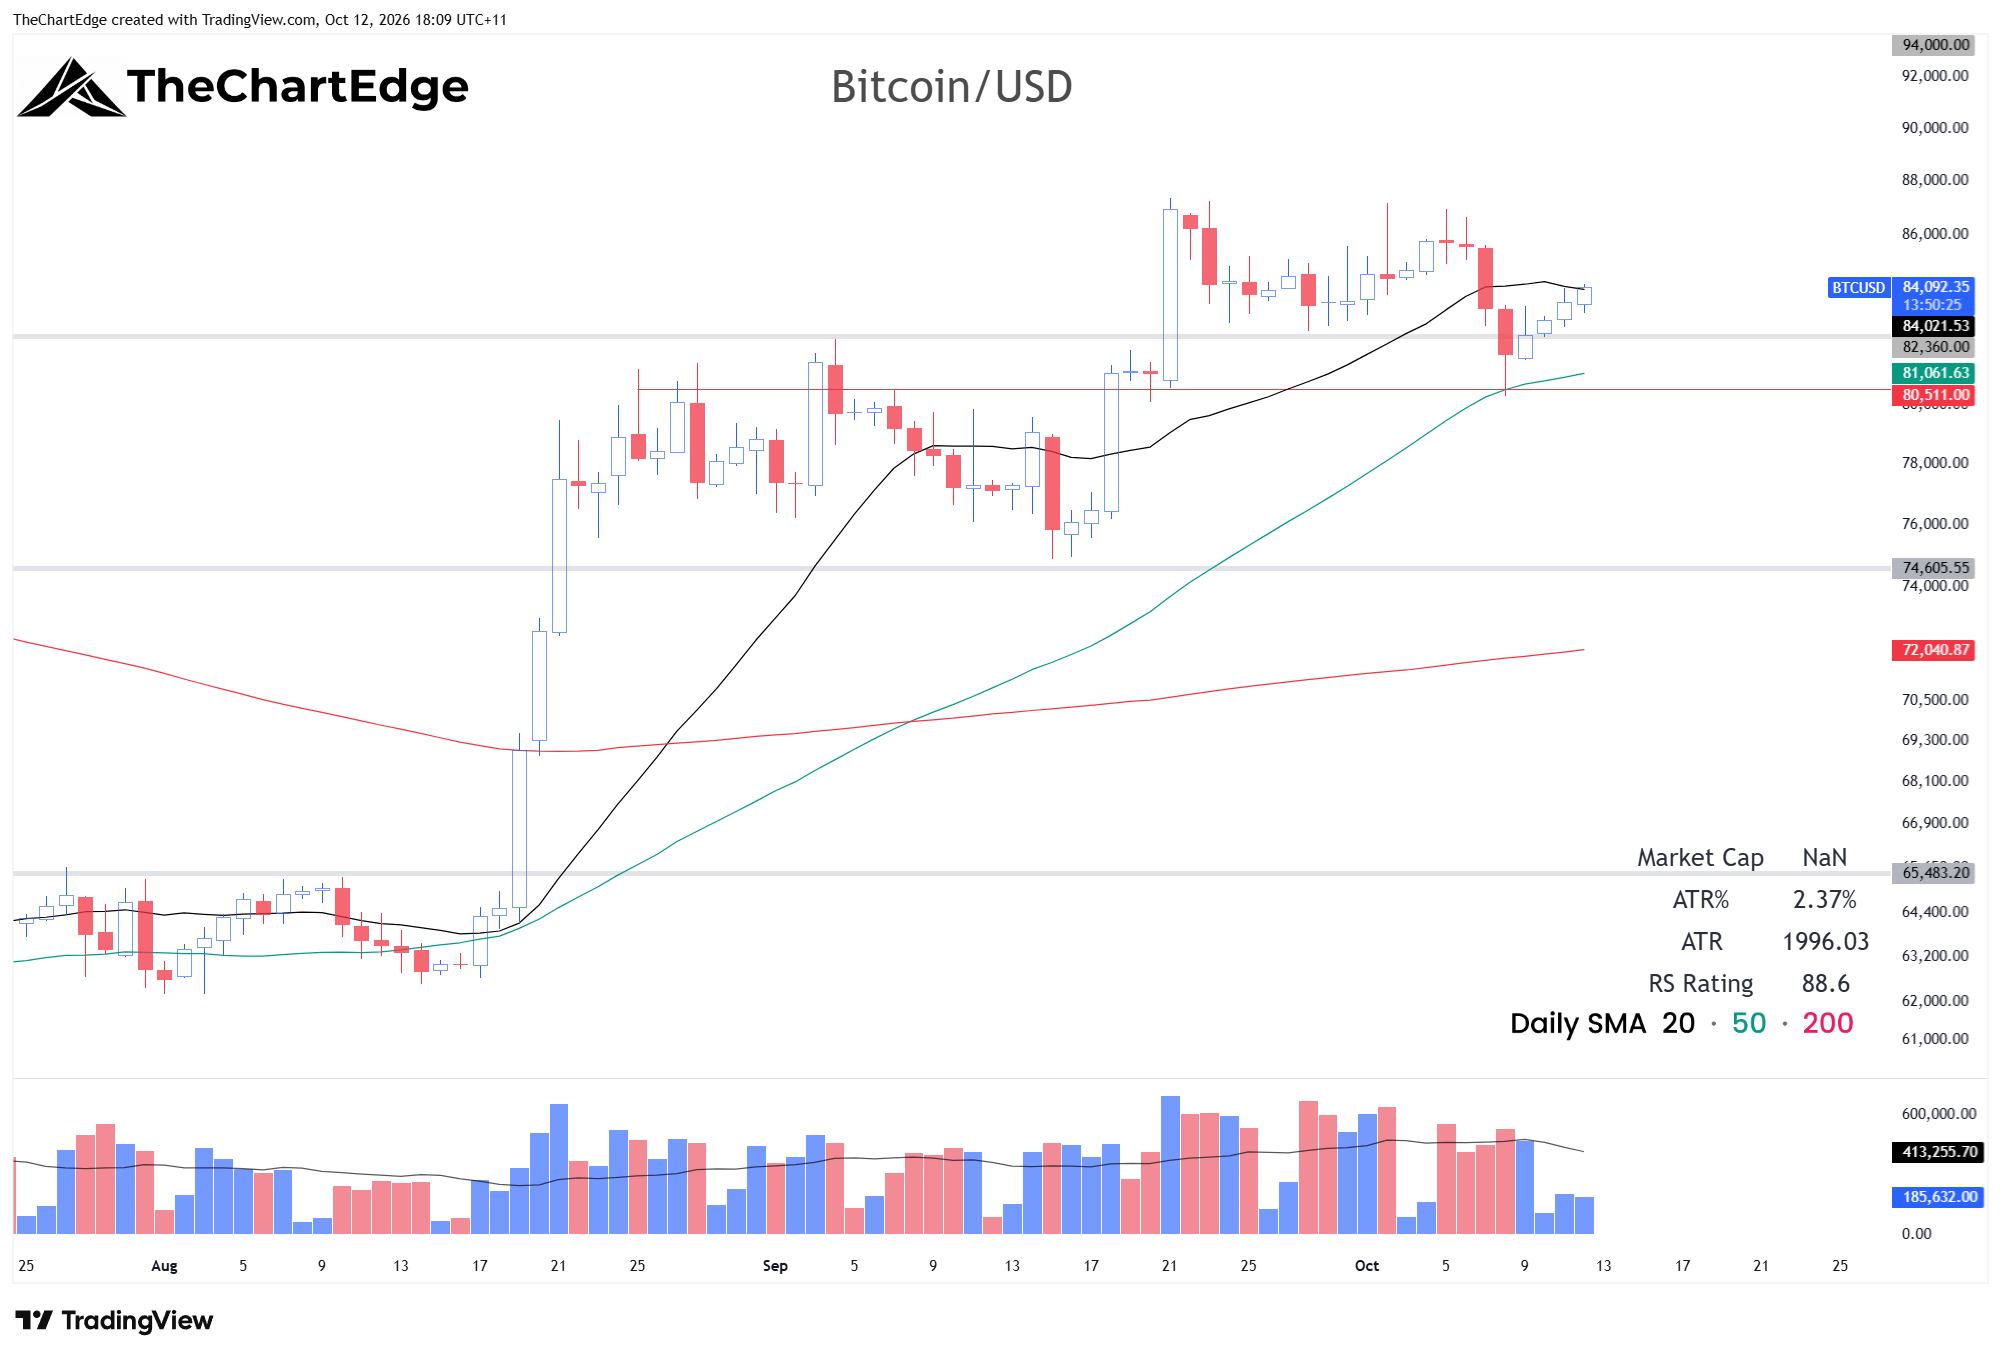
Bitcoin and Ethereum both sold off quite strongly on Wednesday and Thursday, but have both recovered somewhat since. Bitcoin held up better, bouncing at its 50-day SMA, while Ethereum fell below both the 50-day and the 2515-2530 level I was watching, making a low around 2400. It’s back up to around 2550 on Monday evening Melbourne time as I post this. I am just going to watch it for now and see if it continues to move higher, or if we get a deeper pullback towards the 200-day SMA.
Trades
I added 3 new long positions last week - Snowflake (SNOW), Moderna (MRNA) and Semtech (SMTC) - and went short the Russell 2000, which I was stopped out of today (Monday). I also still have my long FCLD position.
Cloud Computing (FCLD) Chart
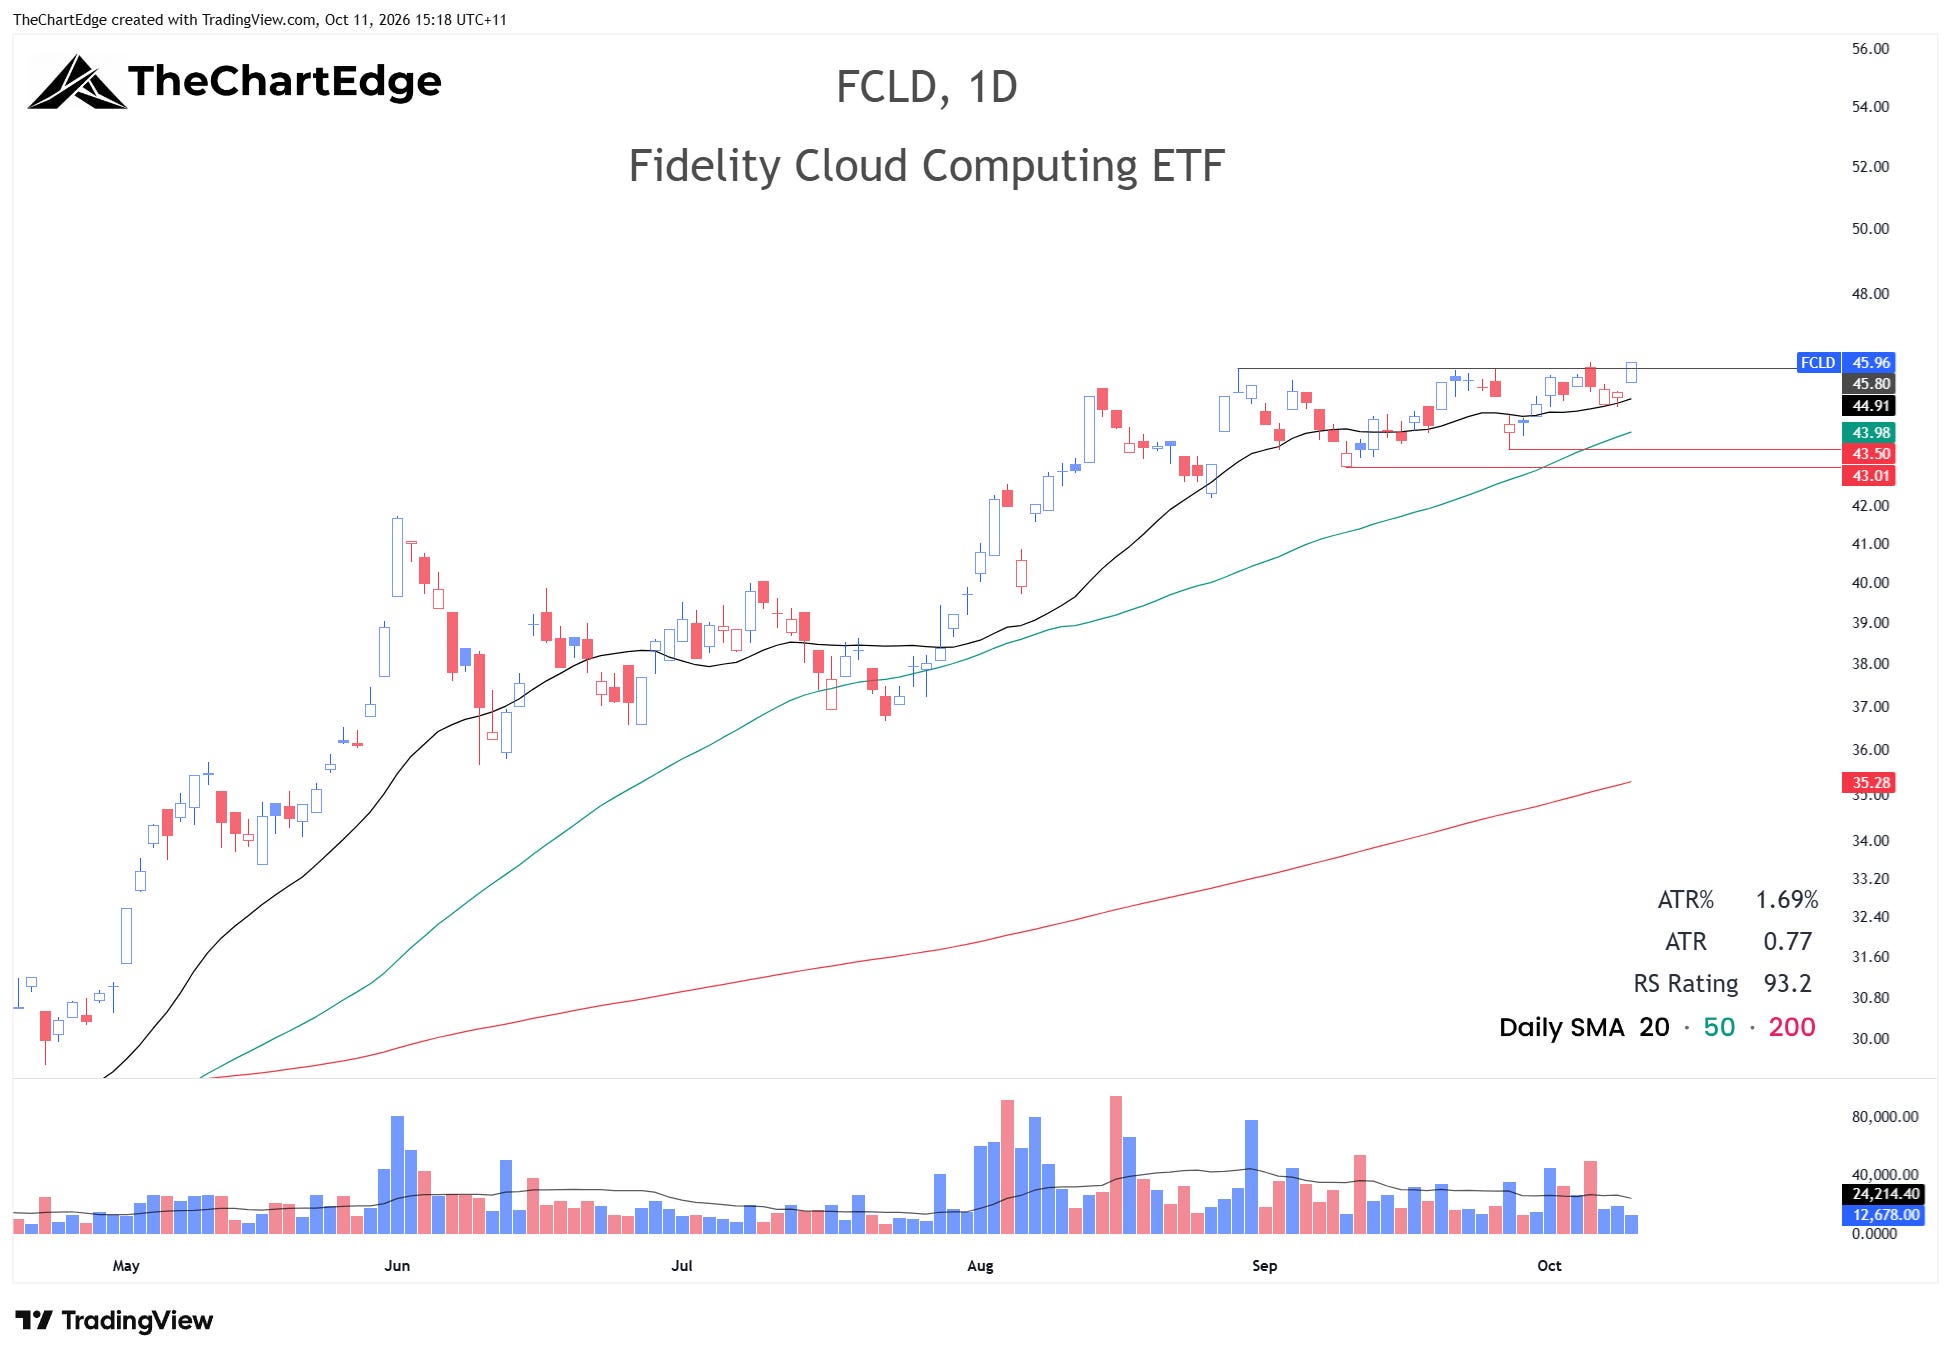
FCLD made a new all-time weekly closing high at 45.96. My stop is still at 42.90, but if it continues higher, I’ll move it towards breakeven.
Snowflake (SNOW) Chart
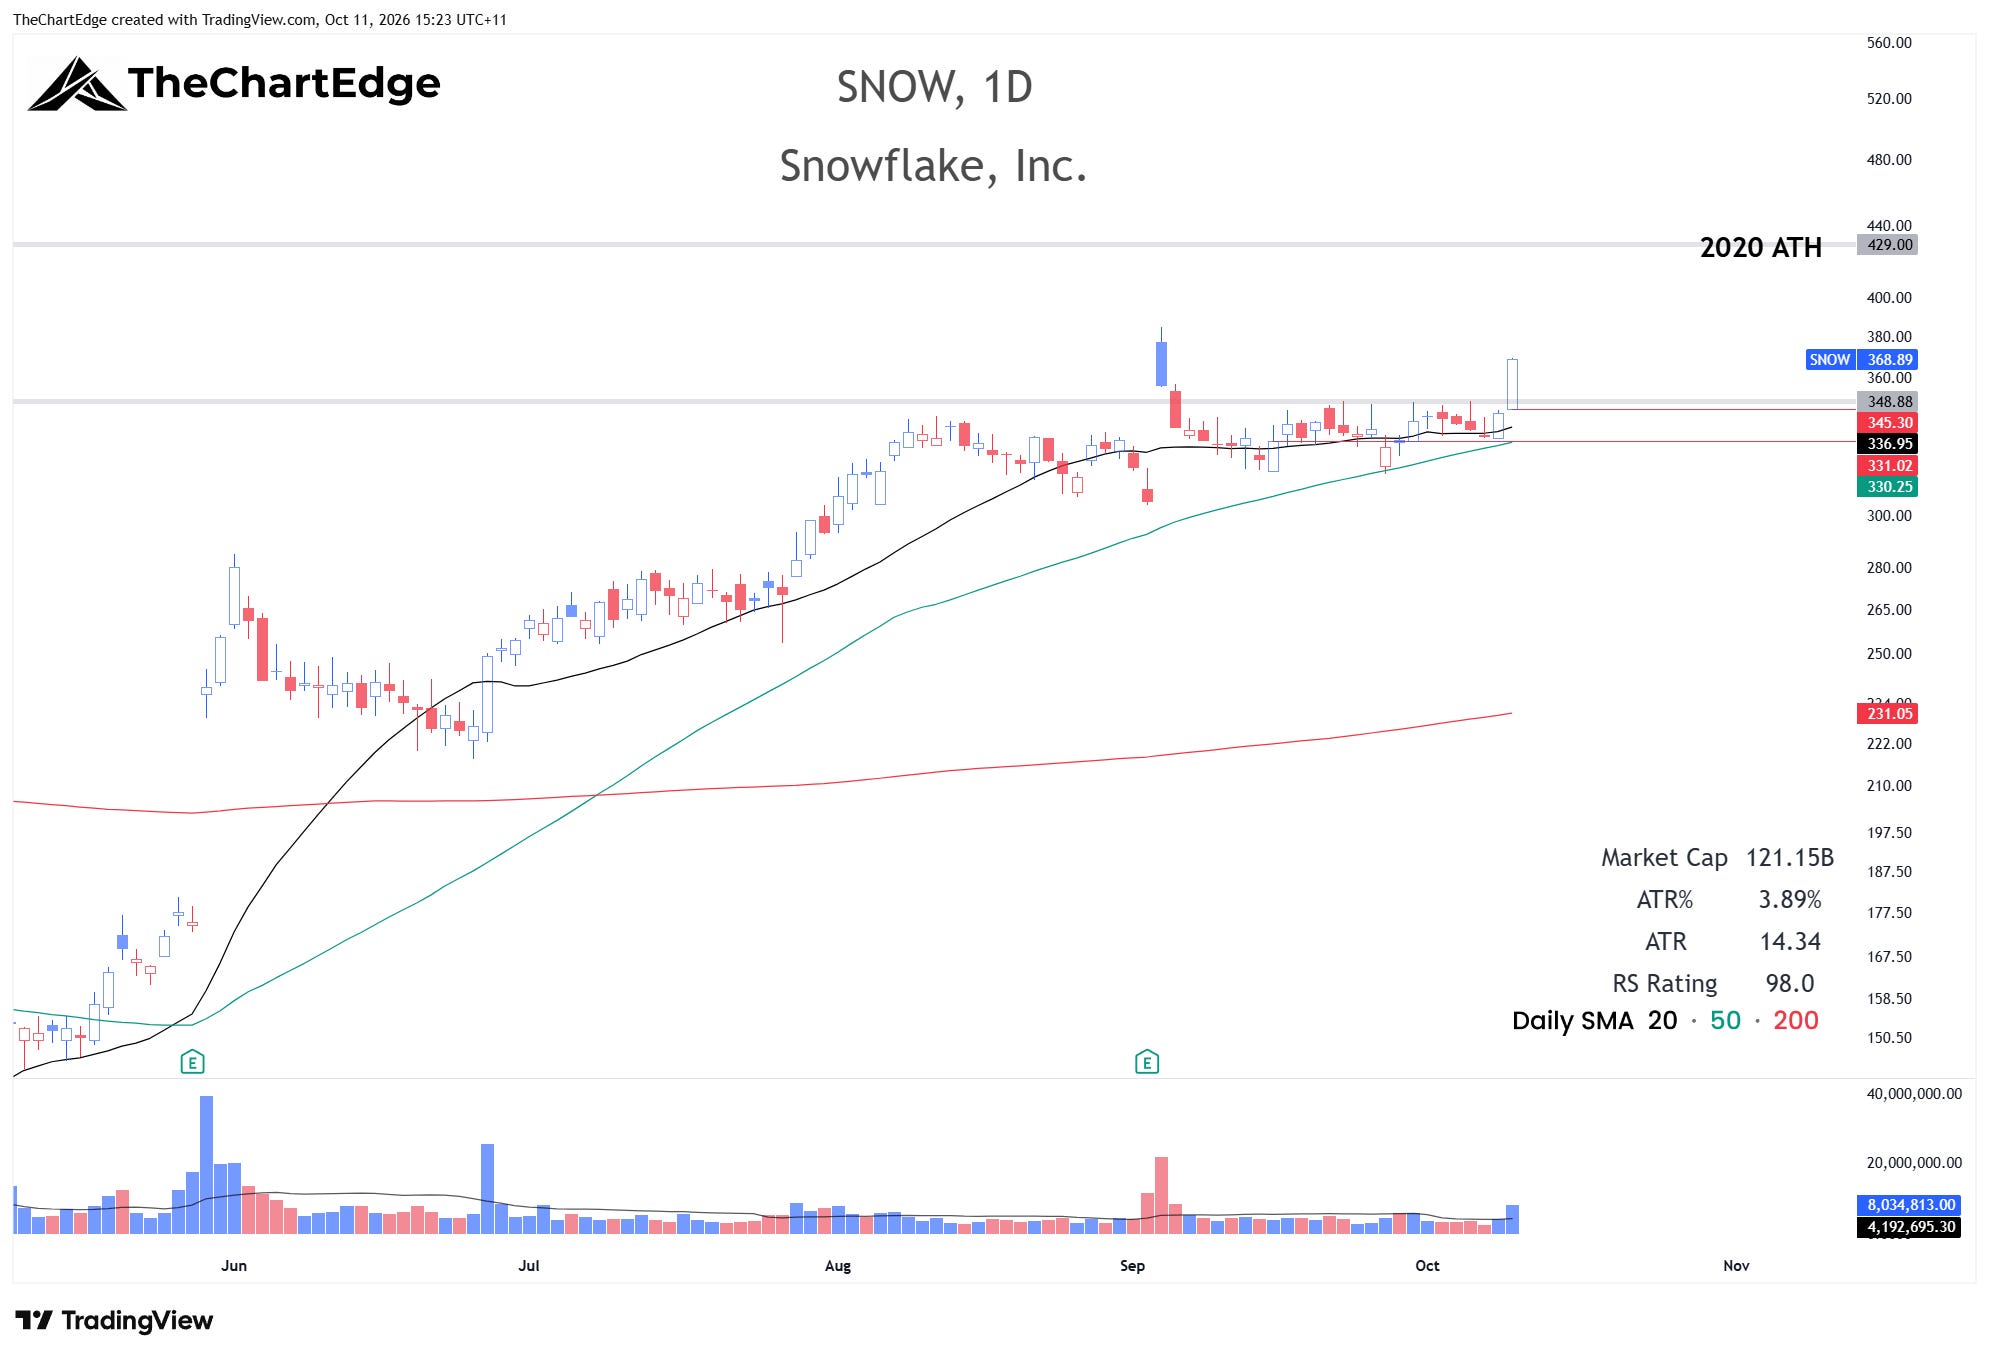
I flagged SNOW a couple of weeks ago as one that could provide a low-risk entry if it broke out of its tight range. It broke out on Friday on roughly double its average volume and closed at 368.89. I bought it early with a day-trade entry and tight stop, then sold into strength. I then bought it back around 358 after it pulled back and turned up again to make new highs for the day, again with a tight stop. The red line at 345, under Friday’s low and the breakout area, is where I’d usually have my stop on a swing trade, but I don’t want this to turn from a decent profit into a loss, so I’ve raised my stop to breakeven and may sell a portion into strength if we get it (this stock has pre and post market trading on my CFD platform which means I can be a bit more tactical without staying up too late). The target I have in mind is the September high around 384, and if it can clear that, the 2020 all-time high at 429.
Moderna (MRNA) Chart
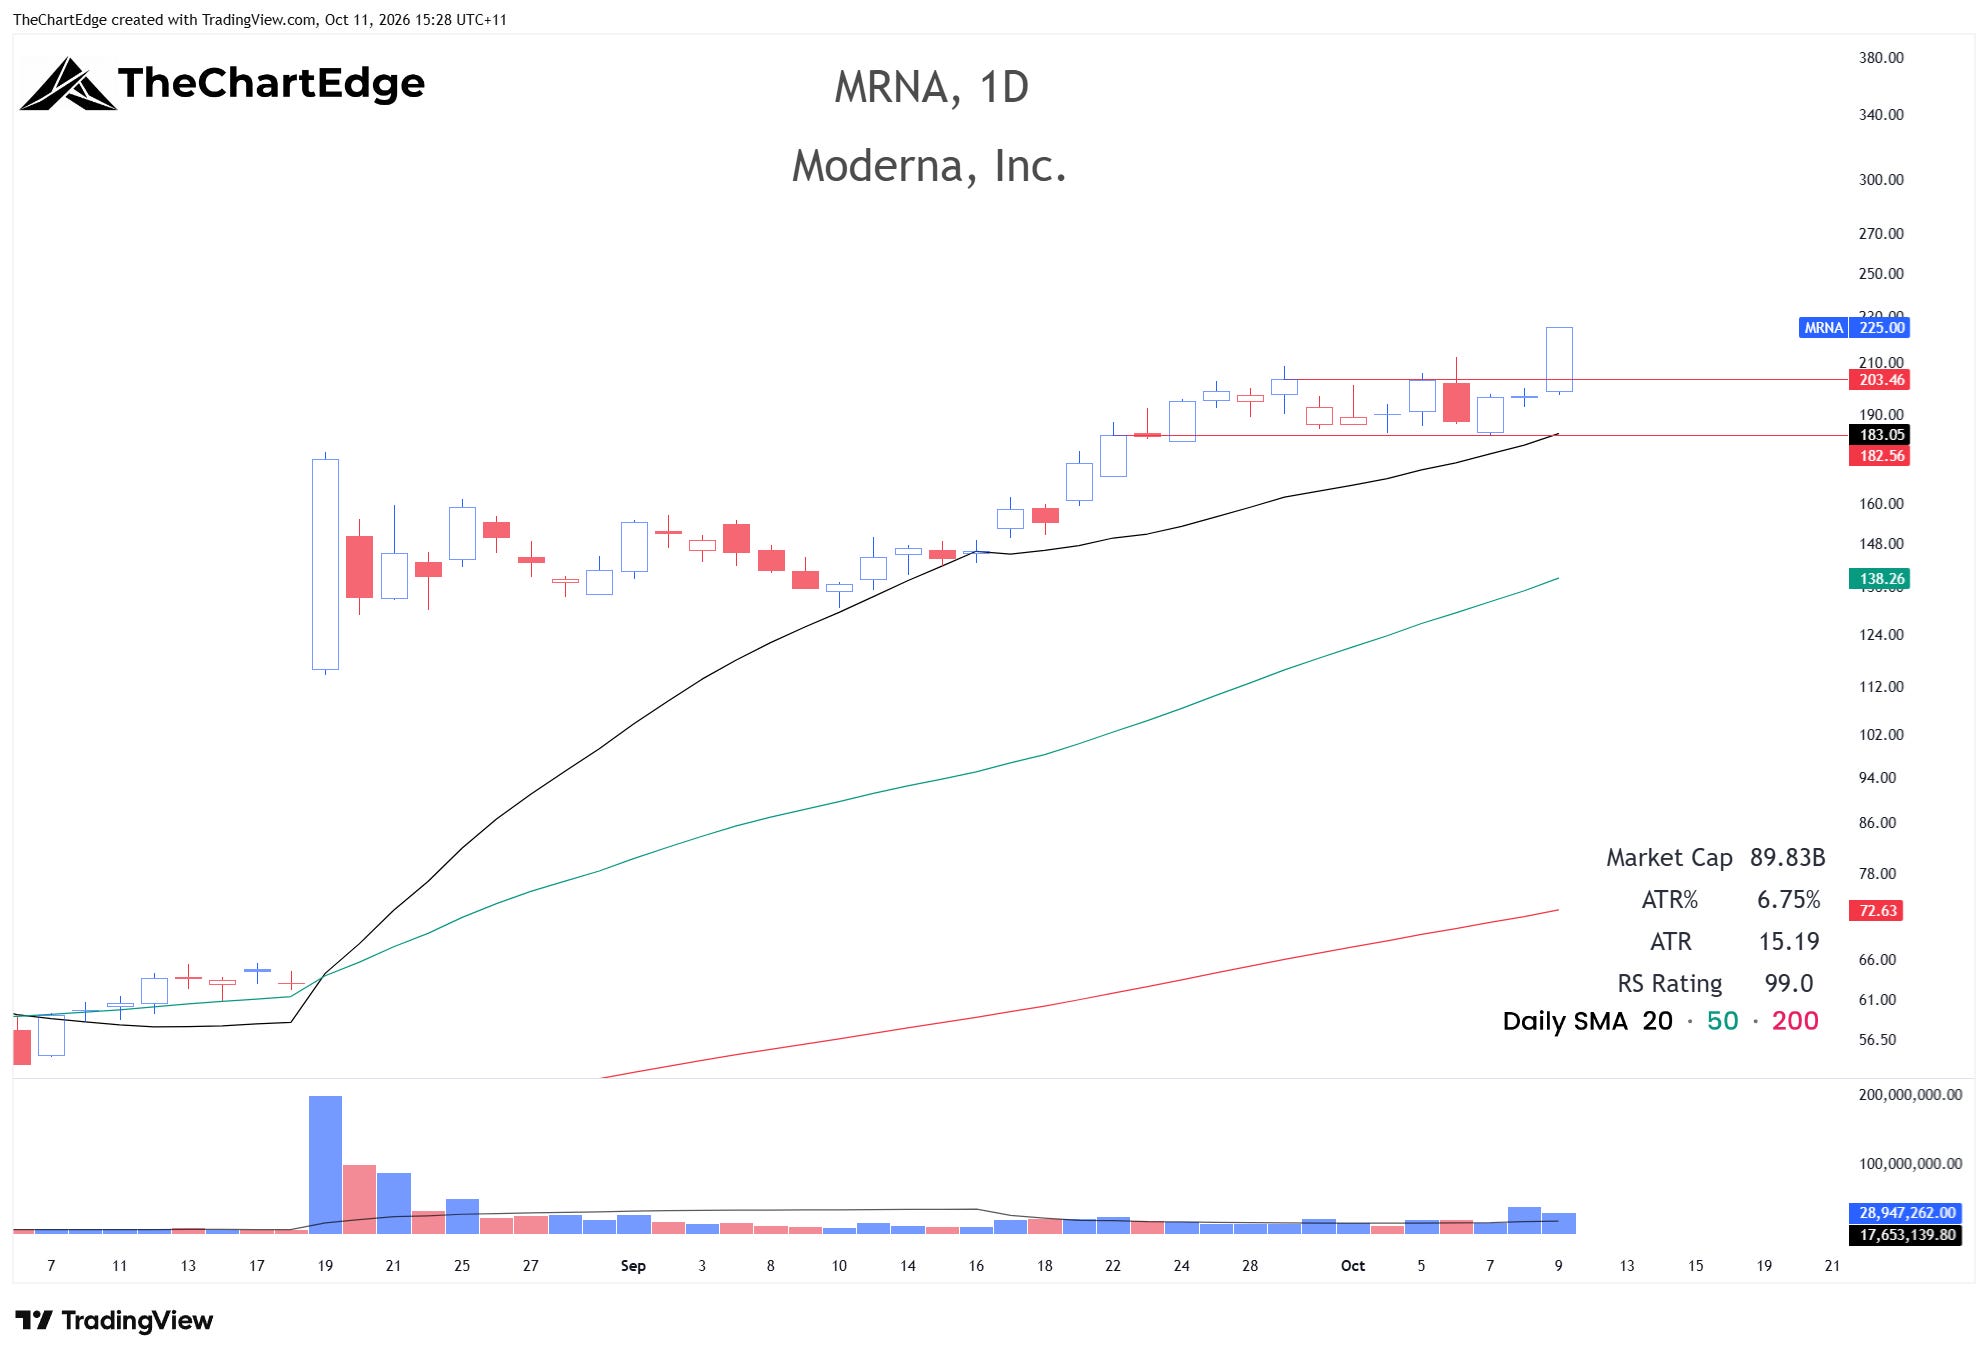
MRNA rose 18.4% and closed at 225.00, breaking out of the range it had been in for the past few weeks between roughly 183 and 203. Like SNOW, I bought it early on Friday with a day-trade entry and sold into strength, before buying it back again around 210 as it crossed back above its daily AVWAP about 2 hours after the open. I’m not willing to let this one turn into a loss either, so I’ve raised my stop to breakeven and will look to scale out into strength, targeting close to 300. Moderna presents the full Phase 3 data for its melanoma vaccine at ESMO on Saturday October 24, so I’ll almost certainly be out before then.
Semtech (SMTC) Chart
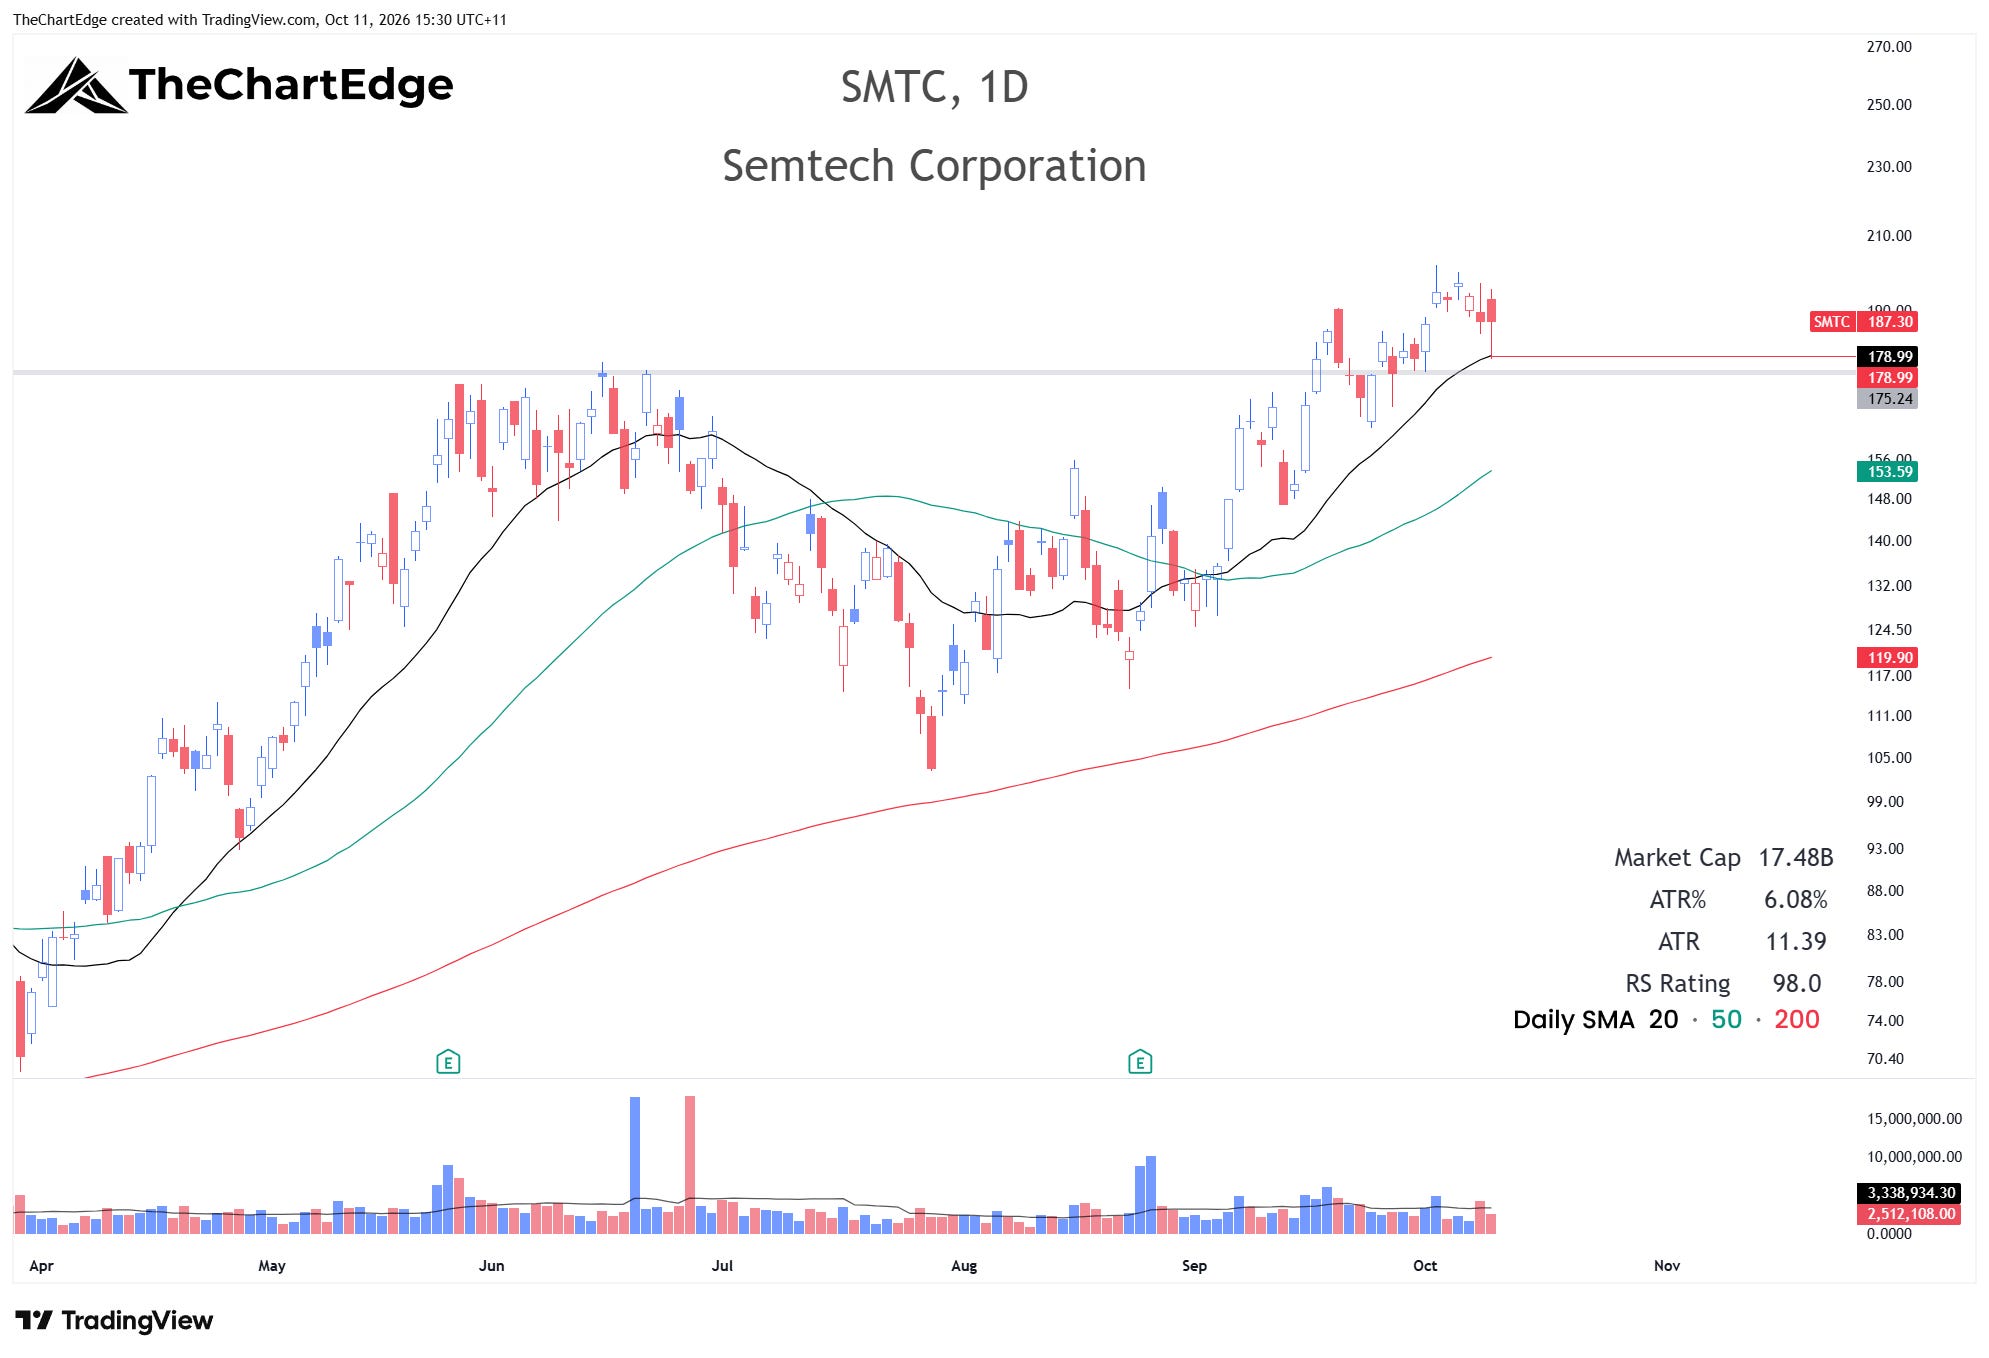
SMTC was another name from my watchlist a couple of weeks ago - I said if it could consolidate near its all-time highs for a while, it might provide a good entry. On Friday it dropped quite severely on the open but bounced off the 20-day SMA. I bought it as it reclaimed its daily AVWAP around 187 with a stop just under 183. It stayed in a tight range throughout the rest of the day. The red line on the chart, just under the 20-day, is where I’d normally put my swing stop, but I’ll leave it on with the tighter stop as is.
Russell 2000 Futures (RTY) Chart
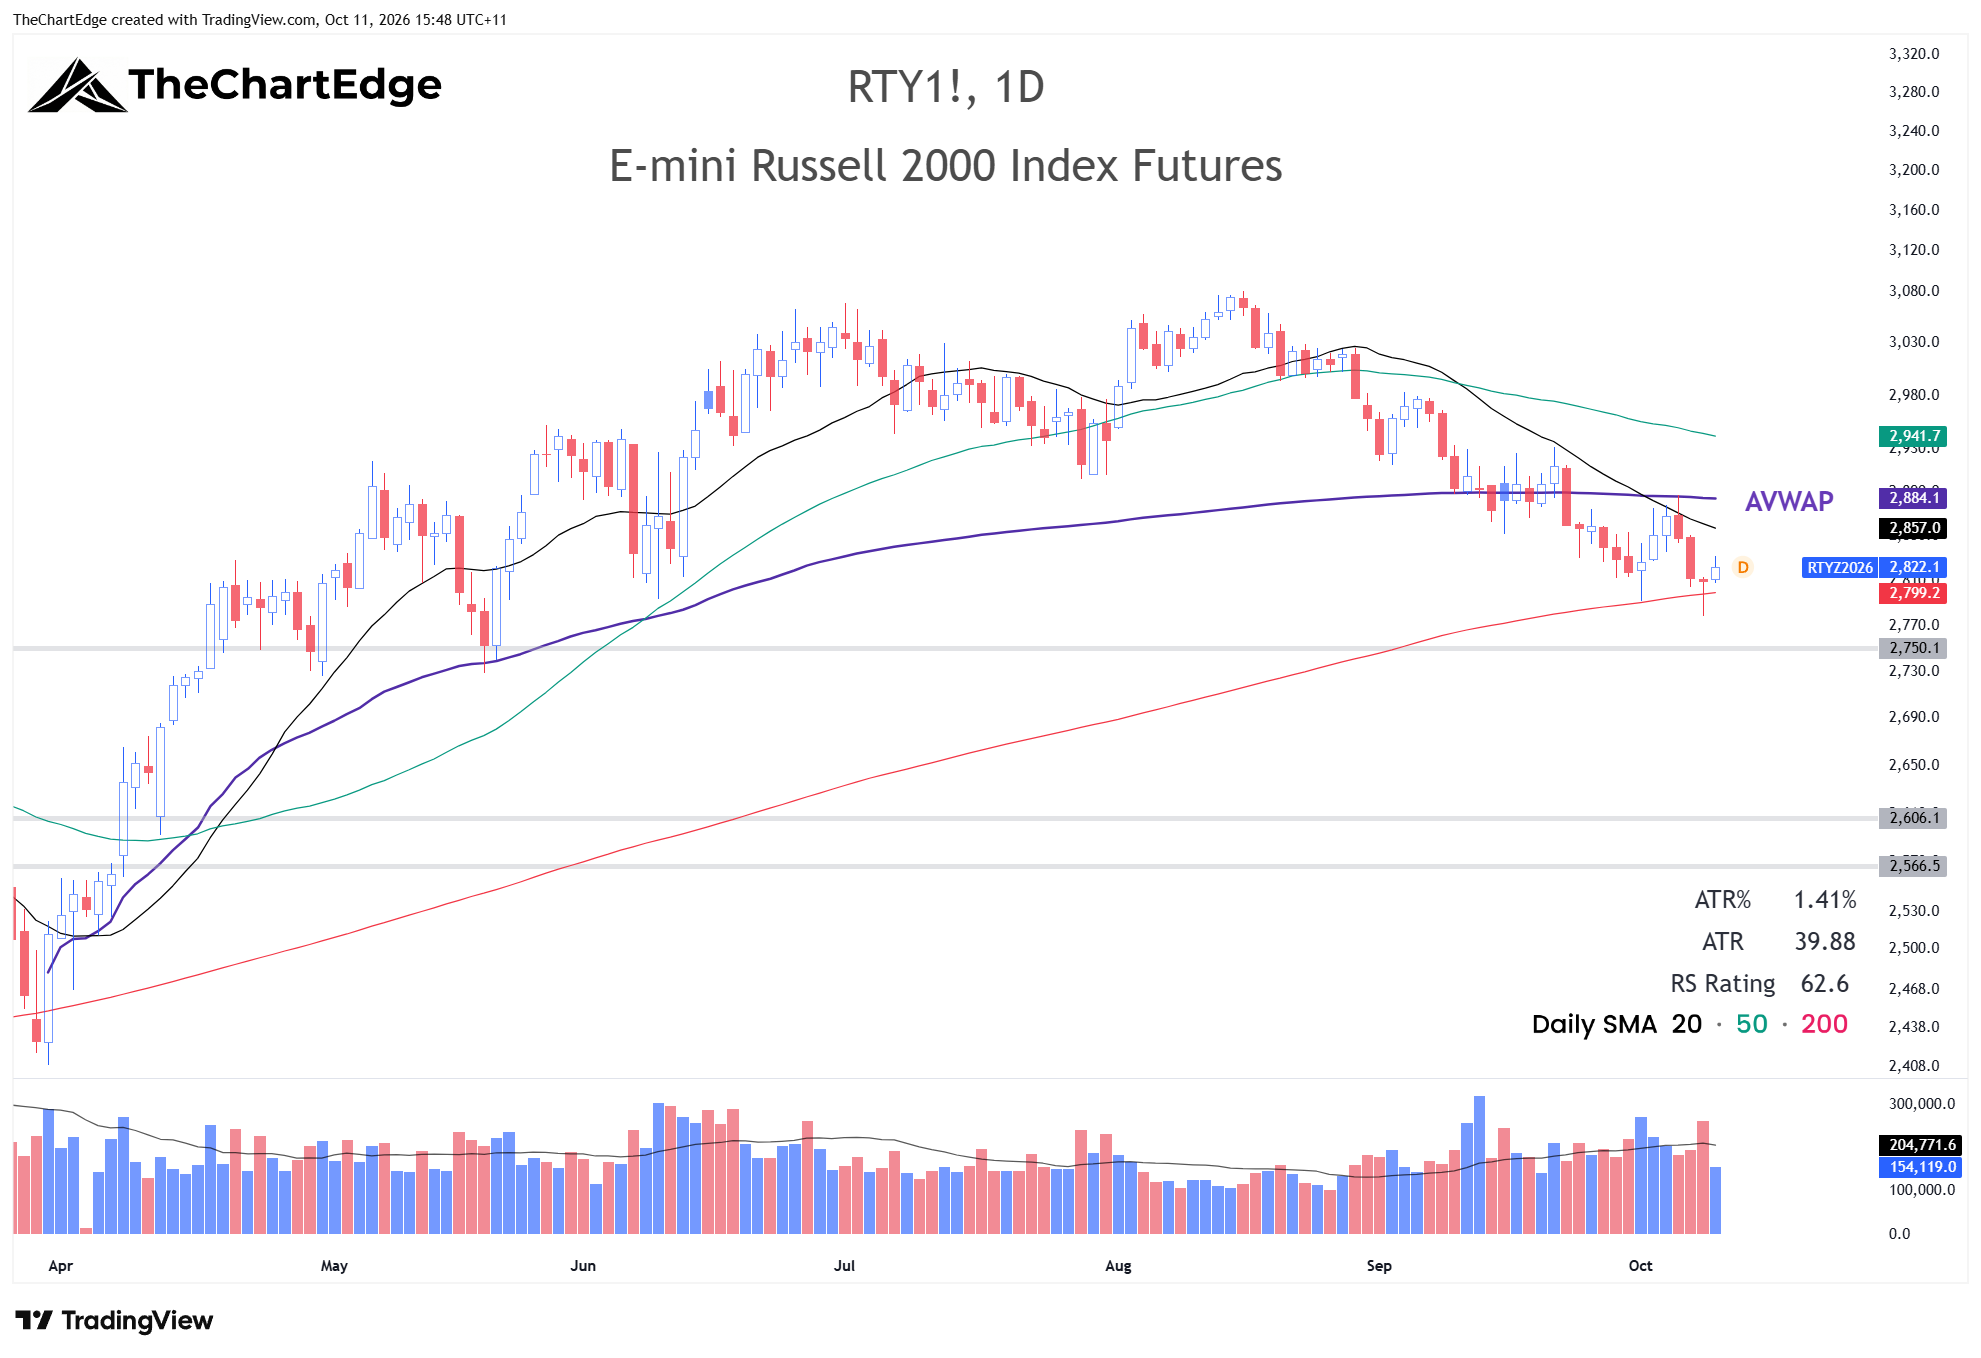
Last weekend I mentioned the Russell 2000 had bounced very close to its 200-day SMA. On Tuesday it rallied into the AVWAP from the March 31 low, around 2884, and was rejected. I shorted the December Russell 2000 futures contract through a CFD on Wednesday Melbourne time at 2840 with a stop above Tuesday’s high, thinking that if it breaks the 200-day SMA we could get down towards the 2565-2600 area.
Thursday’s reversal candle made me less confident in the trade - it made a lower low under the 200-day, then reclaimed it, finishing strongly. However, I kept the position on as a hedge, since I planned to add some long exposure. I tightened my stop today (Monday) to just above Friday’s high and was stopped out at 2834, for a very small gain.
The Week Ahead
The Market Temperature is back in the Goldilocks Zone. Breadth ticked higher for the first time in 8 weeks, and 76 of the 121 ETFs I track finished higher, from 40 last weekend. SPY broke above 775 and QQQ held its breakout. However, the leadership underneath rotated away from semis and AI hardware into software, health care and defensives.
I’m happy with my 4 long positions, but may add some SMH if it makes a higher low above 598 as outlined above, depending on how my other positions go. For now, I plan to run tighter stops and sell into strength, with earnings season kicking off, the mid-terms not far away and the potential for more flare-ups in the Middle East to affect markets.
Stay open-minded and manage risk carefully.
Cheers,
Marcus Grant, CFTe
Disclaimer: The content provided in this newsletter is for informational and educational purposes only and should not be considered as financial, investment, or legal advice. It is general information only and does not take into account your objectives, financial situation or needs. The information shared is based on our research and analysis, but we are not a licensed financial advisor, nor can we guarantee its accuracy, completeness, or timeliness. Market conditions and financial instruments can change rapidly, and any opinions expressed may not be suitable for all investors. Any opinions expressed and/or securities mentioned do not constitute a recommendation to buy, sell, or hold that or any other security. You should conduct your own due diligence and consult with a licensed financial advisor or other professional before making any investment decisions. Past performance is not indicative of future results, and all investments carry the risk of loss. The authors and publishers of this newsletter are not responsible for any financial decisions made based on the content provided herein. By reading and/or subscribing to this newsletter, you acknowledge and agree that you are using the information at your own risk.