


Everything below is as of Friday November 6 close.
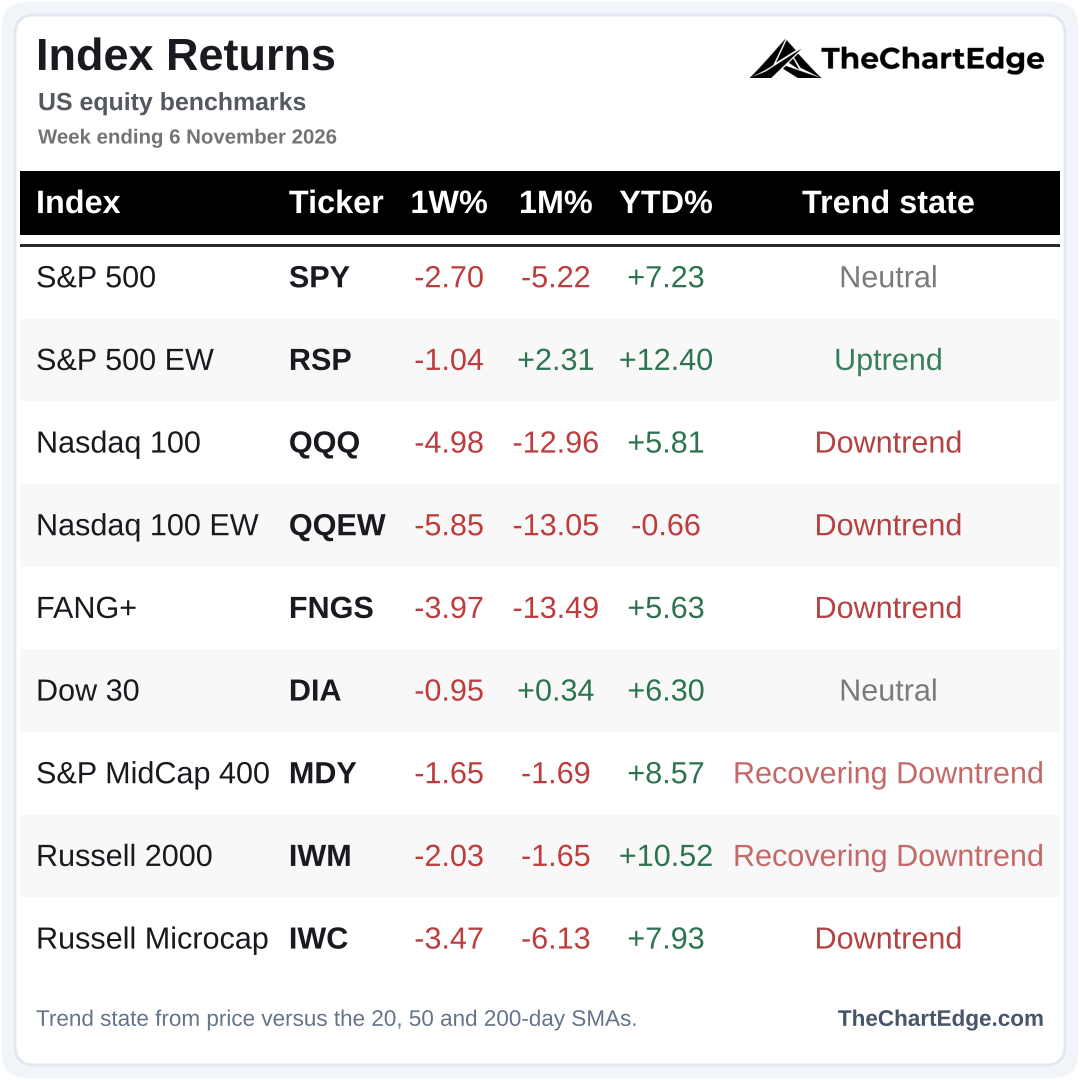
All 9 major indices I track finished the week lower. Stocks rallied on Wednesday after the midterm result, but Thursday was a vicious down day for all the indices. Interestingly there wasn’t really any indication of what was coming on the Thursday open from the equity futures markets. In fact, the RSP and DIA gapped up, before plummeting.
S&P 500 (SPY) Chart
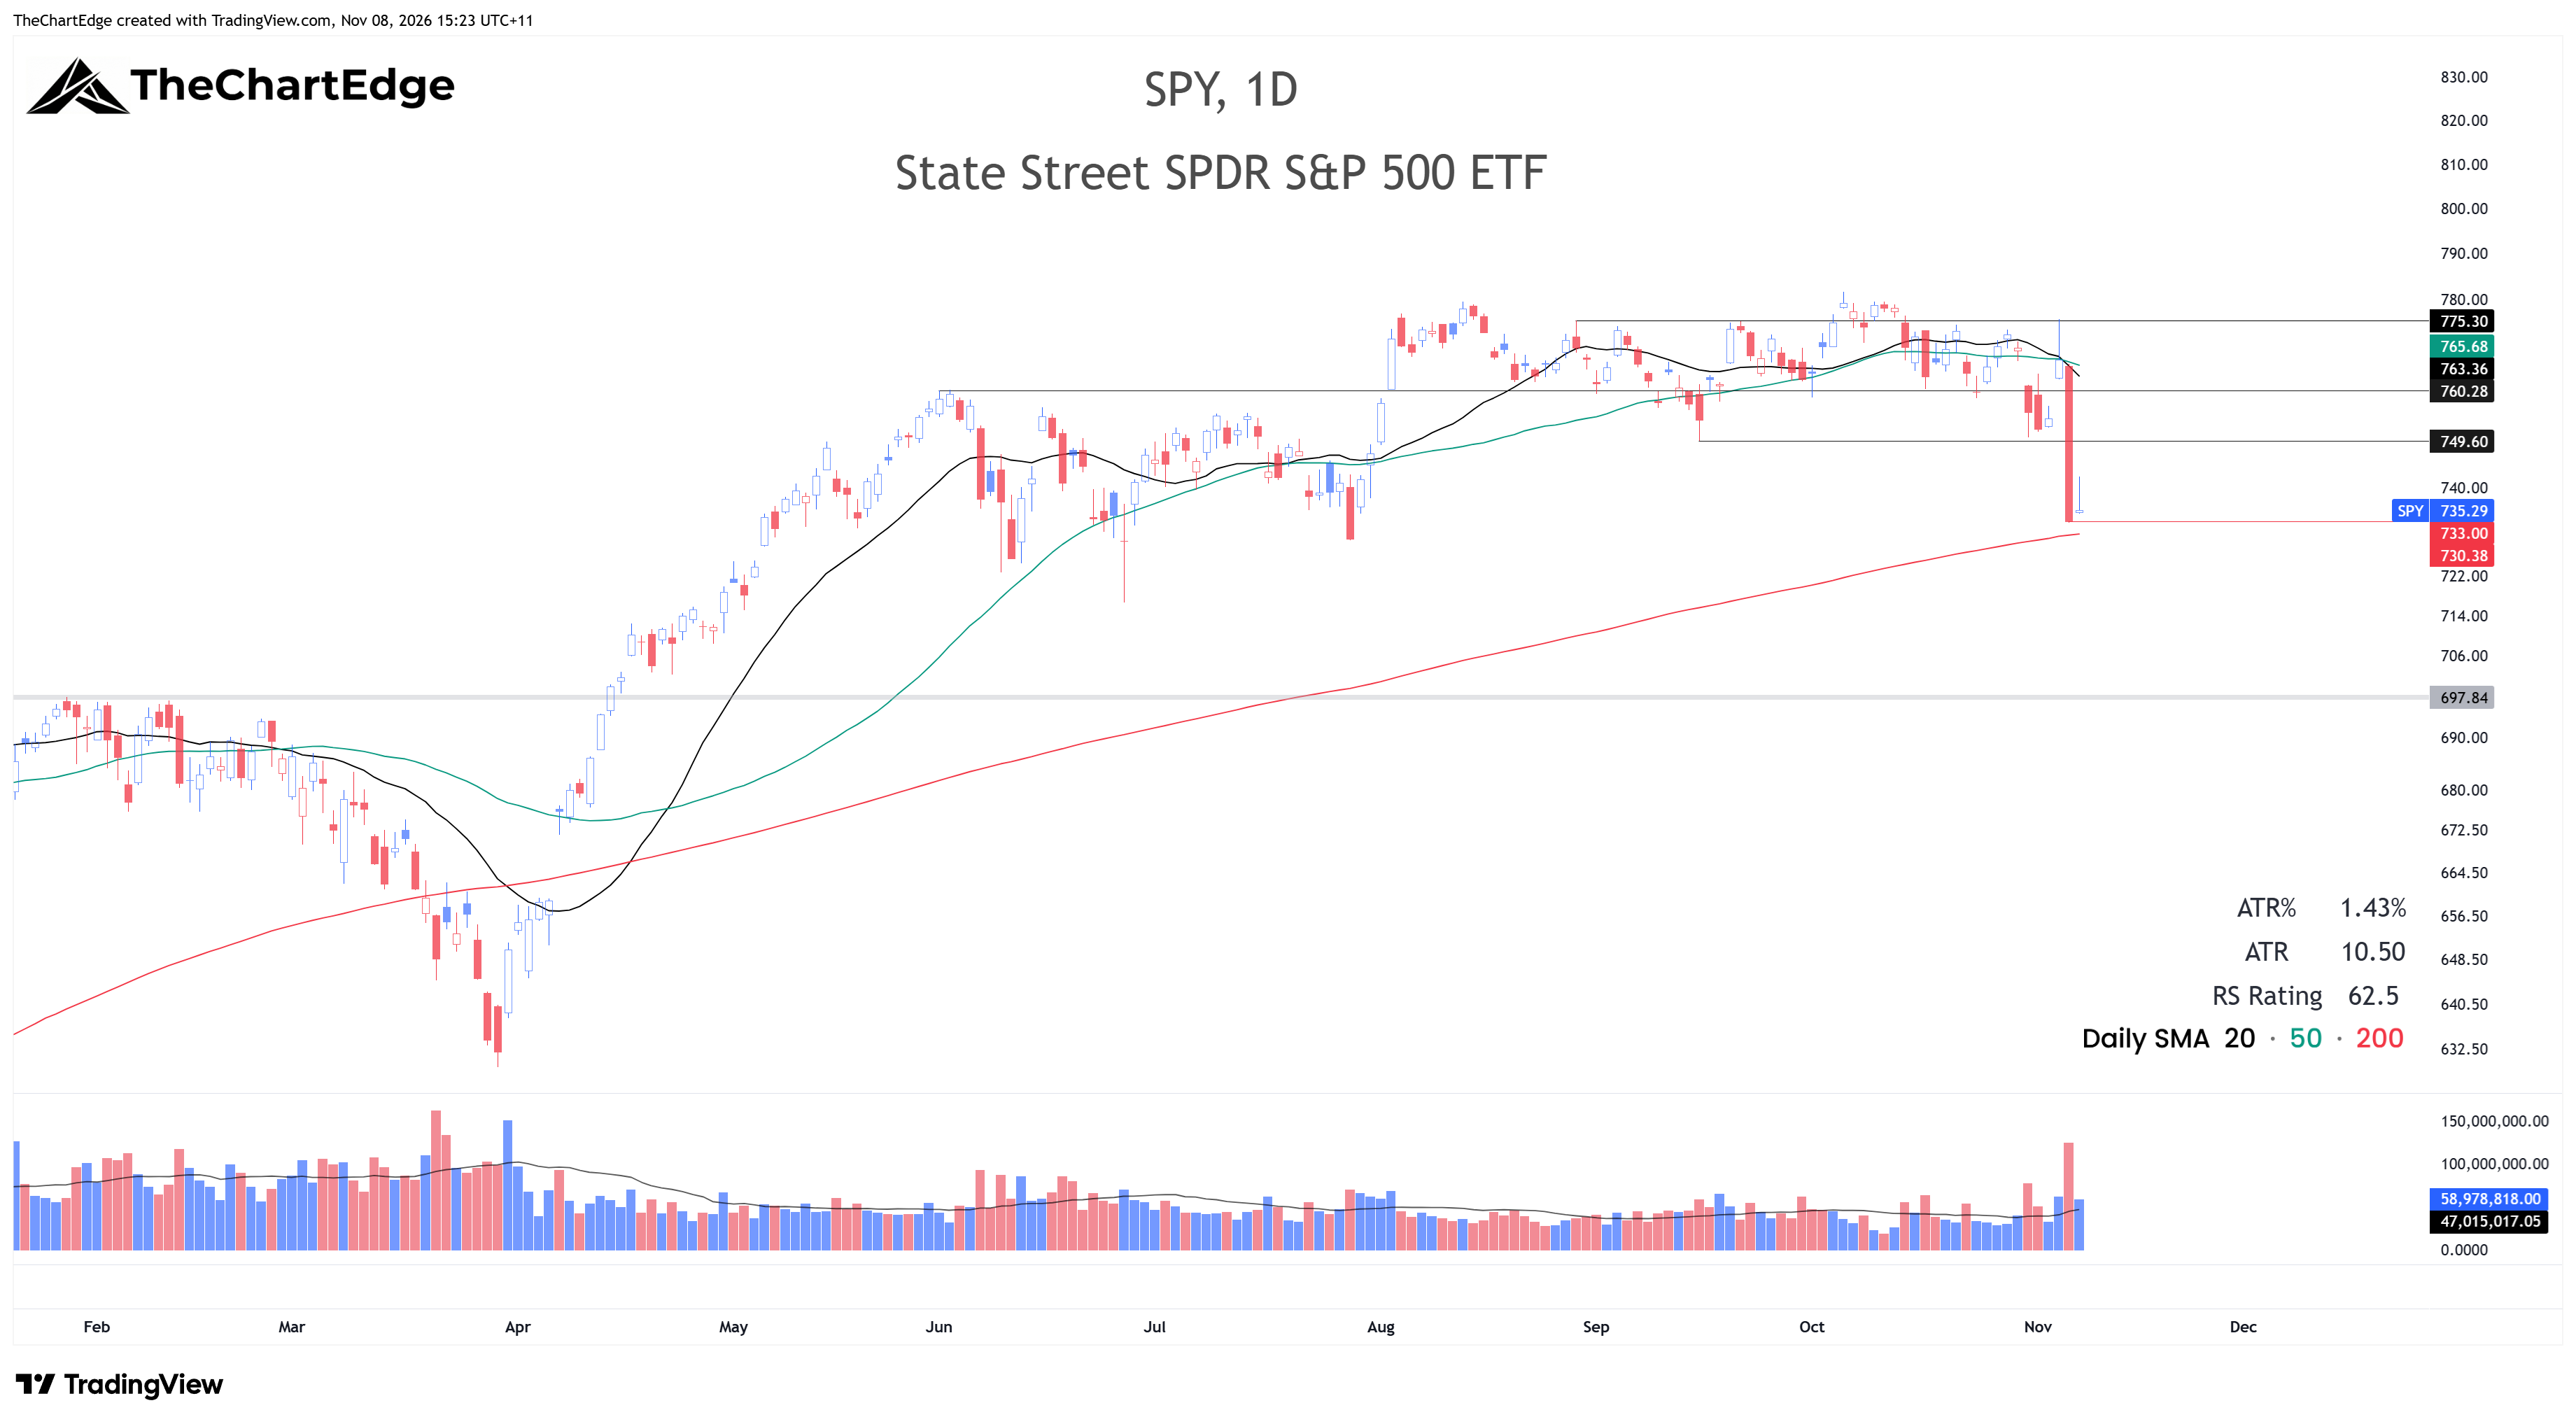
SPY closed at 735.29, still in the Neutral trend state. It gapped up on Wednesday above 760, back into the prior range, closing just below its 20 and 50-day SMAs around 767. Last weekend I mentioned I may consider shorting a bounce to around 765-770, but I went to bed on Thursday evening Melbourne time, with futures pretty much flat, thinking we would stay somewhere in the 760-775 range and wanted to see the day two reaction before putting any trades on. I must admit I was very surprised to see the carnage the next day. Thursday’s big red candle cut straight through the lower end of the range at 760, as well as the September low at 749.60, closing almost on the dead low around 733, just above the 200-day. Friday was a weak bounce that was sold into which isn’t overly promising. If the 200-day doesn’t hold, it’s possible we retest the January and February highs, a little under 700. If we bounce it wouldn’t be surprising to see rallies sold into given the overhead supply. I’ll be watching the 750-760 area and the declining 20-day SMA on the upside.
Nasdaq 100 (QQQ) Chart
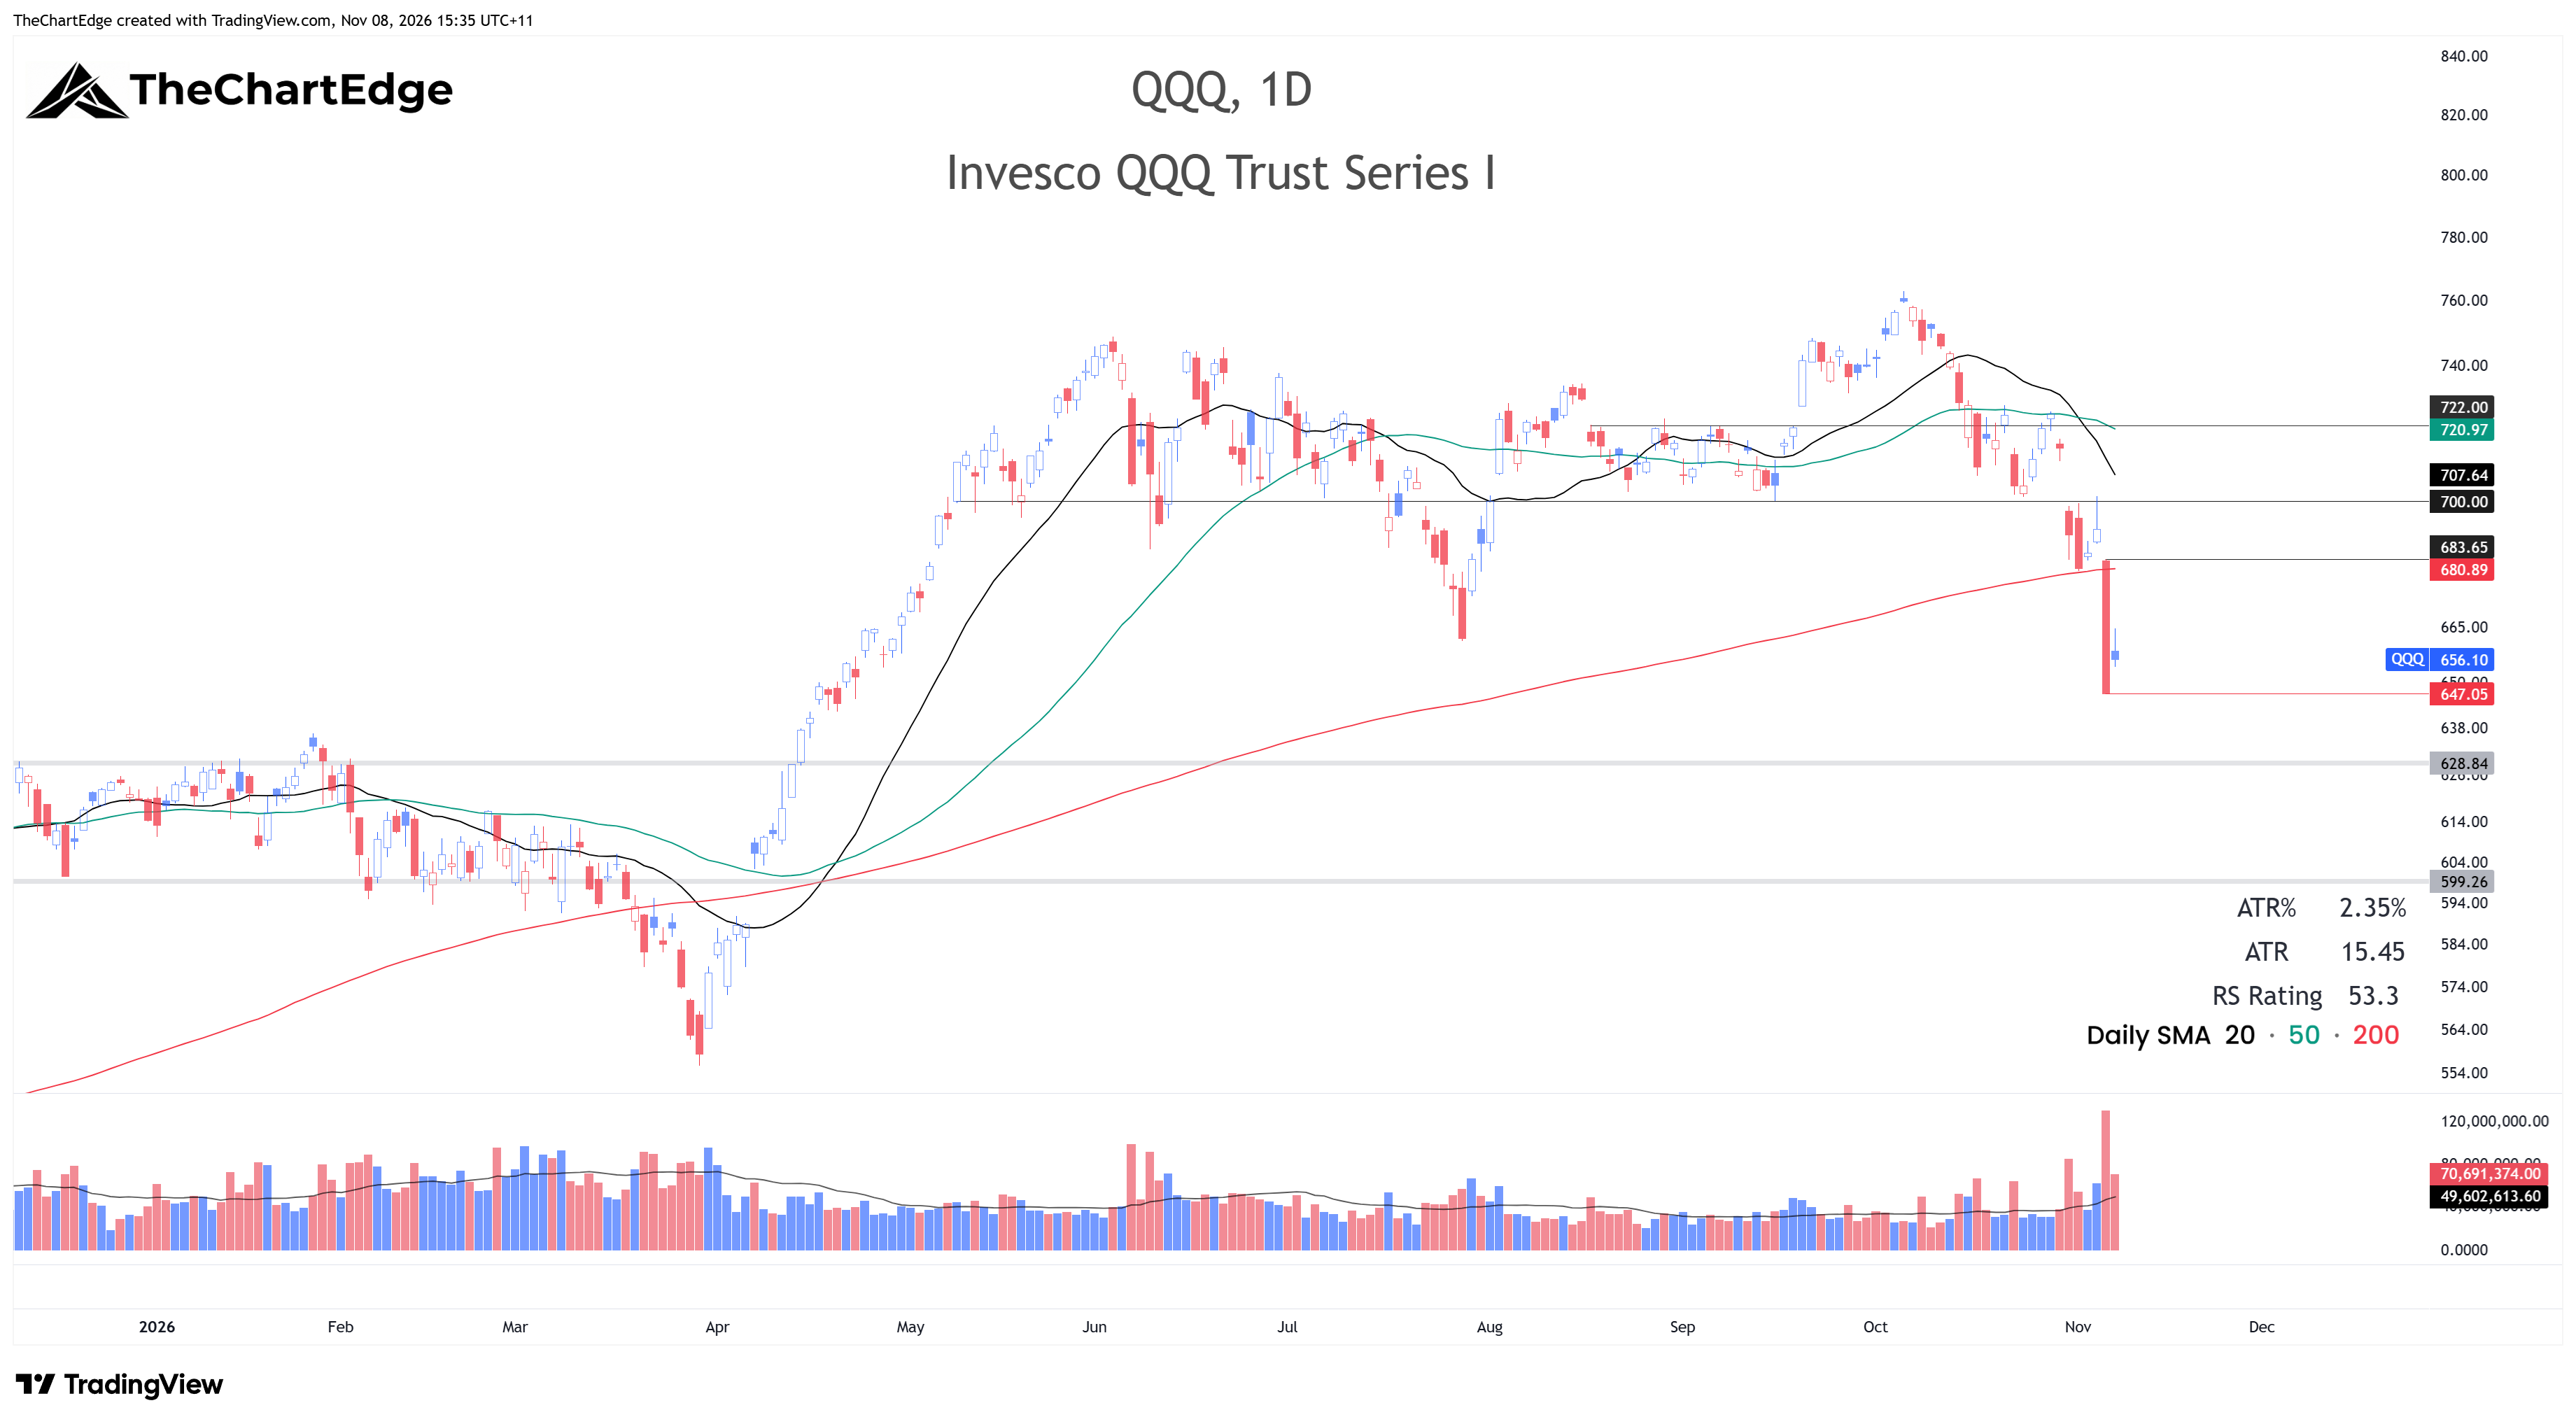
QQQ closed at 656.10, dropping from Neutral to Downtrend. Its rejection around 700 and weak close on Wednesday after a gap up was an indication of potential trouble ahead. But it didn’t look terrible - finishing up on the day and still above its 200-day SMA. Last weekend I said that if the 200-day didn’t hold, we looked set to test the late July low at 661.14, but Thursday’s candle went straight through that on more than double average volume, closing on the low, a hair above 647. Friday’s bounce was pretty modest and was sold into, probing higher but closing below the open. Further downside could see a test of around 629, and on any bounce the first level I’ll be watching is the 200-day SMA, currently around 681.
FANG+ (FNGS) Chart
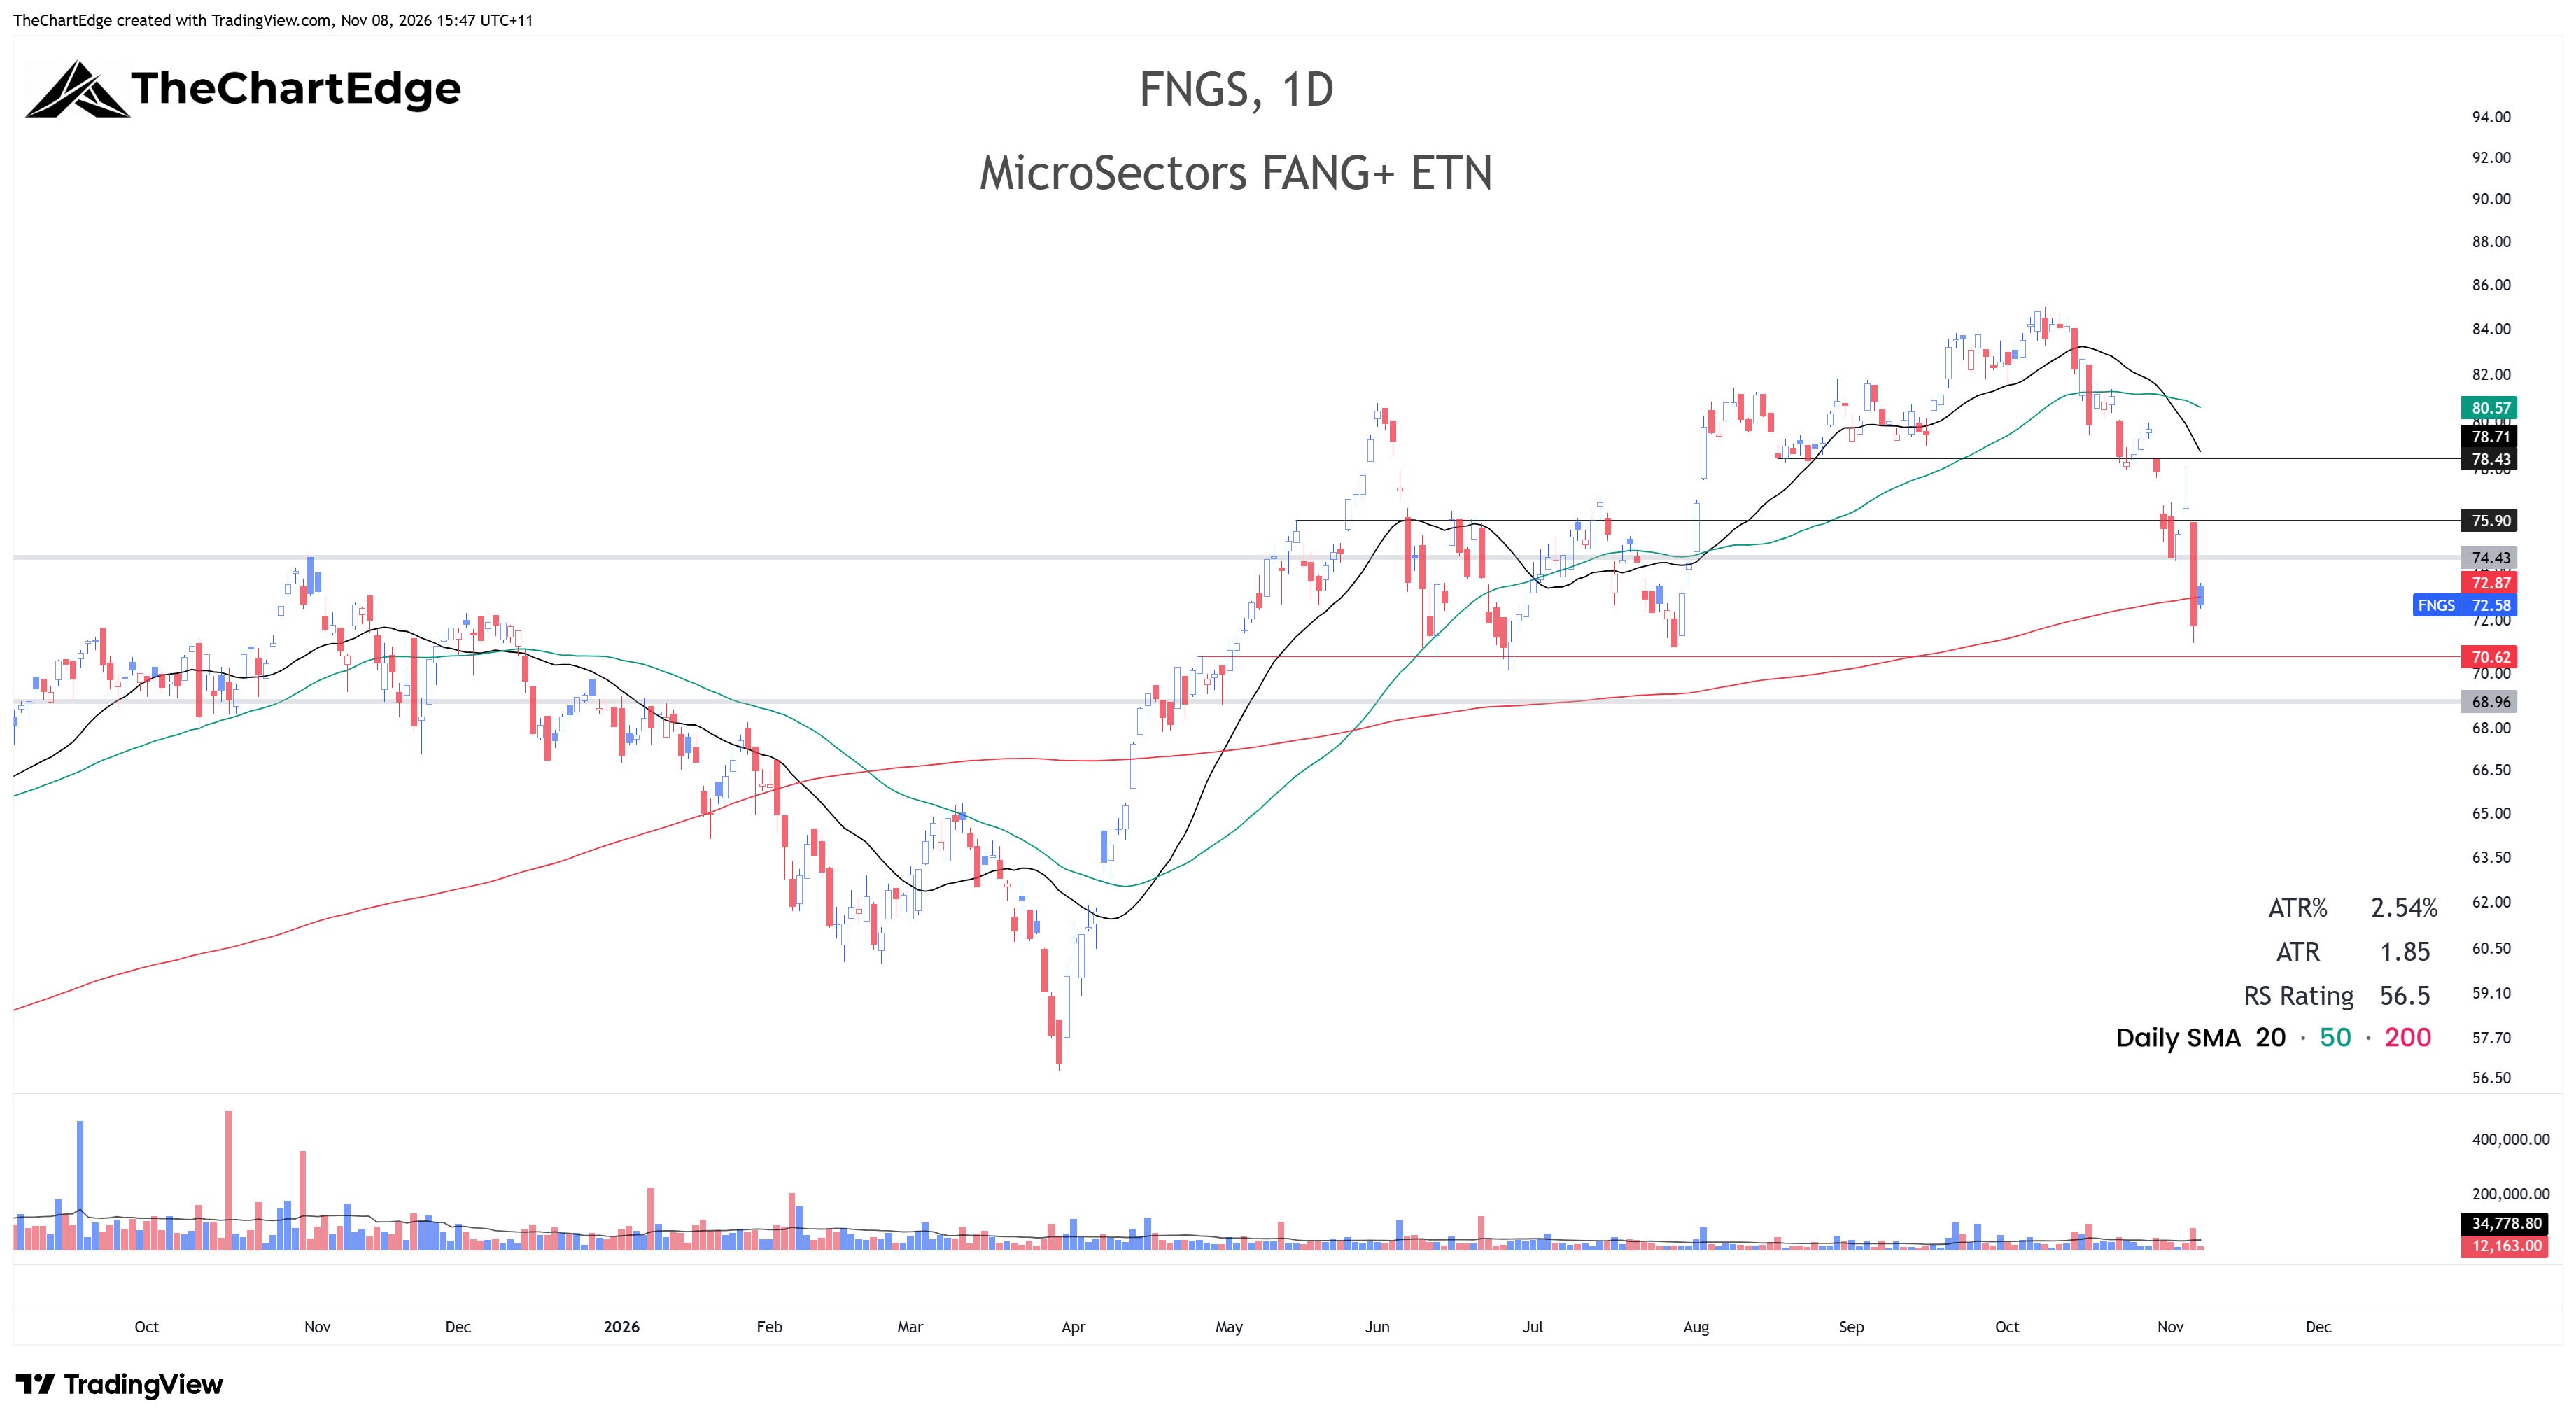
FNGS closed at 72.58, now in a Downtrend, just under its 200-day SMA. It’s a messy chart, but when you look at the 10 individual components you can see why.
S&P 500 Equal Weight (RSP) Chart
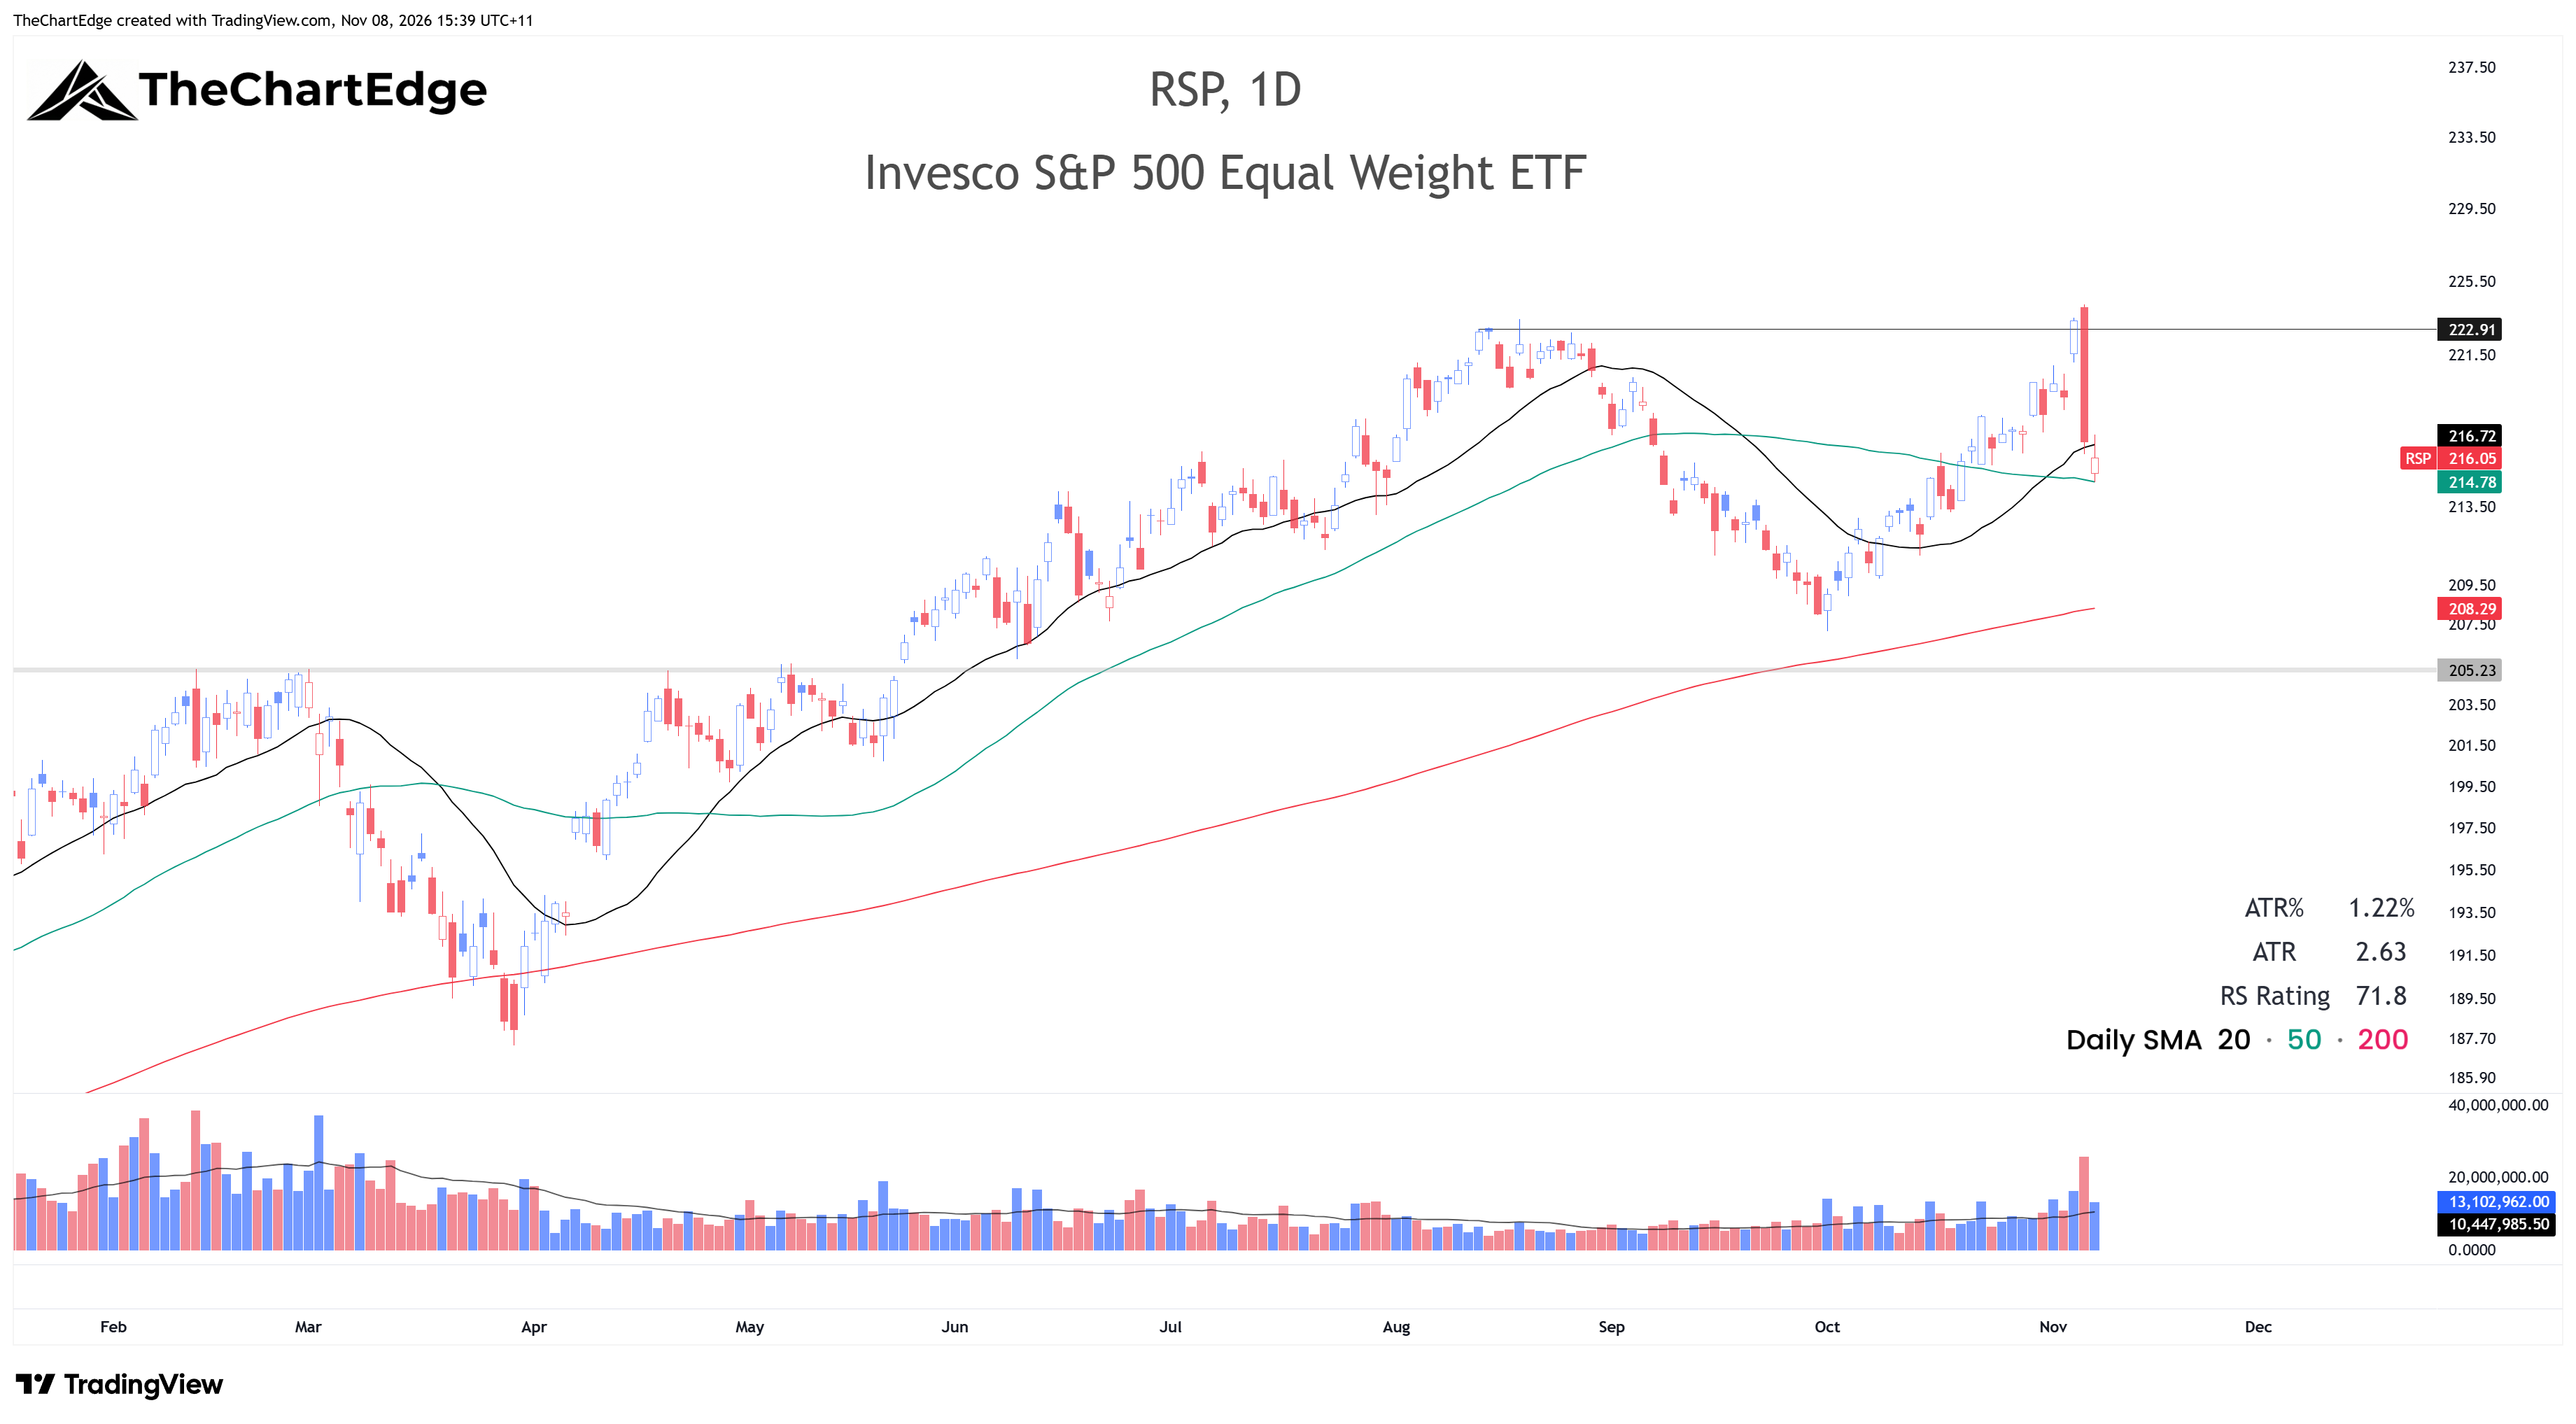
RSP made an all-time closing high on Wednesday and gapped up on Thursday before reversing and falling hard like everything else. Thursday’s close was above the 20-day SMA, but RSP was down again on Friday, closing at 216.05, just below its 20-day but above the 50-day.
Market Temperature
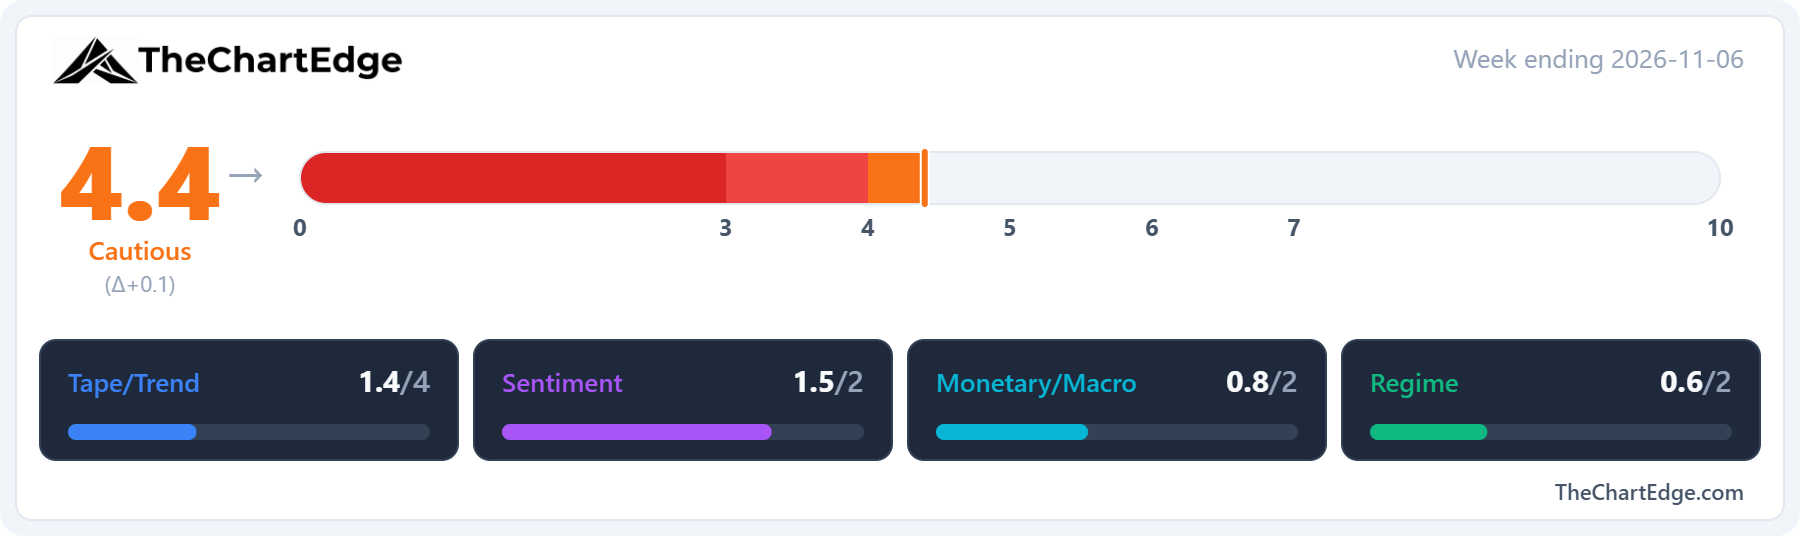
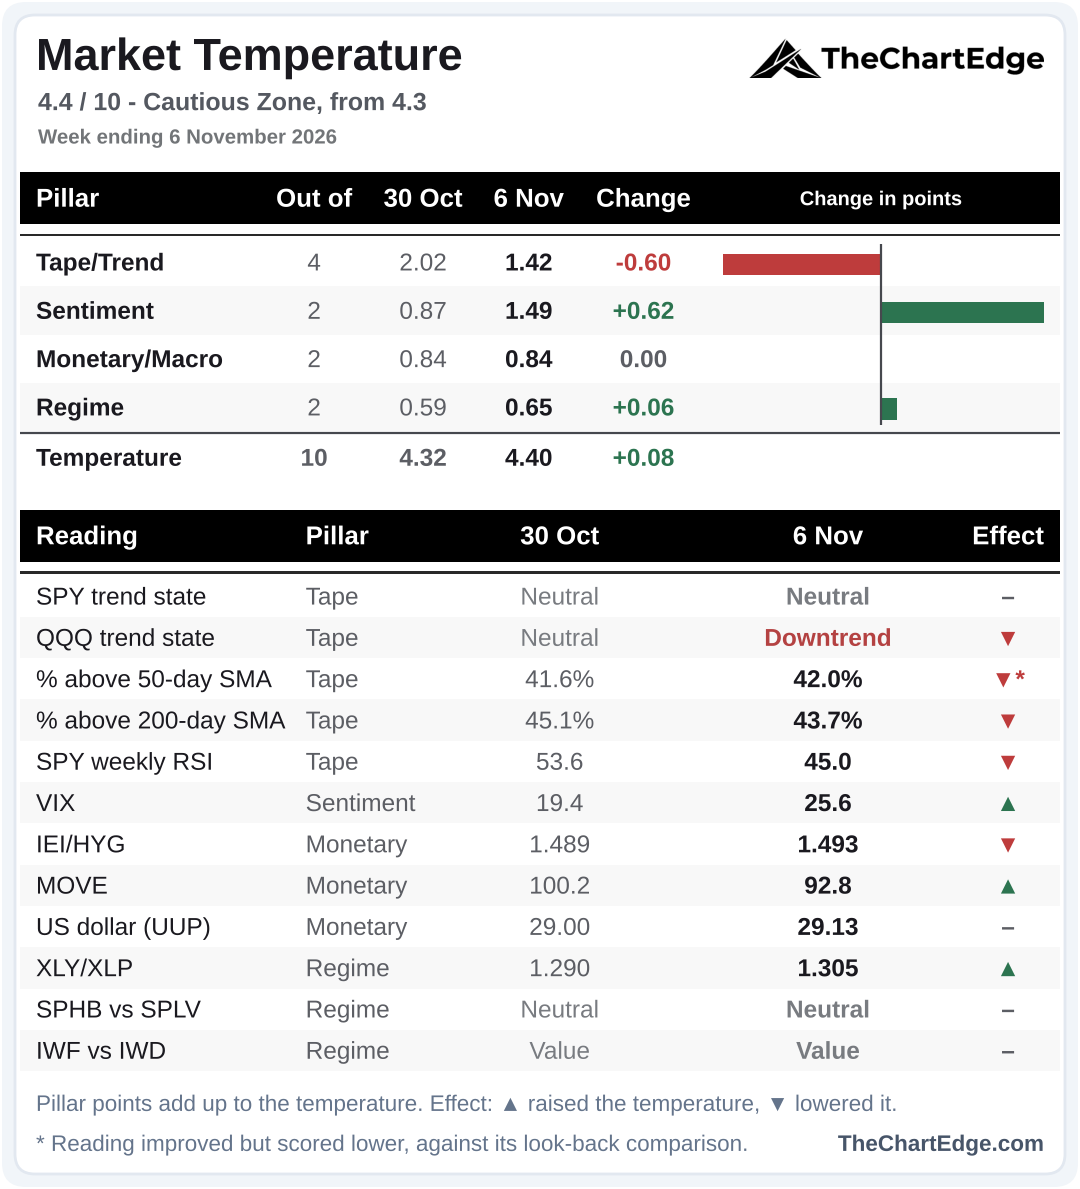
The Market Temperature came in at 4.4, up from 4.3, a 2nd week in the Cautious Zone.
I’ve included a new board this weekend showing the week-on-week change in the four pillars at the top and the pillar components underneath.
The Tape/Trend pillar fell, but was offset by Sentiment, due to the rise in the VIX, which the model reads as a contrarian positive.
GICS Sector Relative Strength
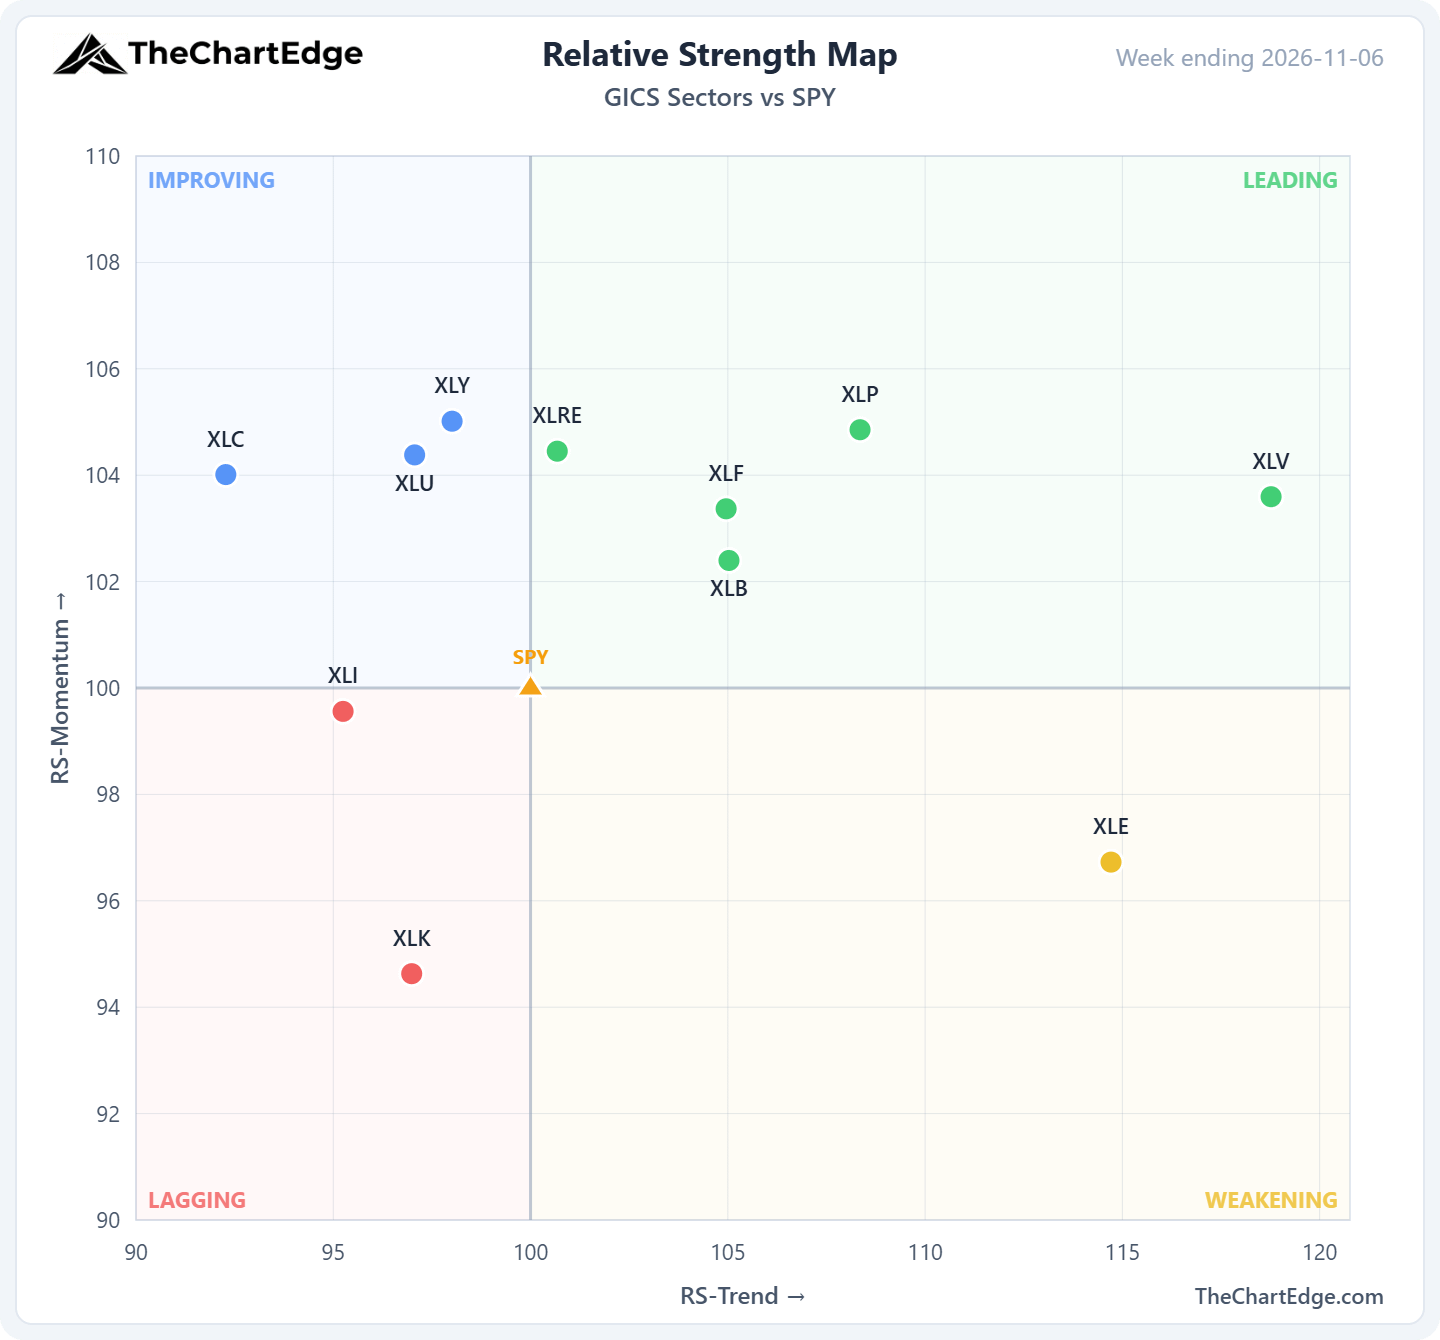
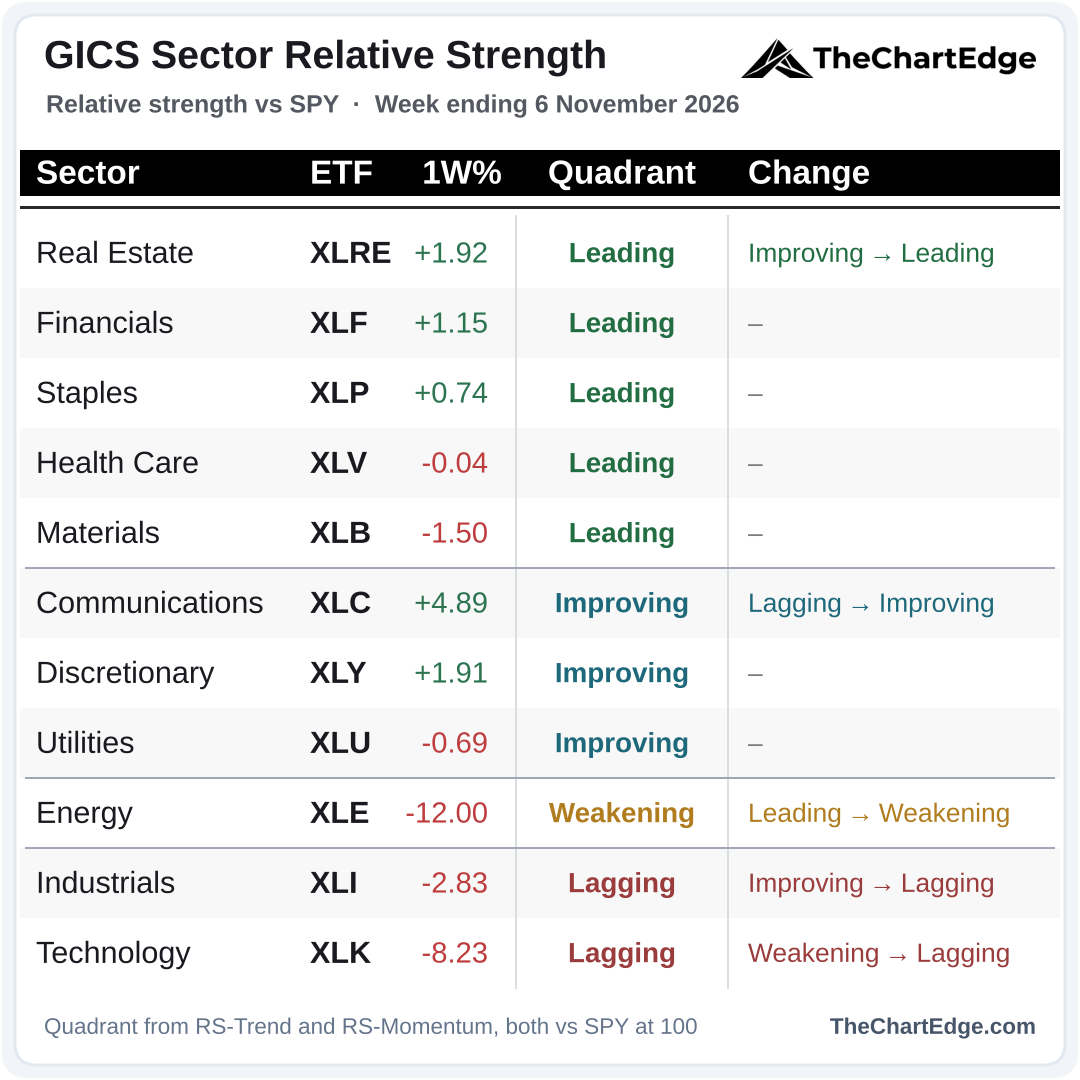
8 of the 11 sectors outperformed SPY - communications, real estate and consumer discretionary led. Technology and energy were hammered and industrials also underperformed SPY. Real estate replaced energy in Leading, with energy dropping into Weakening. Technology and industrials both fell into Lagging, while communications moved up into Improving.
Momentum Leaderboard
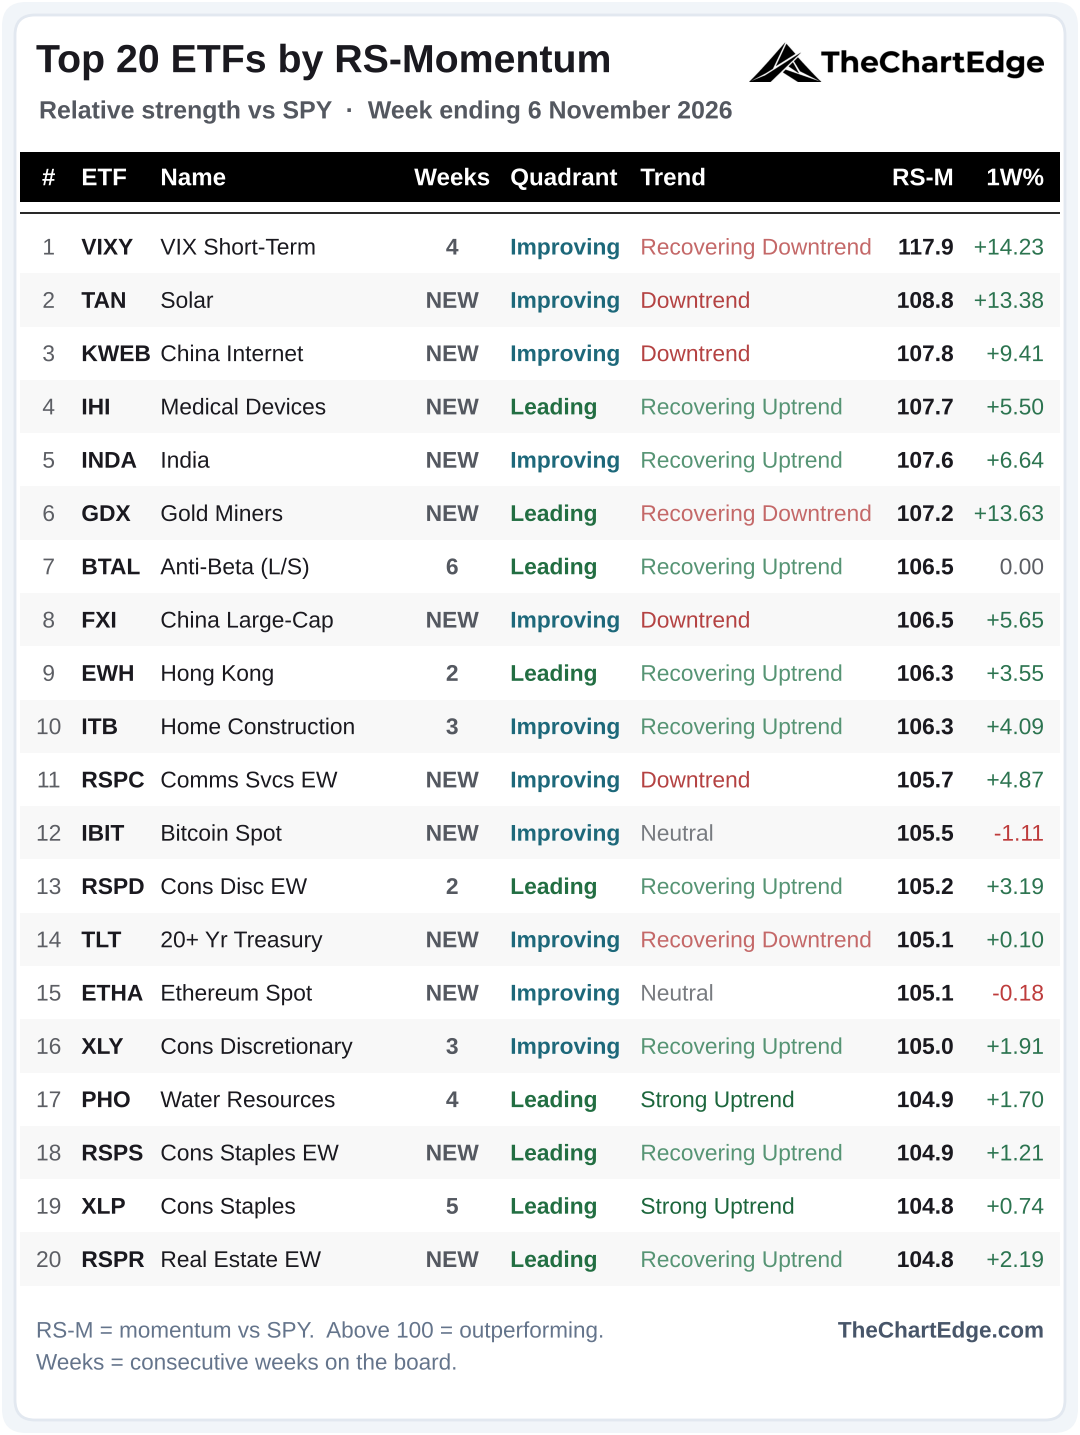
12 of the 20 are new. Energy (XLE), oil & gas E&P (XOP), equal-weight energy (RSPG) and oil services (OIH) all dropped off, along with utilities (XLU, RSPU and UTES), health care (XLV), large-cap biotech (IBB), materials (XLB and RSPM) and homebuilders (XHB).
In their place are solar (TAN) at number 2, China (KWEB and FXI), India (INDA), gold miners (GDX), equal-weight communications (RSPC), equal-weight real estate (RSPR) and 20+ year Treasuries (TLT). Medical devices (IHI), Bitcoin (IBIT), Ethereum (ETHA) and equal-weight staples (RSPS) are back after one week off.
The VIX (VIXY) holds number 1 for a 2nd week, and Anti-Beta (BTAL) now has the longest streak at 6 weeks.
7 of the 20 are in downtrend states, with only 2 in Strong Uptrends and 0 in Uptrend.
Trend States Across the Universe
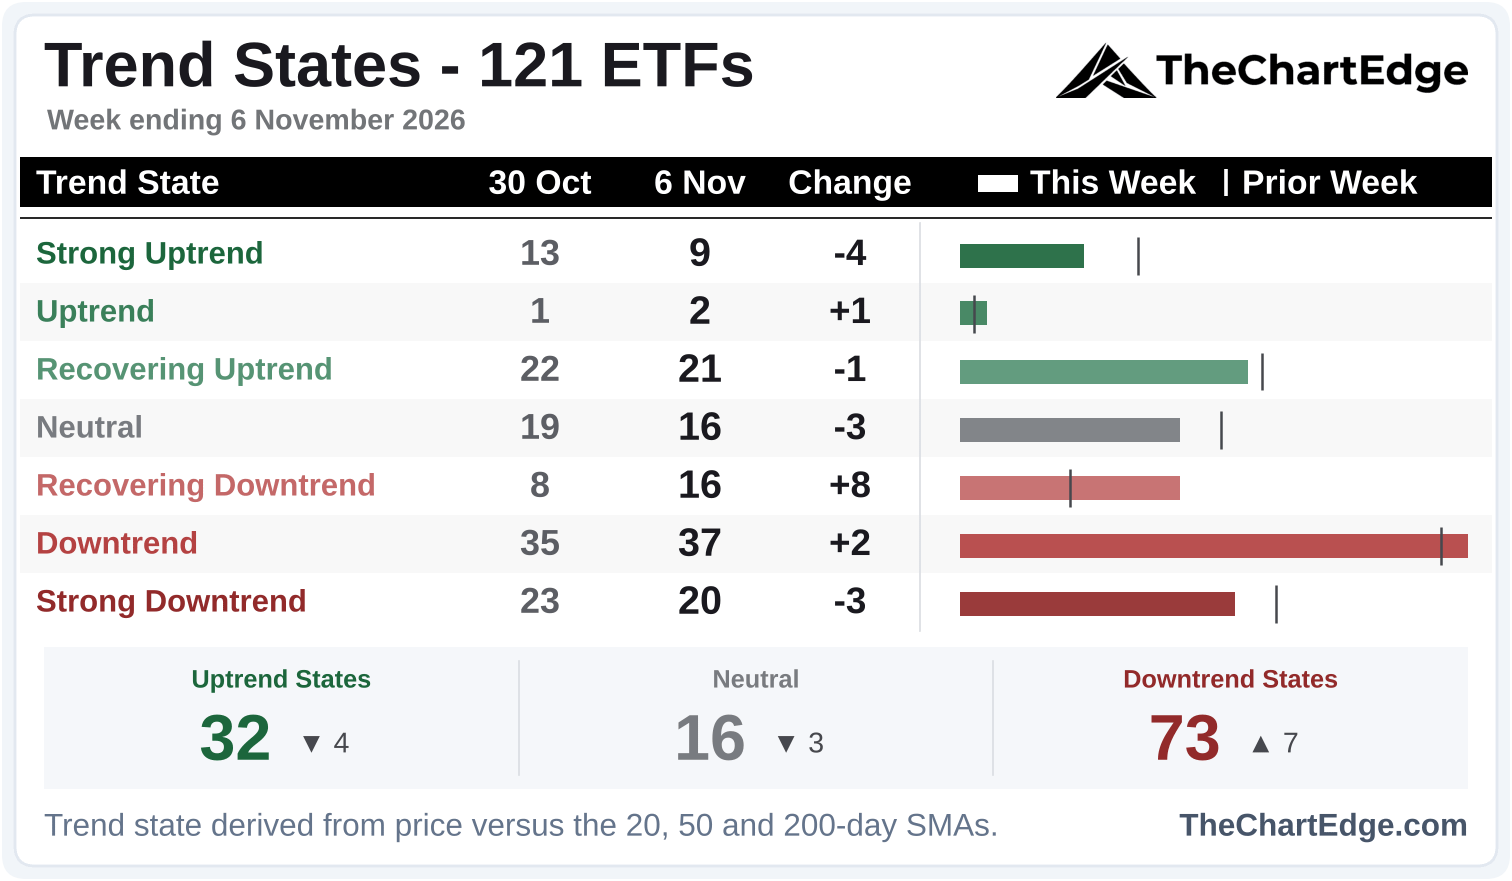
10 ETFs dropped from Neutral into Downtrends, and most of them are tech - QQQ, QQEW, FNGS, technology (XLK and RSPT), semis (SMH), AI (THNQ) and ARK Innovation (ARKK), plus Taiwan (EWT) and Japan (EWJ). Energy fell out of Strong Uptrends too - XLE, XOP, crude (USO) and broad commodities (DBC) dropped to Neutral, and RSPG to a Downtrend.
Financials improved their trend state as their 20-day SMA crossed above the 50-day, despite Thursday’s weakness - XLF, equal-weight financials (RSPF) and insurance (KIE) moved up into Strong Uptrends.
Small caps (IWM) and mid-caps (MDY) slipped back into Recovering Downtrends, a week after moving up into Recovering Uptrends.
Industry Breadth - Leading Stocks
I’ve left this board out again. QQQ’s 12-month return fell to 5.5% from 9.2%, and is now below SPY’s 8.7%, so outperforming QQQ doesn’t say much about leadership anymore.
Semis & AI Hit Hard
Thursday’s sell-off was led by semis and AI.
Semiconductors (SMH) Chart
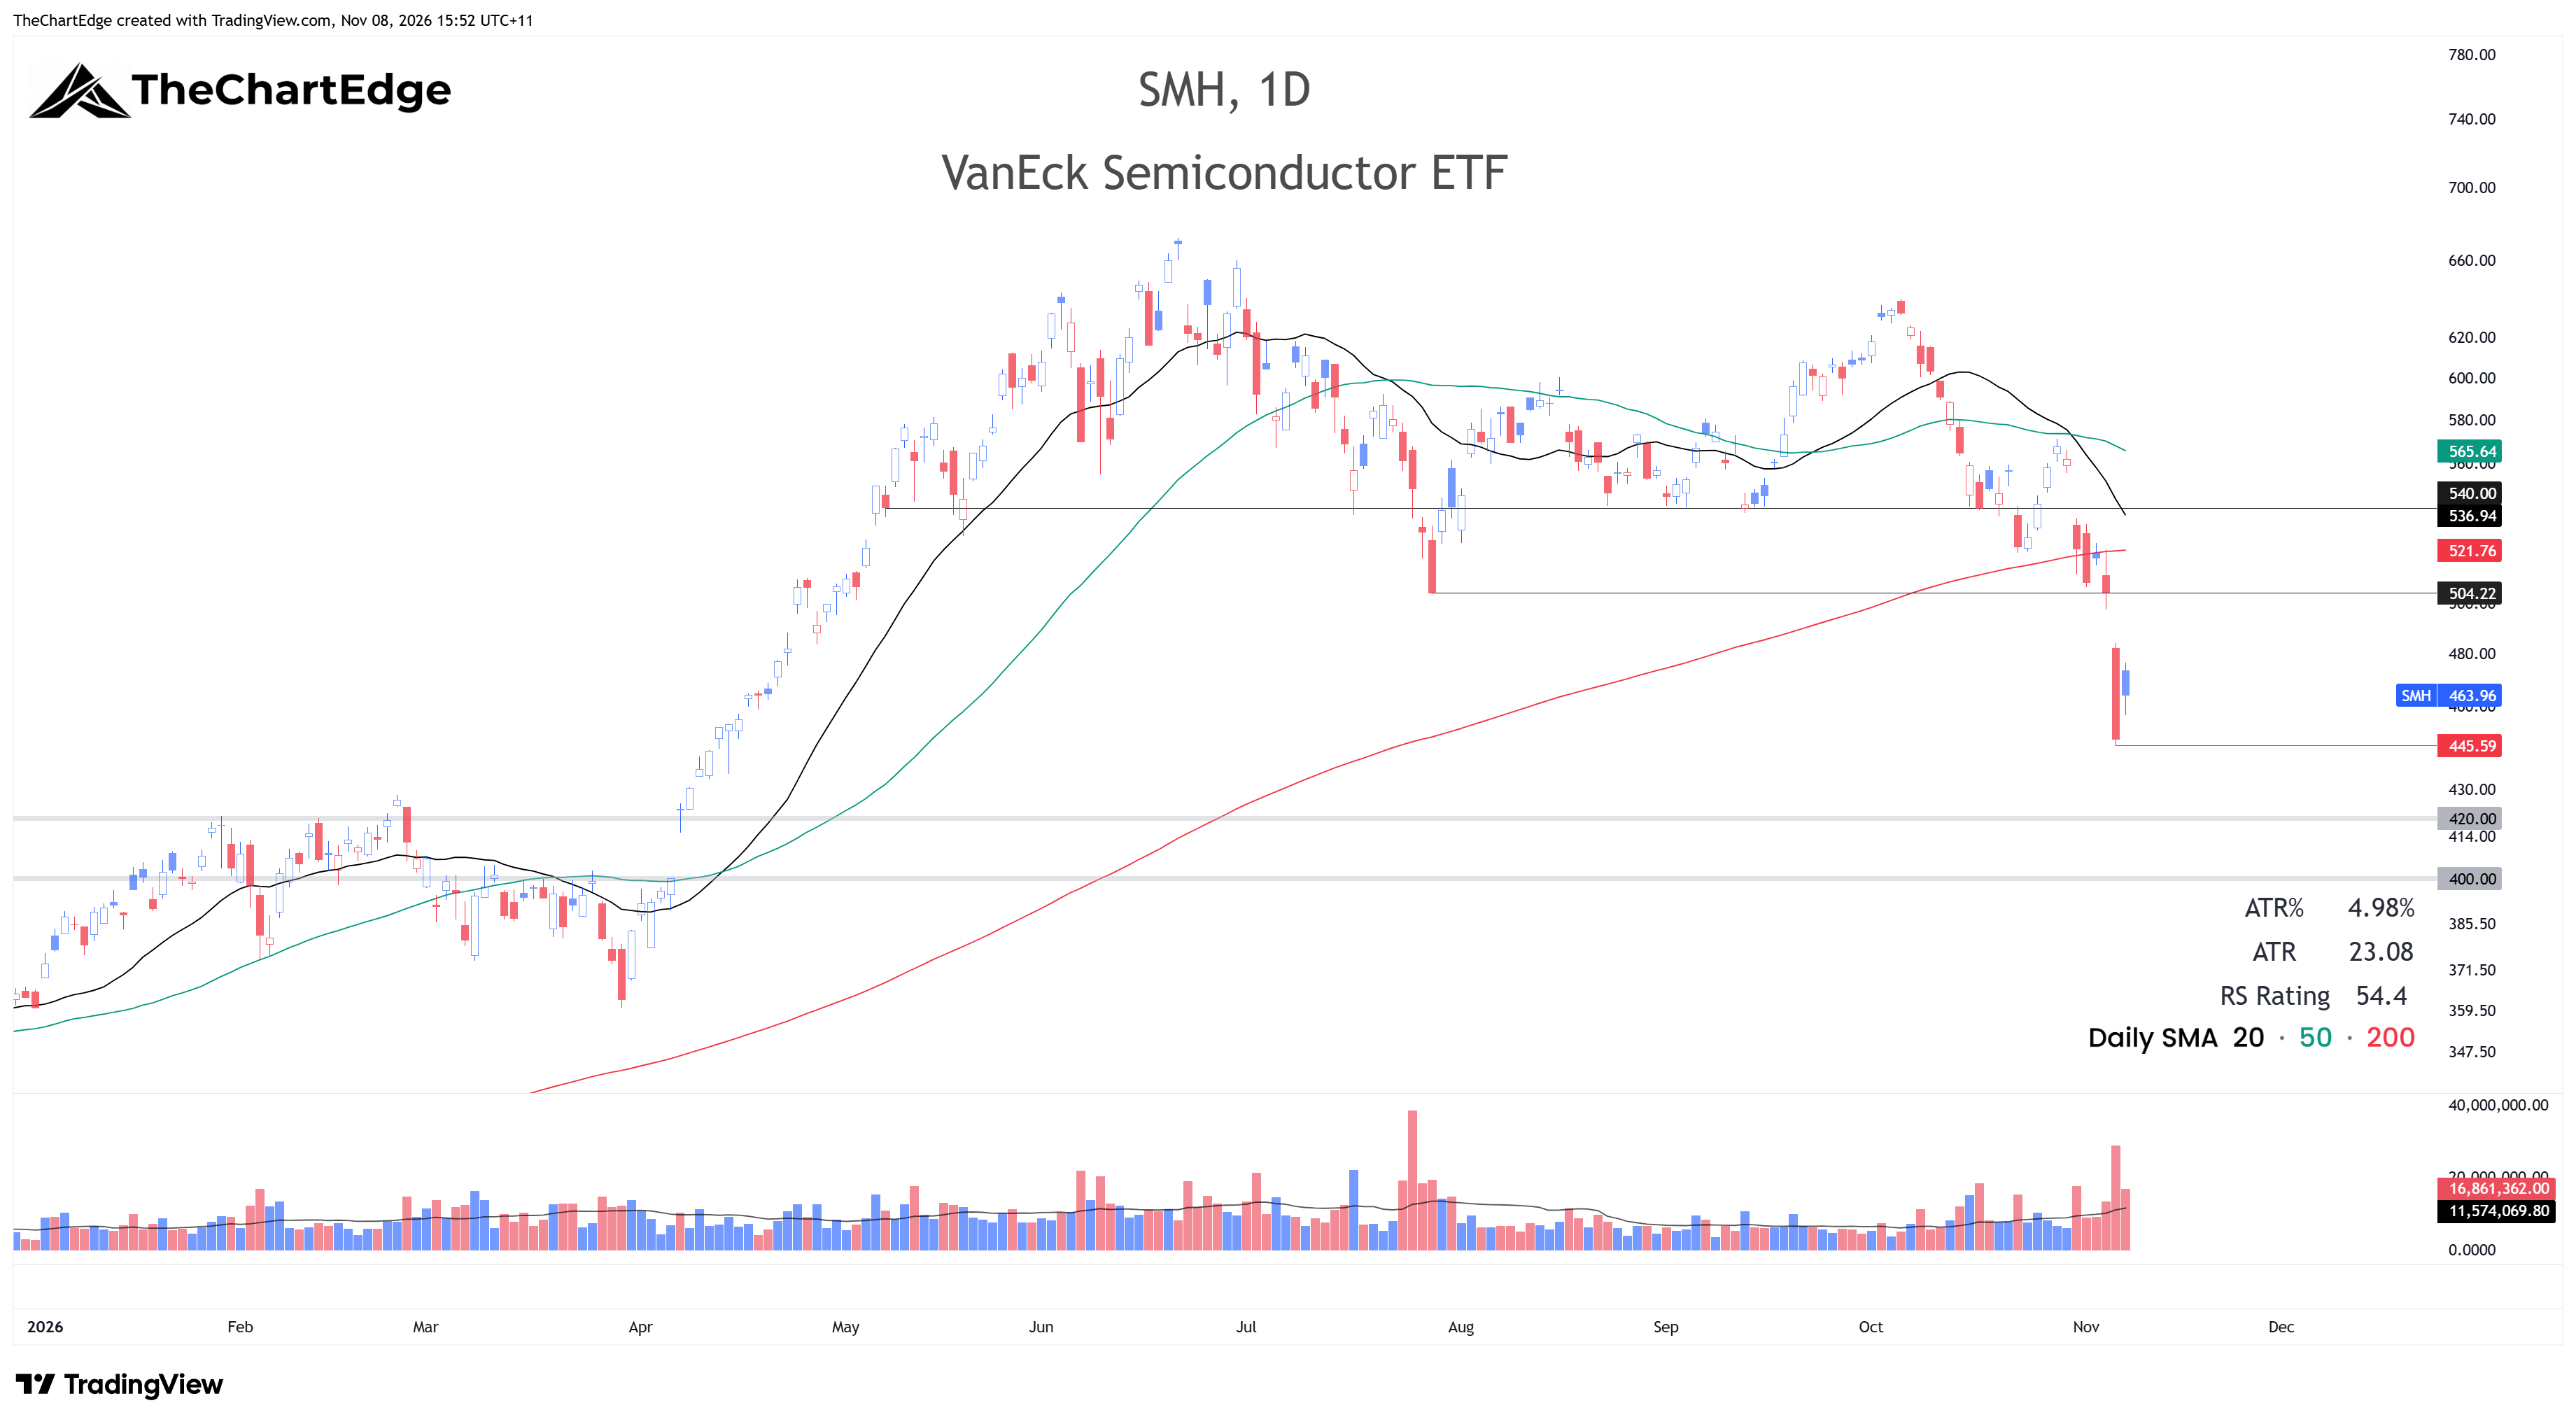
SMH was weak out of the gate, losing its 200-day SMA on Monday and was then turned away from it again on Wednesday’s failed rally attempt. It gapped down on Thursday and continued lower all day, falling over 11%. A couple of weeks ago I said that if it sliced through the 200-day and the July low there isn’t much structure on the left-hand side of the chart between 420 and 500, nor much volume, as SMH ripped higher through this area during April and early May. I didn’t expect it to move as violently as it did, however. I’m watching 420 on the downside and around 504 above.
Energy Sell-Off
5 of the 6 worst performers of the 121 ETFs I track were energy - XOP, OIH, RSPG, crude (USO) and XLE.
Crude Oil Spot (USOIL) Chart
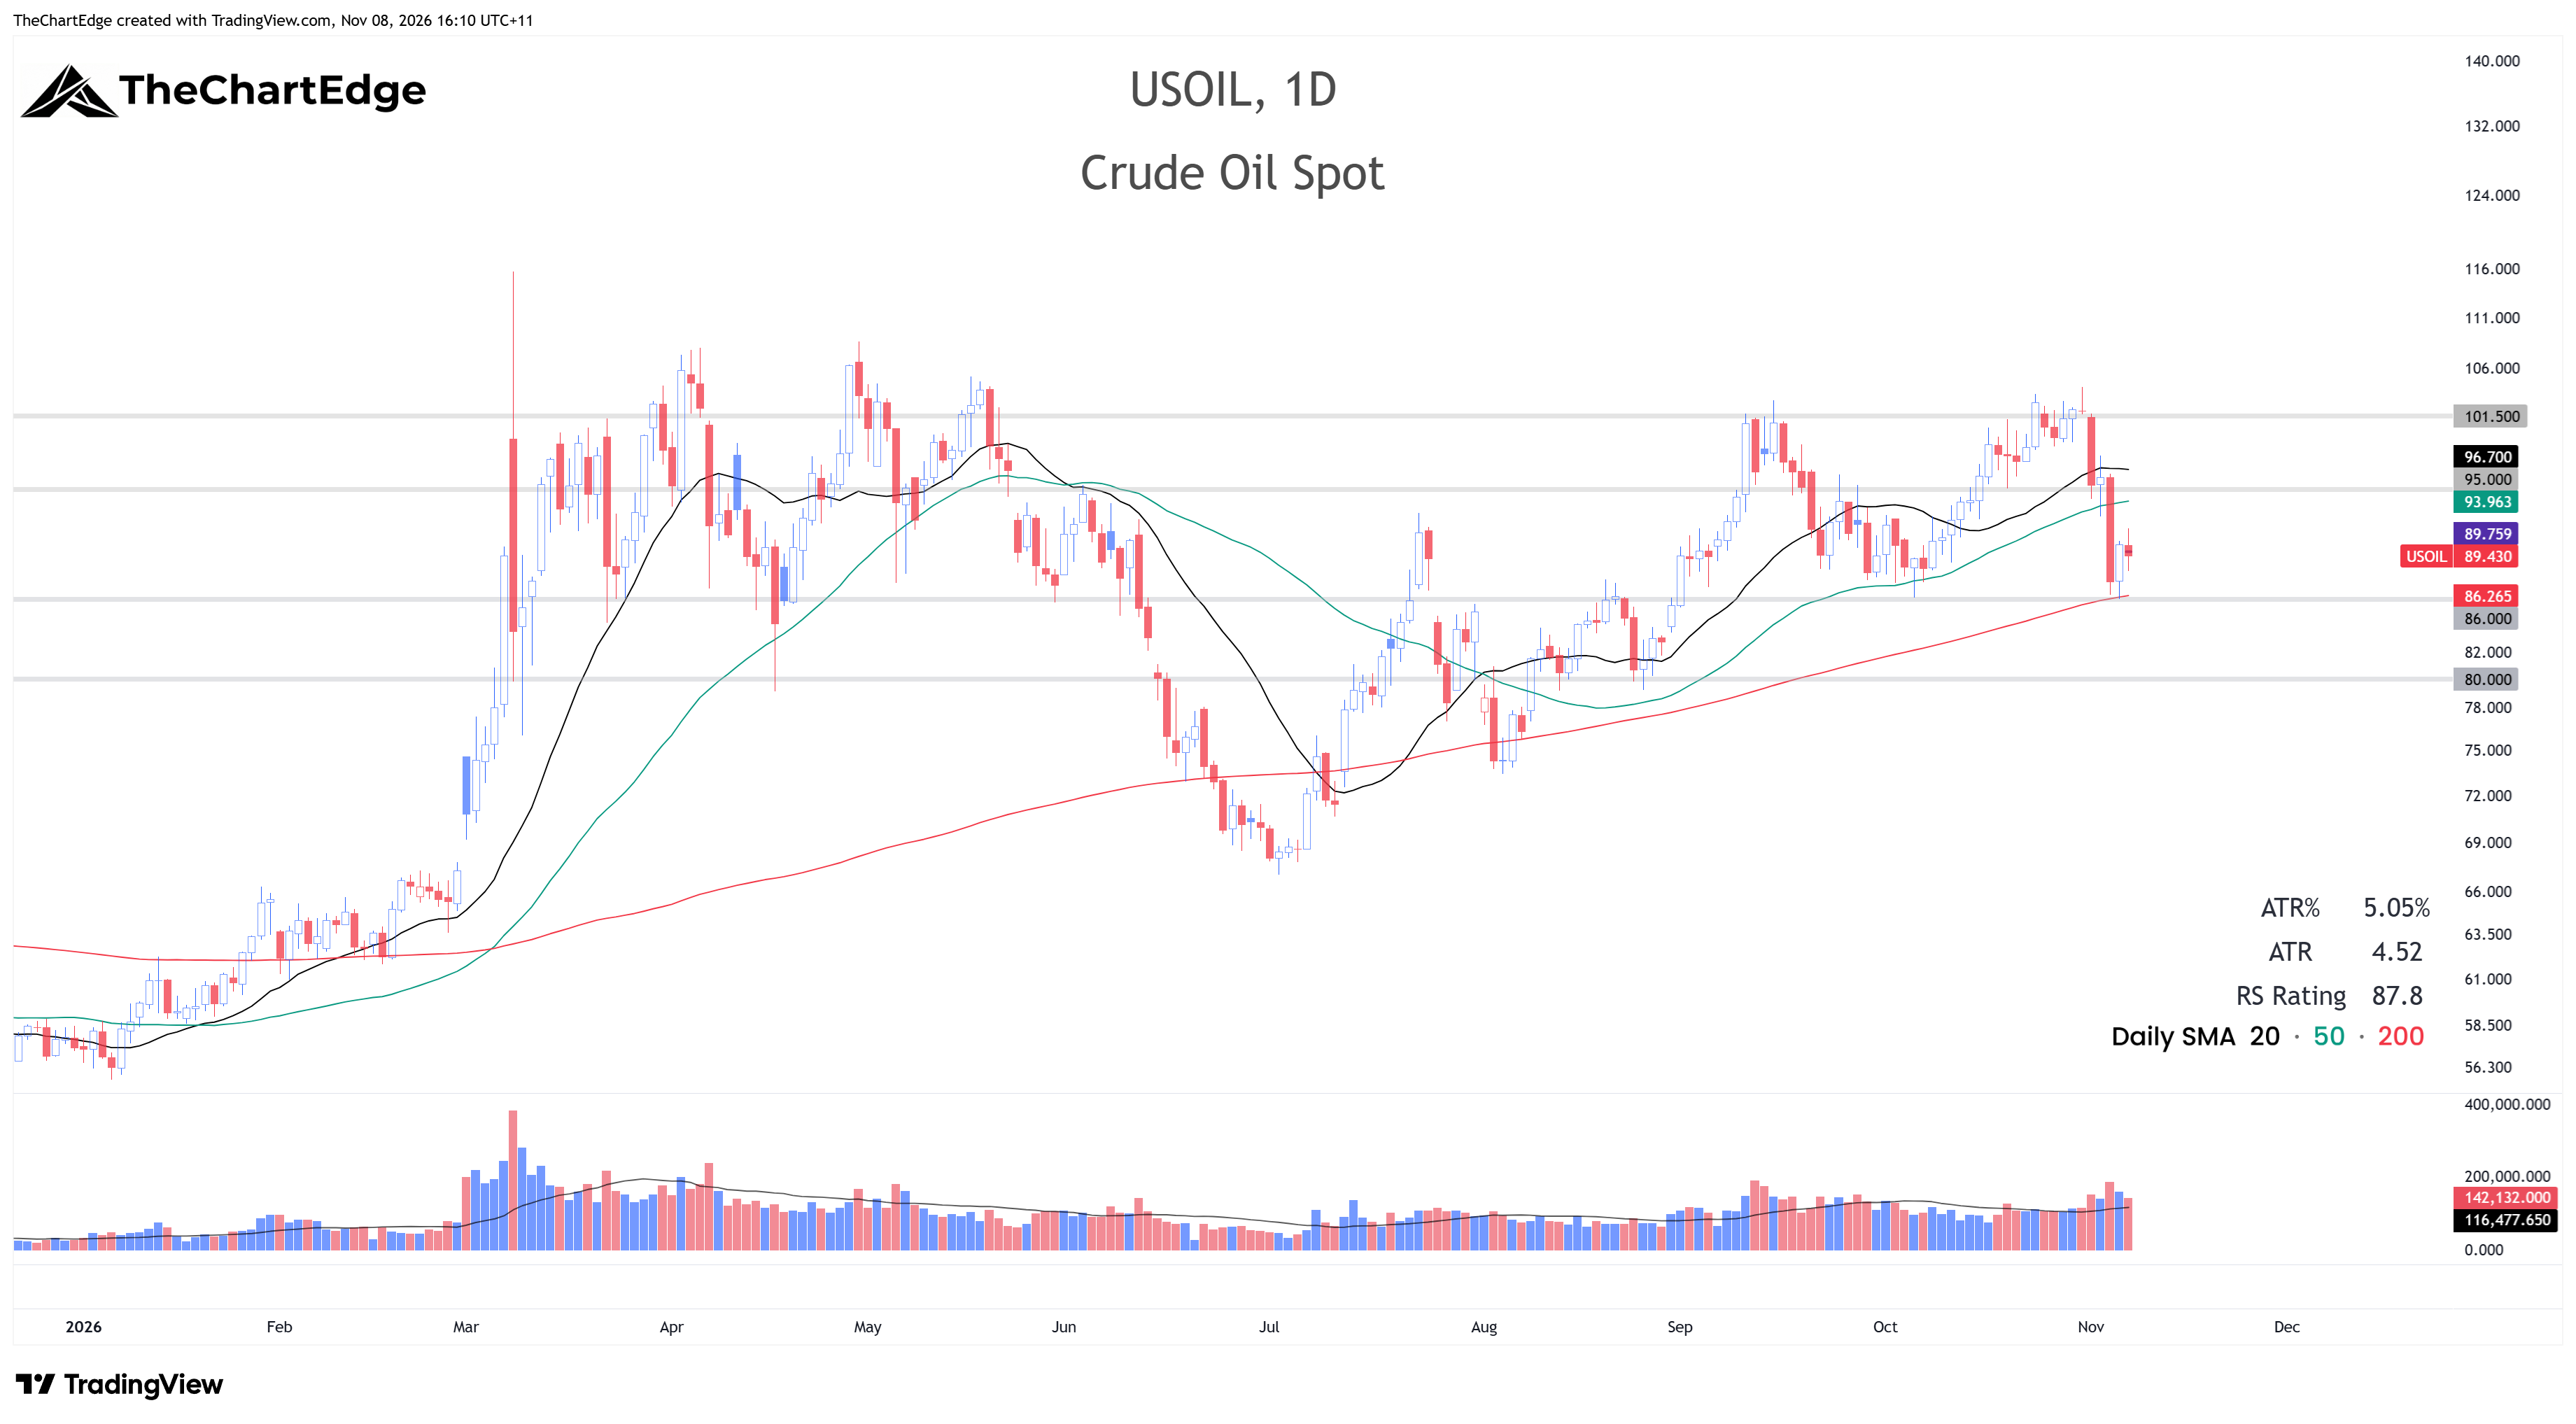
Crude got hammered on Monday and Wednesday, testing the 200-day SMA around 86, before bouncing to close the week at 89.43. If we break below 86, it would likely be on news of some negotiated breakthrough to cease hostilities and should be a strong positive for the stock market. On the other hand, any serious escalation would likely see oil testing the recent highs above 100, and potentially going significantly higher, which would likely mean another big leg down for stocks.
Trades & Follow-Ups
Everything on my watchlist (other than IBB) failed to play out in a way I was looking for to potentially take new positions. Genomics (ARKG), GitLab (GTLB), Analog Devices (ADI) and Texas Instruments (TXN) all closed below their 50-day SMAs.
Large-Cap Biotech (IBB) Chart
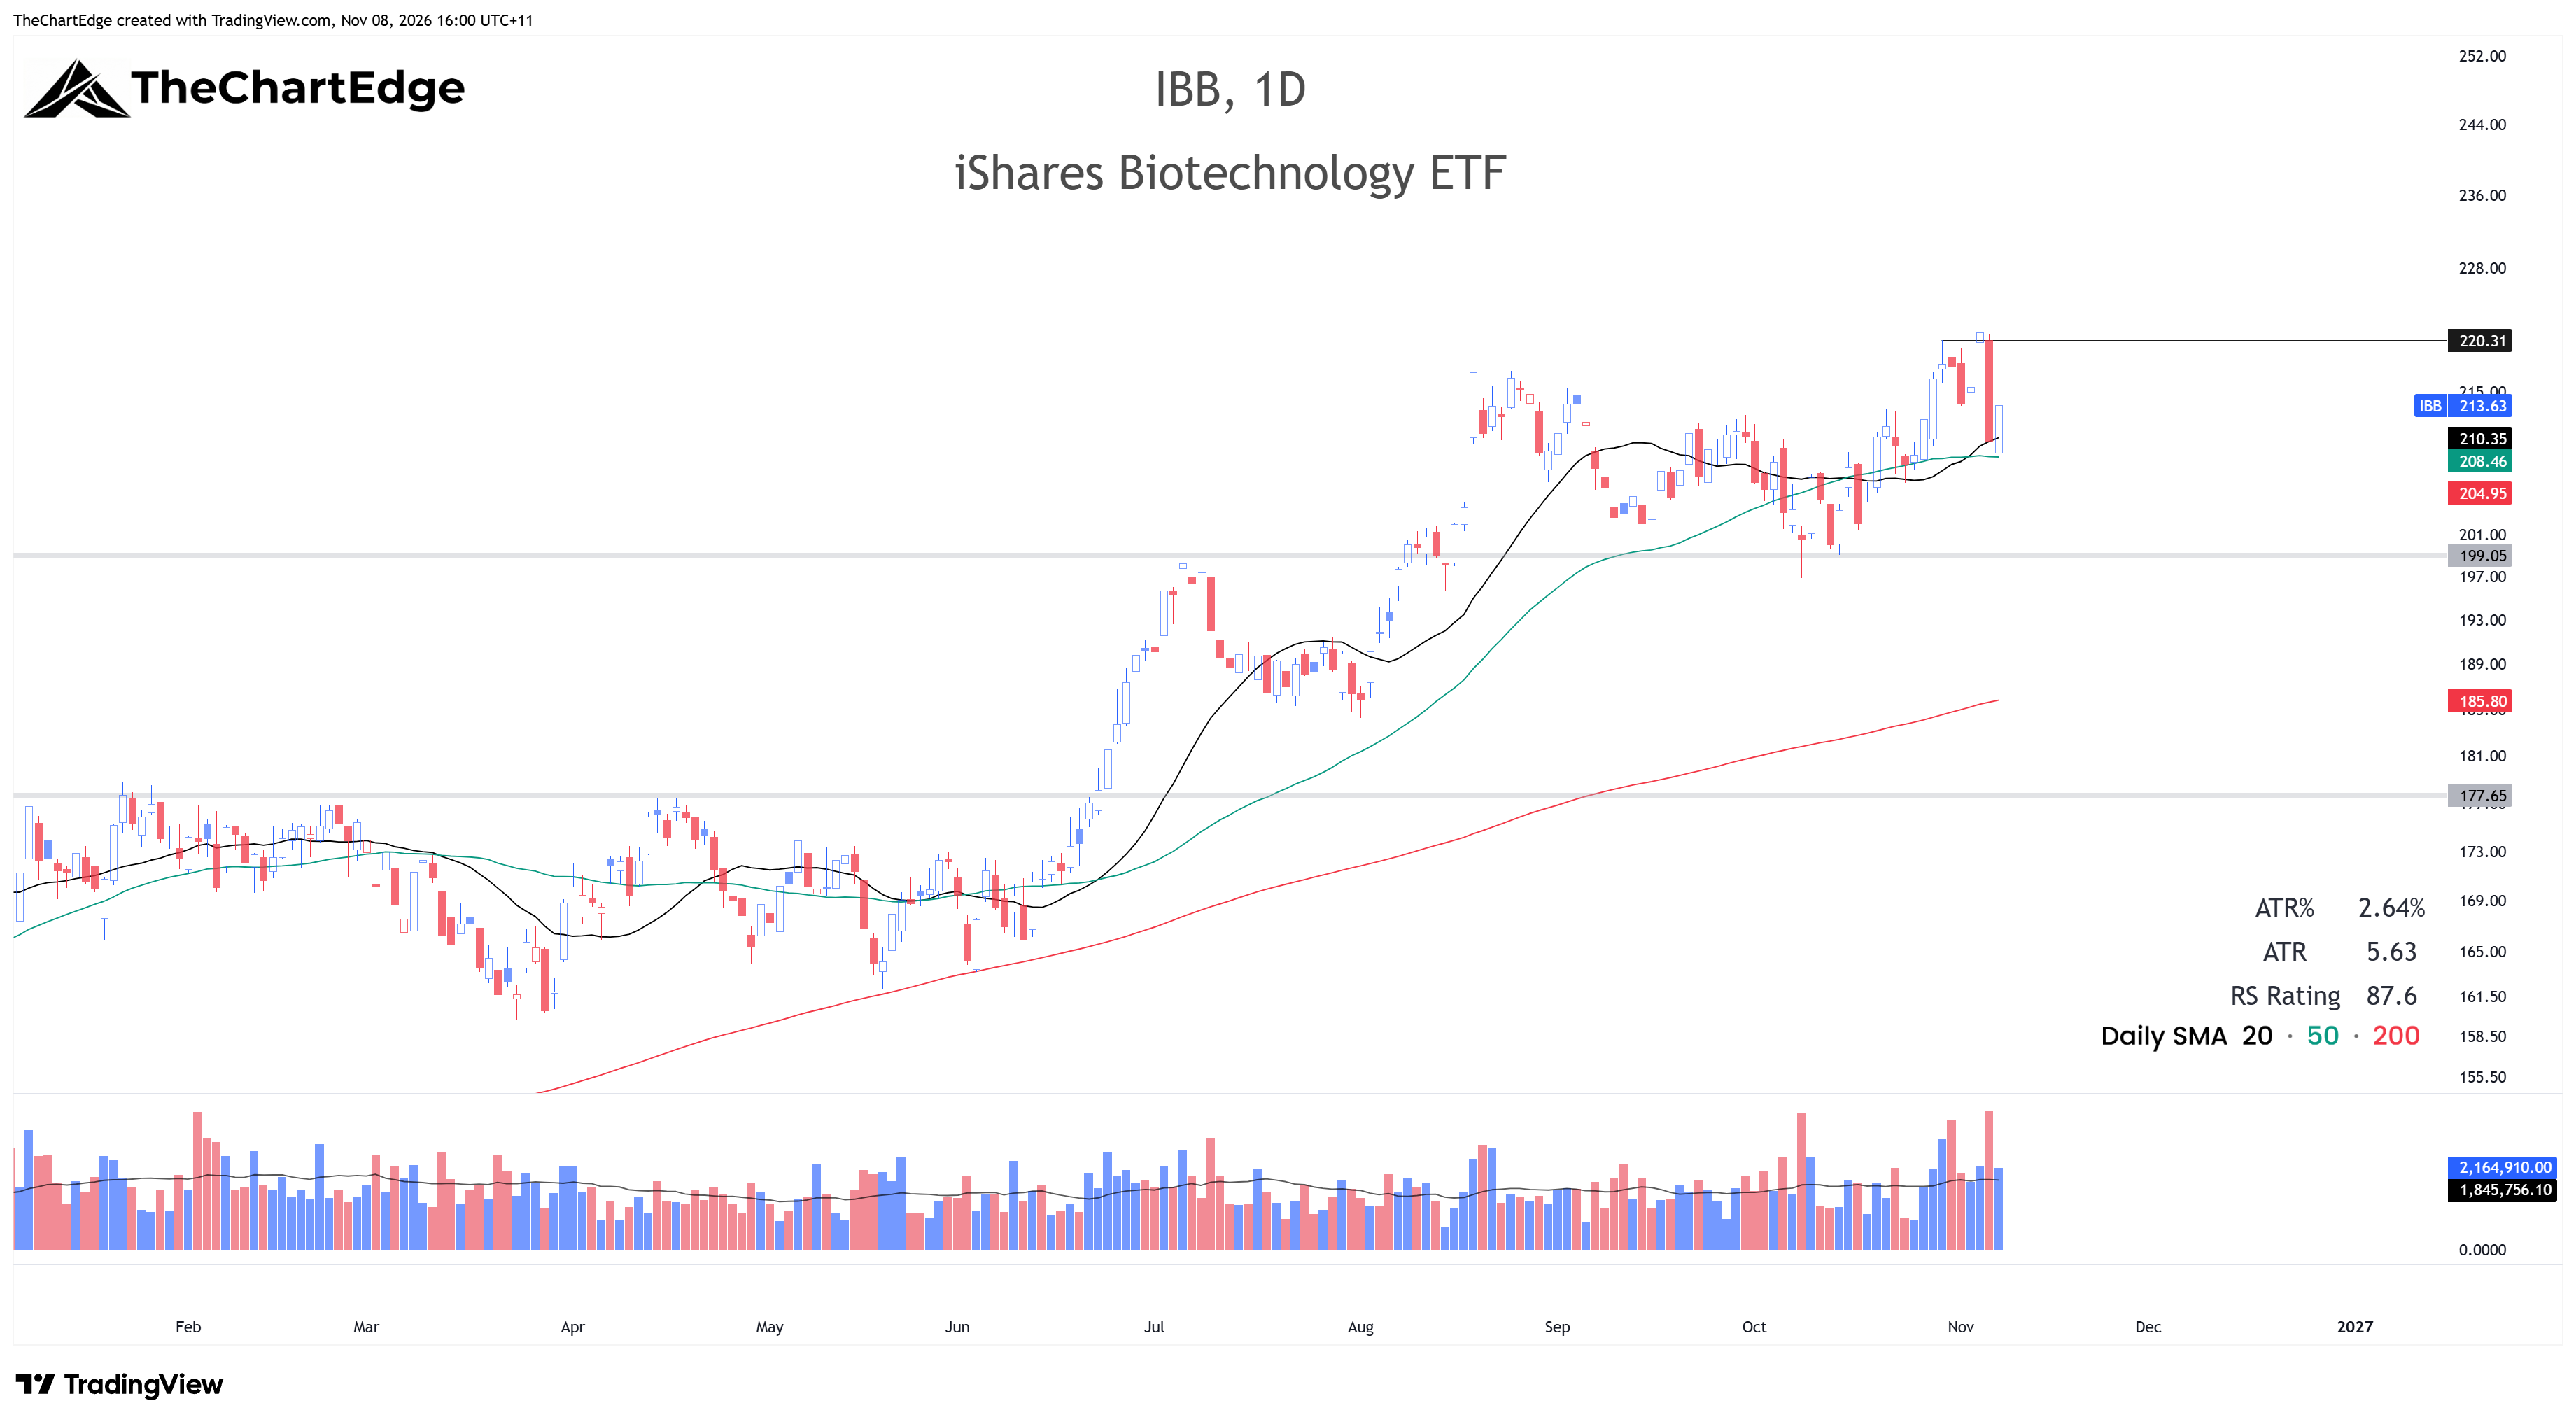
Last weekend I said I’d be looking to get long if IBB had a reasonably gentle pullback to the 212-213 area. But the pullback on Thursday wasn’t gentle, down 4.6%. It finished the week strongly though, closing at 213.63, above a rising 20-day which is now above the 50-day. I still like the chart, but will watch for now to see if it can consolidate and tighten up this coming week.
The Week Ahead
The Market Temperature edged up to 4.4, but only because the VIX rose. Most charts look broken after Thursday’s hammering. The election uncertainty is behind us. However, a change in the status quo in the Middle East will likely have significant ramifications for markets. I plan to stay patient and react to the price action rather than try to predict it.
Stay open-minded and manage risk carefully.
Cheers,
Marcus Grant, CFTe
Disclaimer: The content provided in this newsletter is for informational and educational purposes only and should not be considered as financial, investment, or legal advice. It is general information only and does not take into account your objectives, financial situation or needs. The information shared is based on our research and analysis, but we are not a licensed financial advisor, nor can we guarantee its accuracy, completeness, or timeliness. Market conditions and financial instruments can change rapidly, and any opinions expressed may not be suitable for all investors. Any opinions expressed and/or securities mentioned do not constitute a recommendation to buy, sell, or hold that or any other security. You should conduct your own due diligence and consult with a licensed financial advisor or other professional before making any investment decisions. Past performance is not indicative of future results, and all investments carry the risk of loss. The authors and publishers of this newsletter are not responsible for any financial decisions made based on the content provided herein. By reading and/or subscribing to this newsletter, you acknowledge and agree that you are using the information at your own risk.