


Apologies, this one is out a couple of days late - I posted it largely as it was written, so it doesn’t include this week’s action.
Everything below is as of Friday October 23 close.
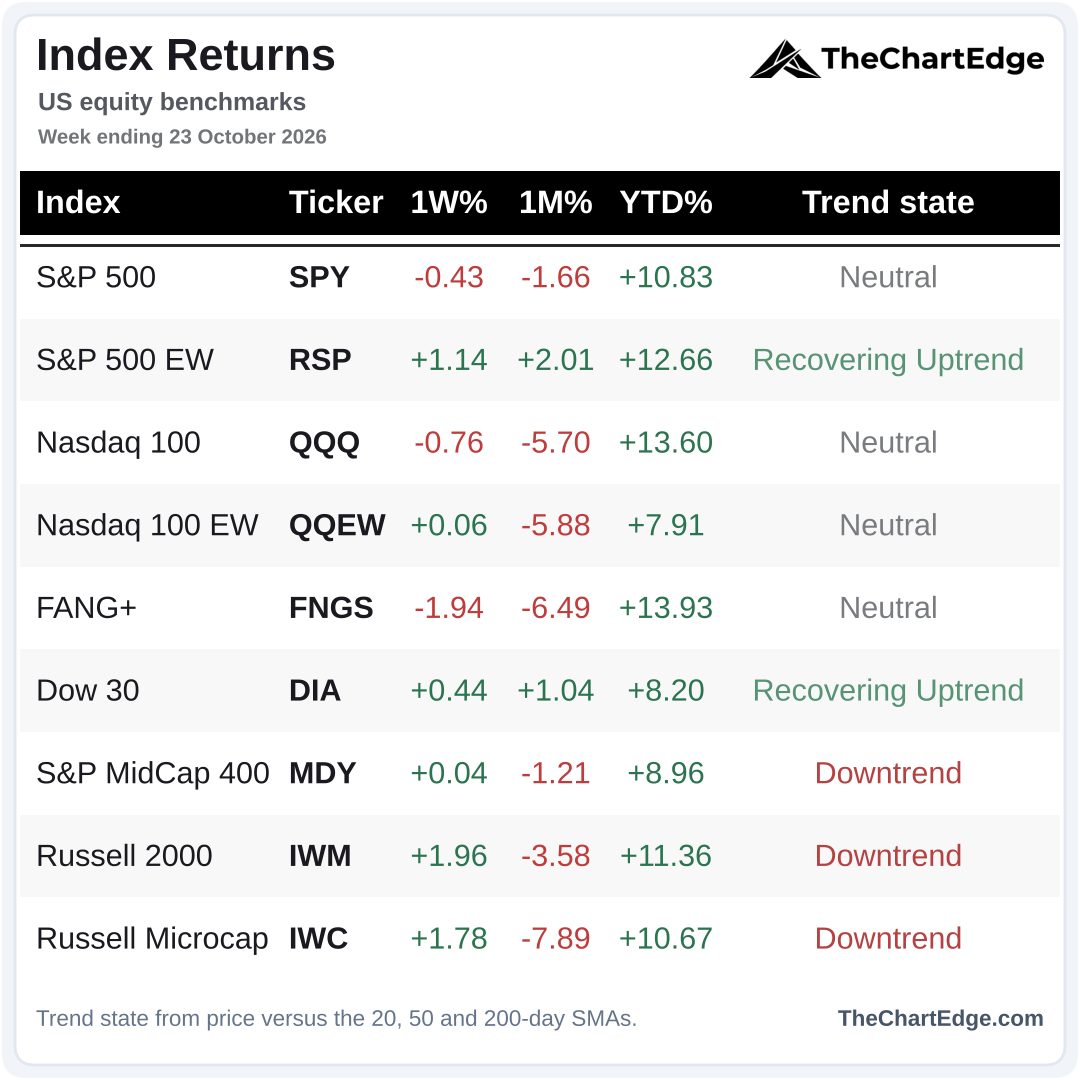
Of the major indices I track, 6 of the 9 finished the week higher - only SPY, QQQ and FANG+ (FNGS) were down. Small-caps (IWM) and micro-caps (IWC) led, and the equal-weight S&P 500 (RSP) is now the only index above both its 20 and 50-day SMAs.
S&P 500 (SPY) Chart
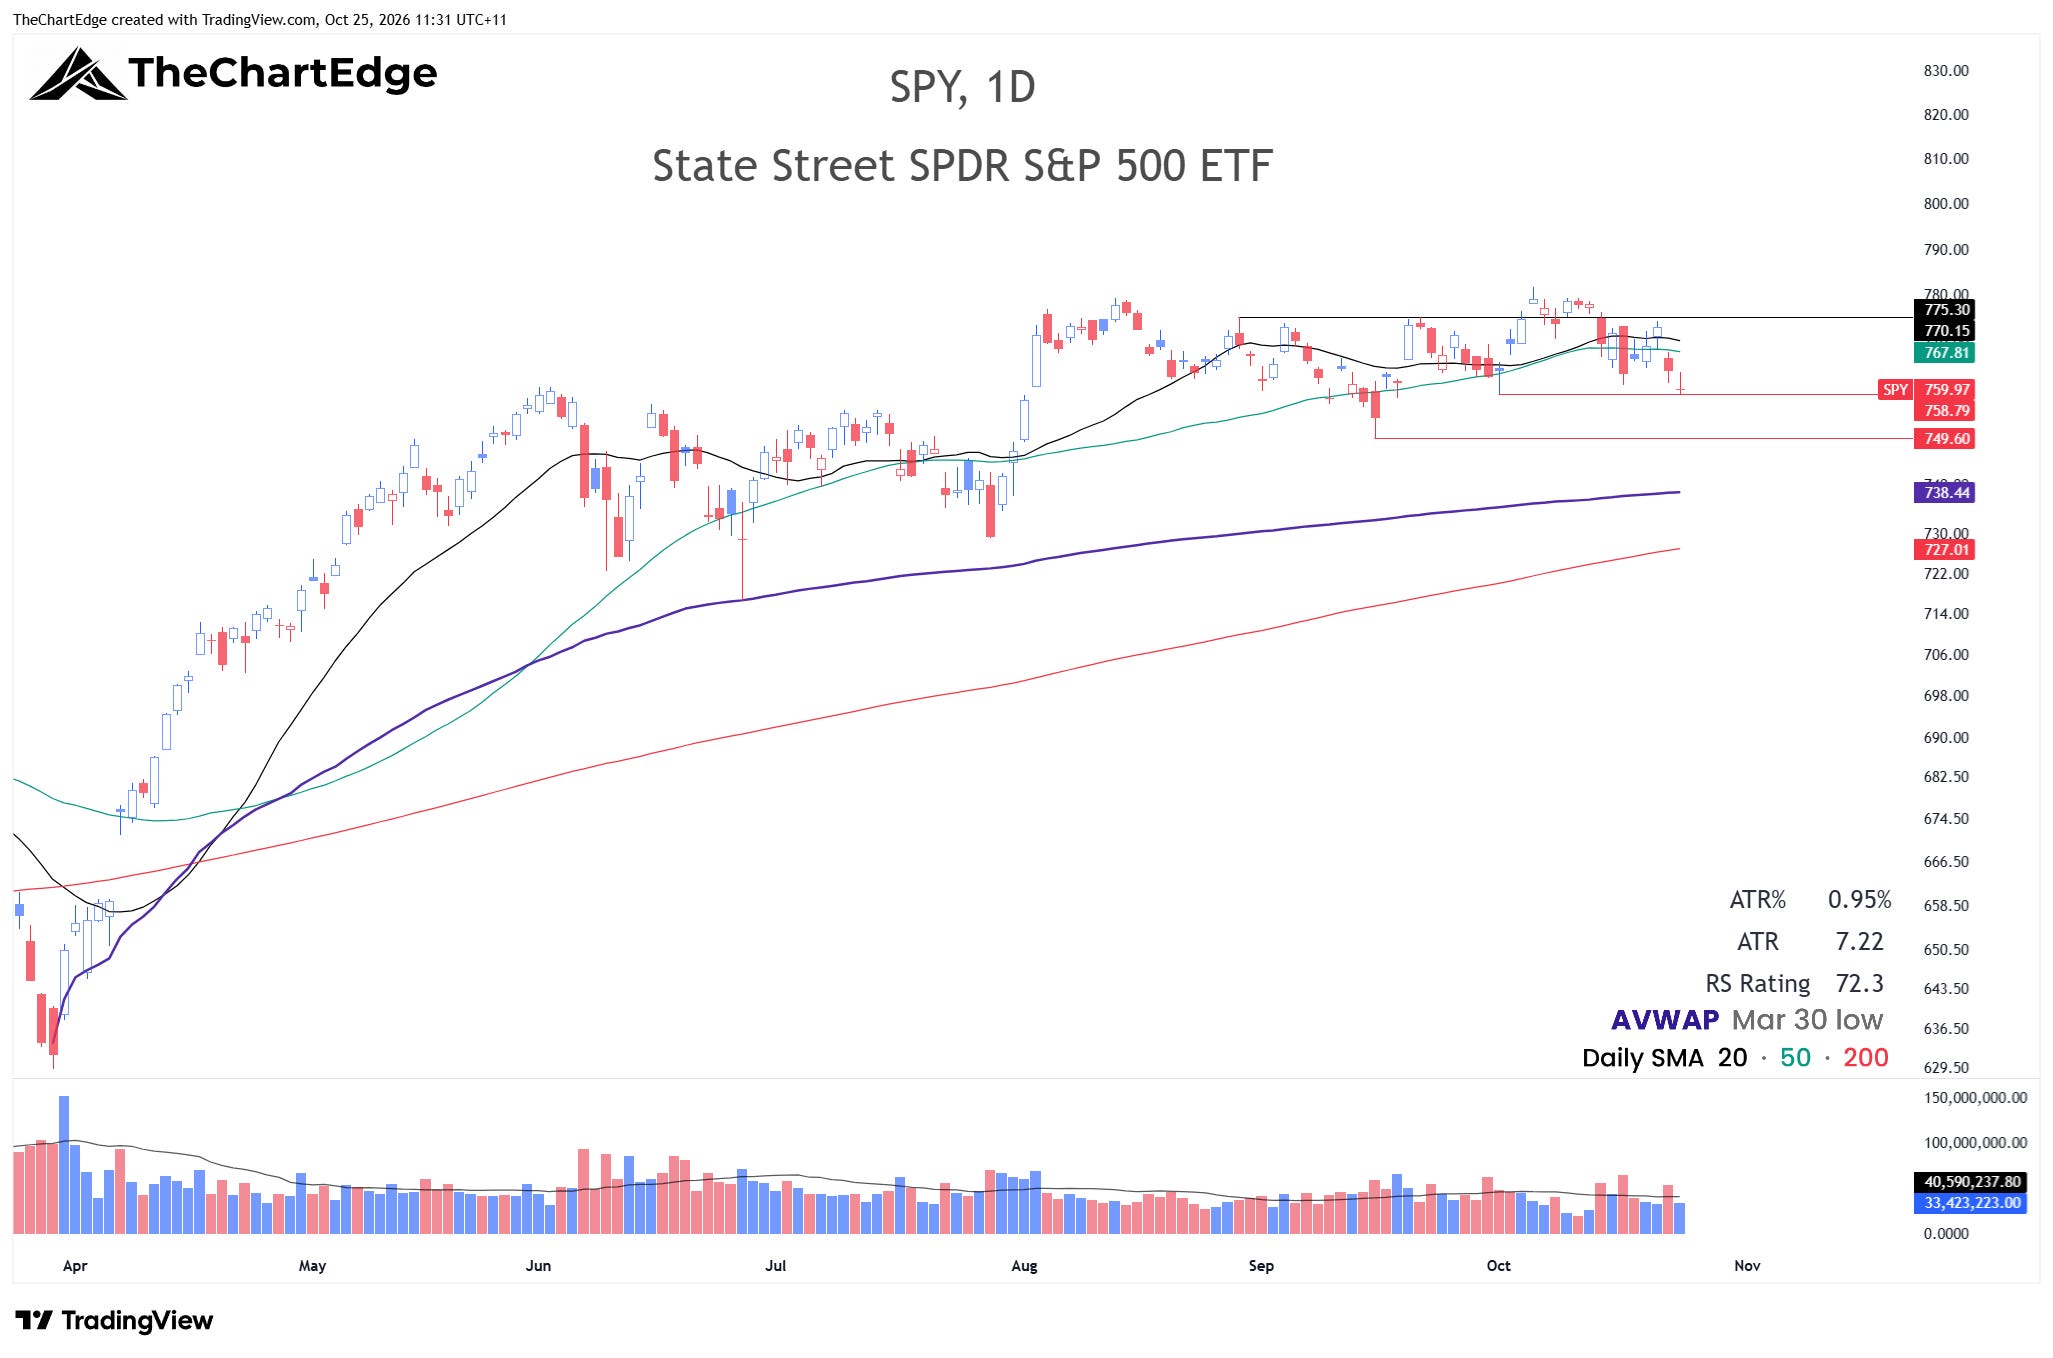
SPY closed at 759.97, still in the Neutral trend state. Early in the week it looked constructive, with a close above the 20 and 50-day SMAs on Wednesday. But Thursday’s gap down and failure to recover, followed by another gap down on Friday, left SPY closing just above the October 1 low at 758.79. We look rangebound between 760 and 775 at best, and could see a test of the September 16 low around 750 if we break below 760. Below that, the AVWAP from the March 30 low currently sits around 738 and the 200-day SMA around 727.
Nasdaq 100 (QQQ) Chart
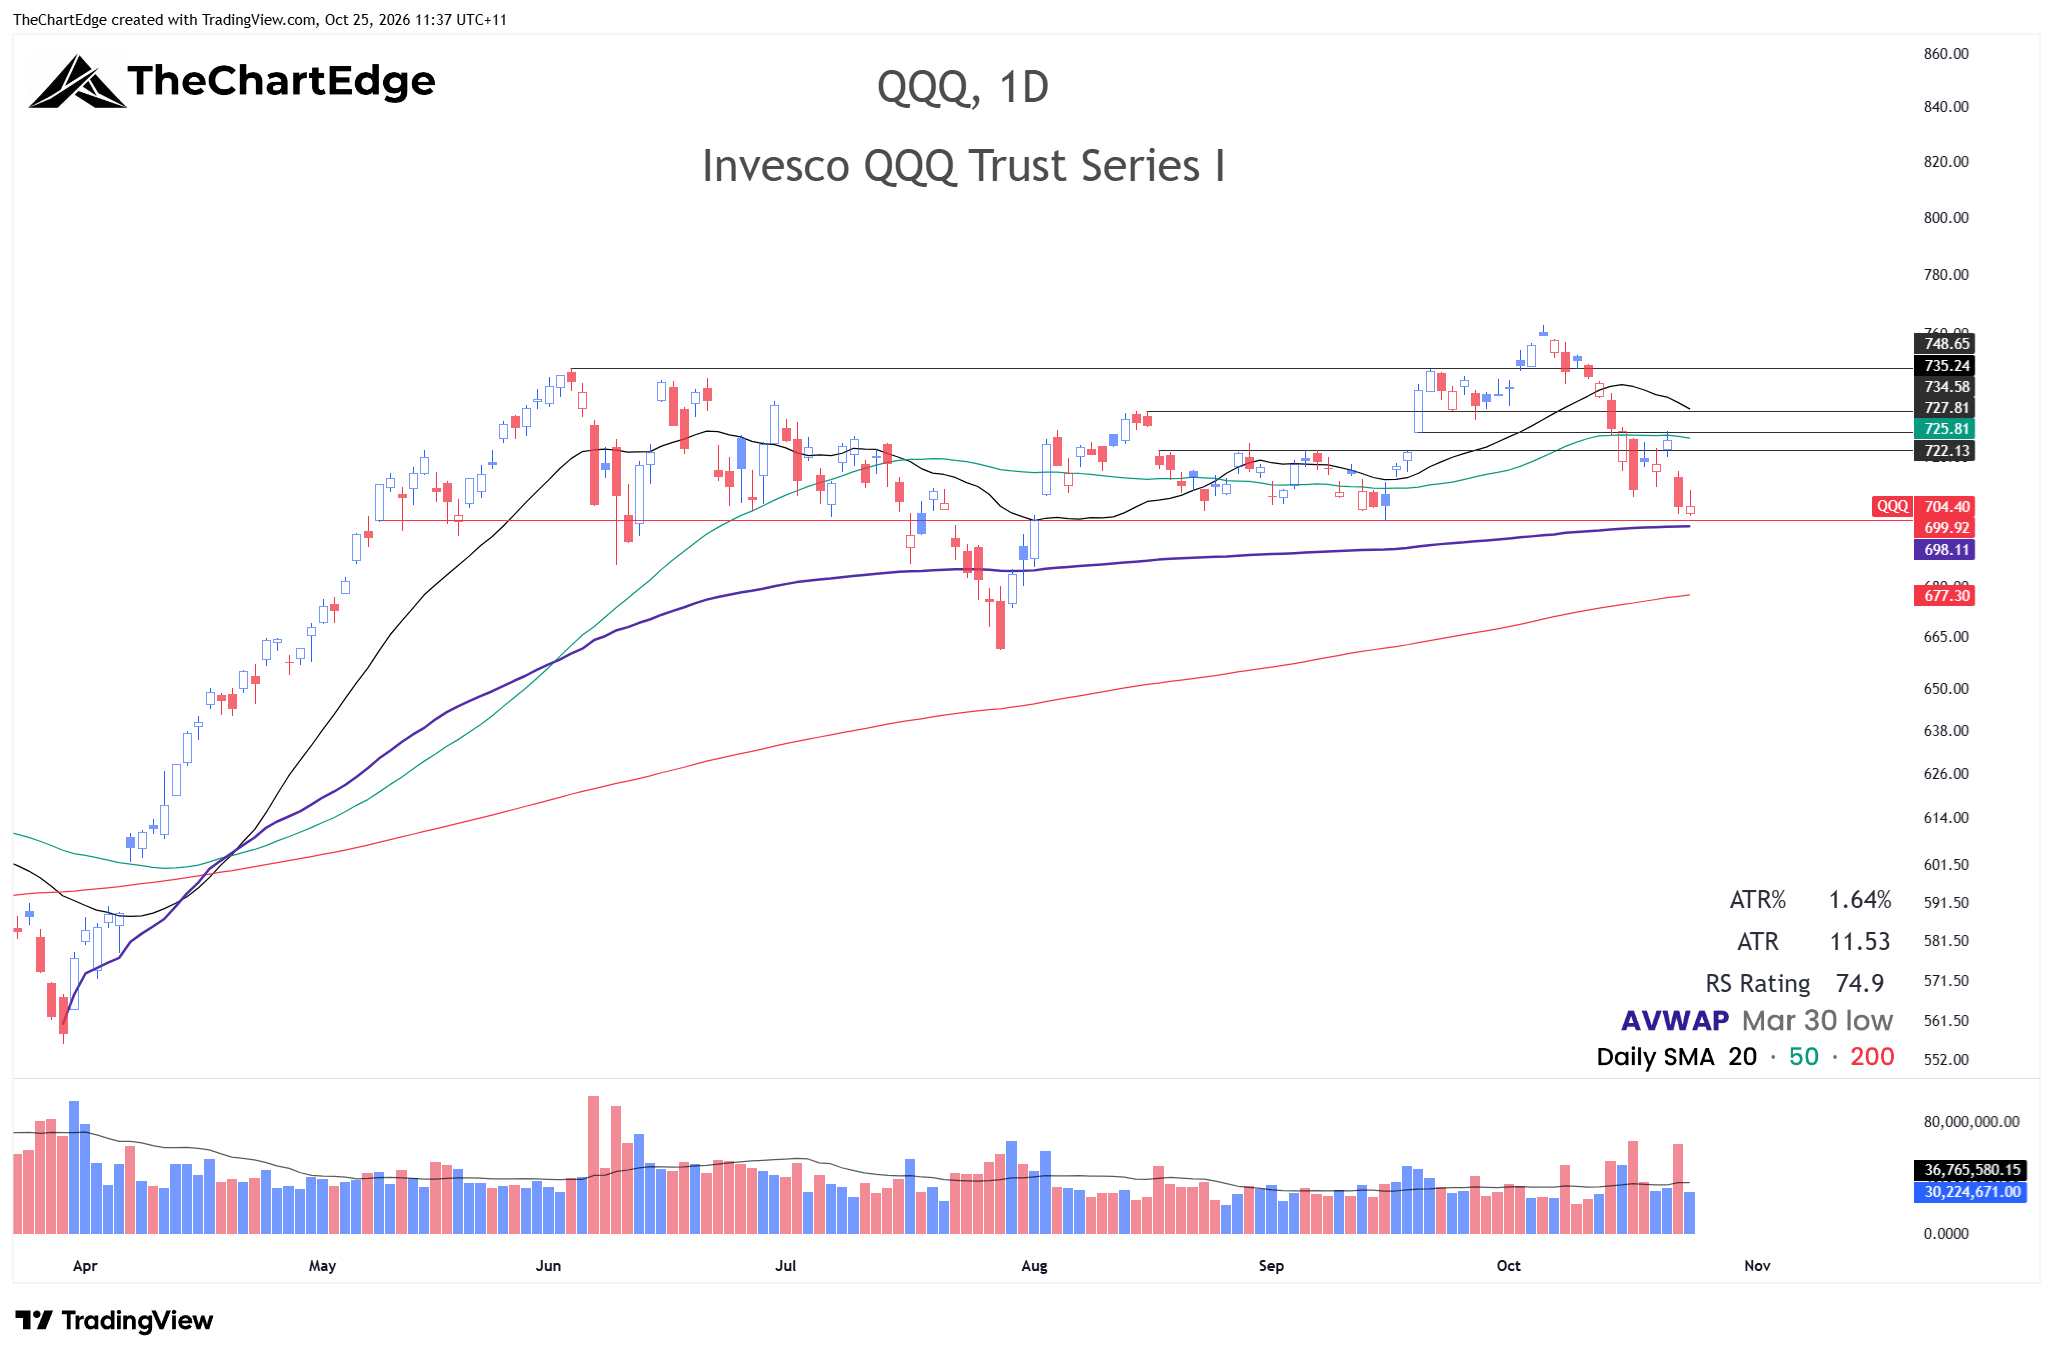
QQQ closed at 704.40, also still Neutral, and is now sitting just above 700 and the AVWAP from the March 30 low, which currently comes in around 698. Bulls really want to see this level hold. One possibility that could provide an aggressive entry is an undercut of 700 that quickly recovers, taking out stops that would be placed there and leading to a mean reversion bounce.
FANG+ (FNGS) Chart
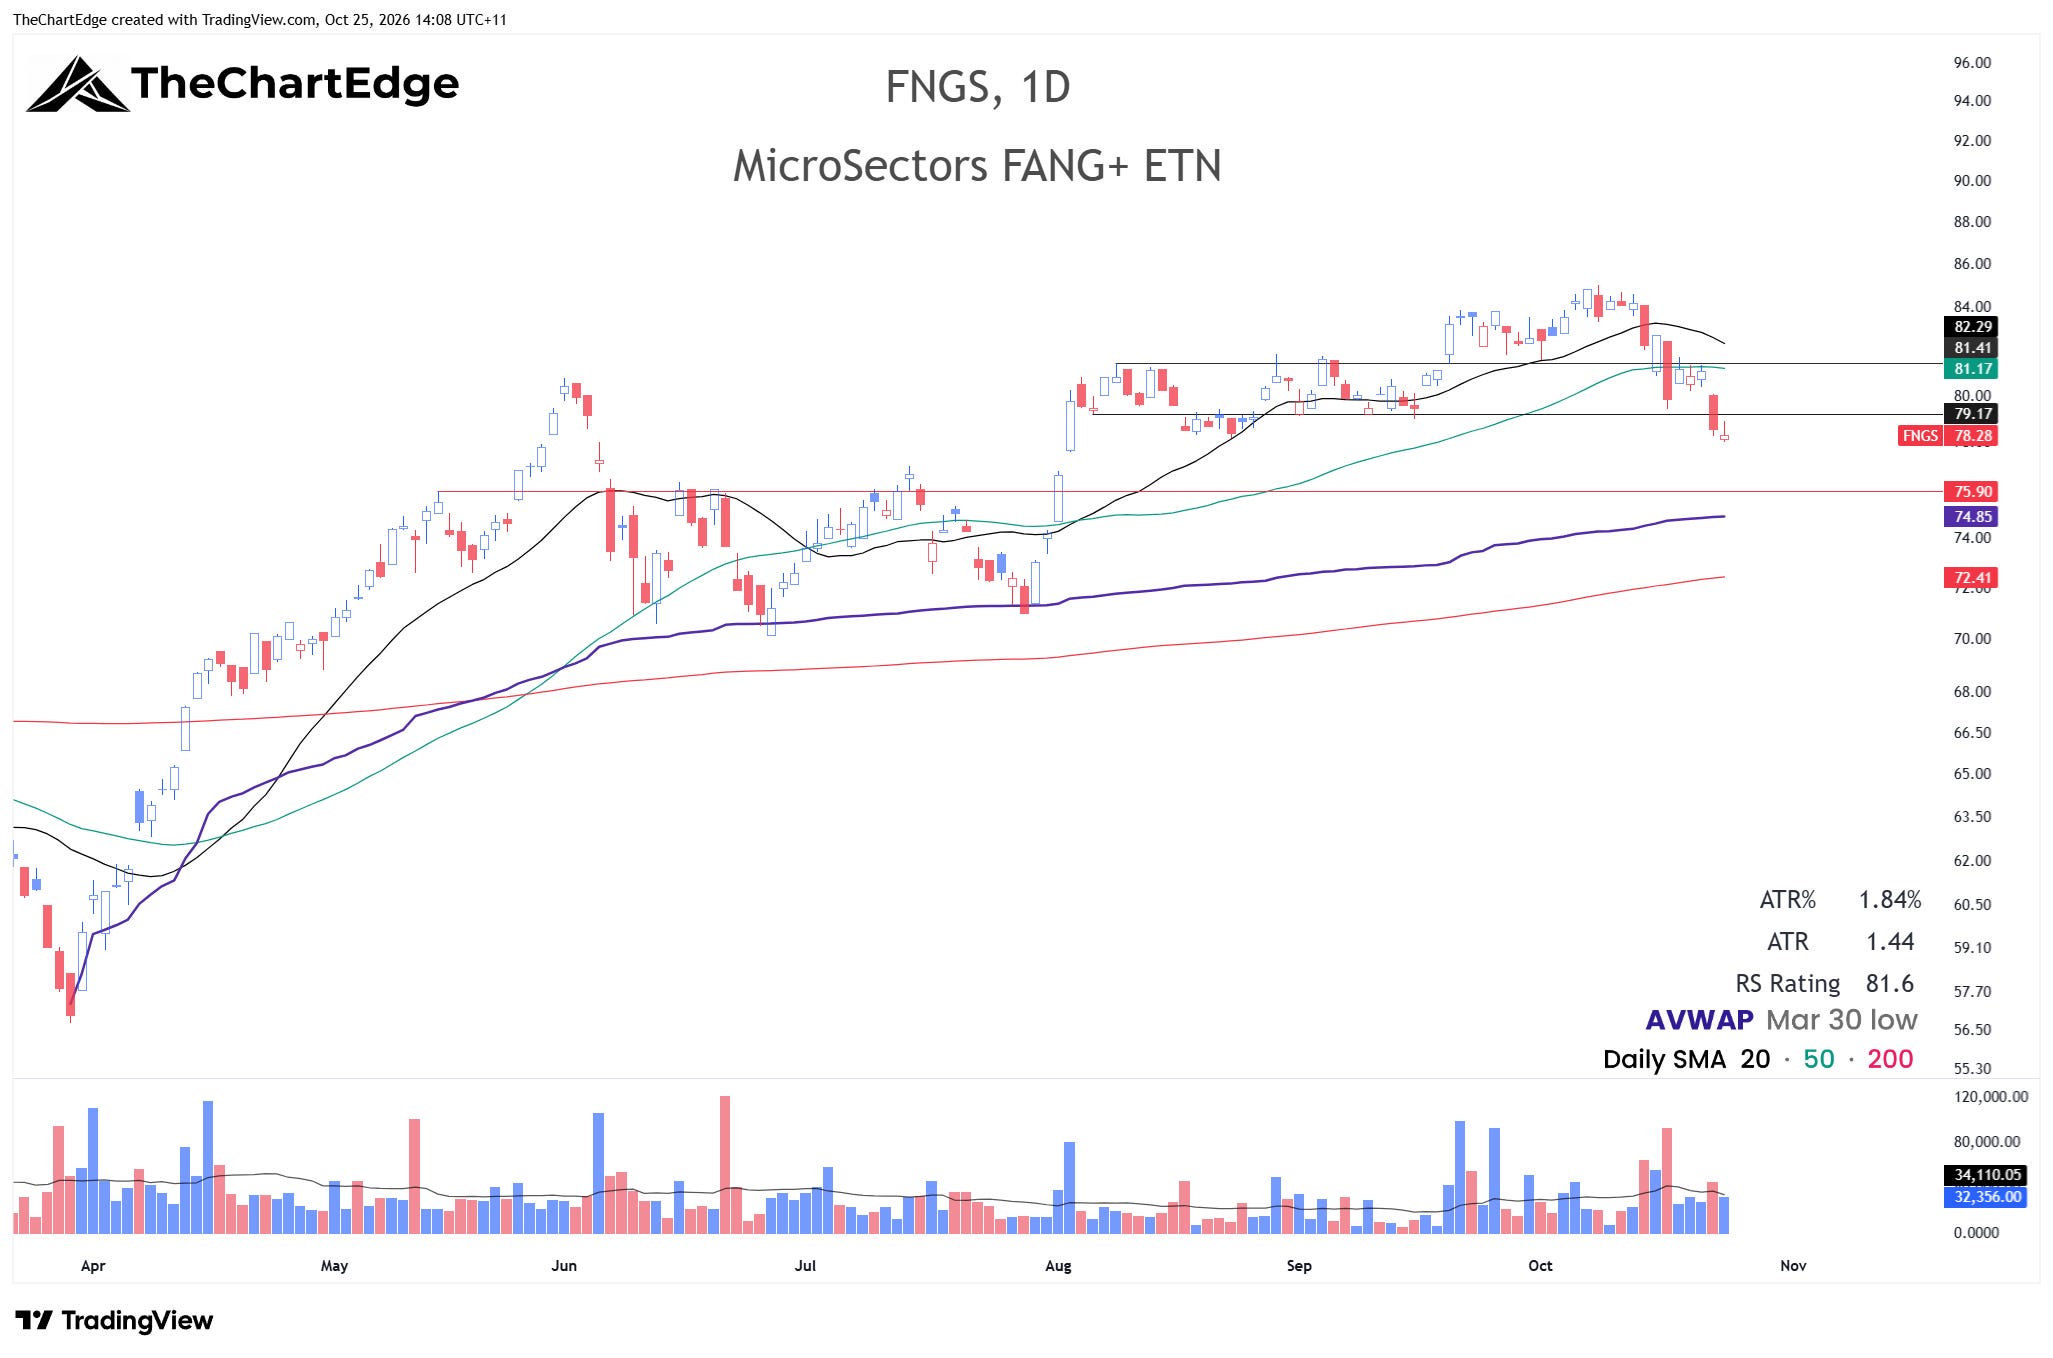
FNGS closed at 78.28, just below the 78.5 to 79 area I flagged last weekend. It may bounce here, but a test of 75.90 is equally possible. It’s somewhat in no-man’s-land here, with reactions to Google, Microsoft (both Wednesday after the close) and Amazon (Thursday after the close) earnings likely to drive FNGS and possibly the broader cap-weighted indices.
Market Temperature
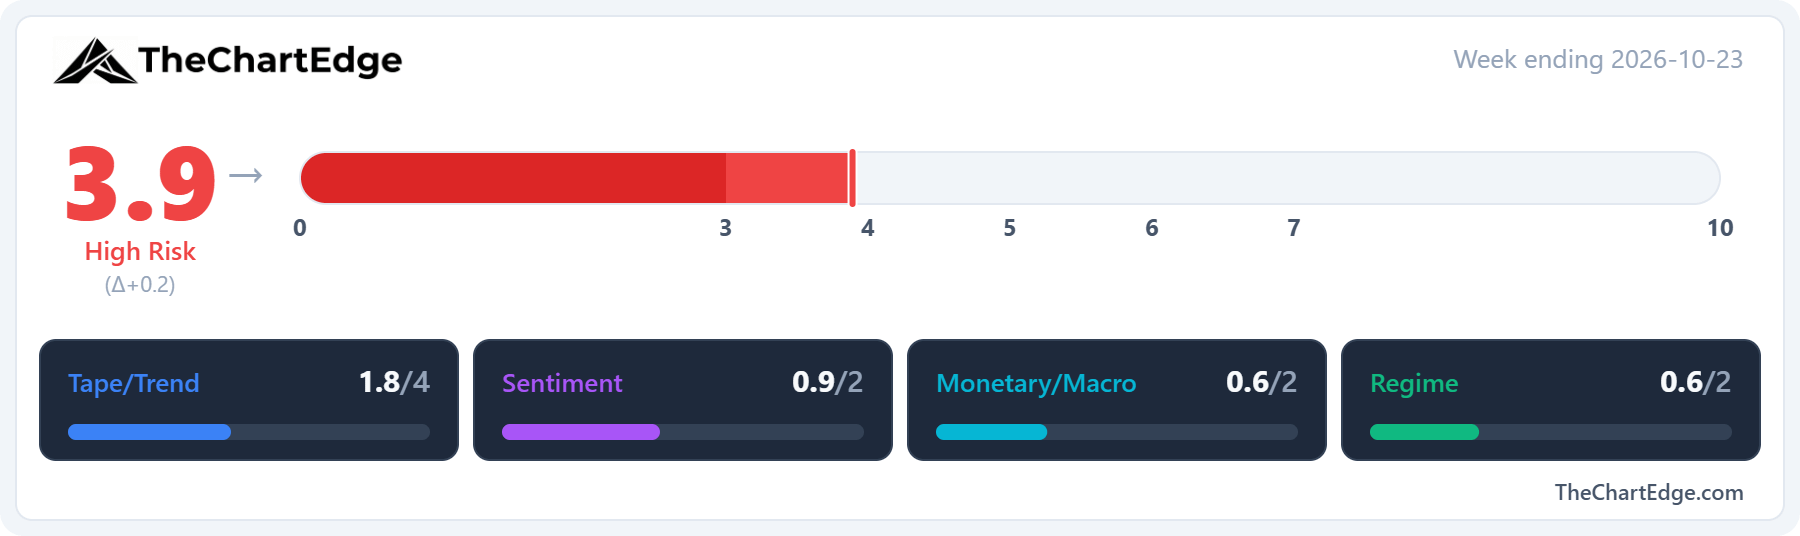
The Market Temperature came in at 3.9, up from 3.7, a 2nd week in the High Risk Zone.
The Monetary/Macro and Tape/Trend pillars strengthened. Within Tape/Trend, breadth improved - the share of US stocks above their 50-day moving average rose to 38.2% from 28.3%, and the 200-day measure to 43.9% from 41.5%. SPY’s weekly RSI offset some of that, slipping to 55.6 from 57.2.
The Monetary/Macro gain came mostly from the model’s four-week look-back rather than any real improvement. The MOVE index rose to 103.3 from 101.1 but scored better as the four-week comparison is now 96.0, from 80.6. The US dollar was roughly flat - UUP edged up while the DXY slipped slightly - and IEI/HYG was up marginally. The 10 and 30-year yields fell, closing at 4.99% and 5.32%, from 5.10% and 5.44%.
The Sentiment and Regime pillars were both unchanged to one decimal place, with the VIX easing to 19.5 from 20.0.
GICS Sector Relative Strength
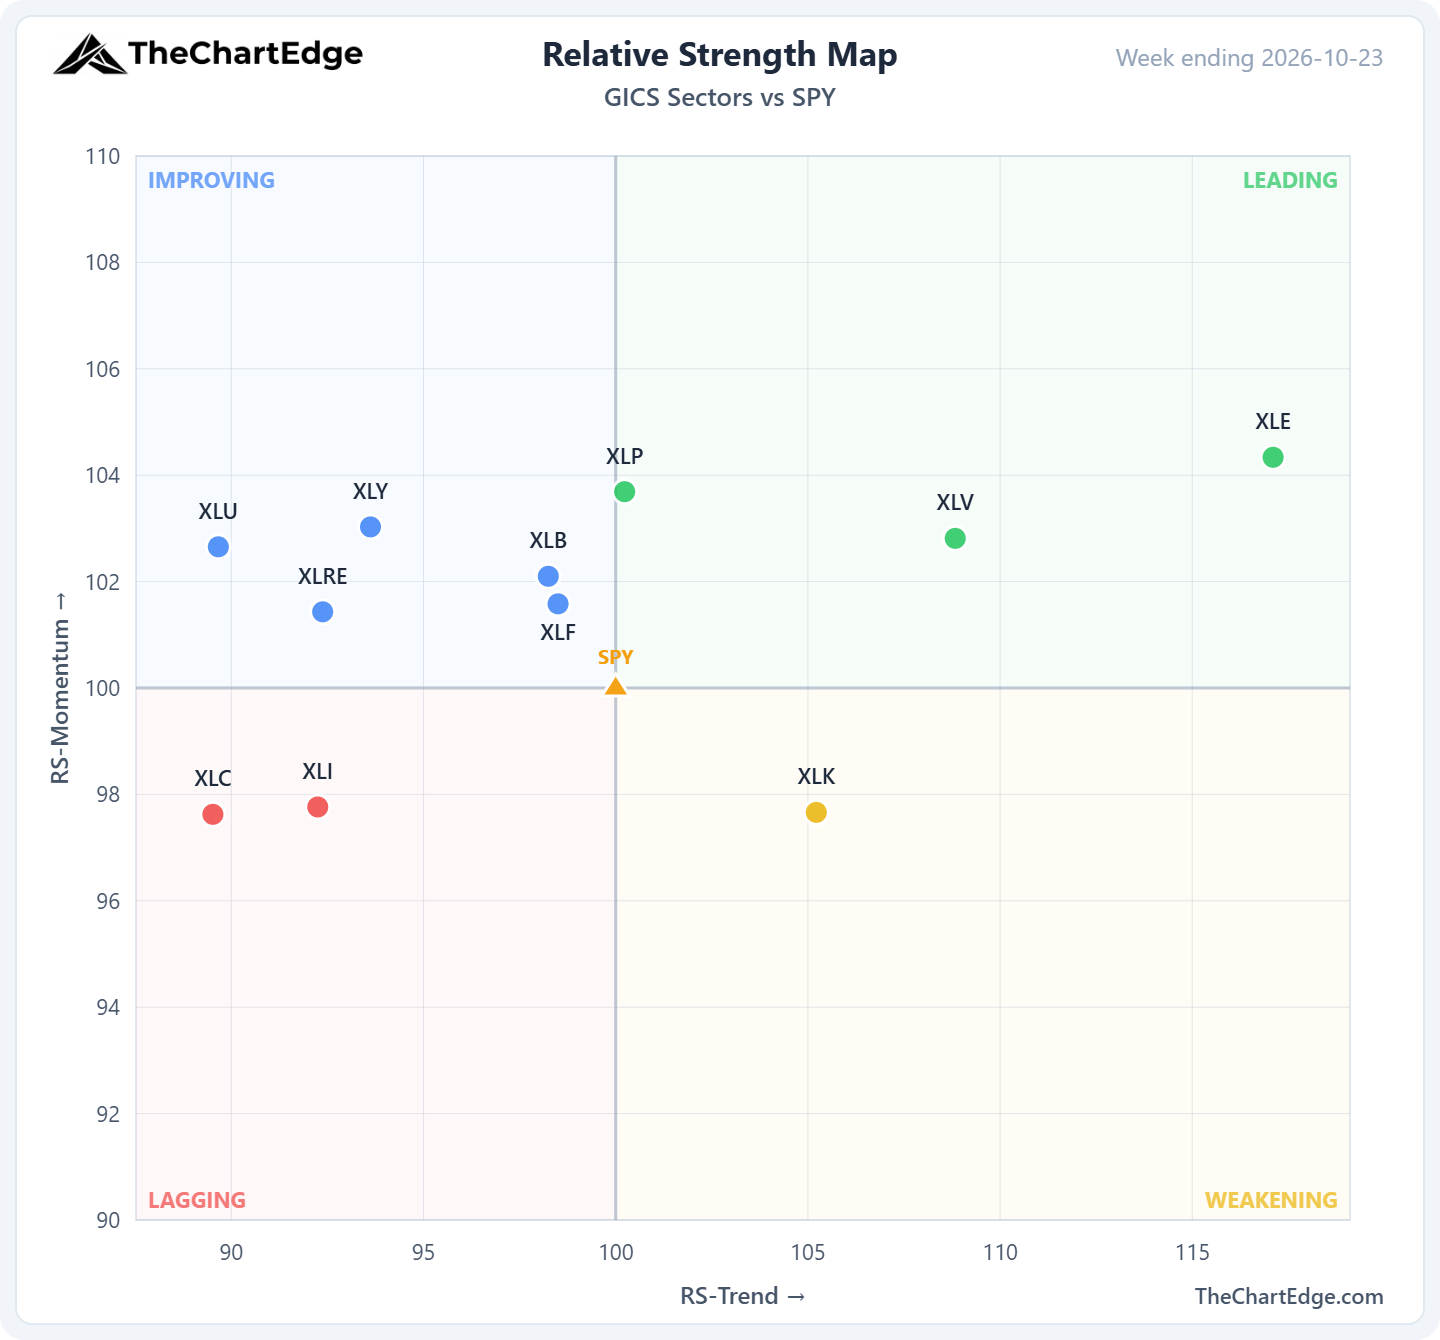
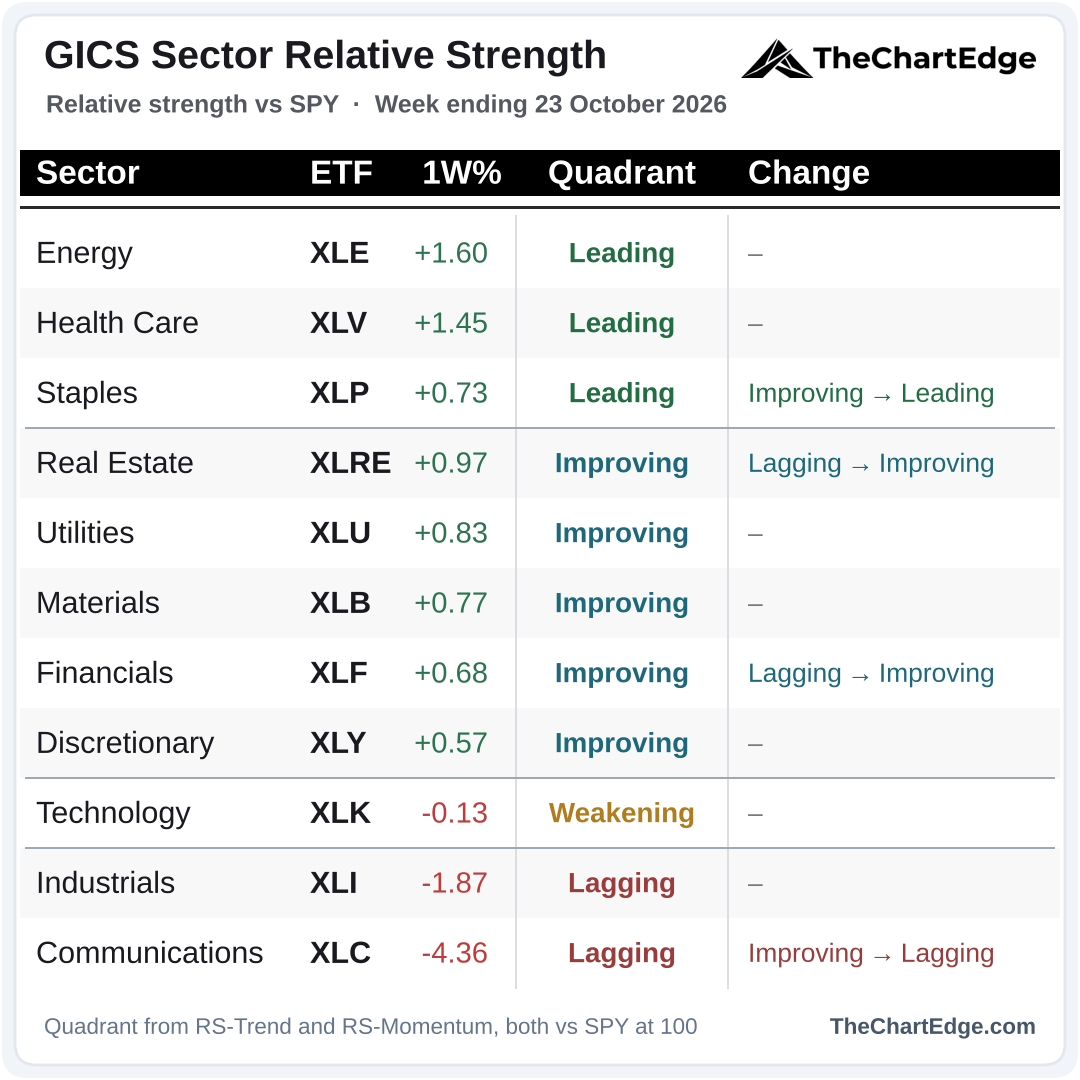
9 of the 11 sectors outperformed SPY - industrials and communications were the laggards. Energy, health care and real estate led. Staples moved into Leading, although only just, joining energy and health care. Financials and real estate both moved from Lagging into Improving, while communications dropped from Improving into Lagging.
Momentum Leaderboard
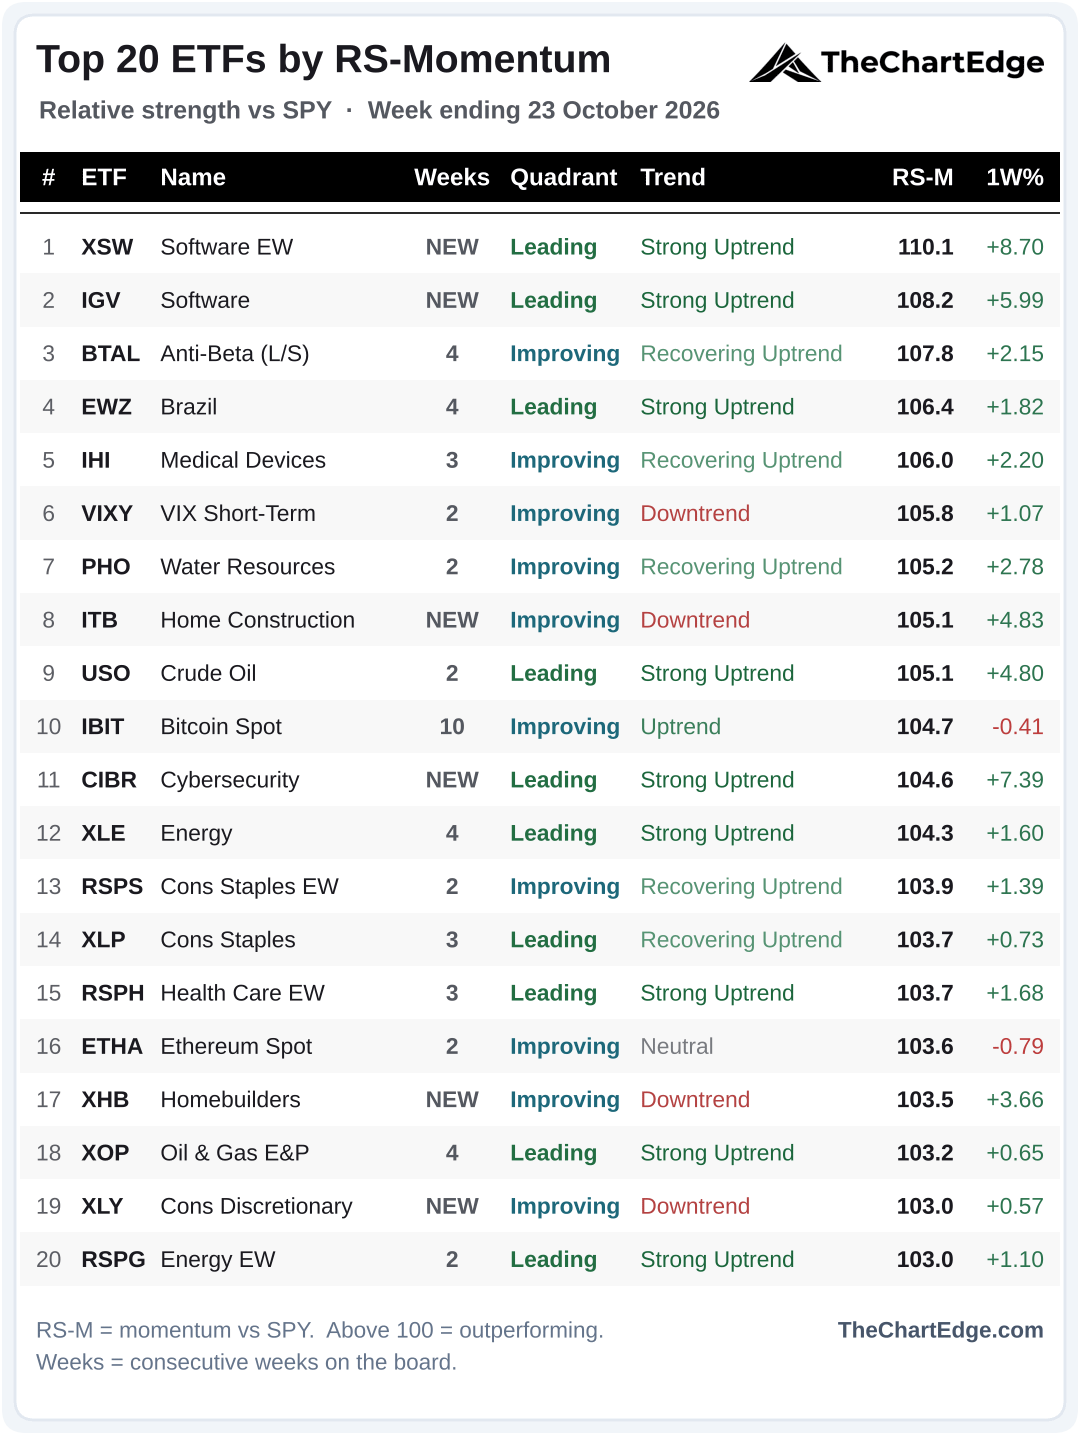
6 of the 20 are new. Software is back after one week off, with equal-weight software (XSW) taking the number 1 spot, software (IGV) at number 2 and cybersecurity (CIBR) also back. Home construction (ITB), homebuilders (XHB) and consumer discretionary (XLY) are new too, although all 3 are in Downtrends.
Health care (XLV), AI power & utilities (UTES), retail (XRT), India (INDA), equal-weight consumer discretionary (RSPD) and the UK (EWU) fell off the board.
Anti-Beta (BTAL) is at number 3 again and the VIX (VIXY) is at number 6 - indicating a continued defensive posture.
Bitcoin (IBIT) holds the longest streak at 10, and 9 of the 20 are in Strong Uptrends, from 6 last weekend.
Trend States Across the Universe
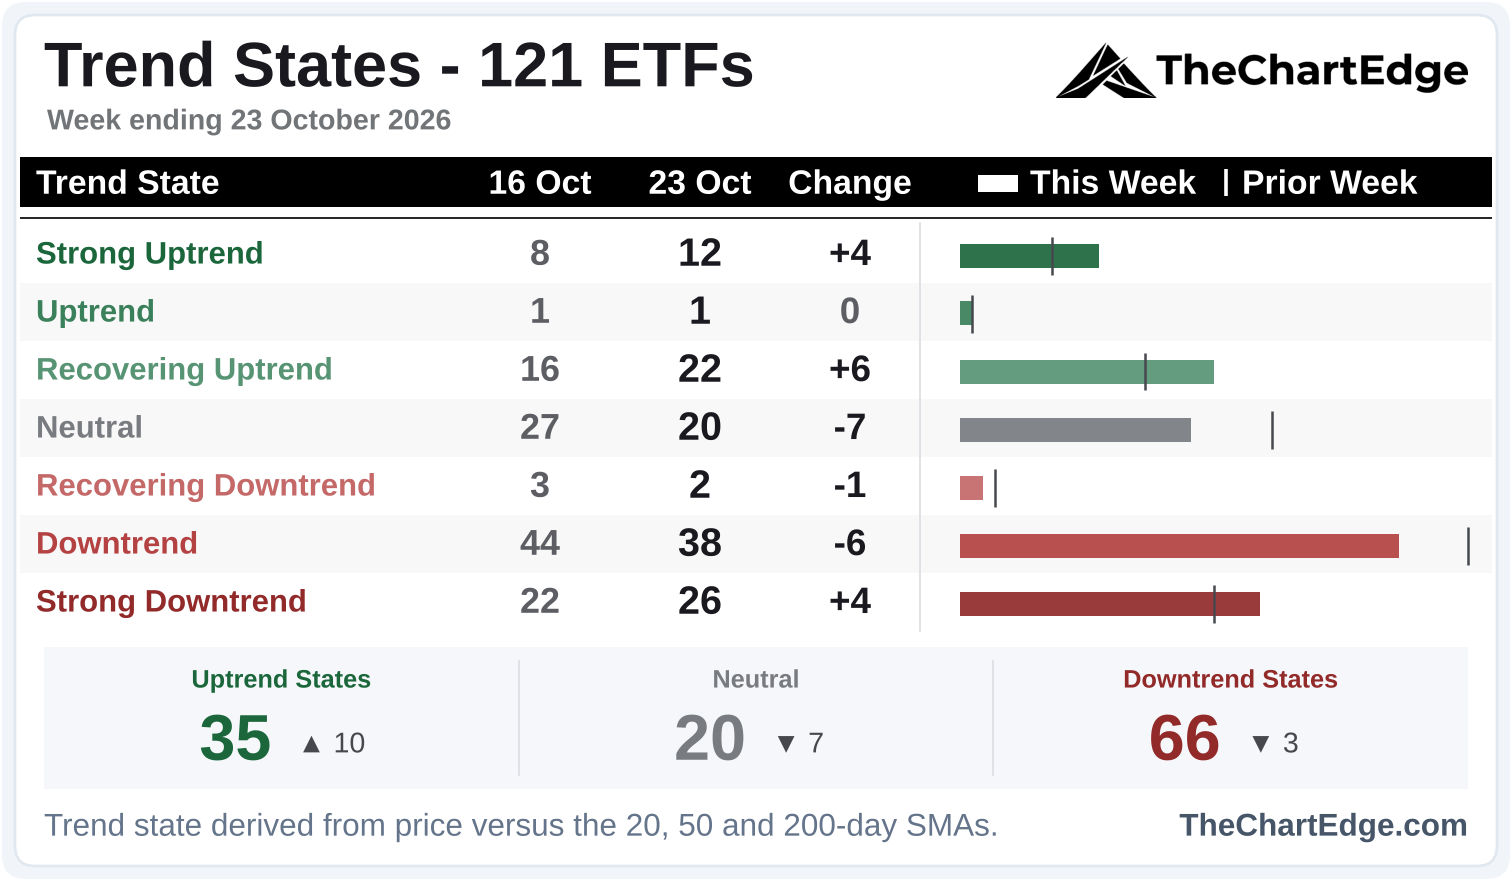
Uptrend states rose, although downtrend states still significantly outnumber them. Software (XSW, IGV and CIBR) went straight from Neutral to Strong Uptrends, while banks (KRE and KBE), medical devices (IHI), oil services (OIH) and Australia (EWA) moved up from Downtrends into Recovering Uptrends.
However, Strong Downtrends rose, with industrials (XLI), communications (XLC), airlines (JETS), India (INDA), smart grid infrastructure (GRID) and silver miners (SIL) all dropping into them.
The metals had a bad week. 7 of the 10 worst performers of the 121-ETF universe were metals or miners - silver miners (SIL), copper miners (COPX), gold miners (GDX), palladium (PALL), silver (SLV), lithium & battery (LIT) and rare earths (REMX). The other 3 were natural gas (UNG), crypto miners (WGMI) and China internet (KWEB), and all 10 are in downtrend states.
Industry Breadth - Leading Stocks
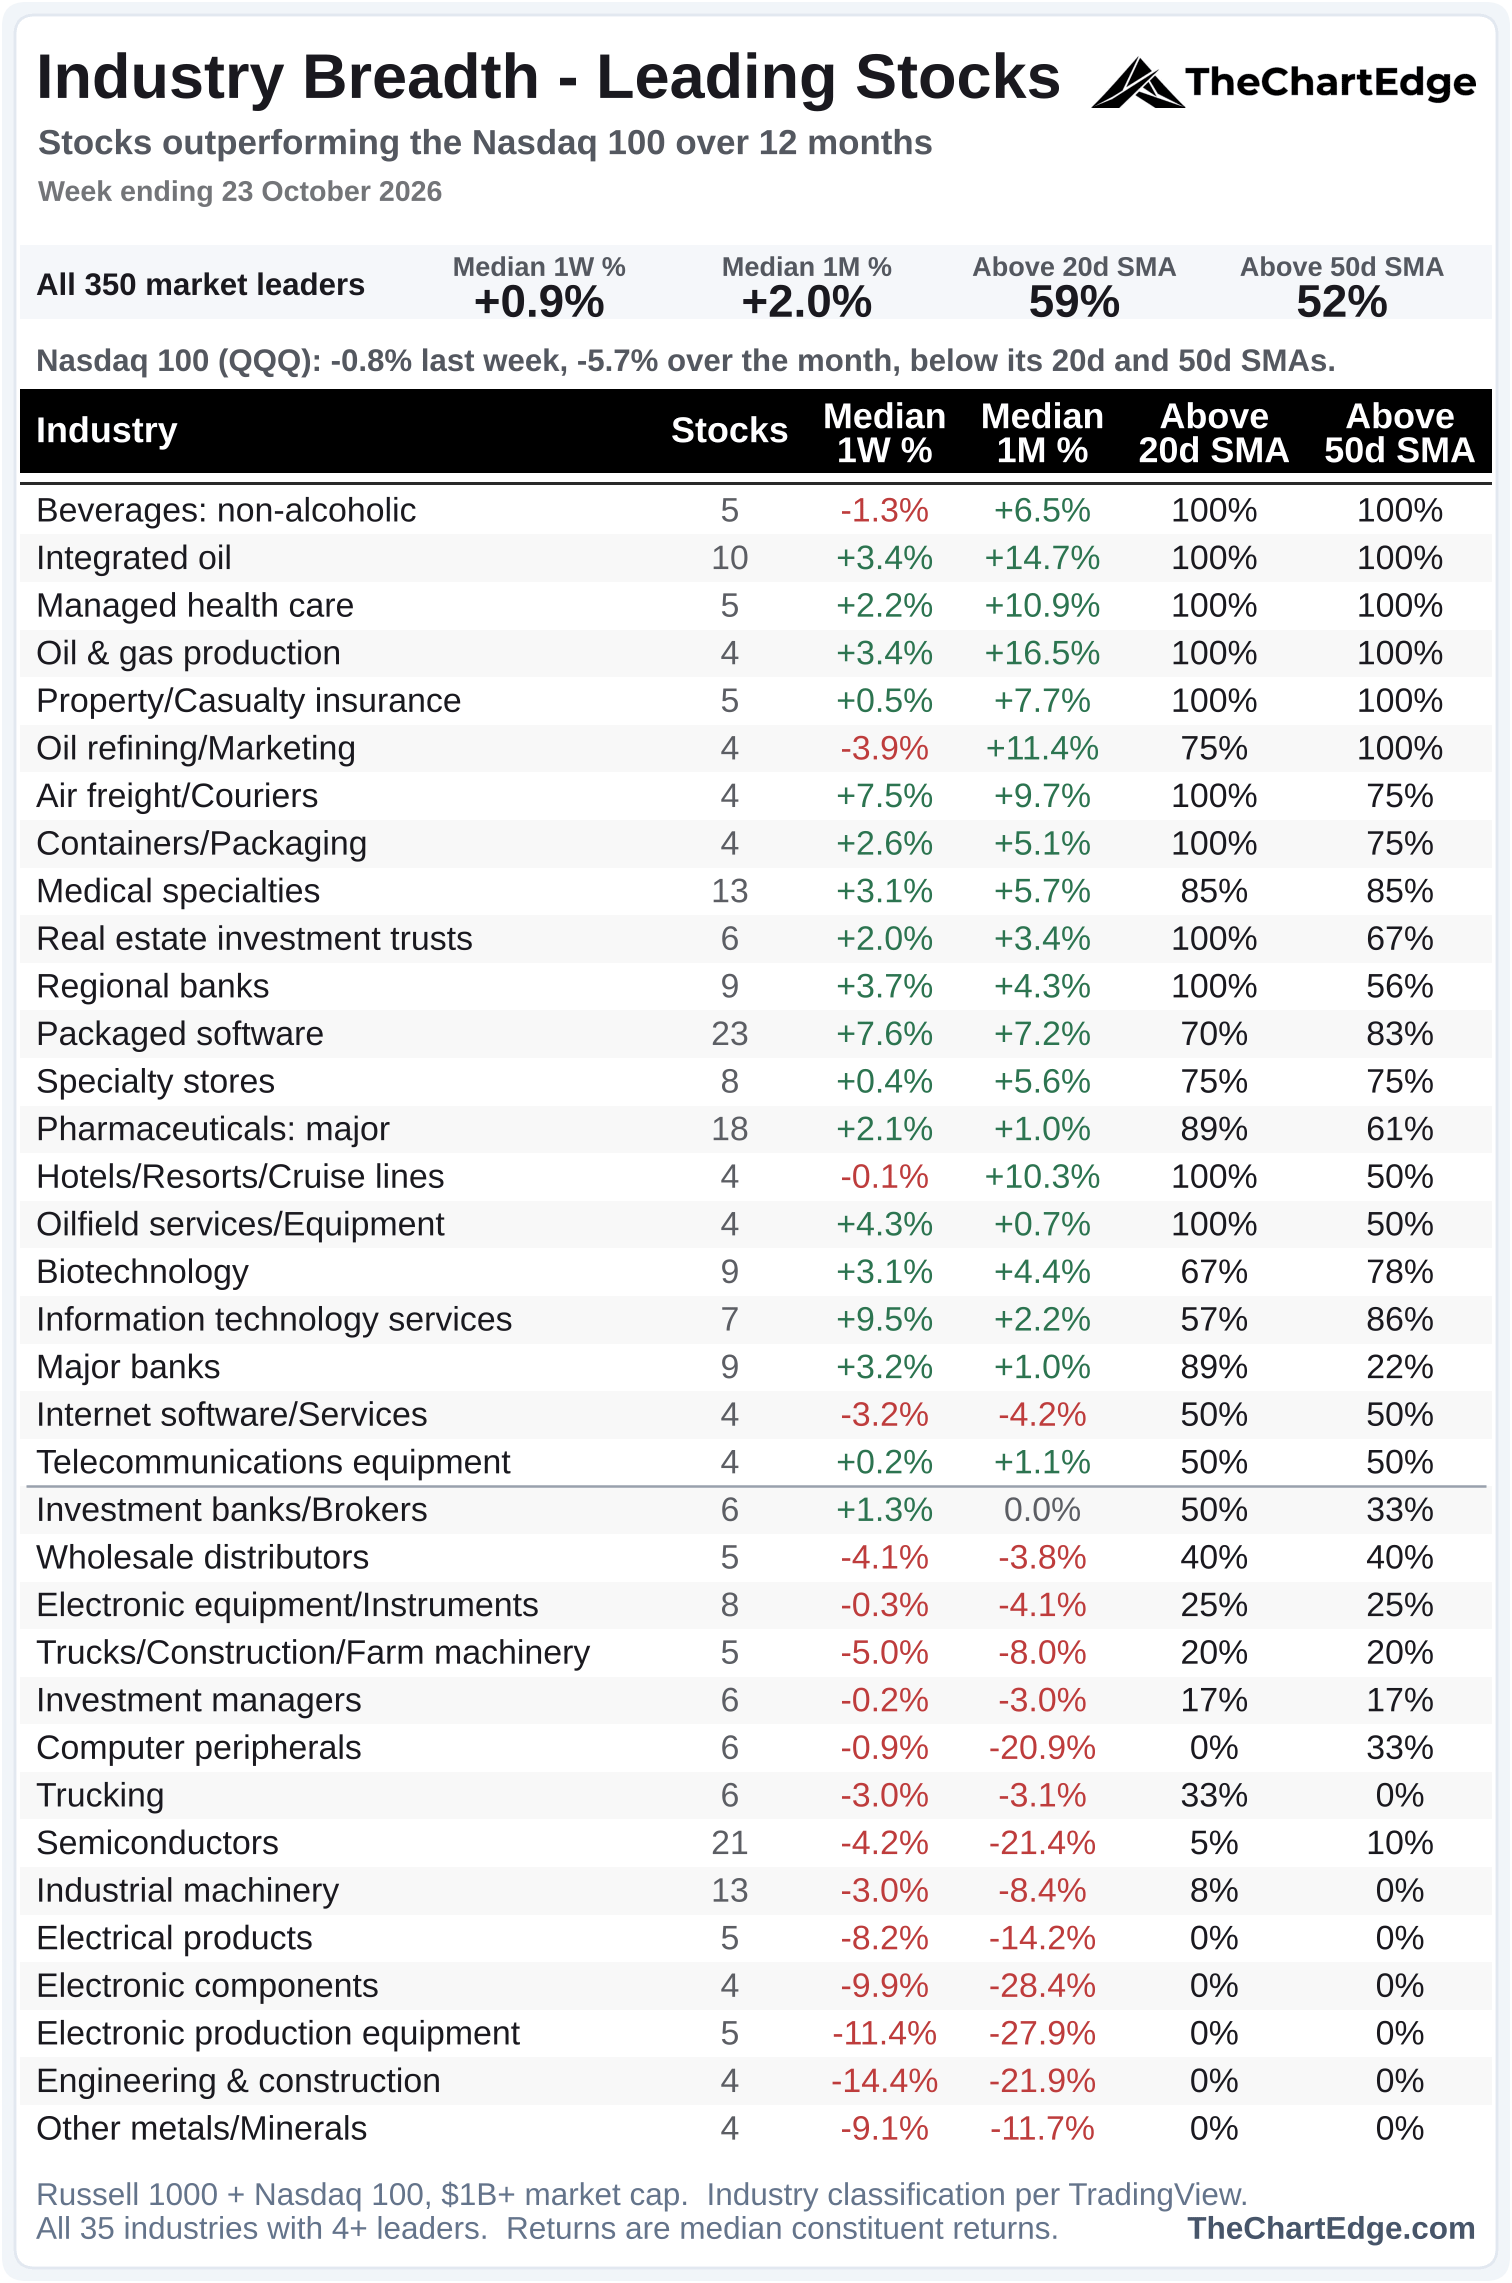
Software moved back above the 50% line, with packaged software up from 18th to 12th and IT services from 20th to 18th. Semiconductors, electronic components, electronic production equipment and engineering & construction remain in the bottom 7, with only 1 of the 21 semis names above its 20-day SMA.
QQQ’s own 12-month return fell again, allowing the universe to grow by 17 names. Of the names that were in it both weeks, the share above the 20-day SMA rose to 56% from 54%, and above the 50-day to 51% from 45%.
Software Leads, Semis Slide
Equal-weight Software (XSW) Chart
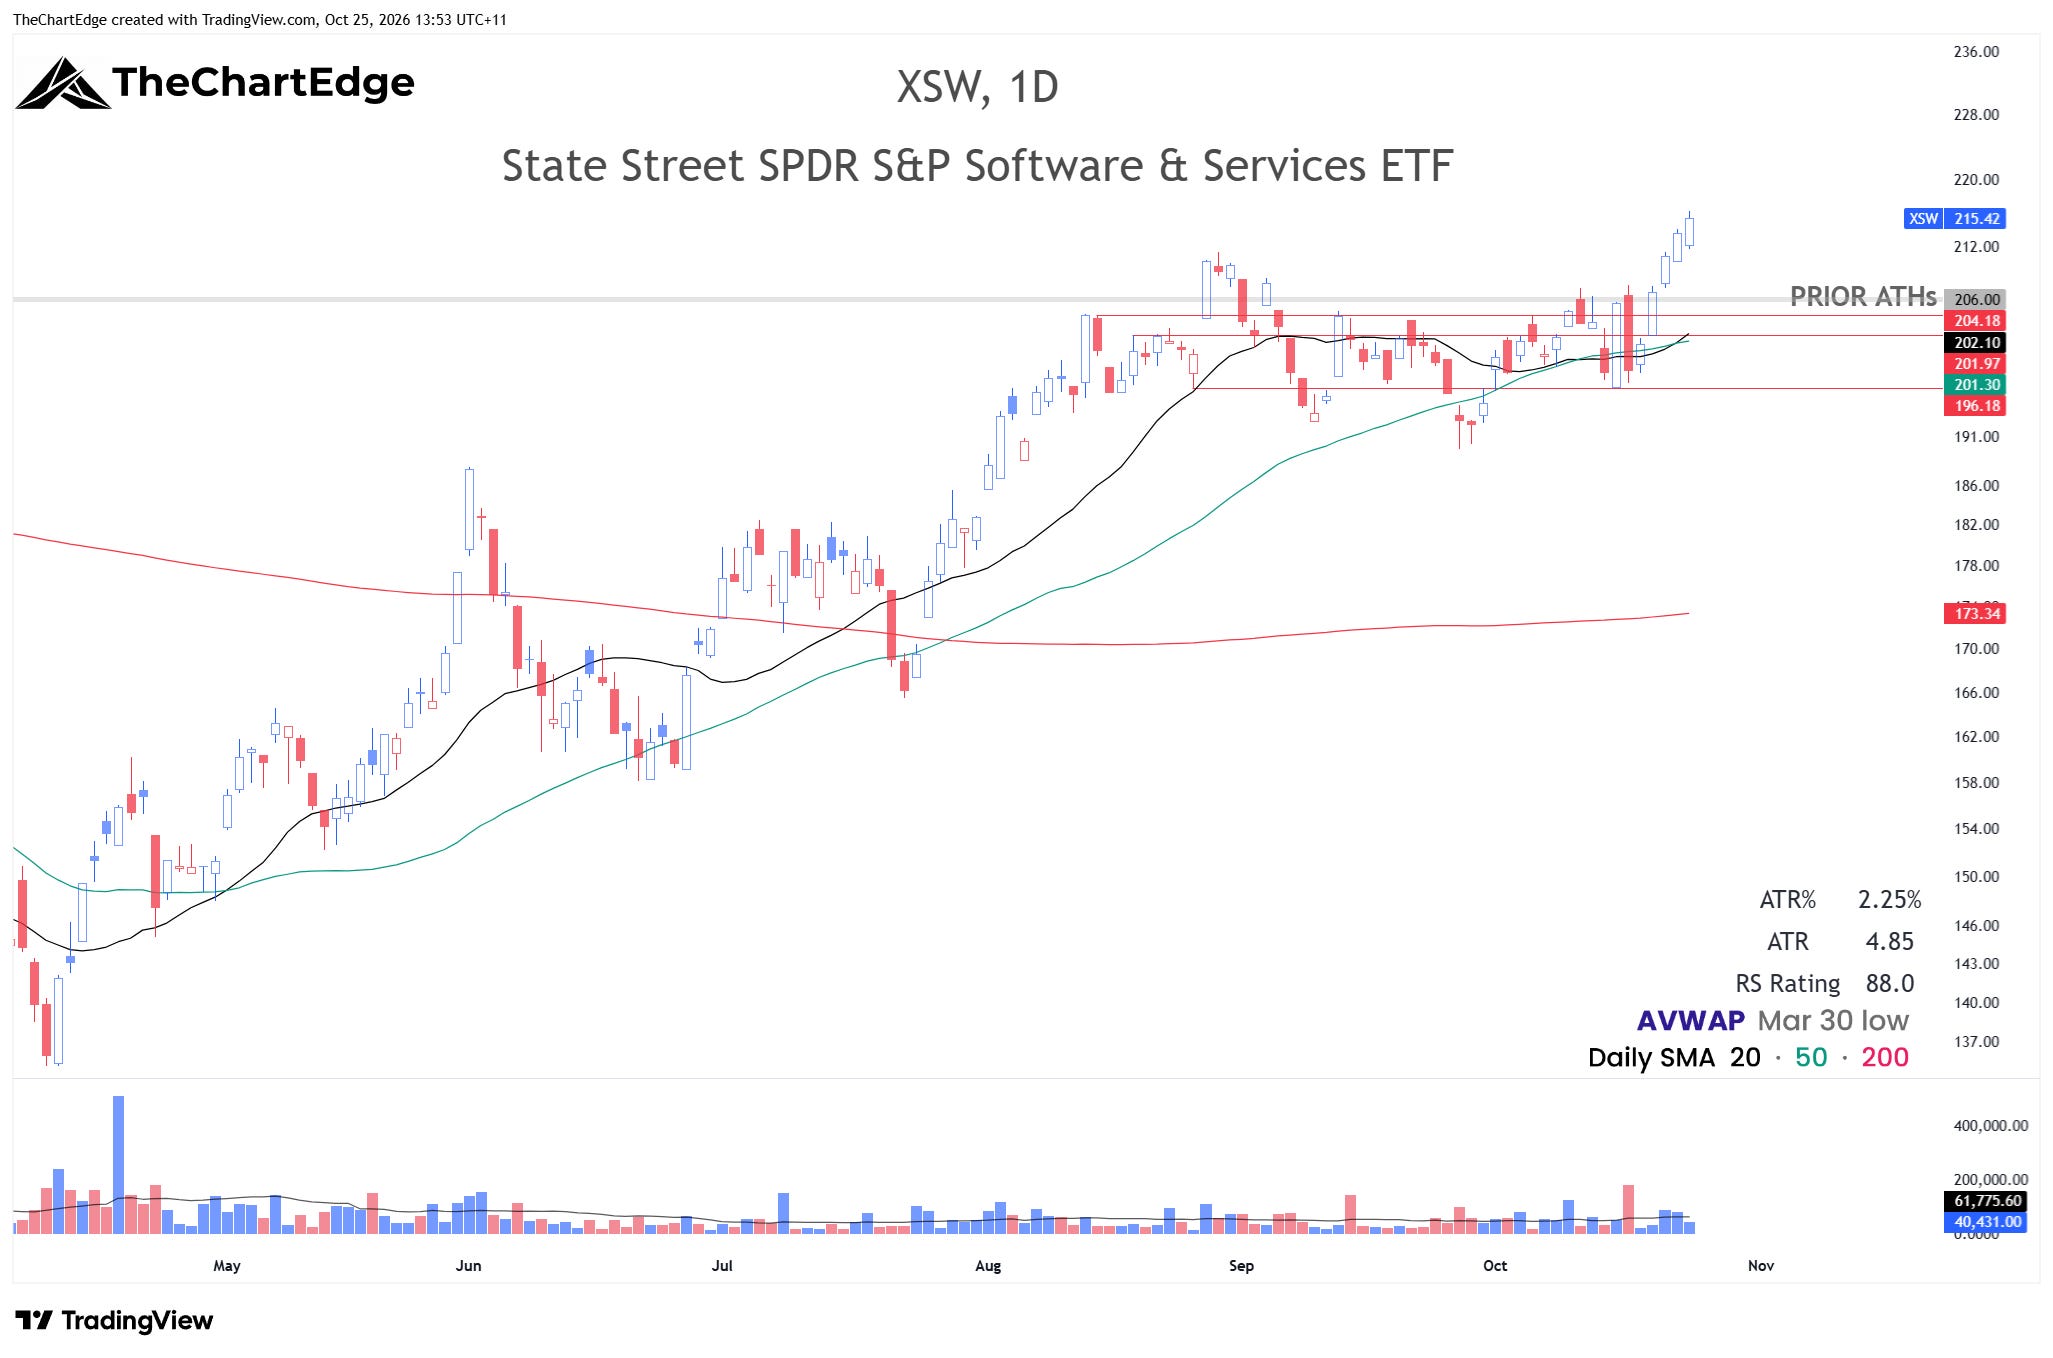
XSW broke out to new all-time highs last week, closing at 215.42. It’s too extended to buy here, nearly 3 x ATR above its 20-day SMA, but new all-time highs in this environment make it an area to keep an eye on.
Software (IGV) Chart
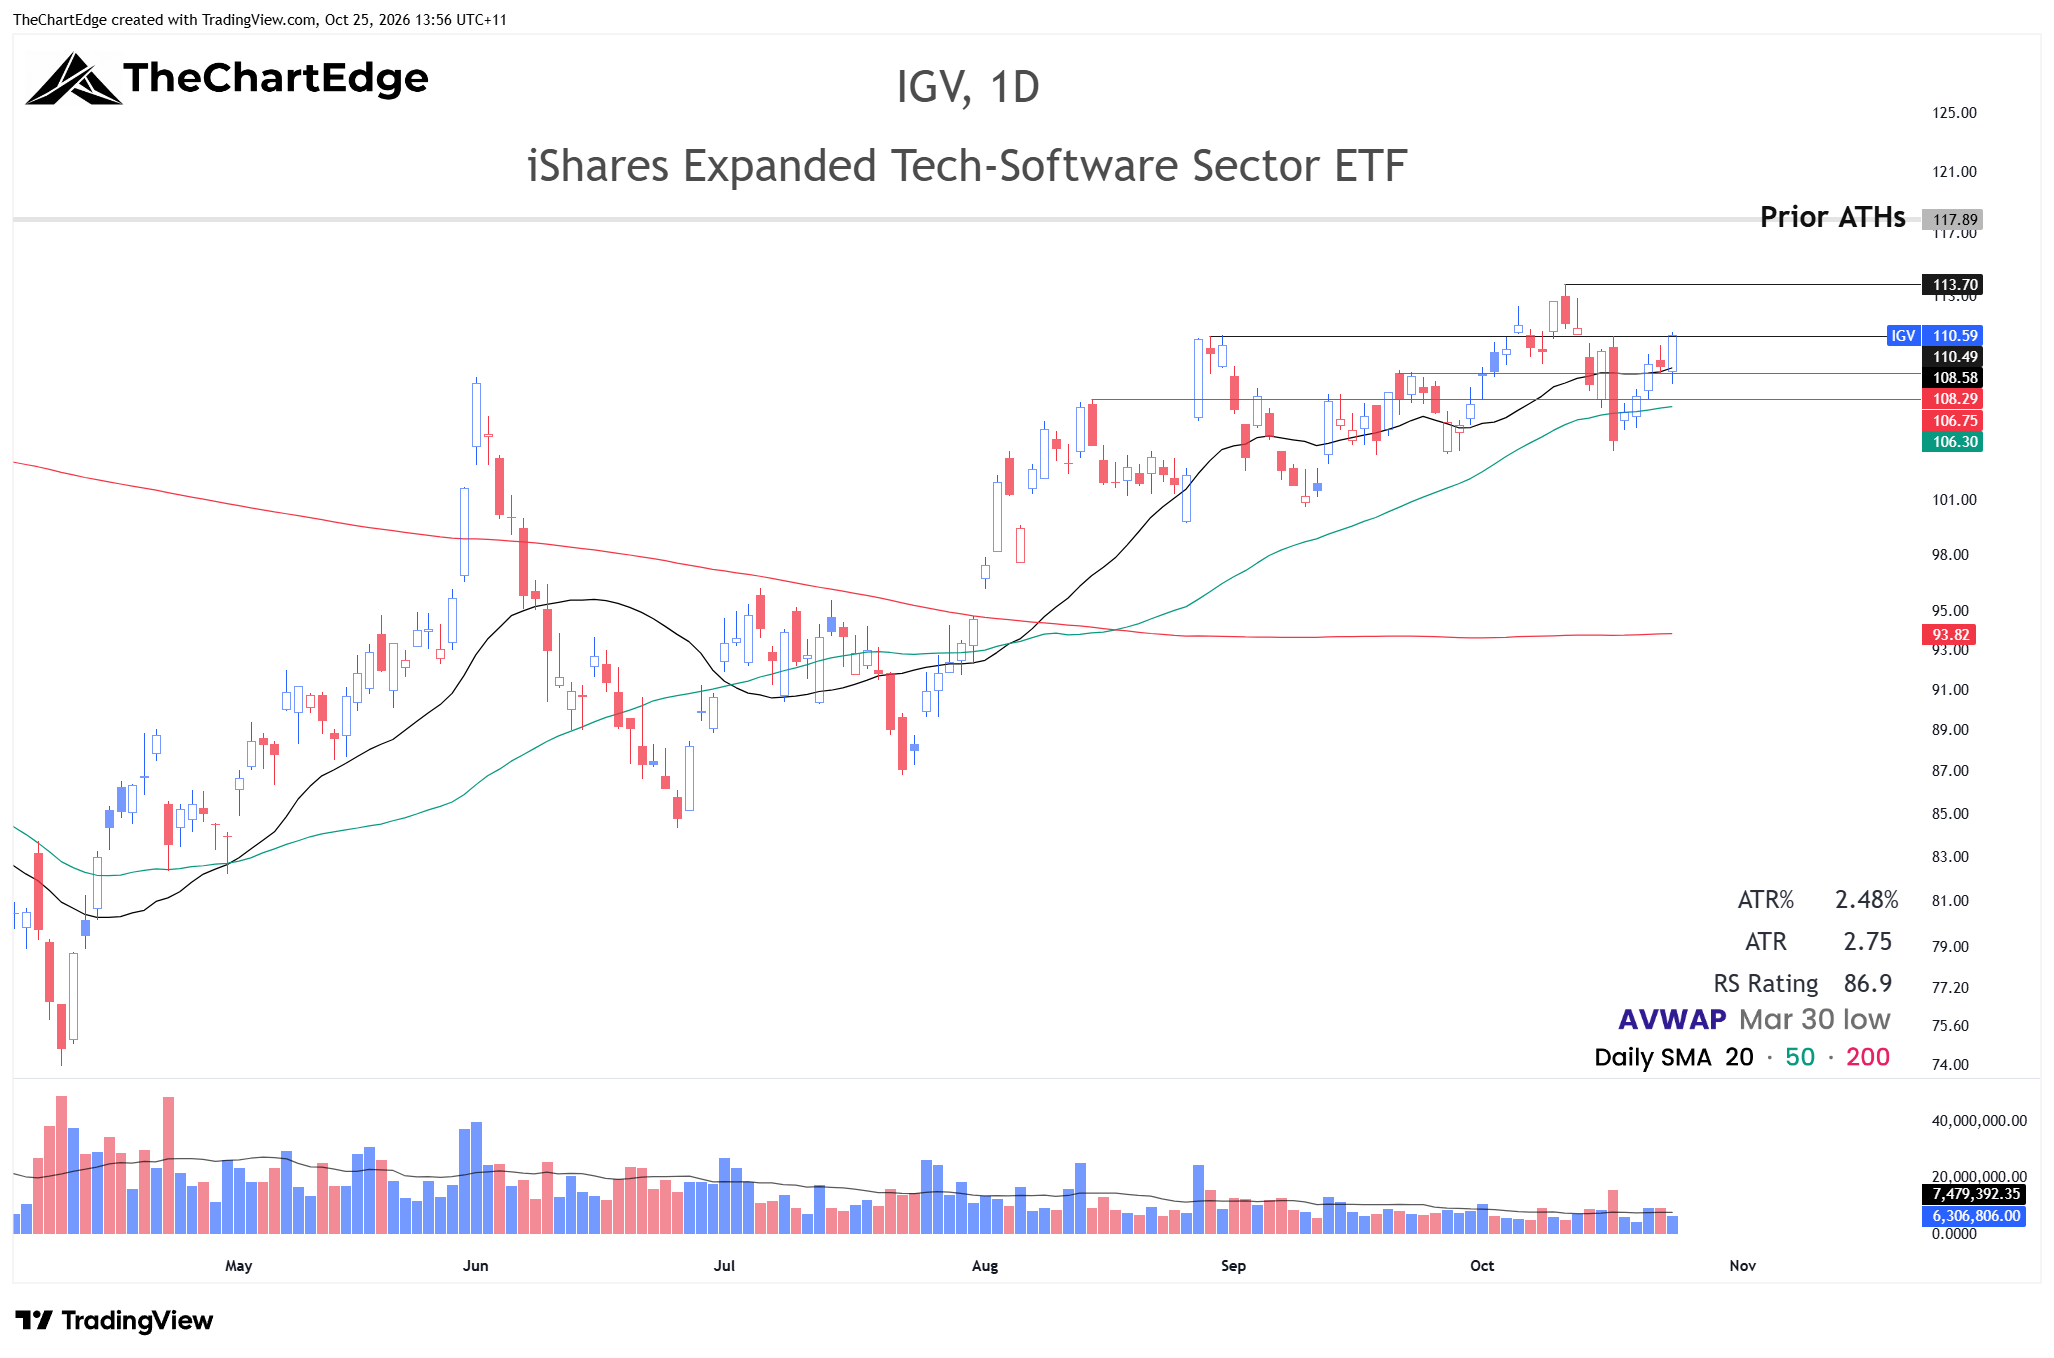
IGV closed at 110.59, just back at the 110.50 resistance level it broke above a few weeks ago, before failing and reversing. The trend is up, but it’s not particularly clean or smooth. I am not going to trade it, but I scanned for some individual software stocks that are showing relative strength and a cleaner trend. It will be interesting to see if IGV can clear 113.70 and make a run towards the all-time high, just under 118, on this second attempt.
Dynatrace (DT) Chart (reports November 3)
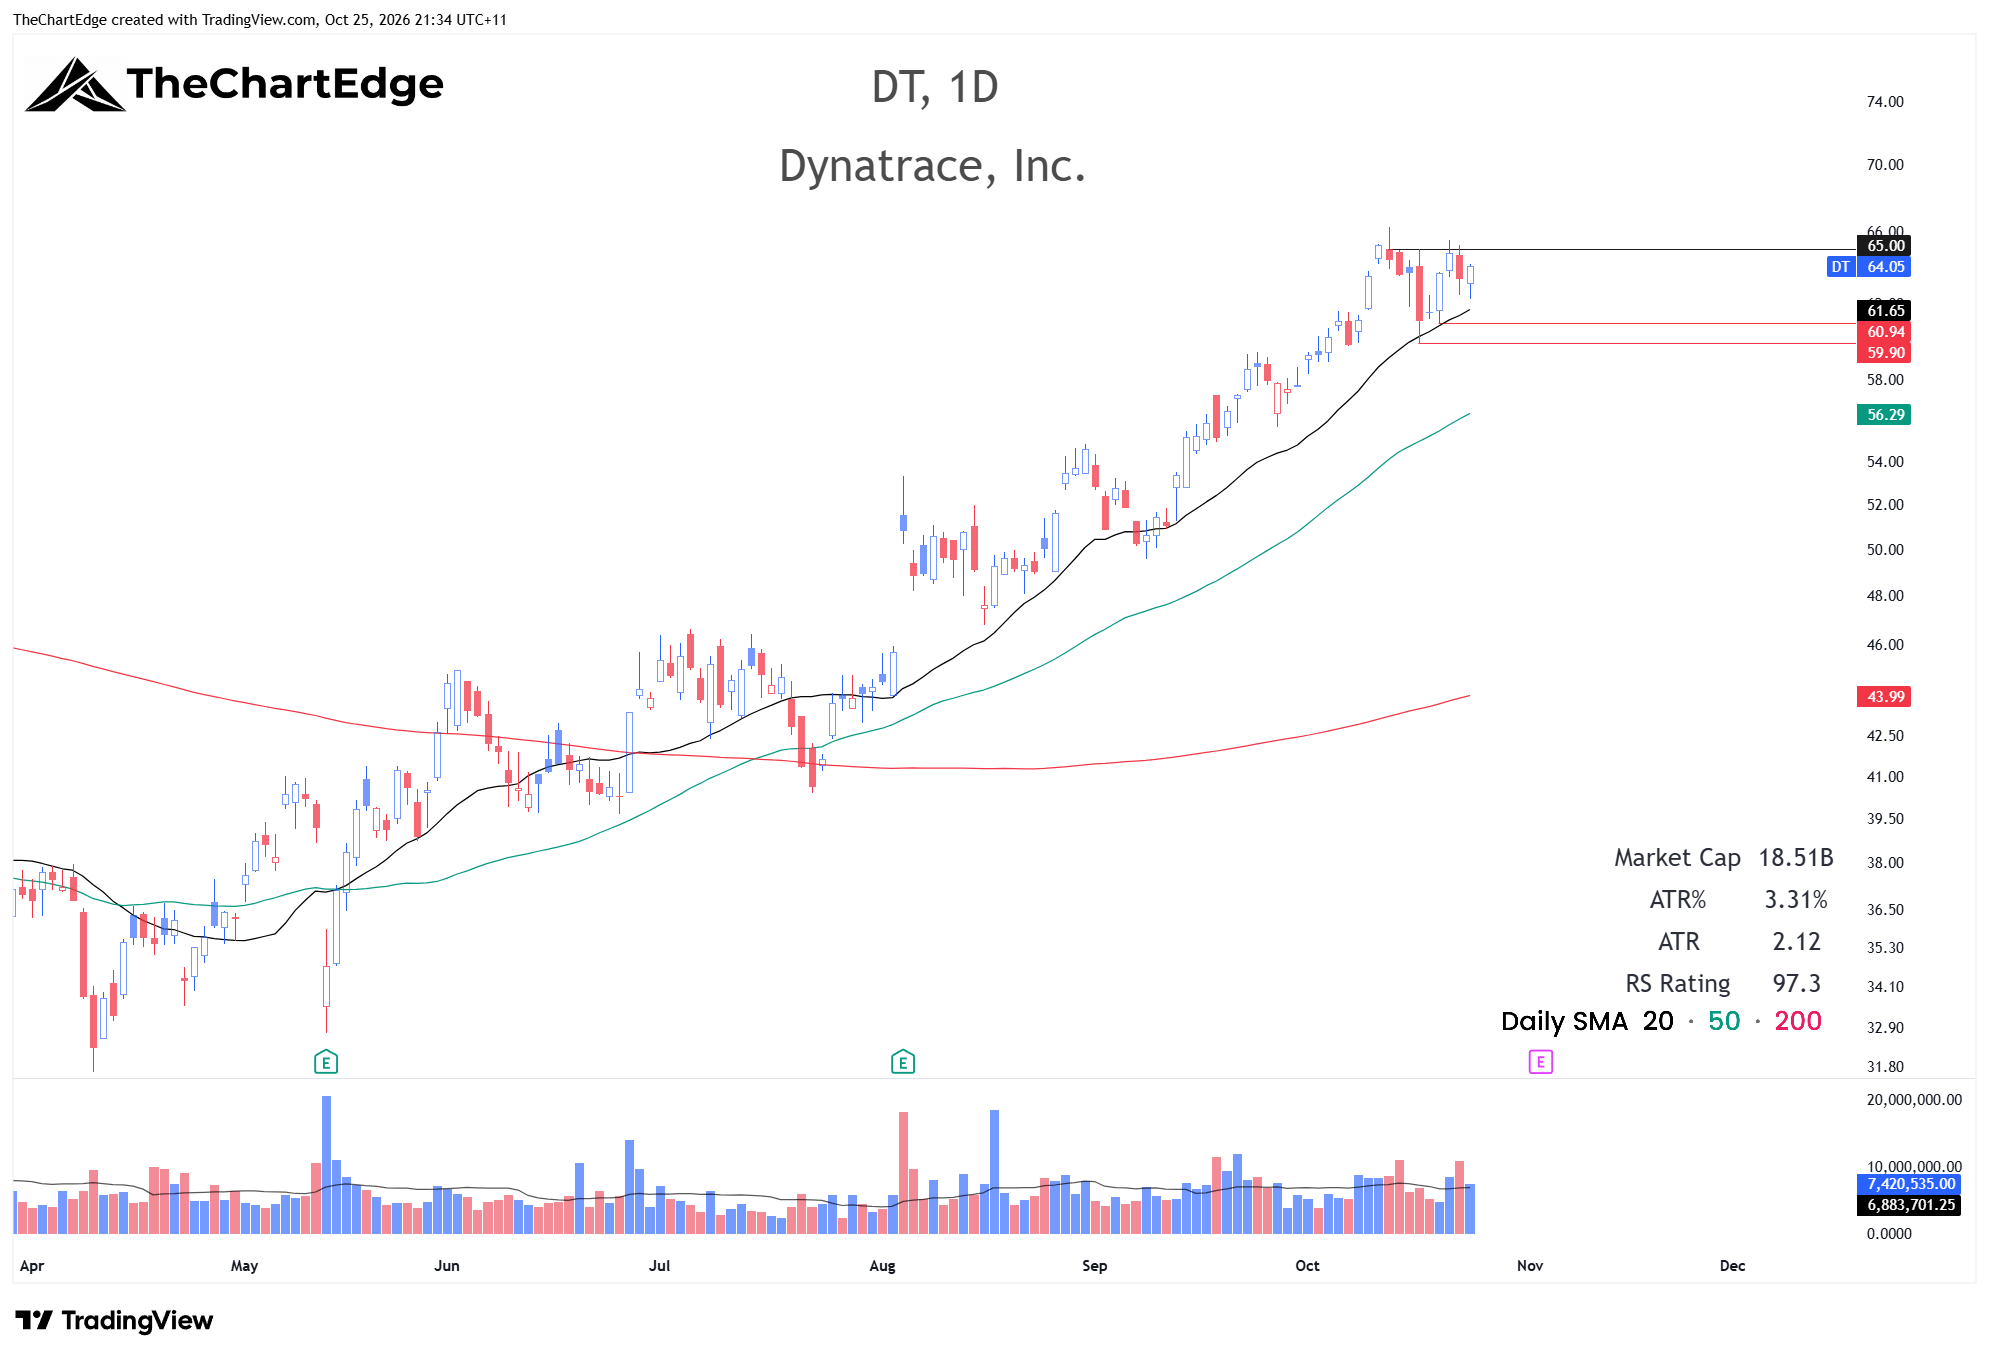
Dynatrace (application monitoring software) has been in a nice uptrend for a few months - pretty much holding its 20-day SMA on all pullbacks since August - but it can be a bit gappy. It closed at 64.05, 3.4% below its 52-week high but still about 20% off its all-time high around 80. If it can make a clean breakout on increased volume closing convincingly above 65, it could make a run towards that all-time high. If I were to trade this, I’d have my stop under 60.94 if being aggressive or more likely use the recent low from Oct 16 under 59.90 to give it a little more wiggle room. However, it has earnings on November 3, so unless it breaks out strongly in the next few days, I will likely just keep it on the watchlist. Those of you in the US who can be more tactical and agile with your entries and exits could potentially play it and get some cushion before next week. Unfortunately, that’s not something I can do regularly living in Australia, given the US market opens after midnight now we are on daylight saving. Looking at the stock’s previous moves after recent earnings it has tended to be quite volatile, so personally I’d want at least a 10% cushion to hold into earnings, which is a stretch given it reports next Tuesday.
GitLab (GTLB) Chart
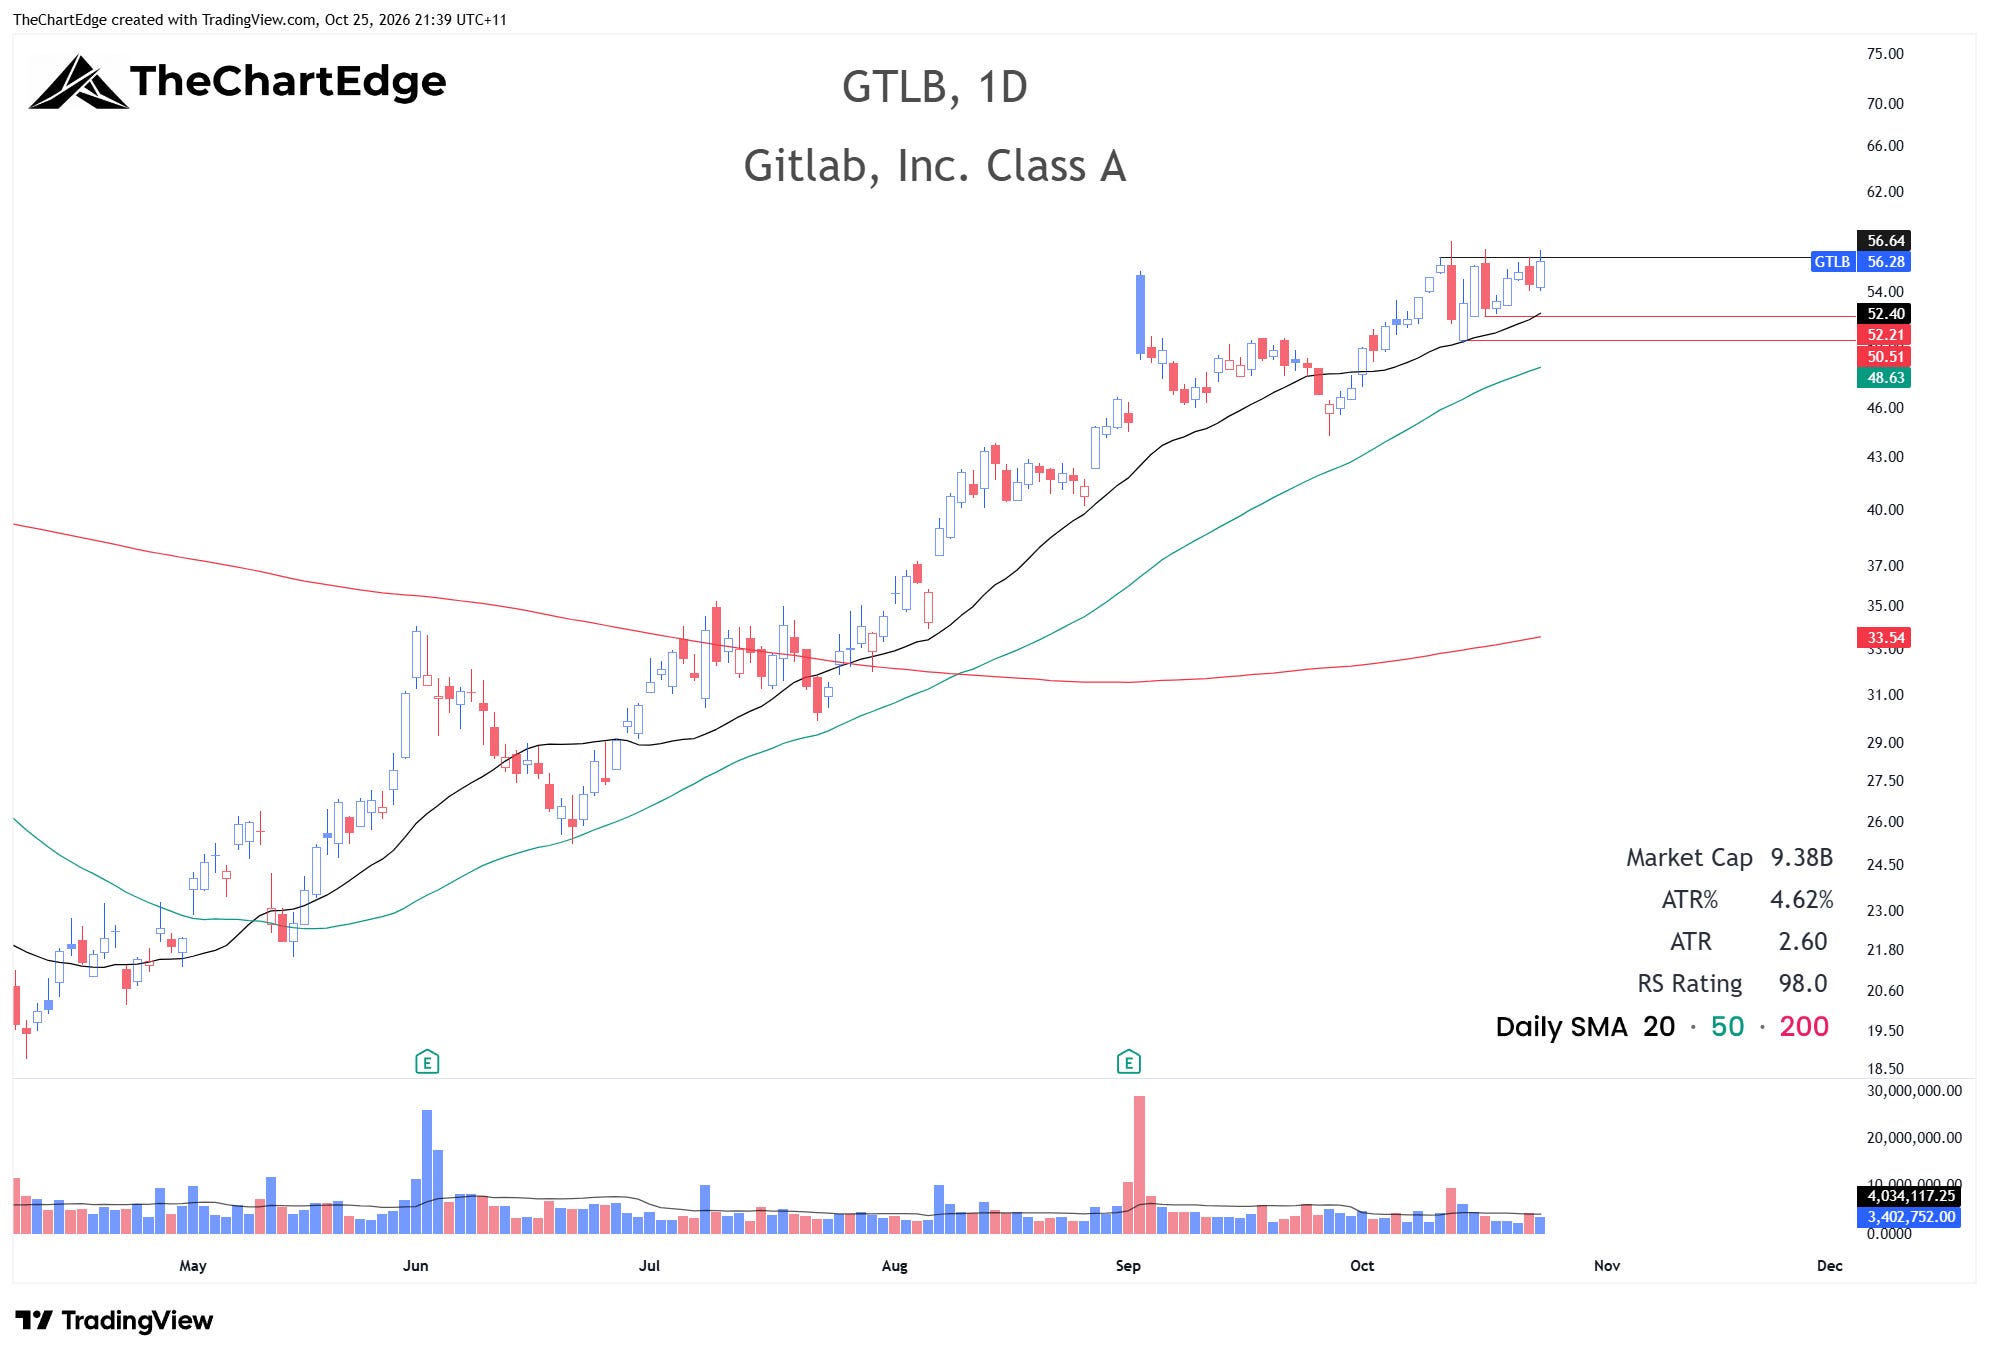
GitLab (the code-hosting platform) is still nearly 60% below its November 2021 all-time high, set shortly after it listed, which would usually have me saying, yeah, not really interested, but it has one of the cleaner recent uptrends of the IGV names and is pressing up against its 52-week highs. Zooming out, the 55 area has acted as both support and resistance before. A decisive breakout above the recent highs could open the way towards a run at 70. If I trade this one, the tightest stop I’d place is under 52.21, which is also below the 20-day SMA - but I’d prefer to give it a little more room with a stop under 50.51.
Semiconductors (SMH) Chart
Semiconductors (SMH) Chart (with volume profile)
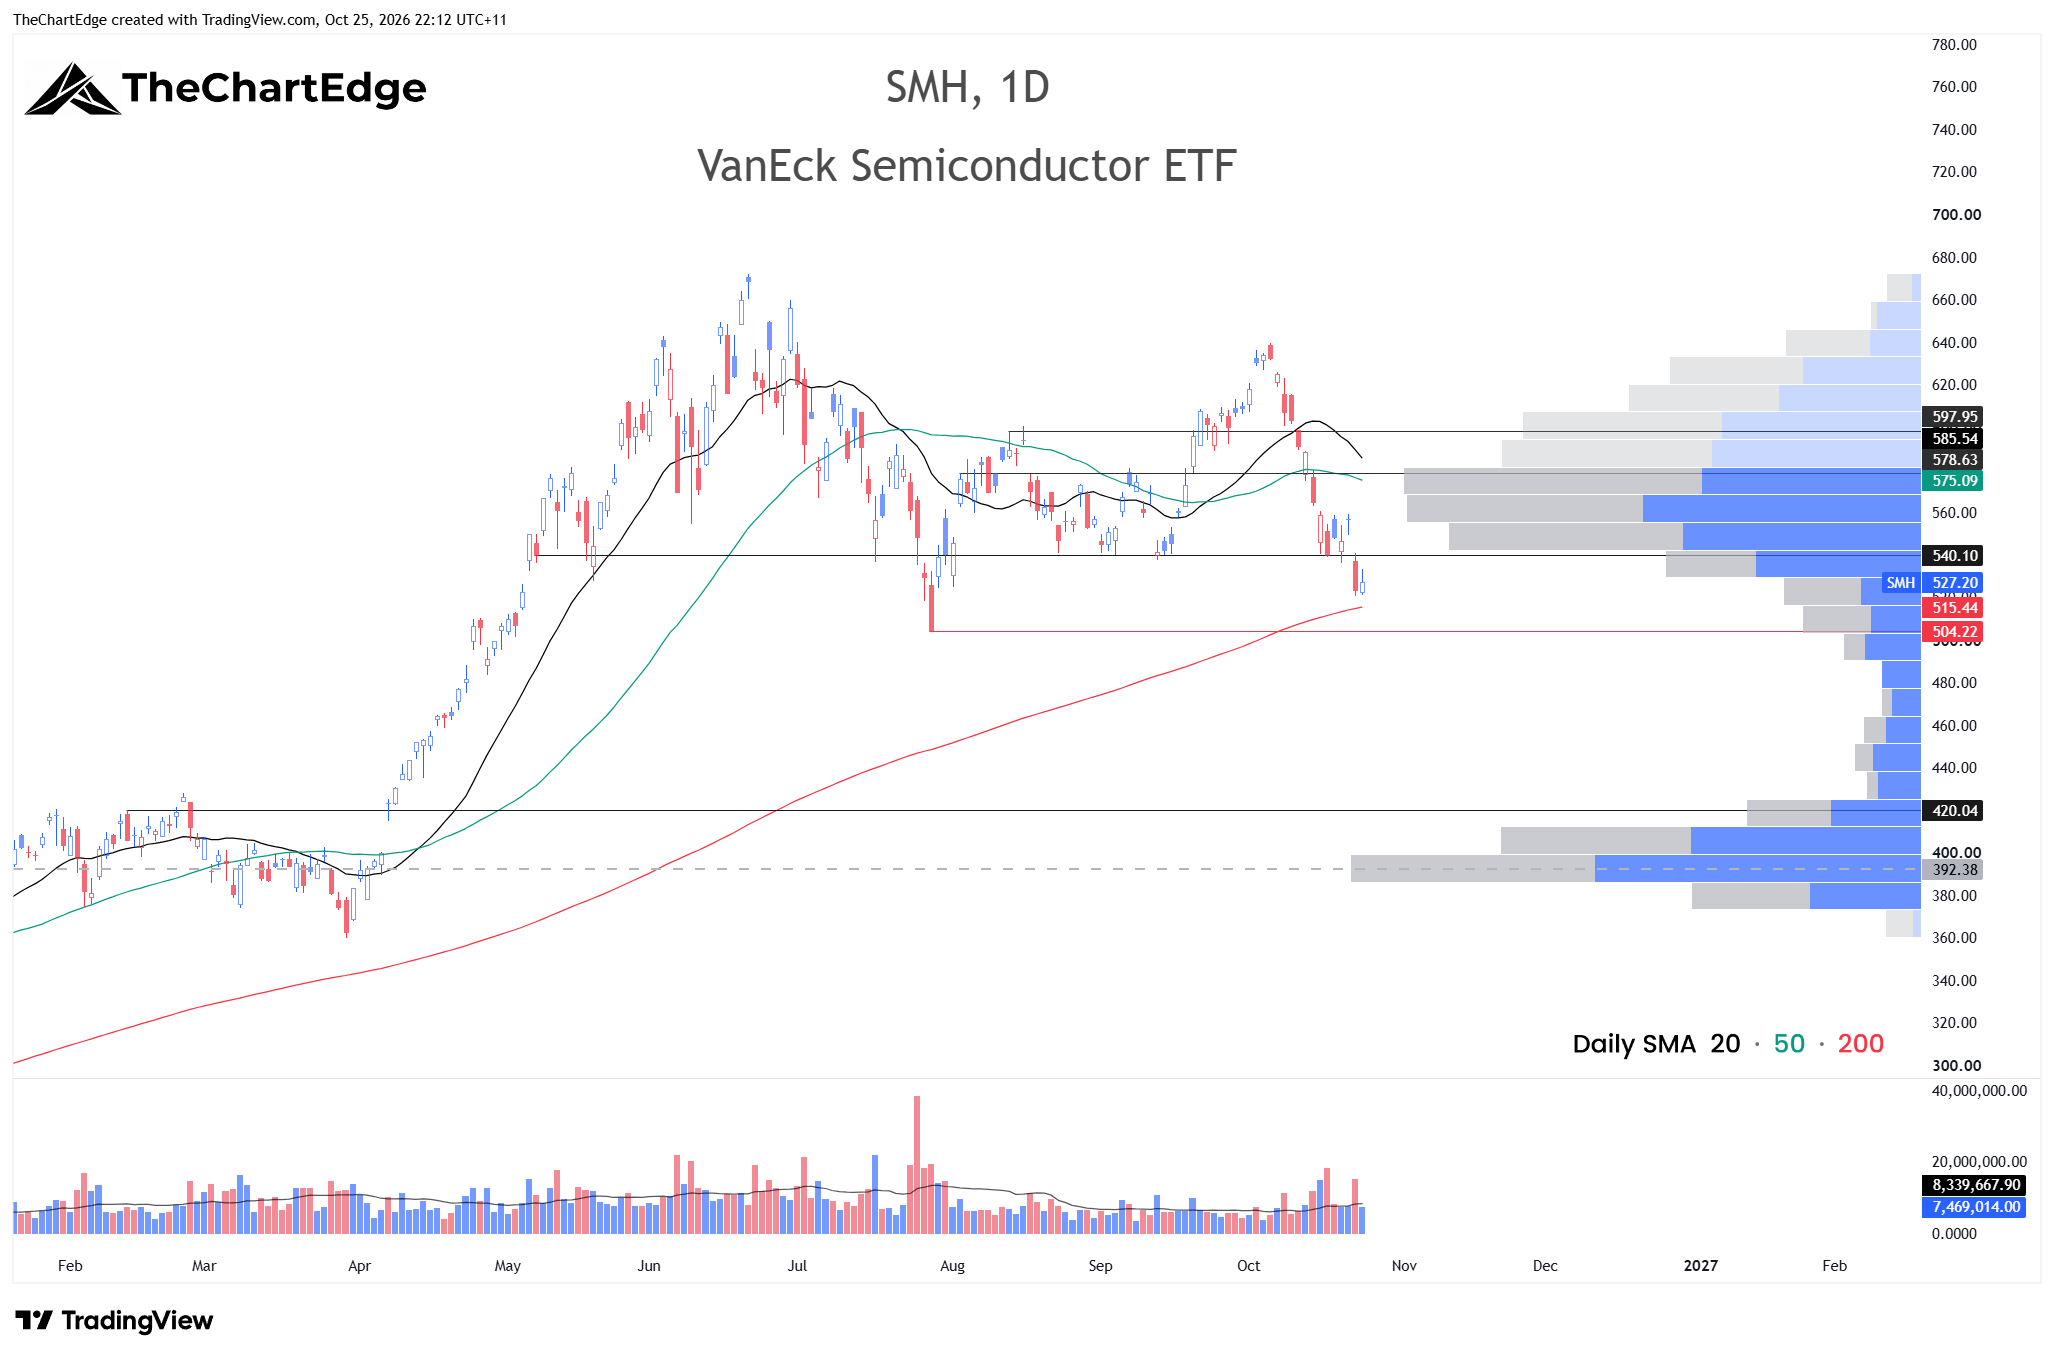
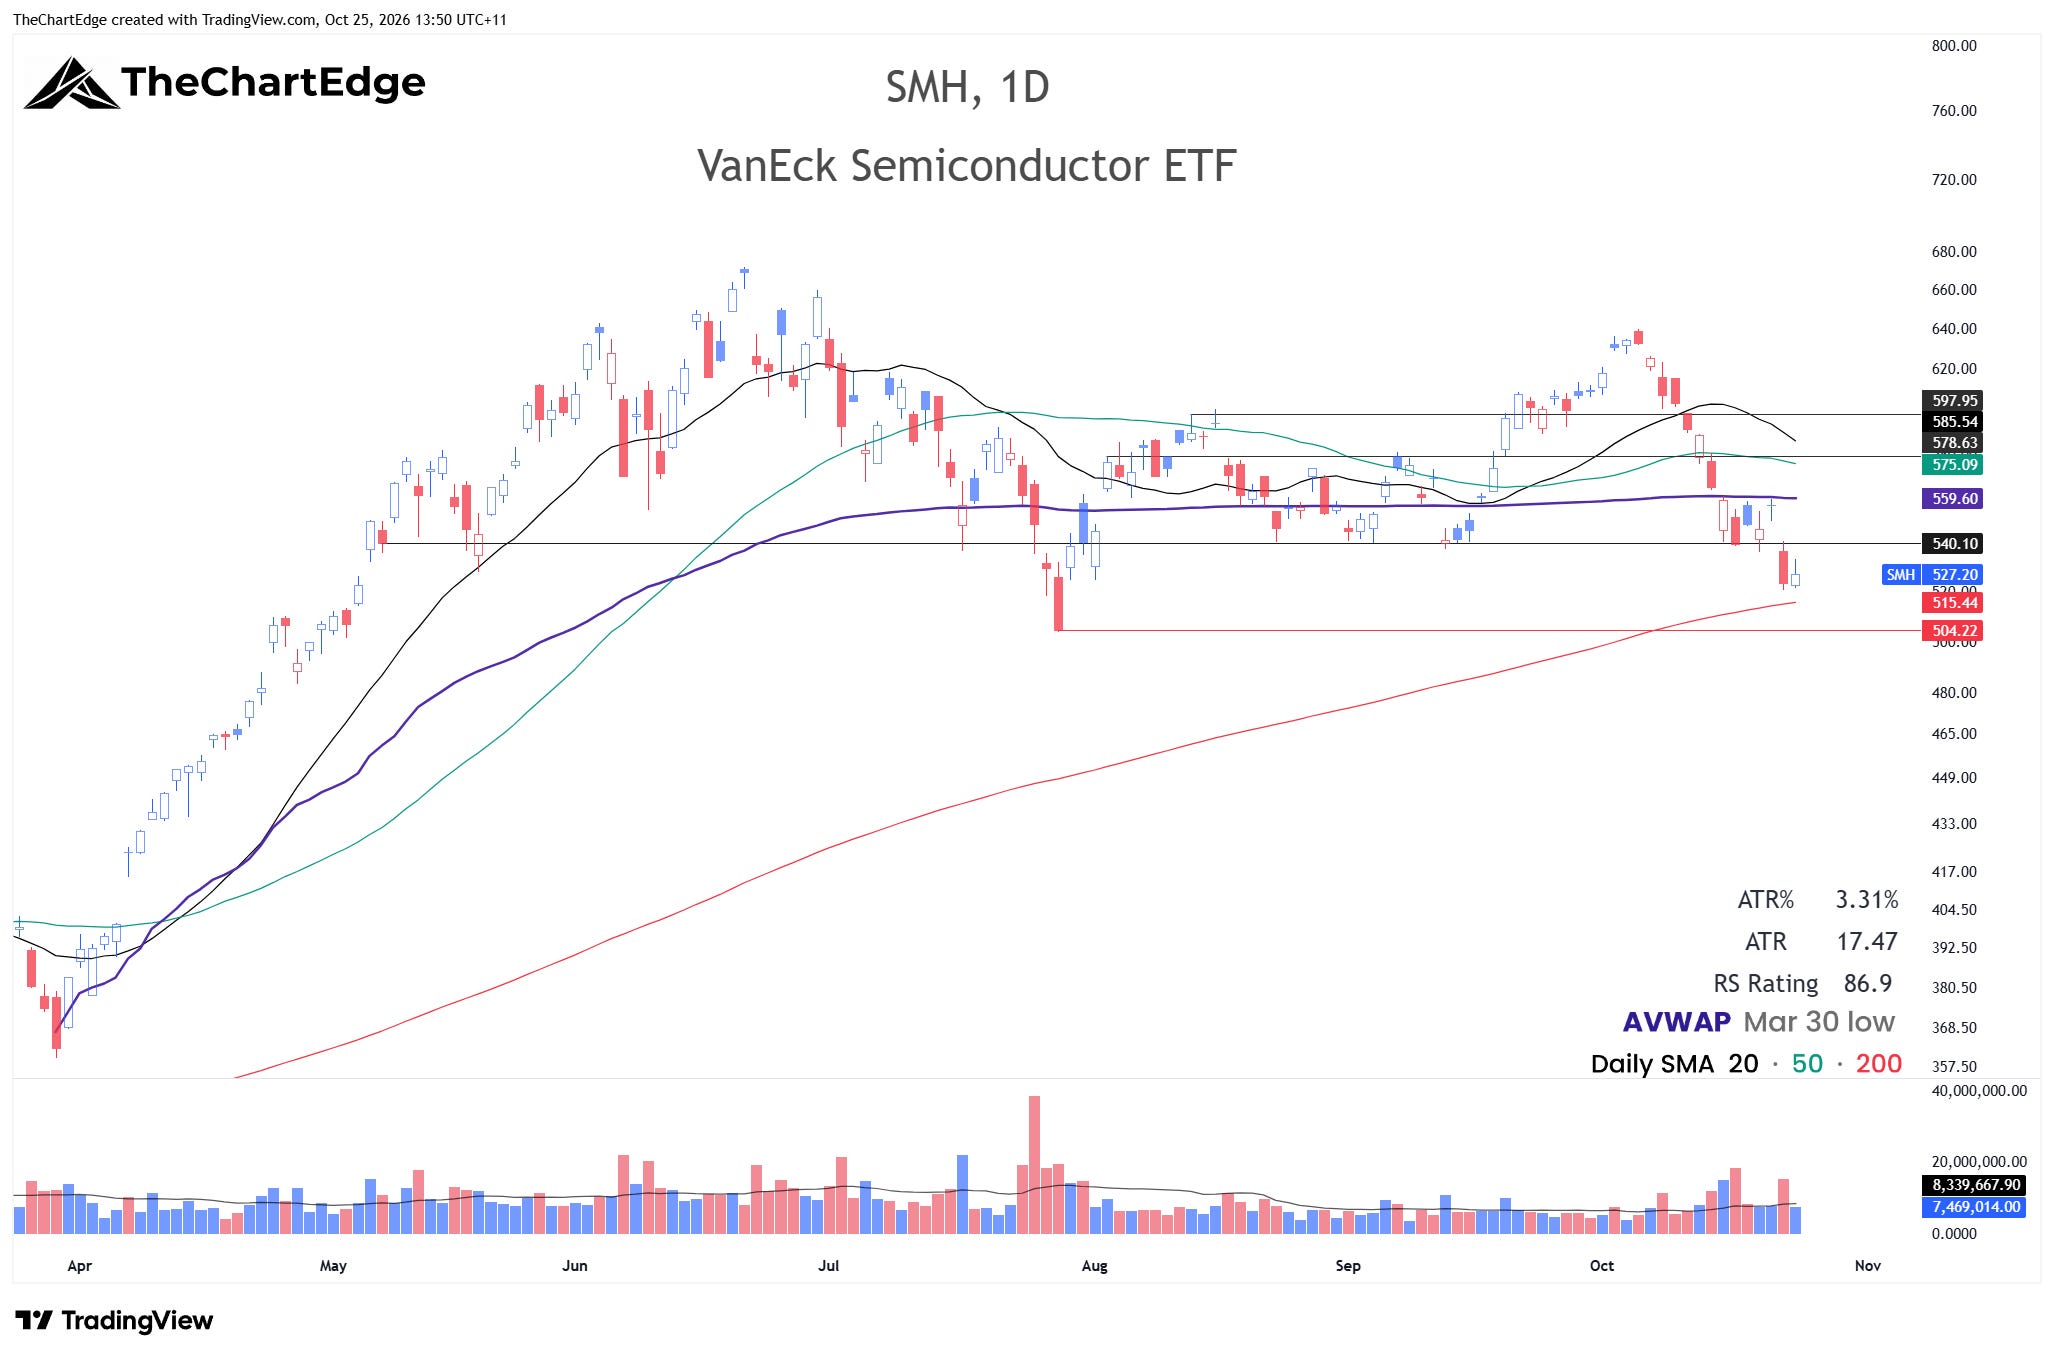
SMH closed at 527.20, below the 540 support I was watching last weekend and a few percent above the 200-day SMA. An undercut and reclaim of the 200-day SMA, currently around 515, or even the July 29 low at 504.22 could offer a good risk/reward entry, but I would consider it a bounce trade until proven otherwise due to the overhead supply. On the other hand, if it slices through these levels there isn’t much structure on the left-hand side of the chart between 420 and 500, nor much volume, as SMH ripped higher through this area during April and early May.
Earnings
Reactions to the earnings I flagged last weekend were generally bad. Meta (META), Lam Research (LRCX), Bloom Energy (BE) and MaxLinear (MXL) all sold off, and SpaceX (SPCX) gave back its initial pop. Tesla (TSLA) and Western Digital (WDC) both finished the week higher, but both lost ground after reporting.
Crypto
Not much of interest in crypto last week, so I won’t include the charts in this post.
Trades & Follow-Ups
I didn’t trade much last week, as was my plan. Just day traded oil and some equity indices a little bit.
The Week Ahead
The Market Temperature is still in the High Risk Zone. Breadth improved last week, but the strength was generally in software and defensives - health care, staples, real estate and utilities were all up, low volatility (SPLV) gained 1.3% while high beta (SPHB) lost 2.4%, and Anti-Beta (BTAL) rose 2.2%. Meanwhile, semis and AI hardware are still struggling. Like last week, I’m not actively looking to add new swing trades. DT and GTLB are on my watchlist, but they would need to make a very compelling breakout for me to trade either of them. Earnings season really heats up this week and the FOMC rate decision is also on Wednesday US time (early Thursday morning here). The Israeli election on Tuesday and the potential for further escalation in the Middle East add significantly to the level of uncertainty.
Stay open-minded and manage risk carefully.
Cheers,
Marcus Grant, CFTe
Disclaimer: The content provided in this newsletter is for informational and educational purposes only and should not be considered as financial, investment, or legal advice. It is general information only and does not take into account your objectives, financial situation or needs. The information shared is based on our research and analysis, but we are not a licensed financial advisor, nor can we guarantee its accuracy, completeness, or timeliness. Market conditions and financial instruments can change rapidly, and any opinions expressed may not be suitable for all investors. Any opinions expressed and/or securities mentioned do not constitute a recommendation to buy, sell, or hold that or any other security. You should conduct your own due diligence and consult with a licensed financial advisor or other professional before making any investment decisions. Past performance is not indicative of future results, and all investments carry the risk of loss. The authors and publishers of this newsletter are not responsible for any financial decisions made based on the content provided herein. By reading and/or subscribing to this newsletter, you acknowledge and agree that you are using the information at your own risk.