


Everything below is as of Friday August 21 close.
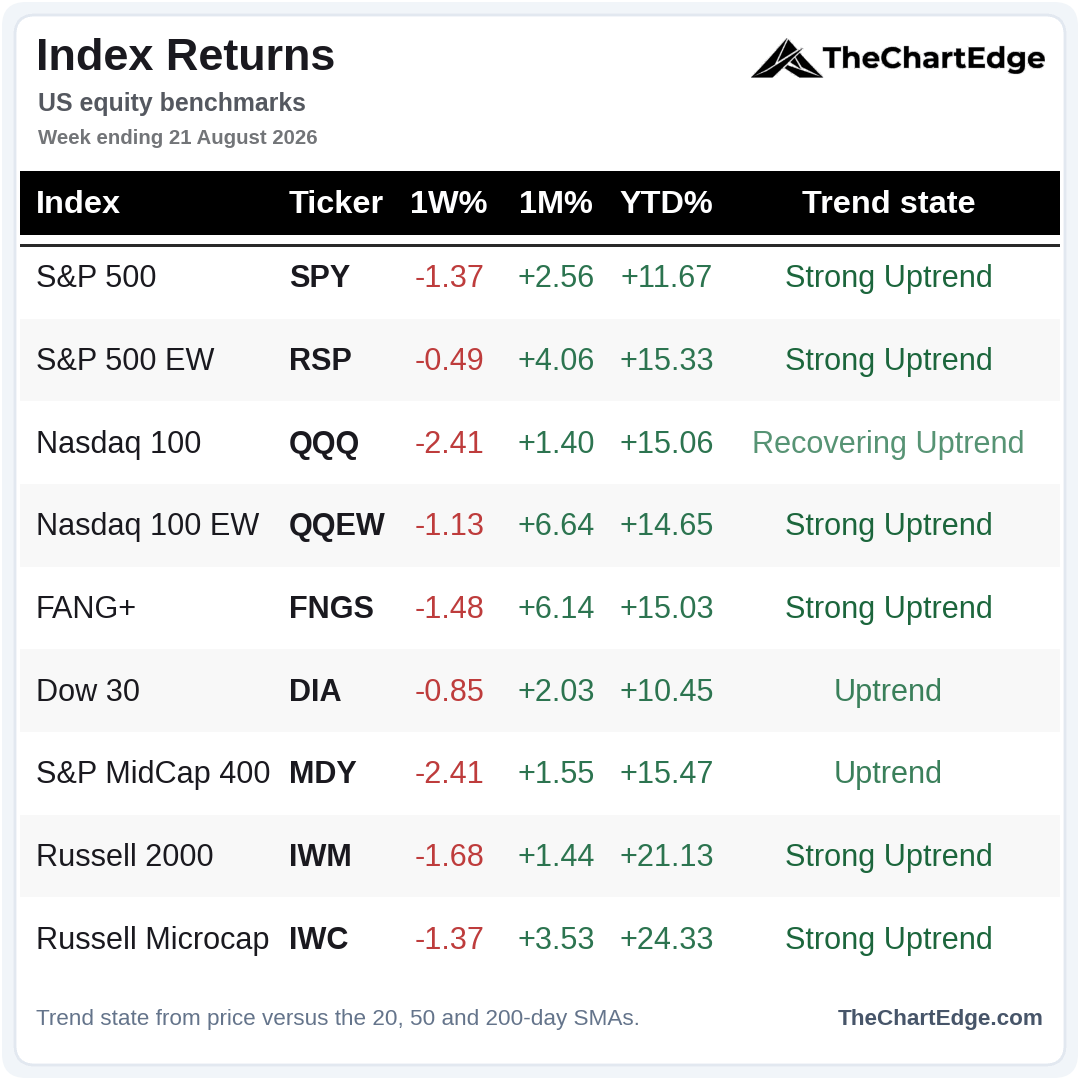
A red week for the indices across the board, but the pullbacks look relatively orderly so far.
SPY Chart
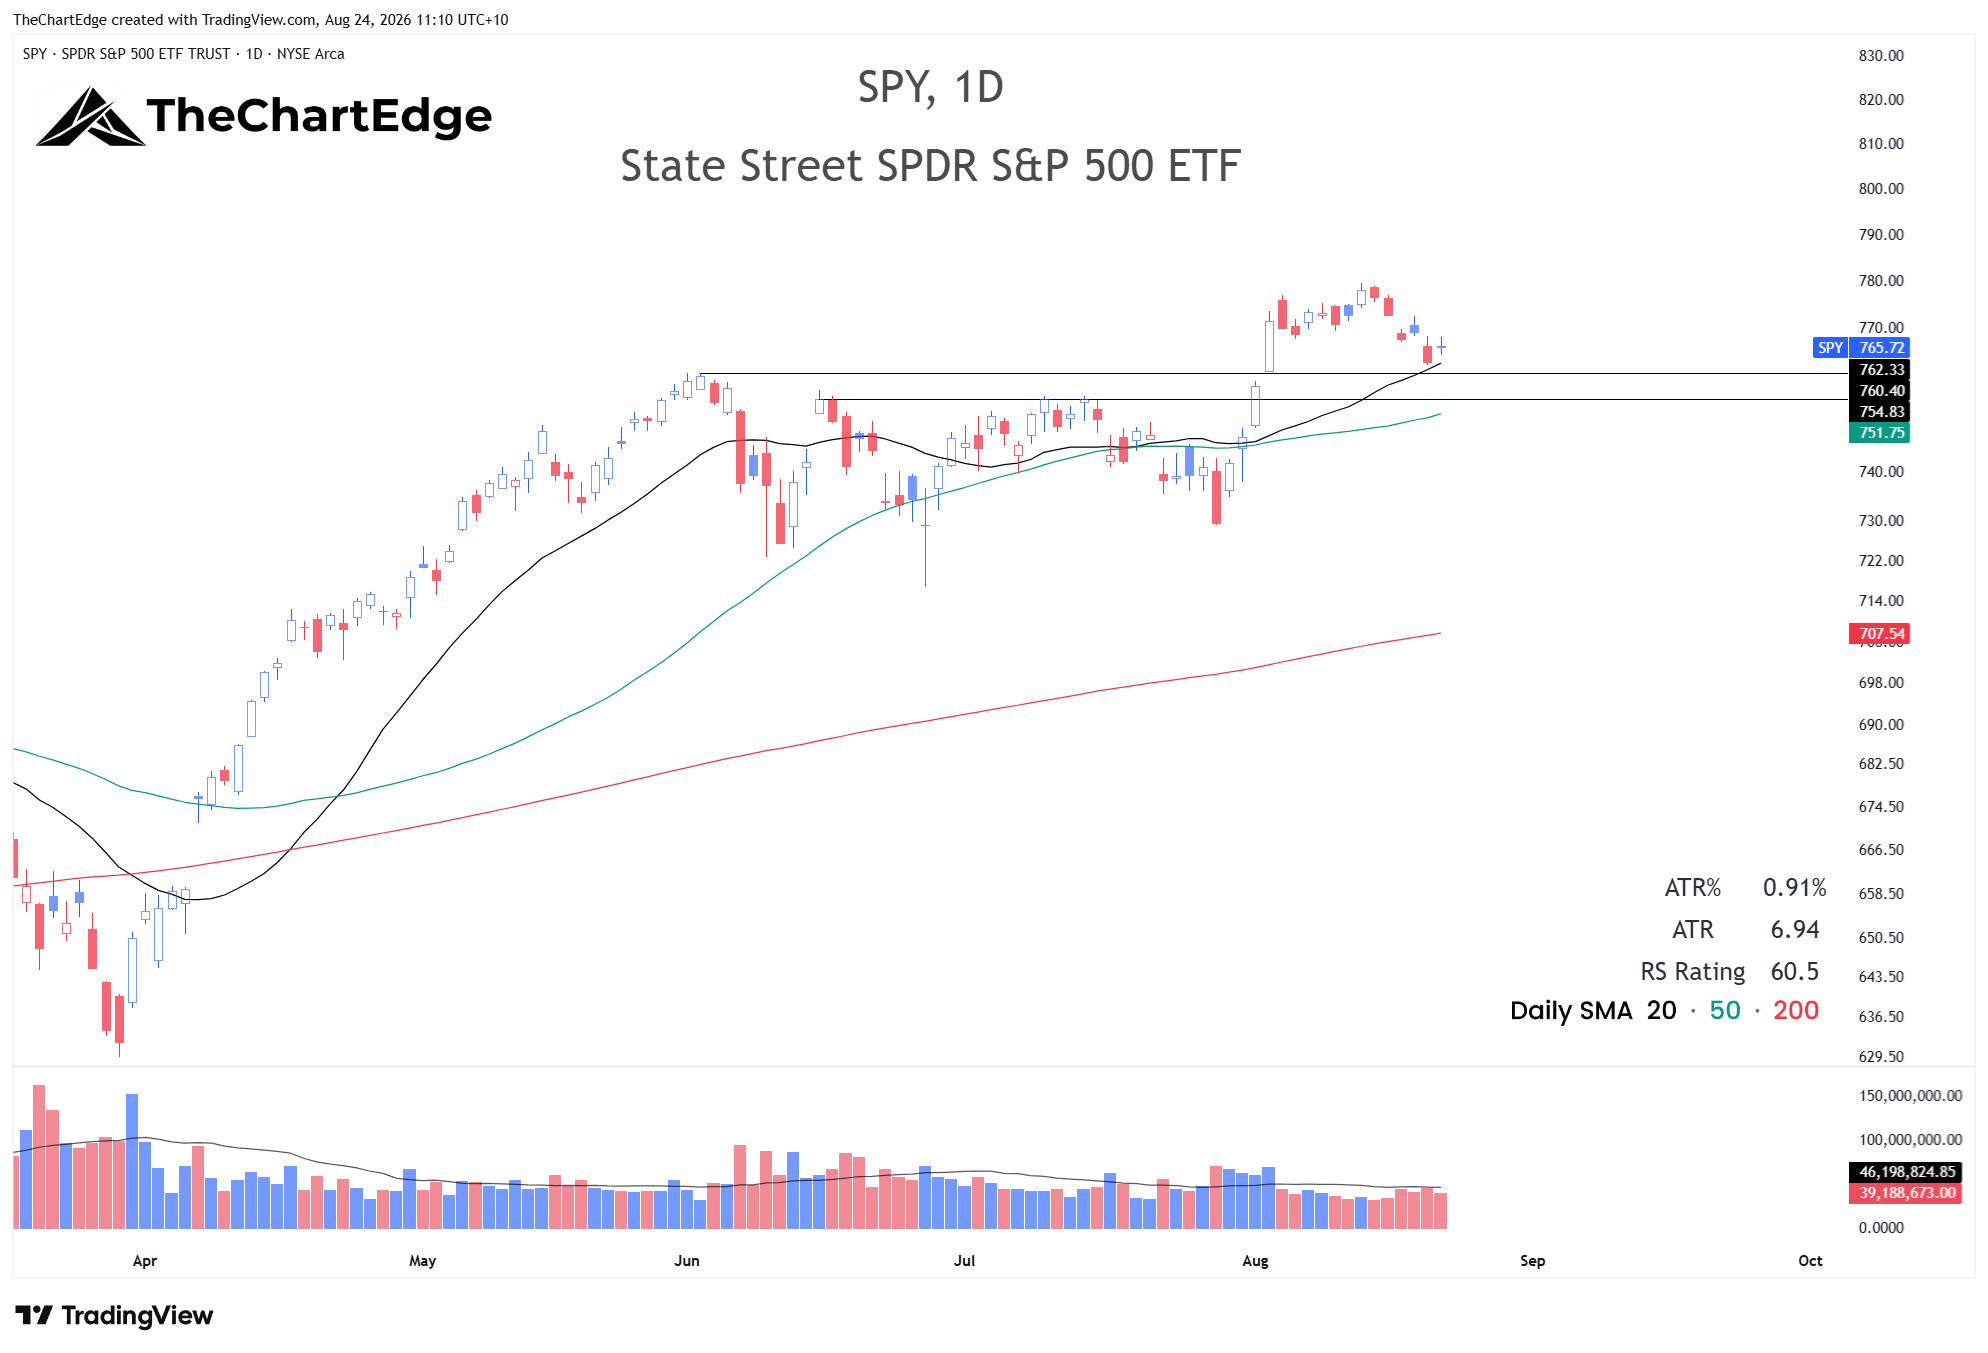
SPY closed at 765.72, 1.8% below its all-time high and still above both its 20 and 50-day SMAs. The 755-760 area I’ve been watching is now just under the 20-day SMA, which sits just above 762. I am planning on putting in a bid for the S&P 500 CFD at 7580, which equates to around 755 on SPY, with a stop under the 50-day - but want to give it a little room, so around 7495 or 745 on SPY.
If my bid doesn’t fill, and SPY bounces from the 20-day SMA or undercuts and reclaims it without reaching my level, I will reassess tomorrow.
QQQ Chart
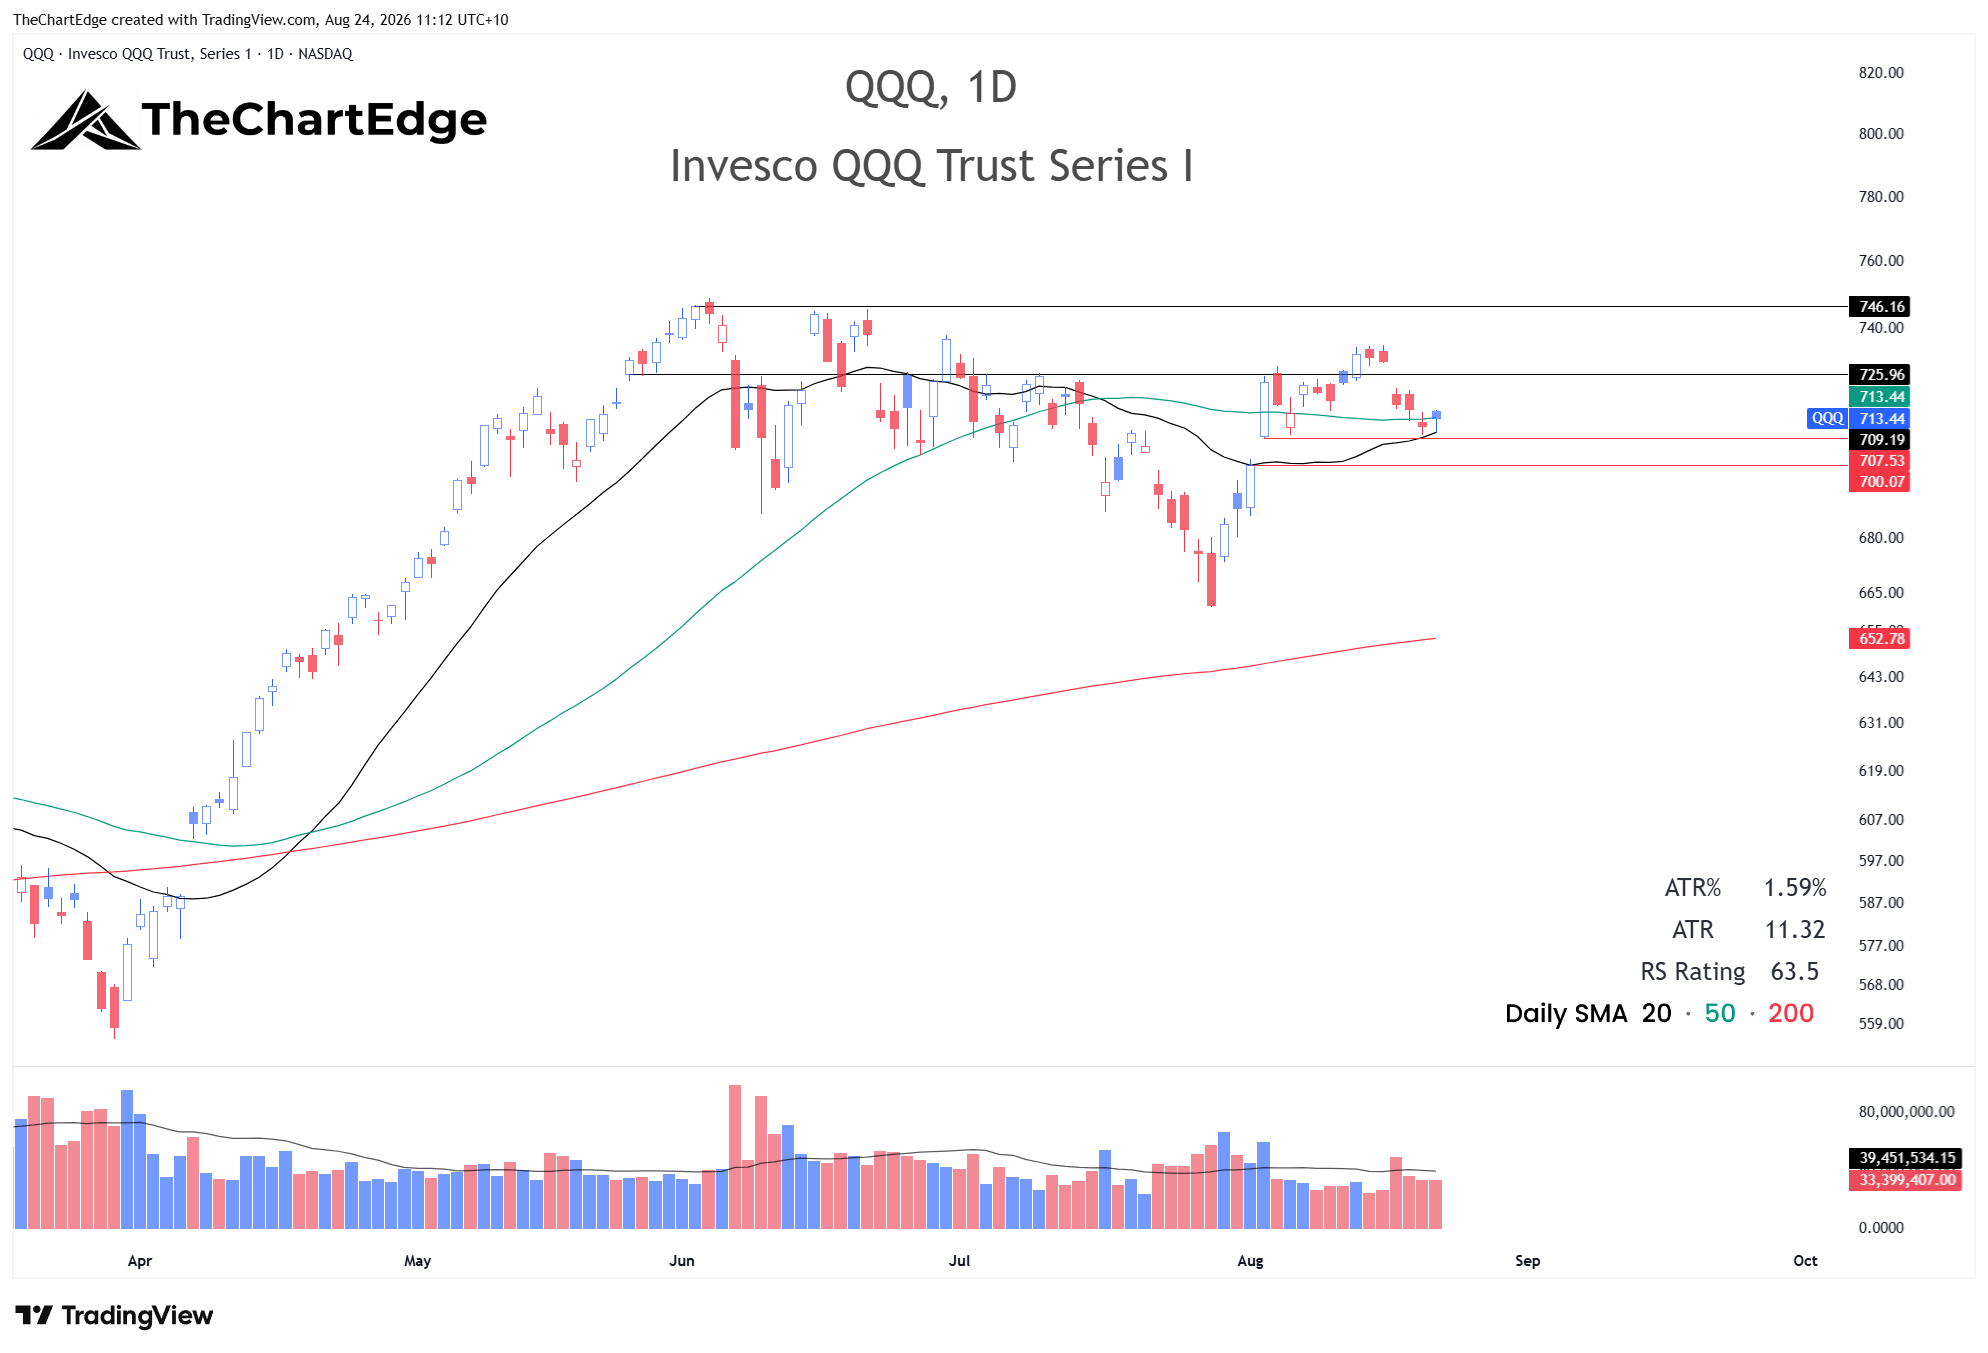
QQQ closed at 713.44, 4.7% below its early June all-time high and right on its 50-day SMA. However, the 20 and 50-day are still not bullishly aligned. I don’t plan to take a position in QQQ yet but will be watching to see if it holds 709 - if it does, I may also take a small position. If it fails to hold 709, then 700 is my line in the sand. Below 700 I believe it opens the possibility of a deeper pullback to retest the July 29 low around 661. That would also be confluence with a rising 200-day SMA, which currently sits just under 653.
Market Temperature
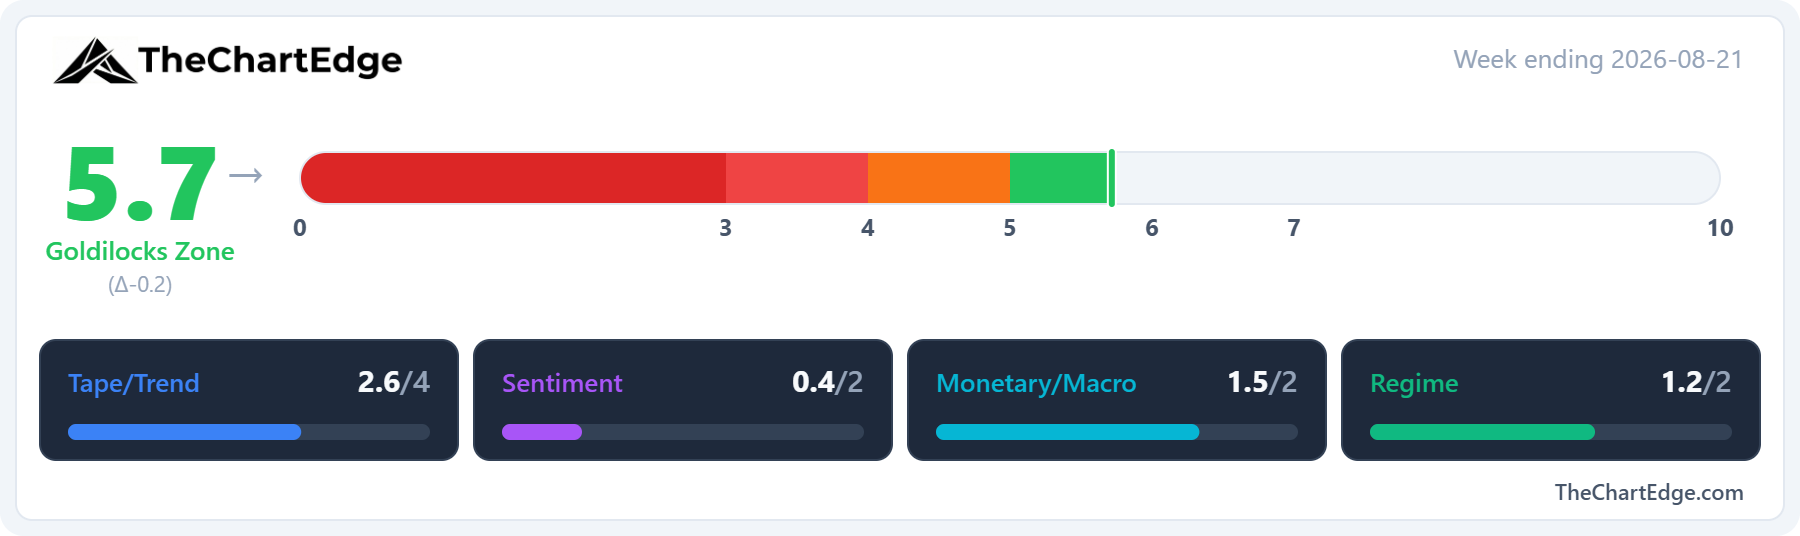
The Market Temperature came in at 5.7, down from 5.9, a third straight week in the Goldilocks Zone.
The Tape/Trend pillar accounted for the whole decline. Breadth declined, with 56.2% of US stocks above their 50-day moving average, from 62.6%, and SPY’s weekly RSI eased to 63.1 from 67.8. SPY and QQQ both held their trend states.
The Monetary/Macro pillar rose slightly due to continued weakness in the dollar.
The Regime pillar also improved a touch. However, the discretionary vs staples ratio scored higher almost entirely due to the model’s four-week lookback - the XLY/XLP ratio itself was flat on the week.
The VIX edged up to 15.1 from 14.3, which the model reads as a contrarian positive, so Sentiment rose fractionally, but was unchanged to one decimal place.
GICS Sector Relative Strength
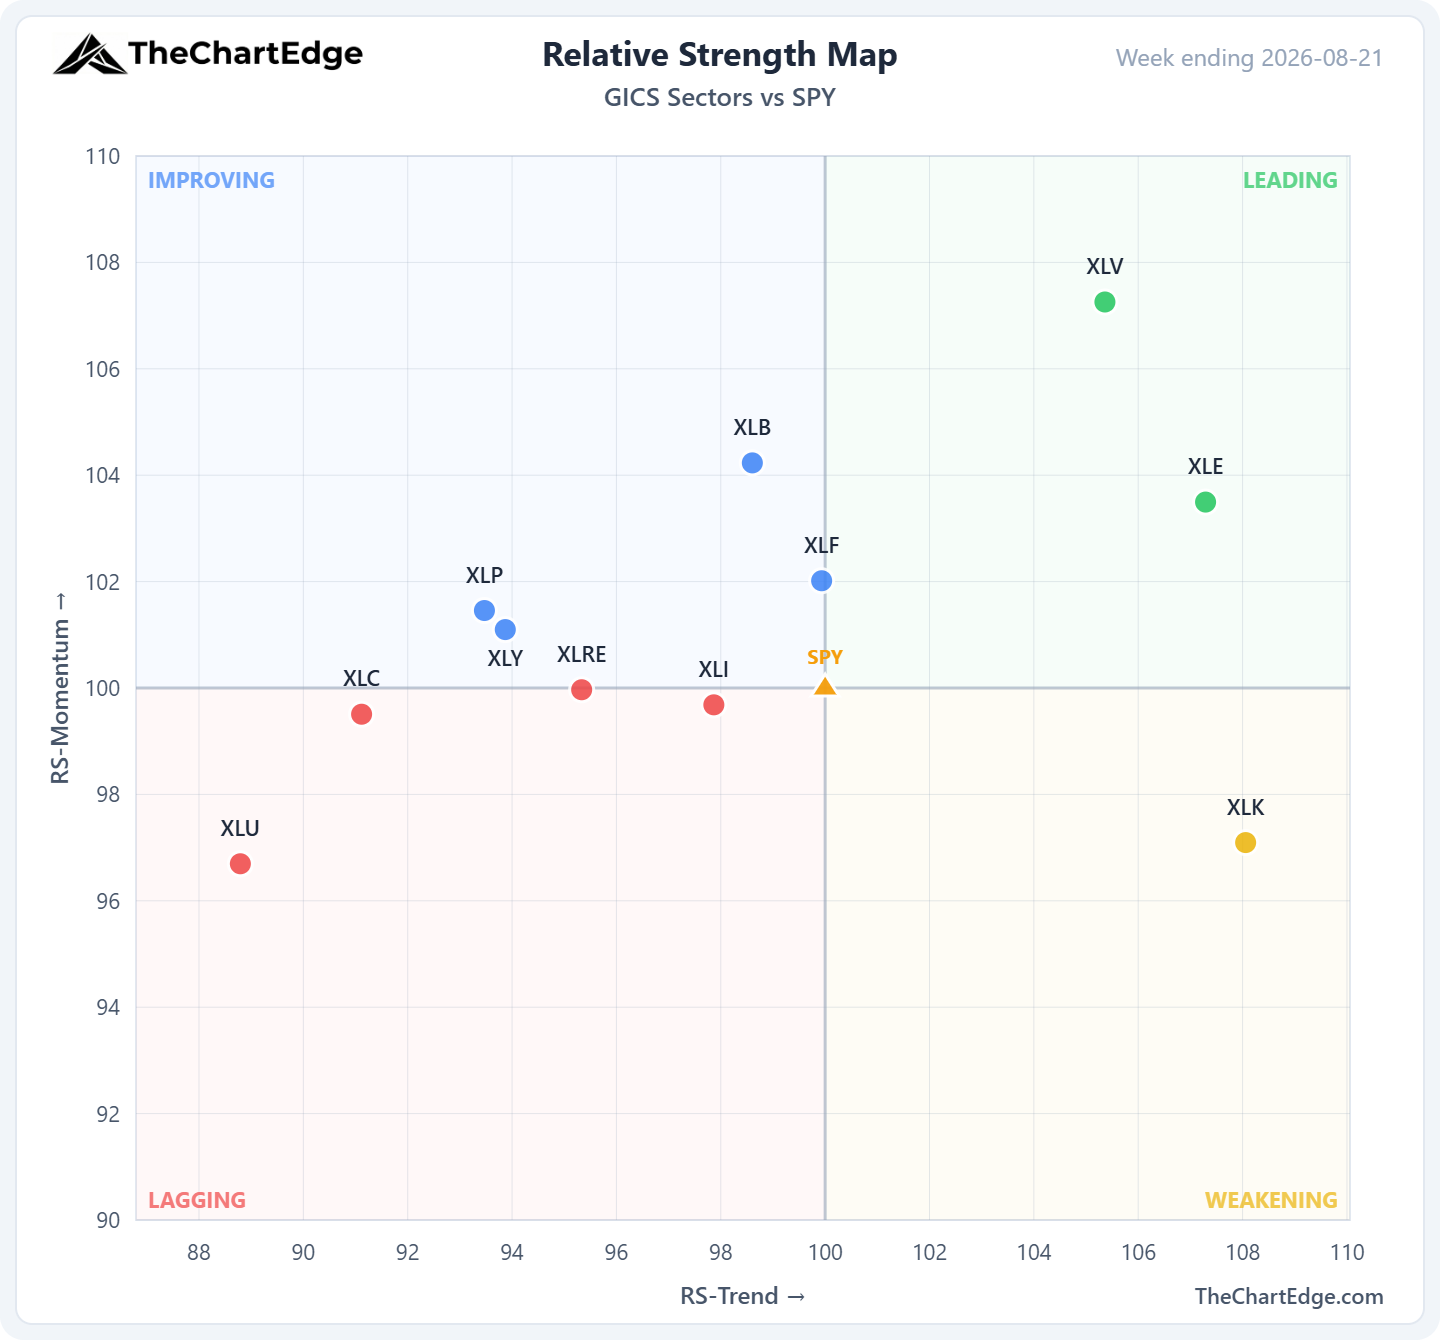
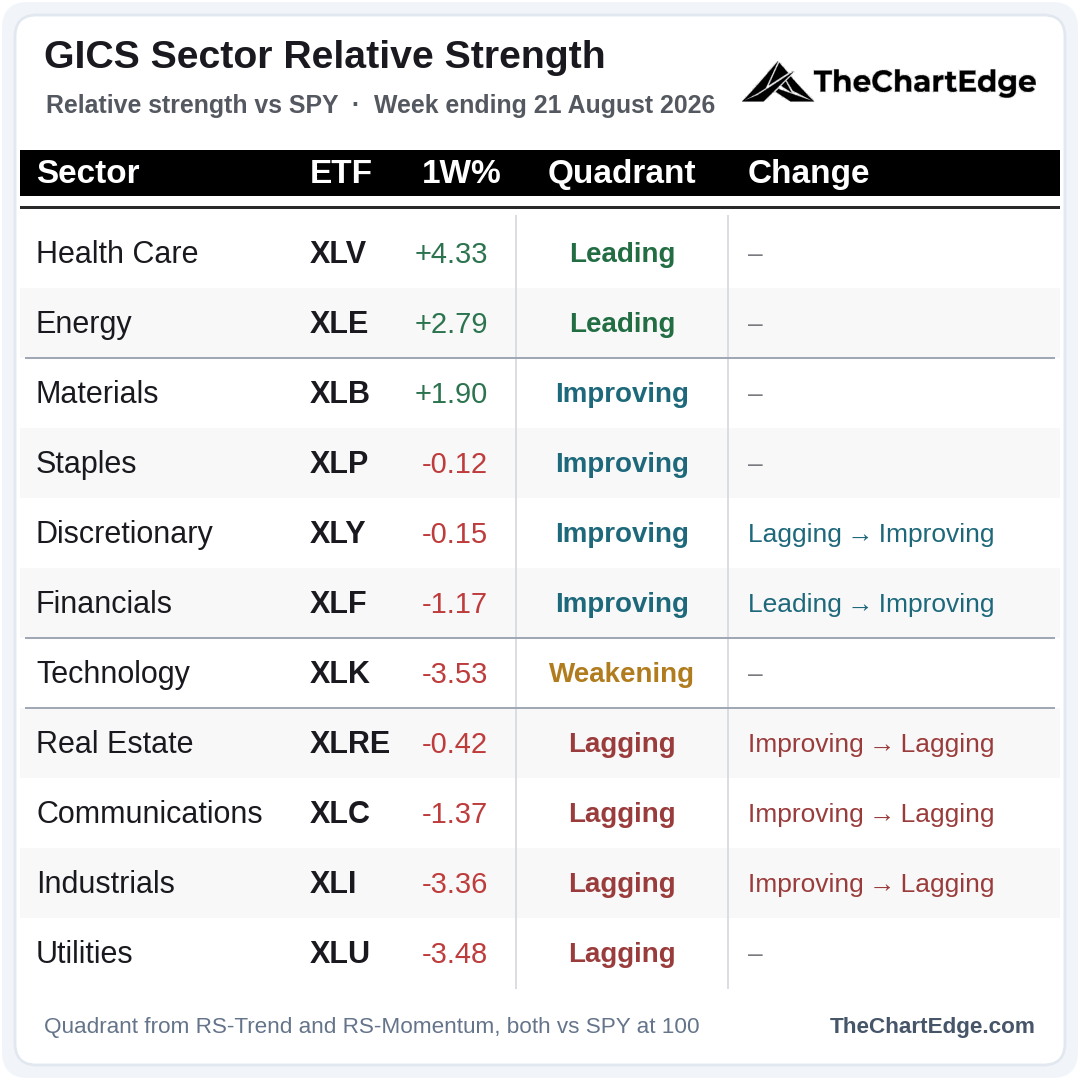
Health care, energy and materials were the only sectors to finish higher - health care and energy remain in Leading, materials stayed in Improving.
Utilities, technology and industrials led the declines.
Five sectors changed quadrant, but four of them crossed by a fraction of a point and are bunched around the boundary lines.
Technology is in Weakening for a second week.
Momentum Leaderboard
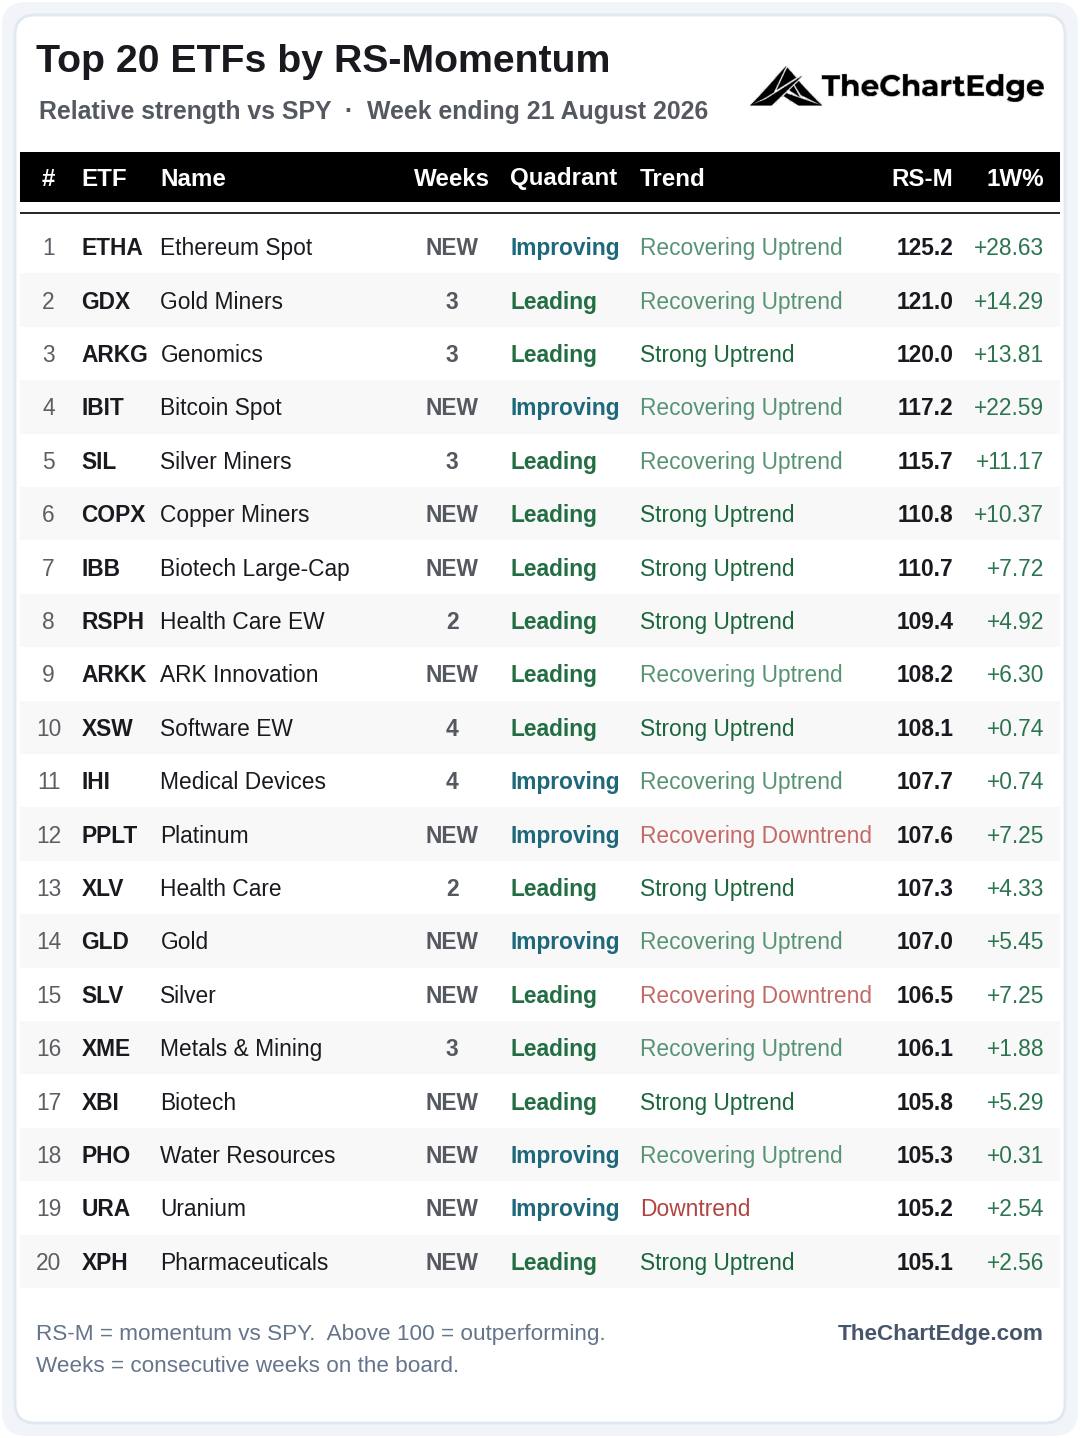
12 of the 20 are new, and the turnover tells the week’s story. What arrived was commodities and crypto: Ethereum (ETHA) and Bitcoin (IBIT) at number one and four, Copper Miners (COPX), Platinum (PPLT), Gold (GLD), Silver (SLV), Uranium (URA) and Water Resources (PHO). The rest of the board is mostly biotech and healthcare.
All four energy names (XOP, XLE, RSPG and OIH) and all three financials (KBE, KRE and KCE) dropped off.
Only 8 of the 20 are in Strong Uptrends, down from 14, and 9 are in Recovering Uptrends.
Software EW (XSW) and Medical Devices (IHI) now share the longest streak at four weeks.
Trend States Across the Universe
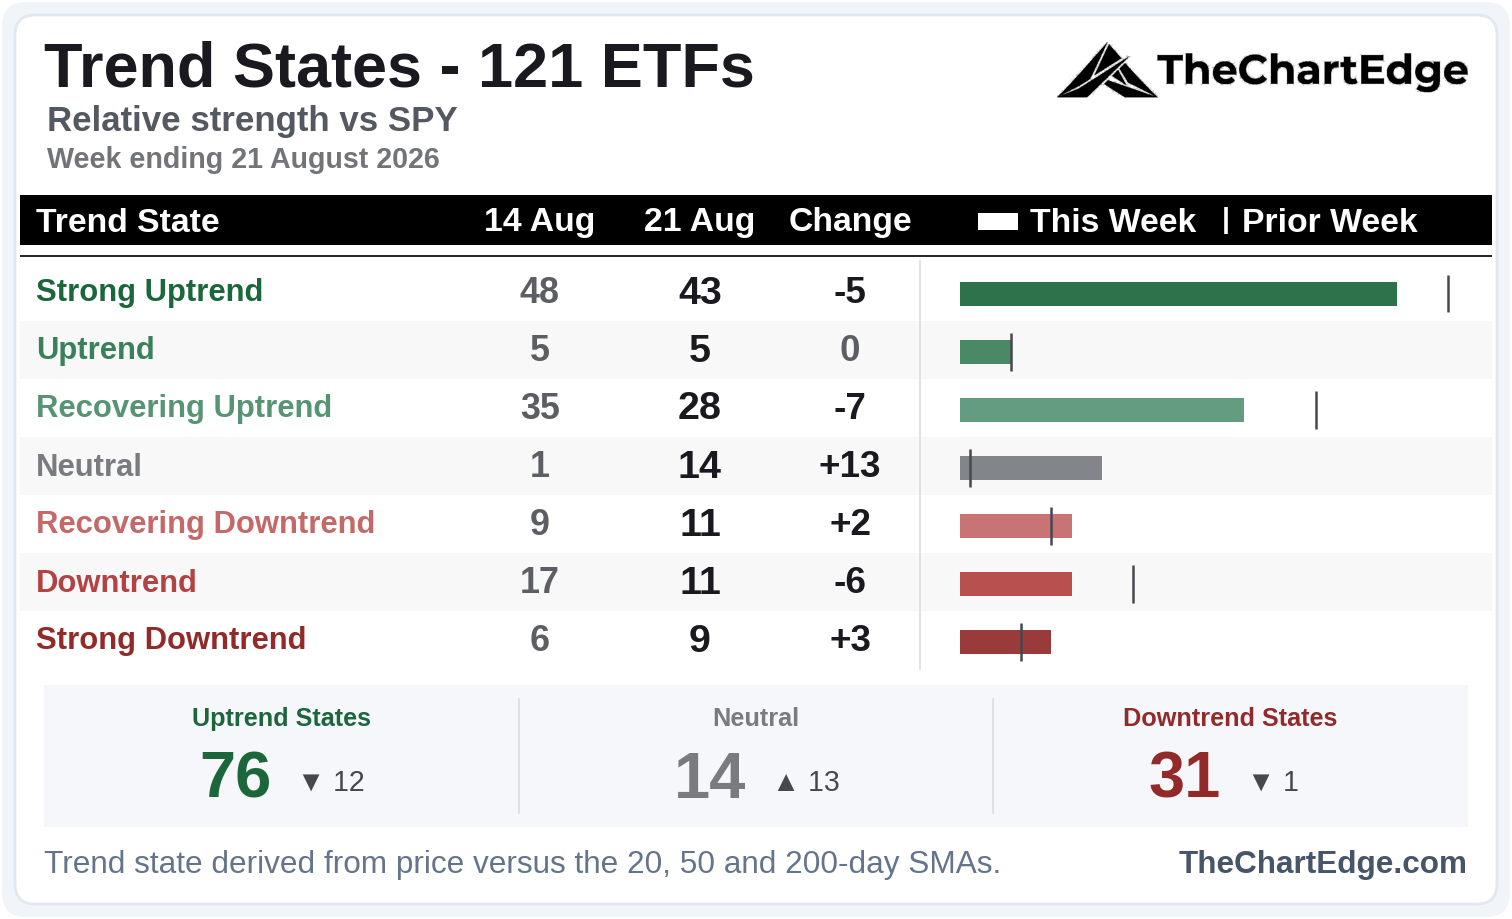
Strong Uptrend went from 48 to 43 and Neutral from 1 to 14. The names that moved into Neutral are mostly cyclical and rate-sensitive: industrials, regional banks, the bank ETF, transports, airlines, semis and aerospace. Still, 76 of the 121 remain in one of the three uptrend states.
Industry Breadth (Leading Stocks)
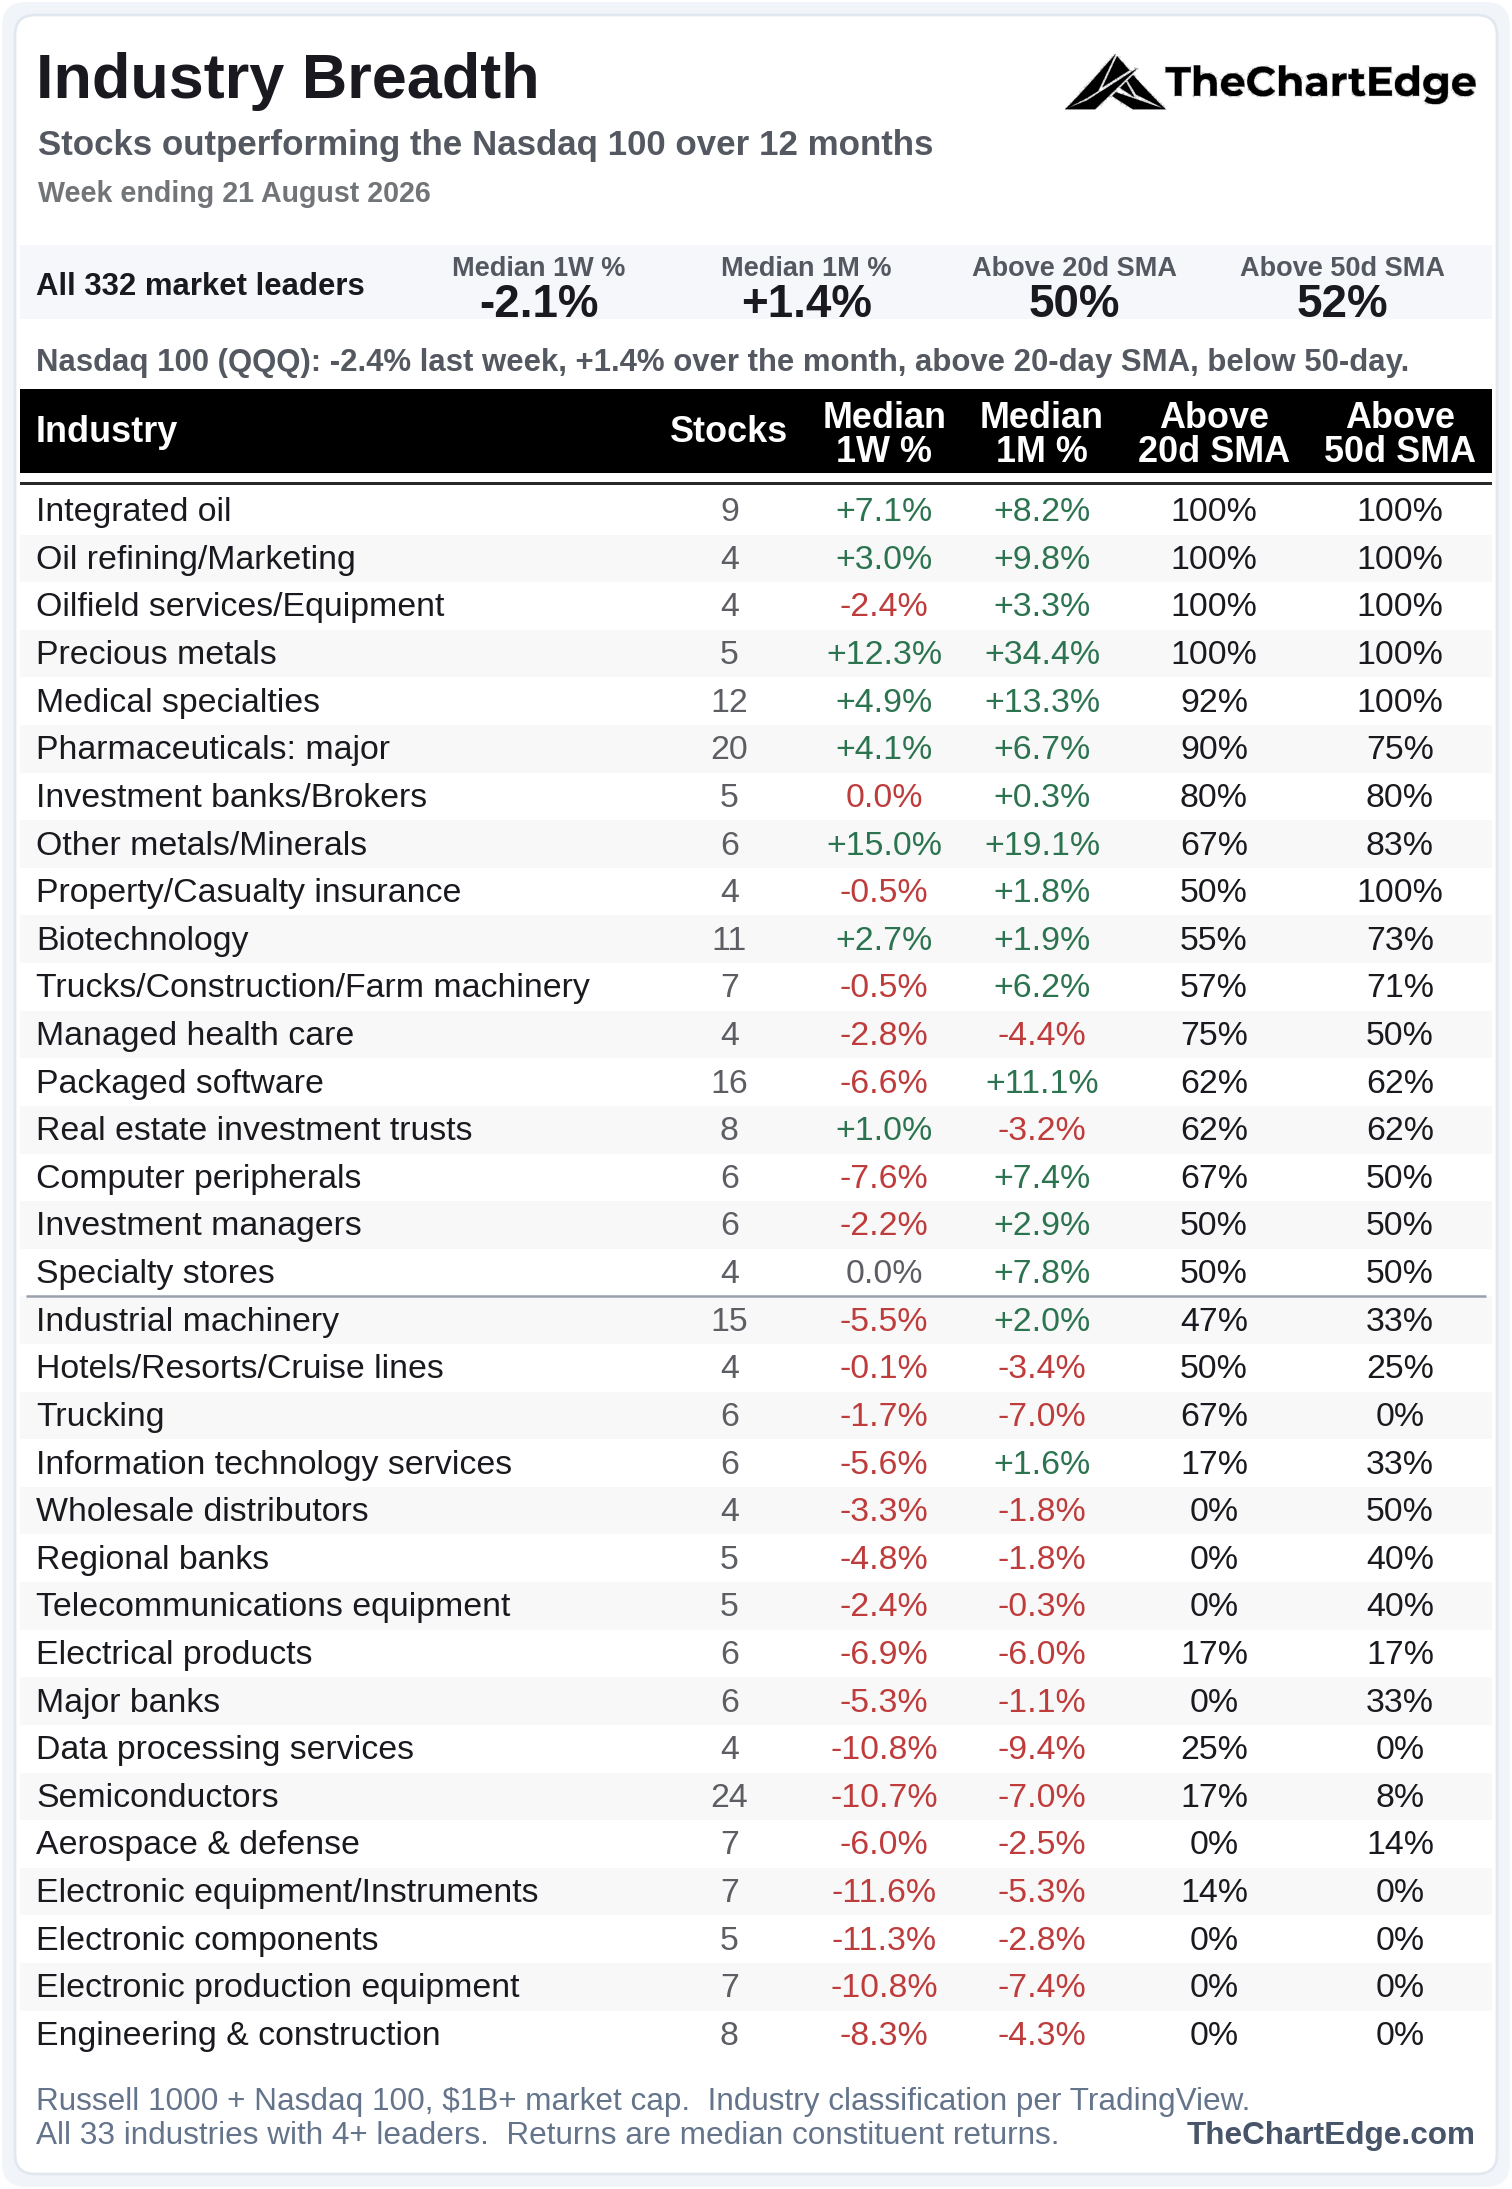
Last weekend only 2 of 33 industries sat below the 50% line. This weekend it’s 16 of 33, and roughly half the names in the universe are above their 20-day SMA, down from three quarters.
The top of the board is now oil, precious metals and medical specialties.
Last weekend regional banks and major banks had every name above both SMAs, now none are above the 20-day and only 40% and 33% respectively are above their 50-day.
Technology reversed as well. Packaged software is the first tech industry on the board at 13th, and along with computer peripherals are the only ones still above the line. Semiconductors dropped to 28th of 33, with only 17% of names above their 20-day SMA and 8% above the 50-day. Electronic components and electronic production equipment have no names above either.
Semis Fail at the 50-Day
SMH Chart
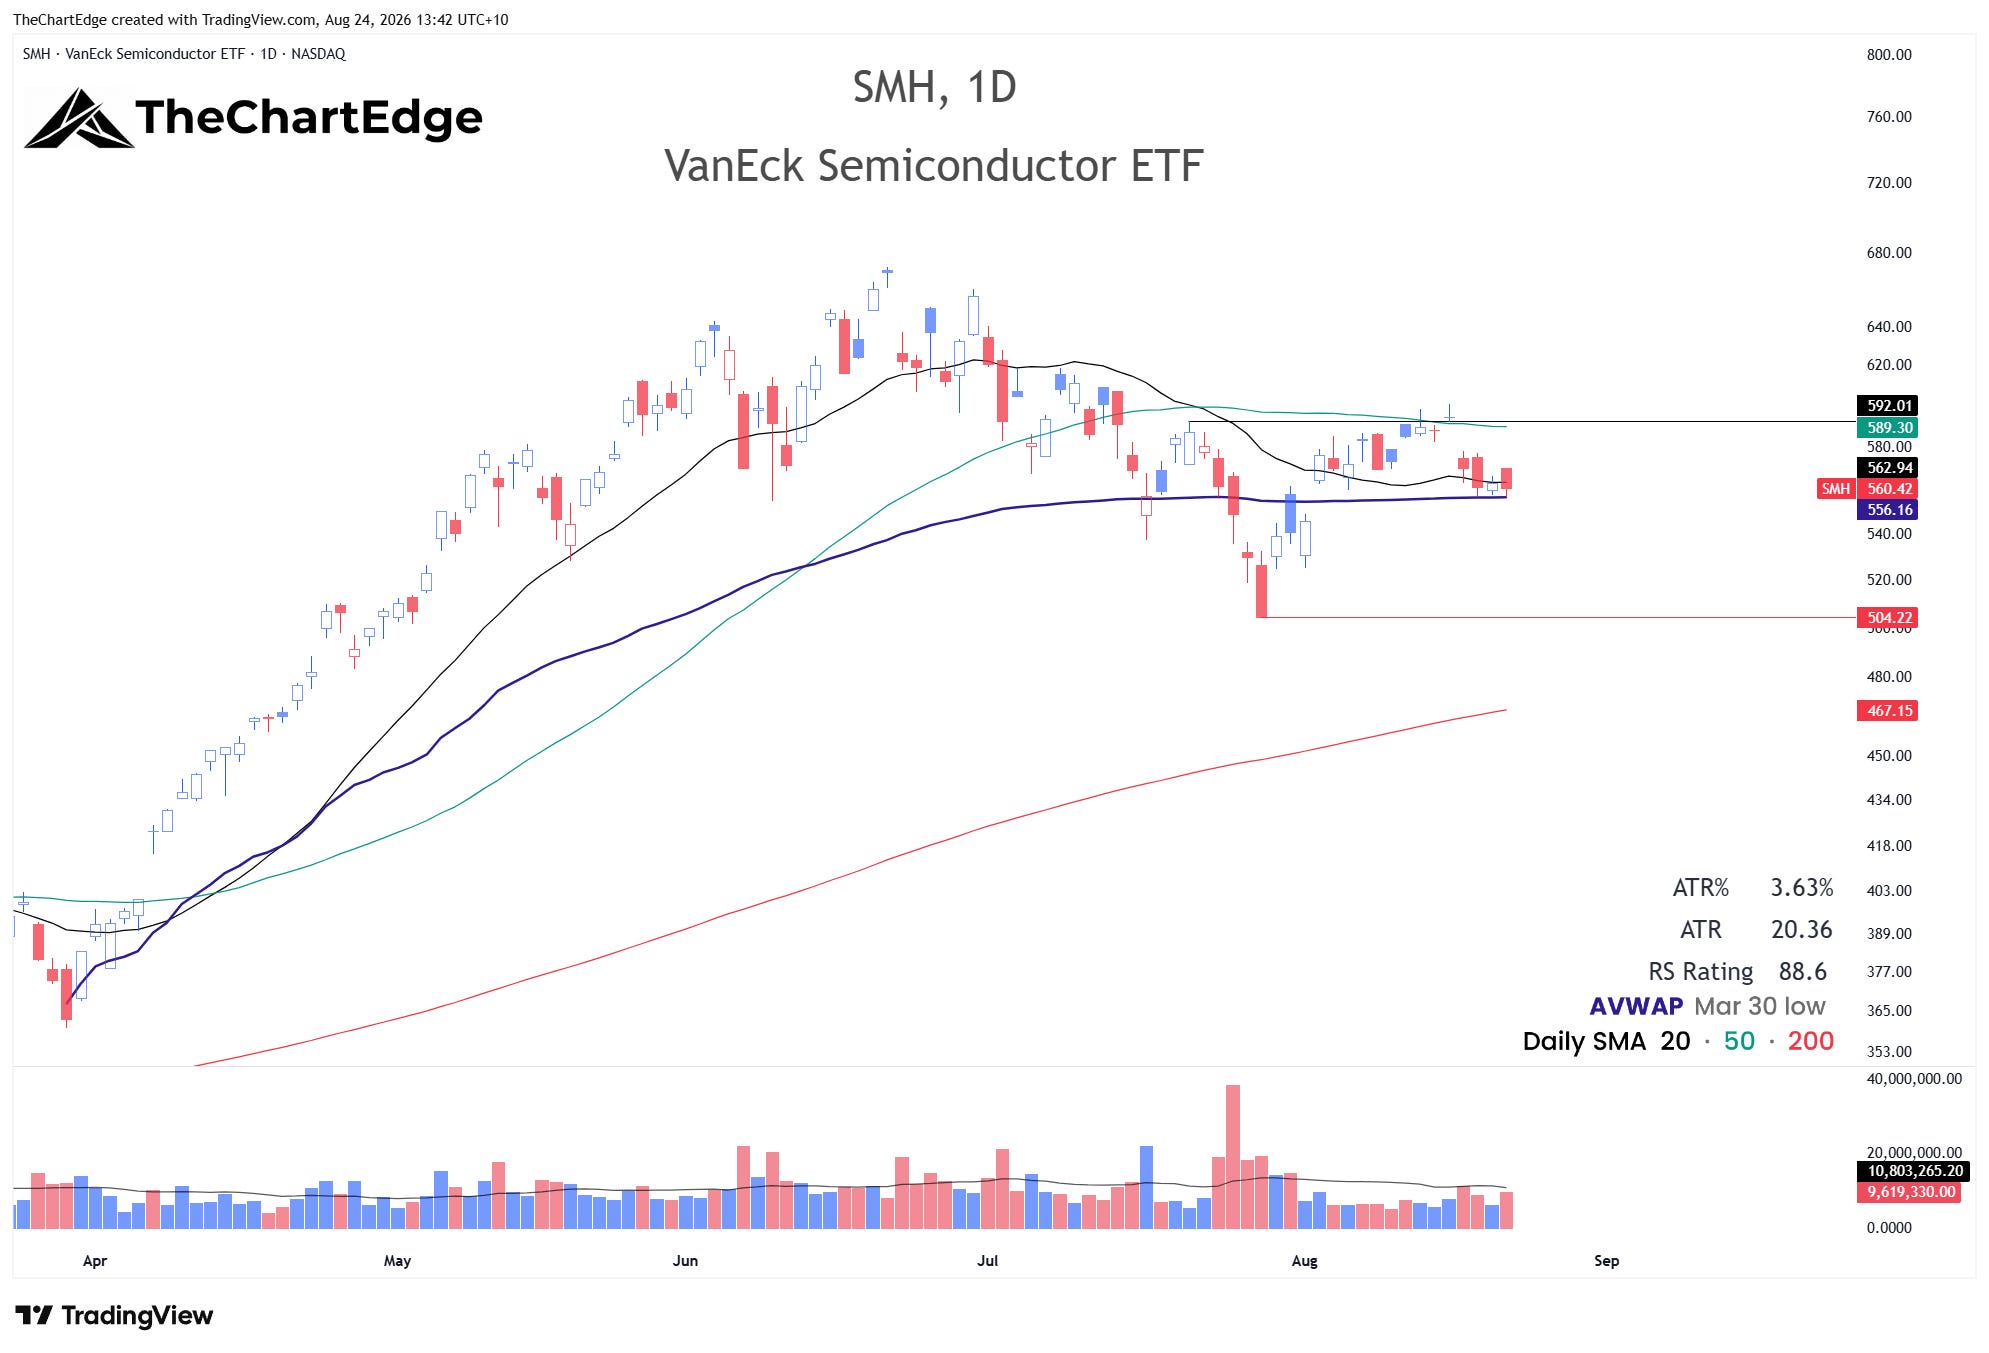
SMH poked its head above 592 and its 50-day SMA on Monday but then gapped down on Tuesday and was weak for the rest of the week. It fell 4.7% and closed at 560.42, below both its 20 and 50-day SMAs. It managed to hold the AVWAP from the March 30 low, which sits around 556. If it loses that, a retest of the July 29 low at around 504 looks more likely.
XSD Chart
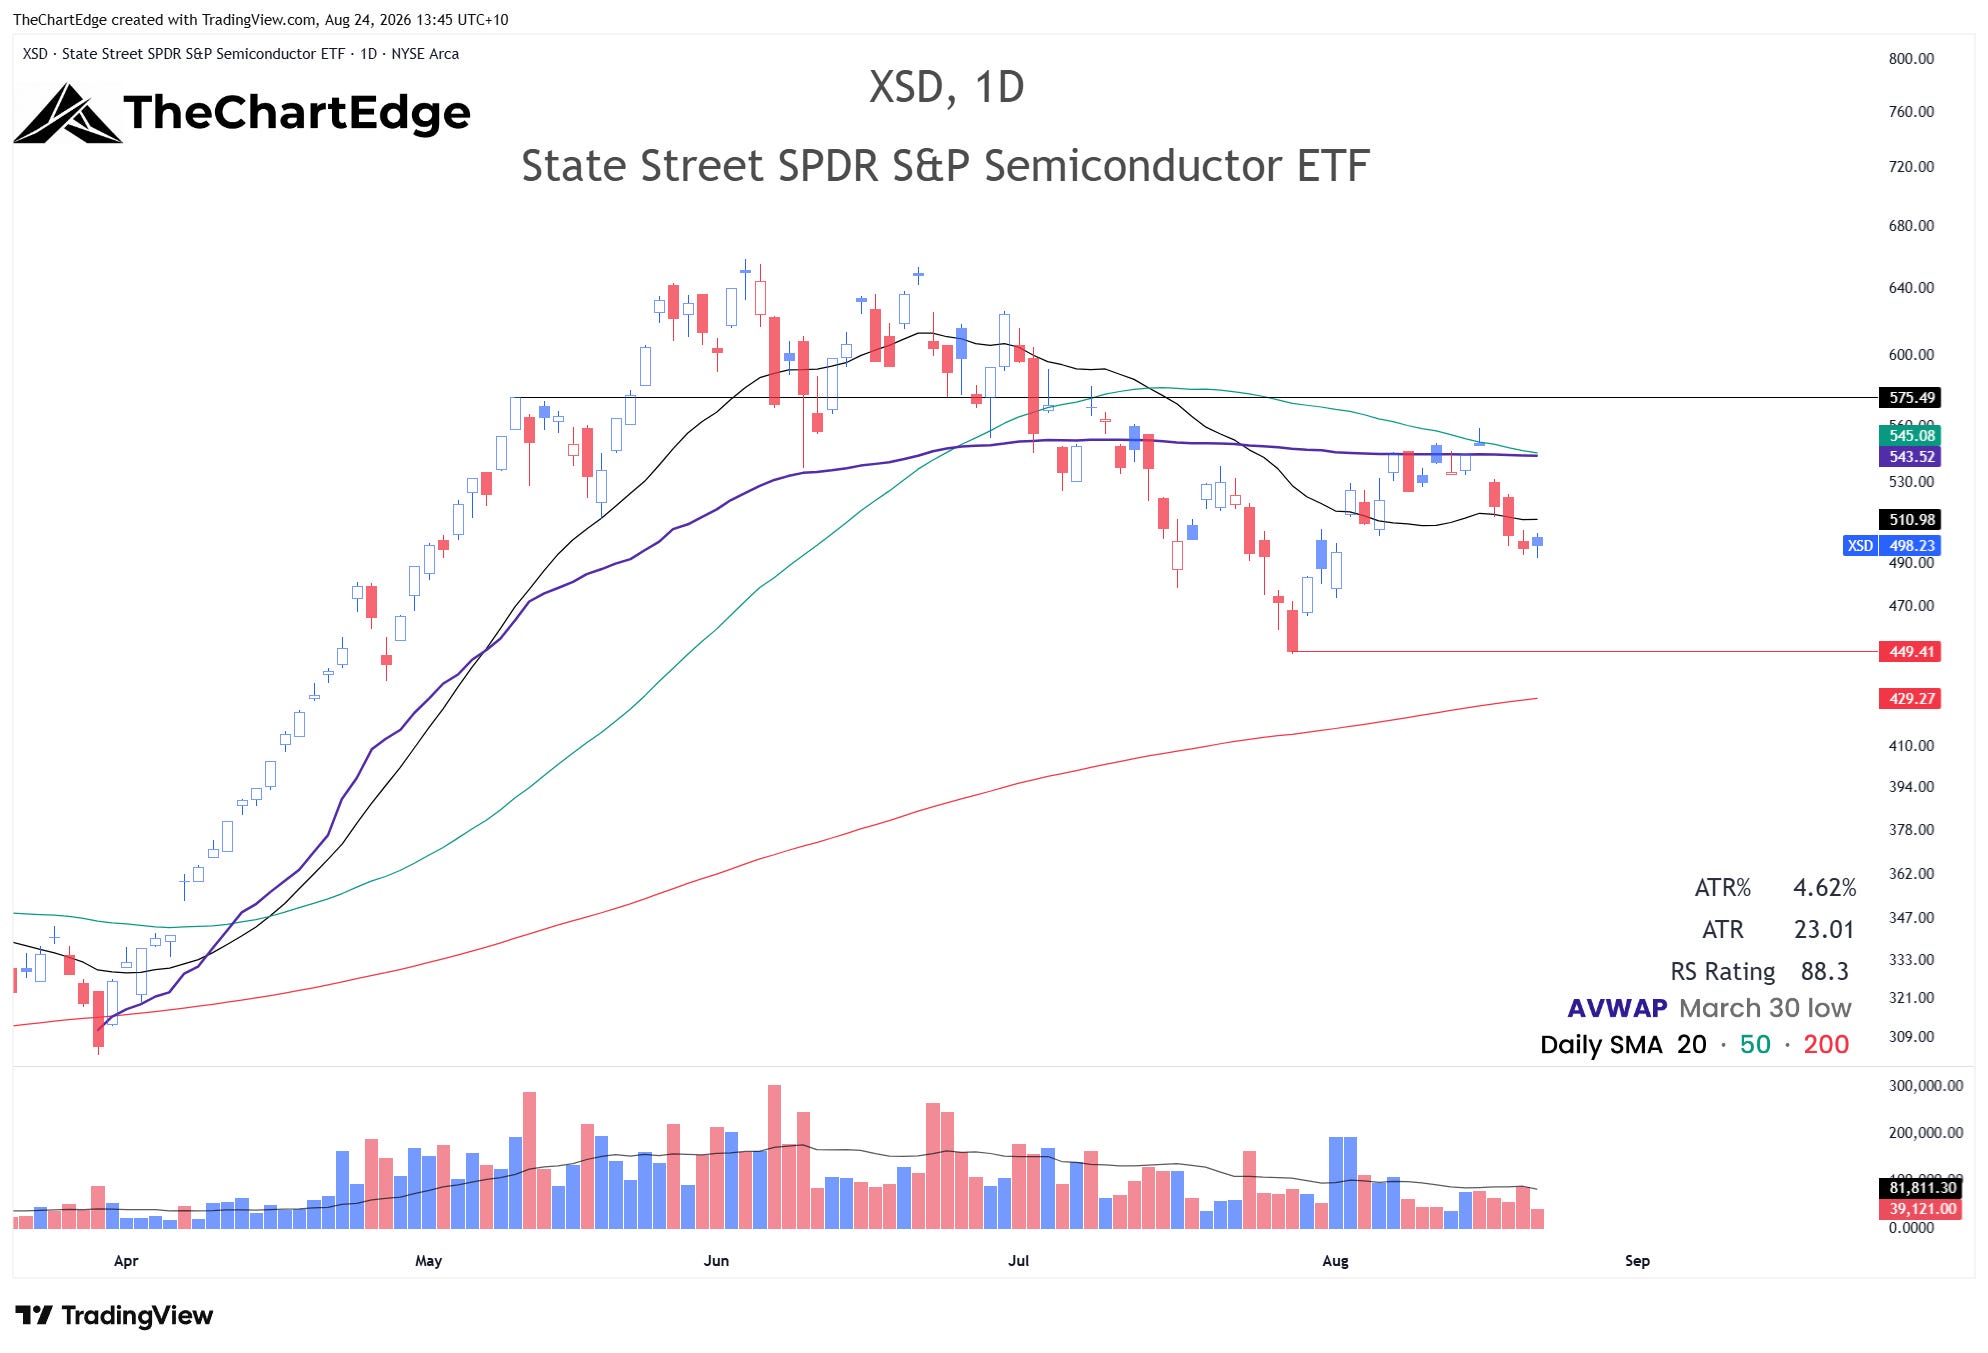
Equal-weight semis (XSD) fared even worse, down 8.5% on the week and the weakest ETF in the universe.
Software Showing Continued Strength
XSW Chart
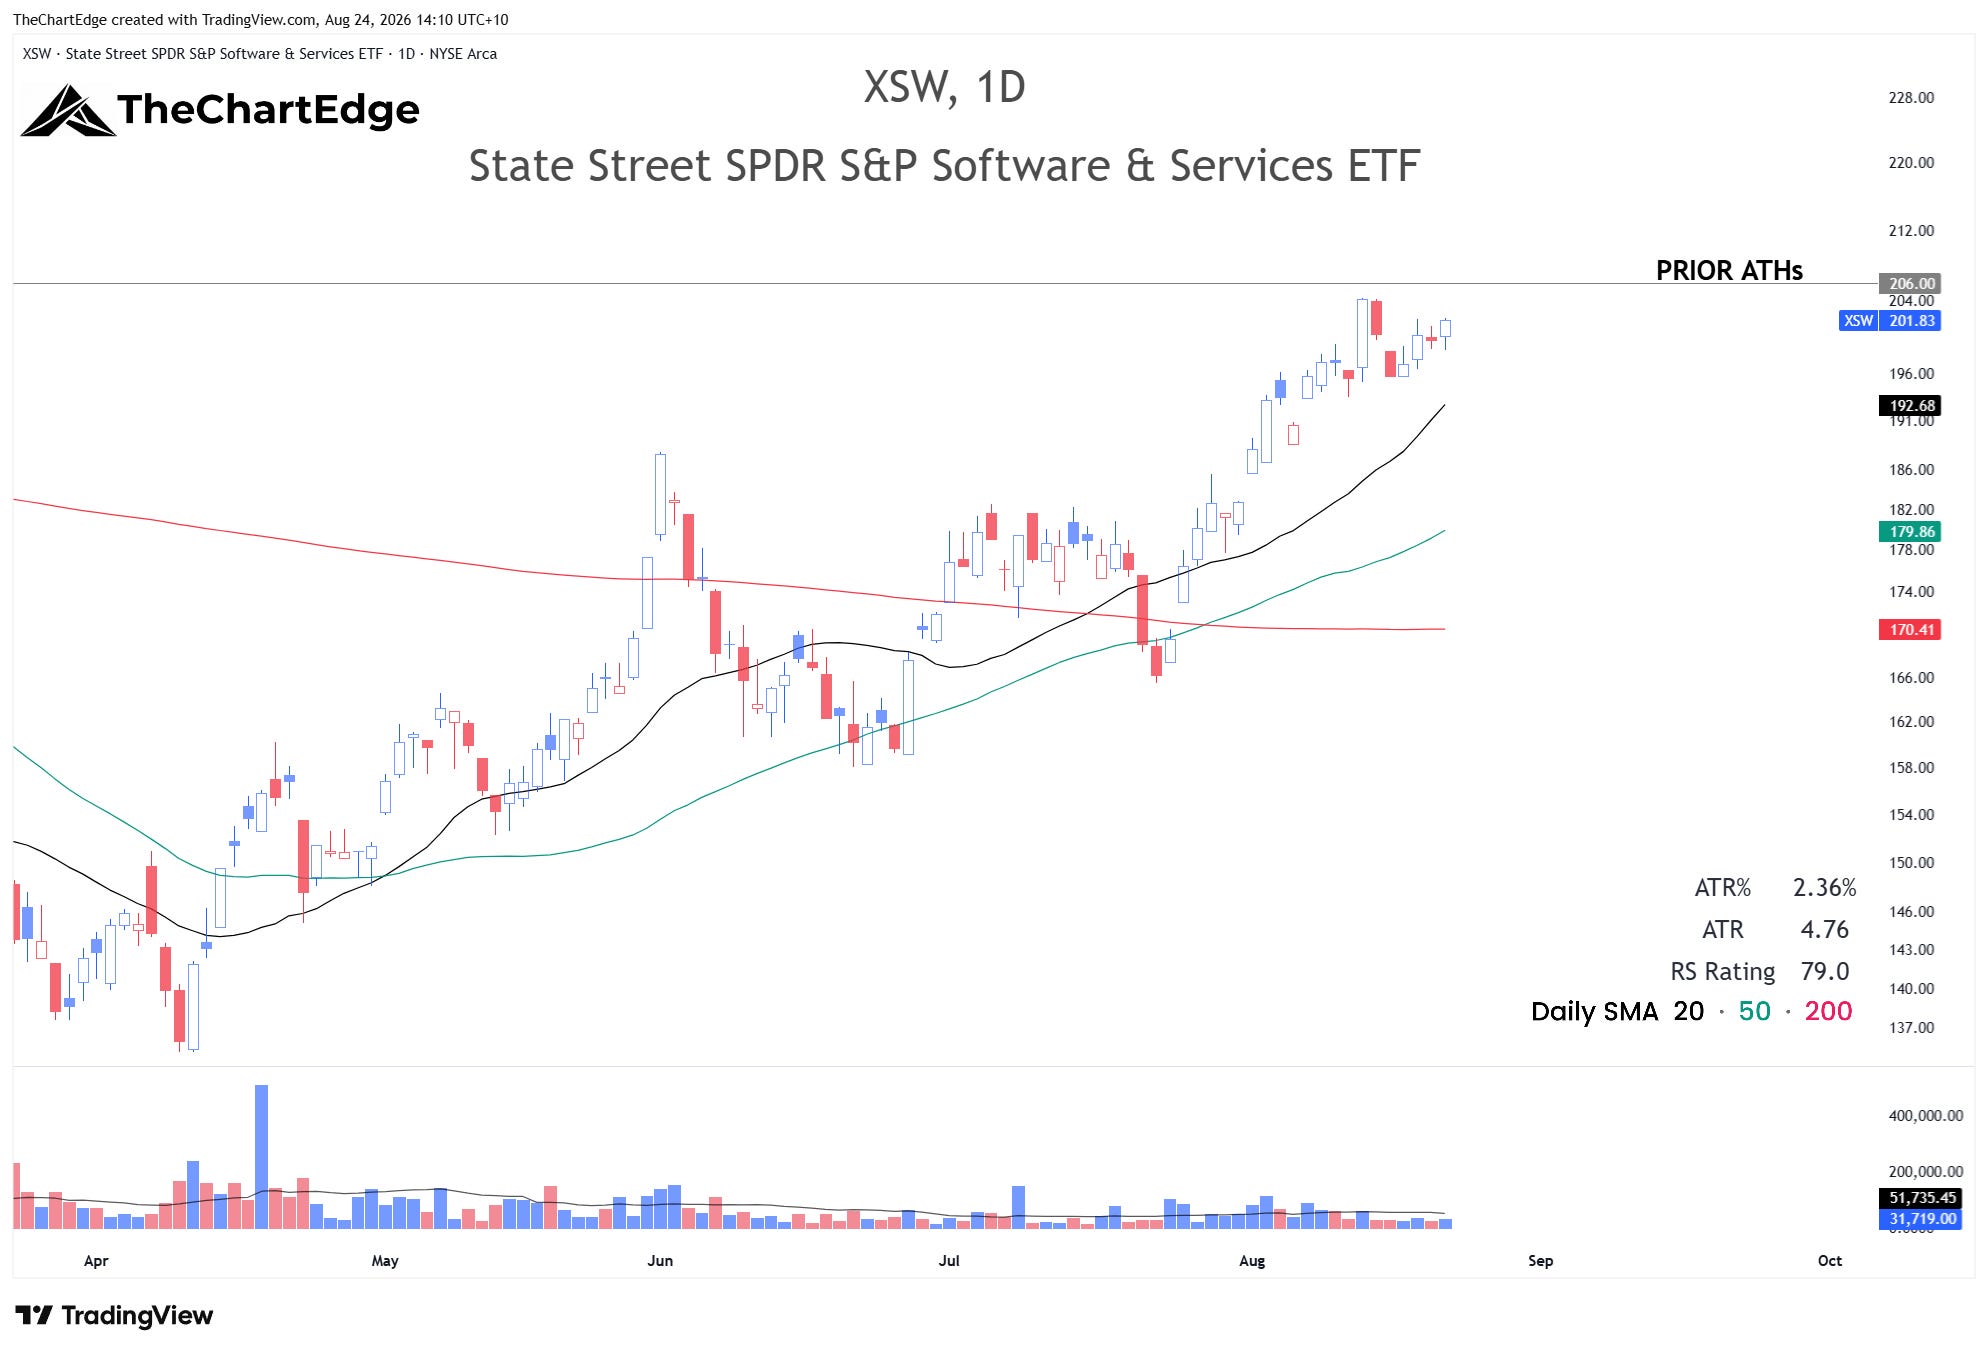
Equal-weight software (XSW) gapped down on Monday but rallied through the week from there, finishing up 0.7%. It looks constructive here, consolidating just under its all-time highs from December 2024 and September/October 2025.
Commodities and Crypto
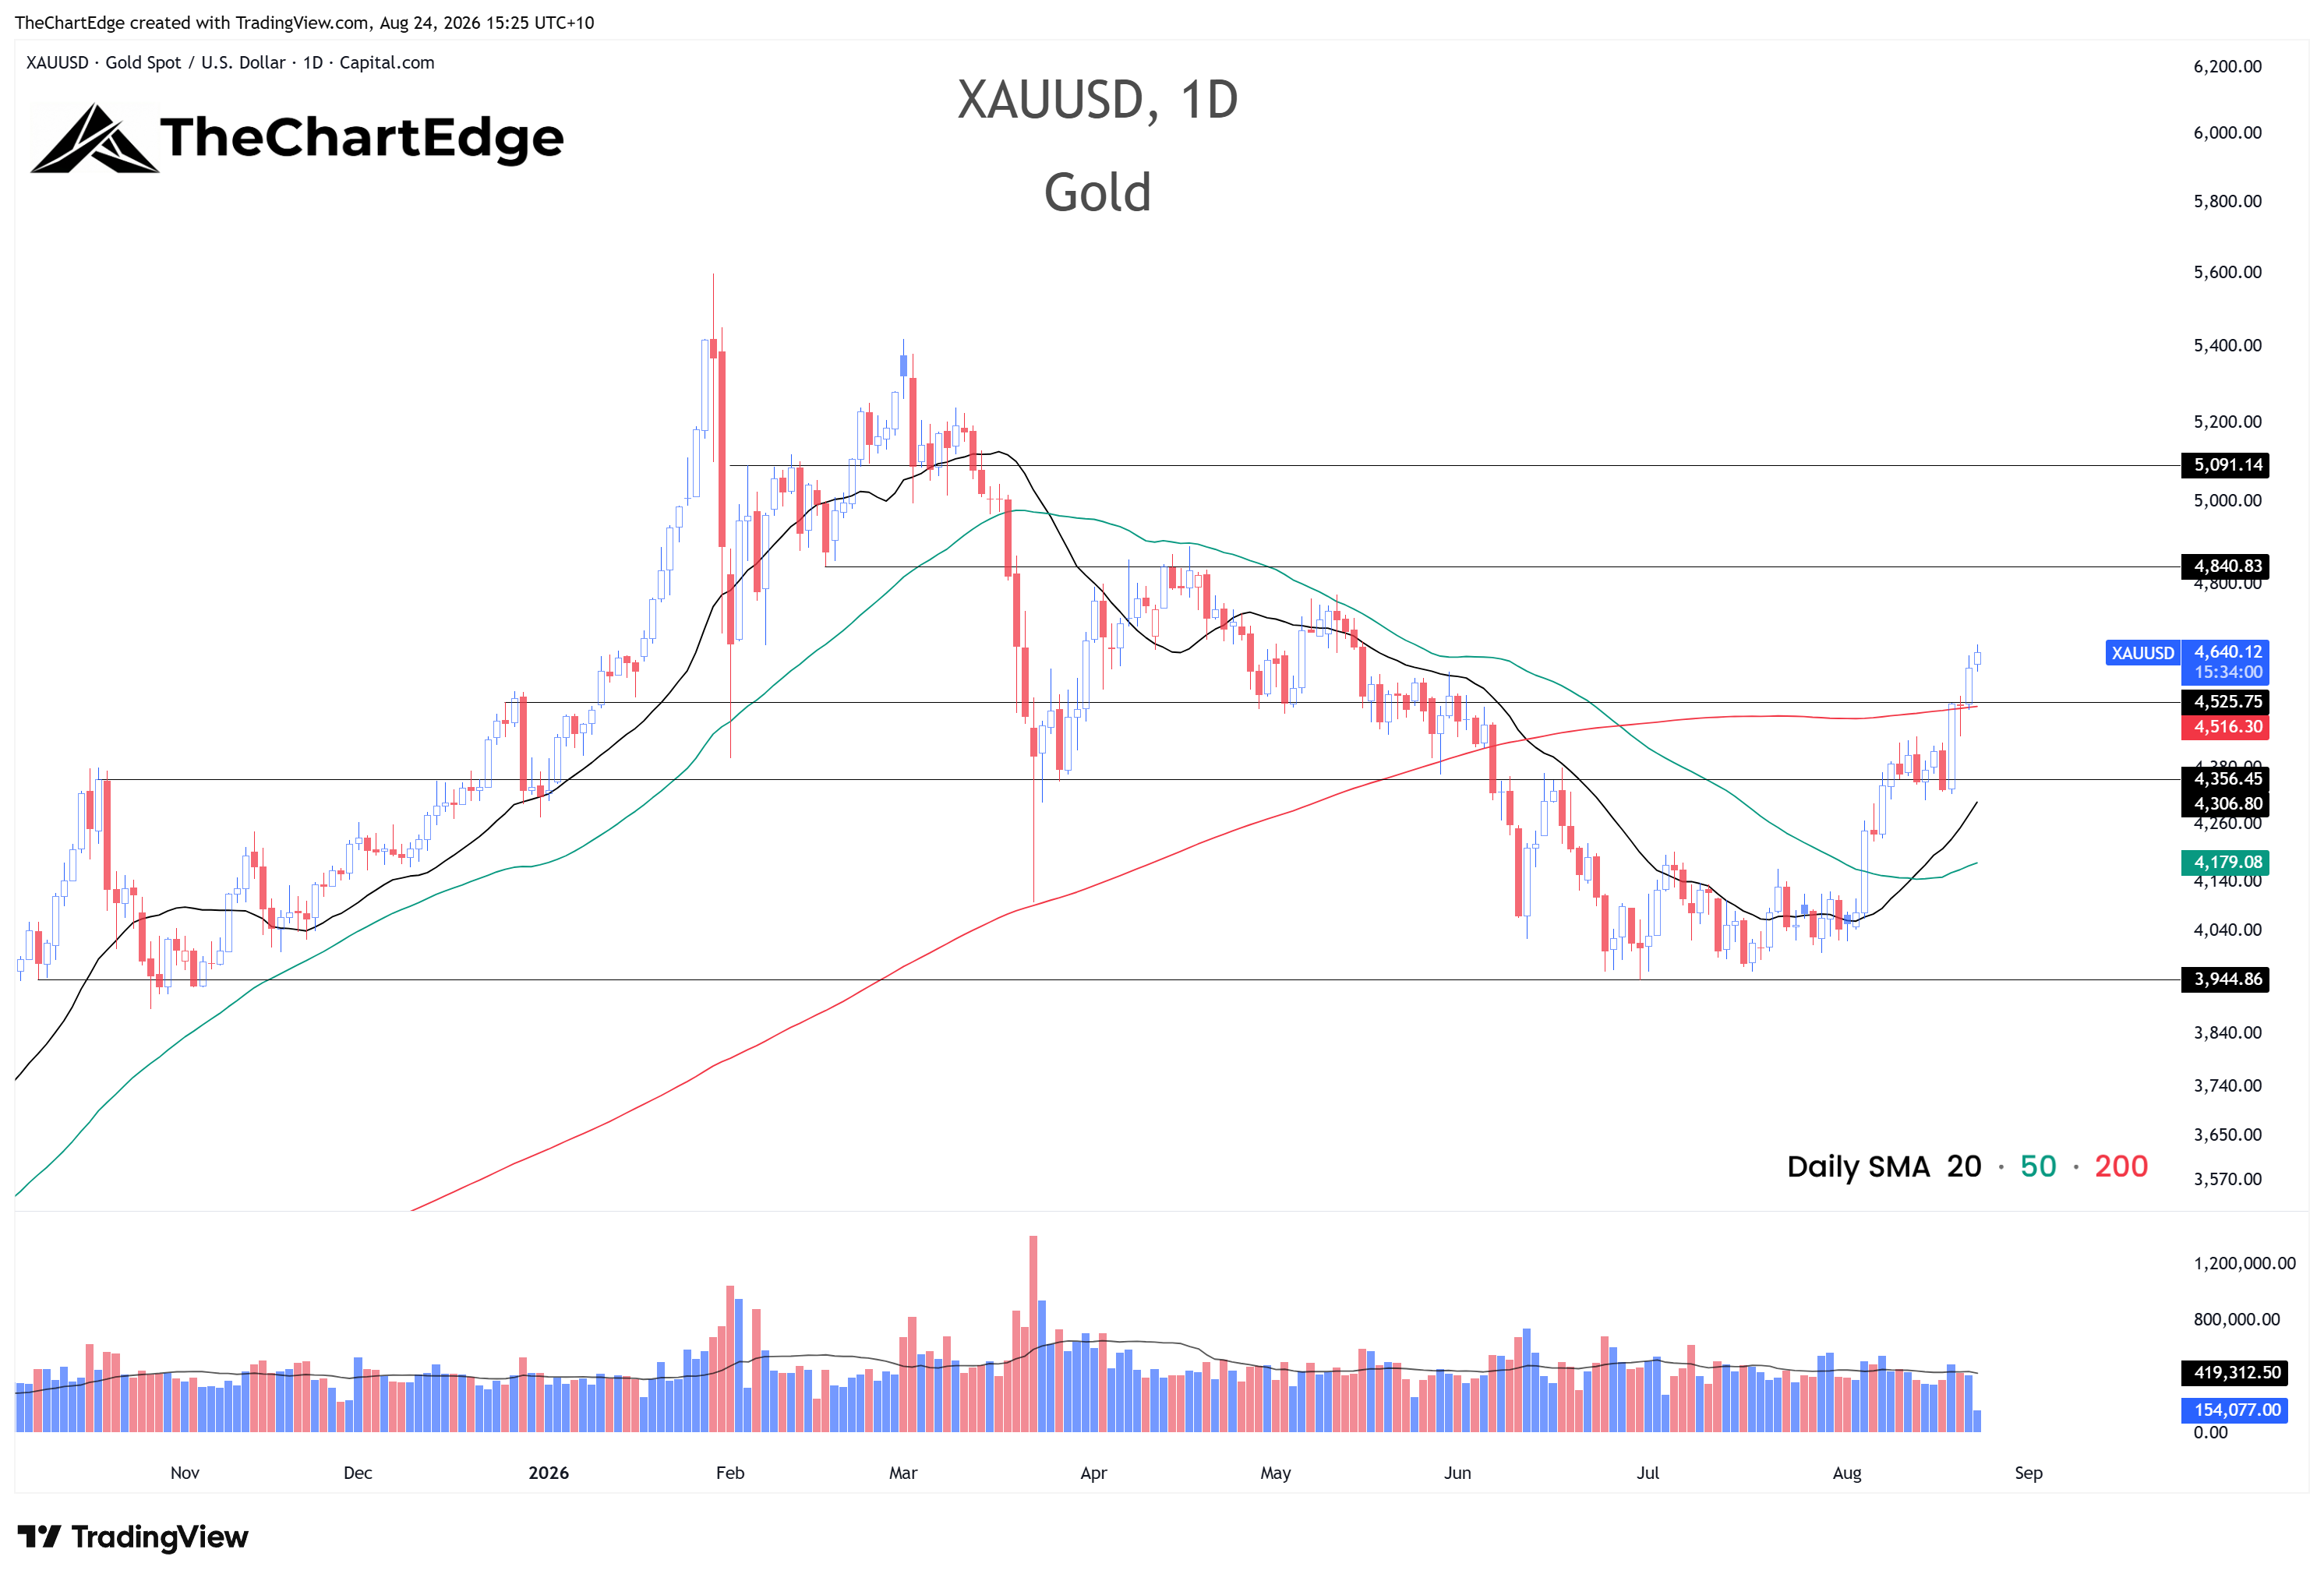
With the US dollar down again, there was a broad move into commodities and crypto. Gold and silver miners (GDX & SIL) and metals and mining (XME) had already been on the Momentum Leaderboard for a couple of weekends and were consolidating above their 200-day SMAs. GDX and SIL ripped again last week, both up over 10%. Copper miners (COPX), gold (GLD), silver (SLV), platinum (PPLT), water resources (PHO) and uranium (URA) all joined the Momentum Leaderboard this week. Crude (USO) rose 6.4% and the commodity basket (DBC) was up 4.2%.
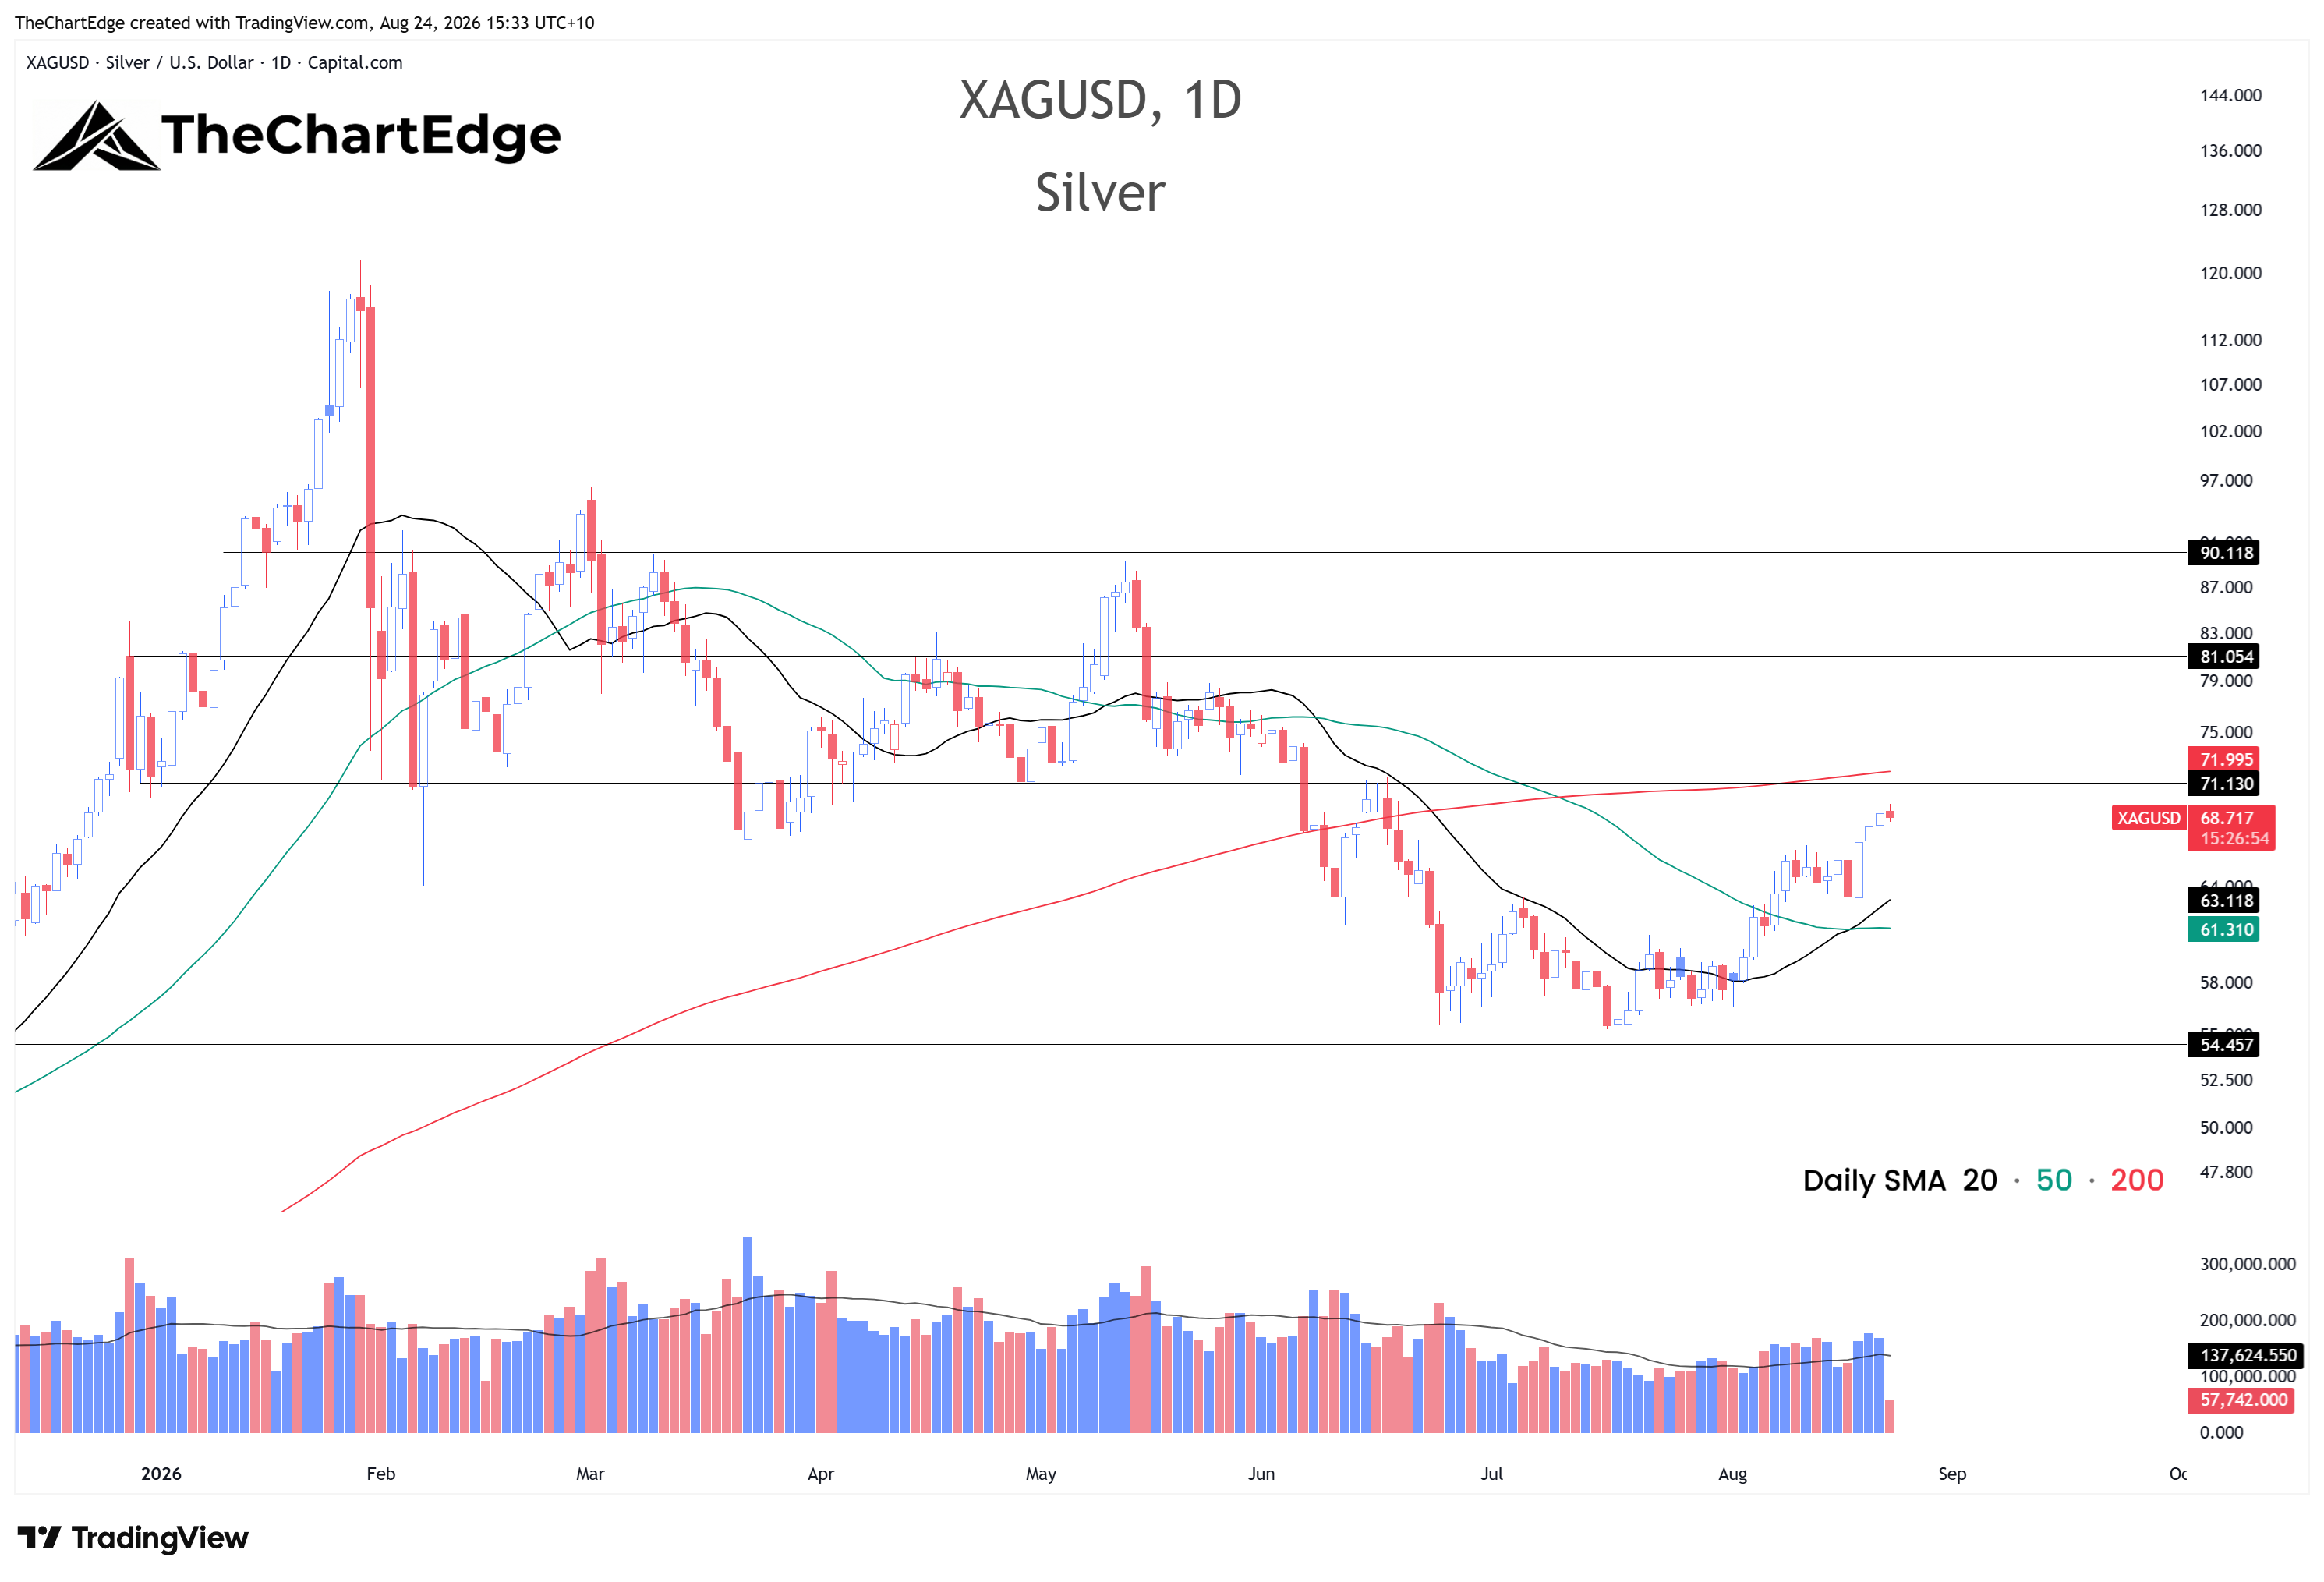
Last week I said I had less conviction in the gold and silver miners move because spot gold and silver were still trading below their 200-day SMAs. However, gold ripped straight through it last week. Silver still sits below its 200-day, but I wouldn’t be surprised to see it follow gold this coming week.
Spot Gold Chart
Spot Silver Chart
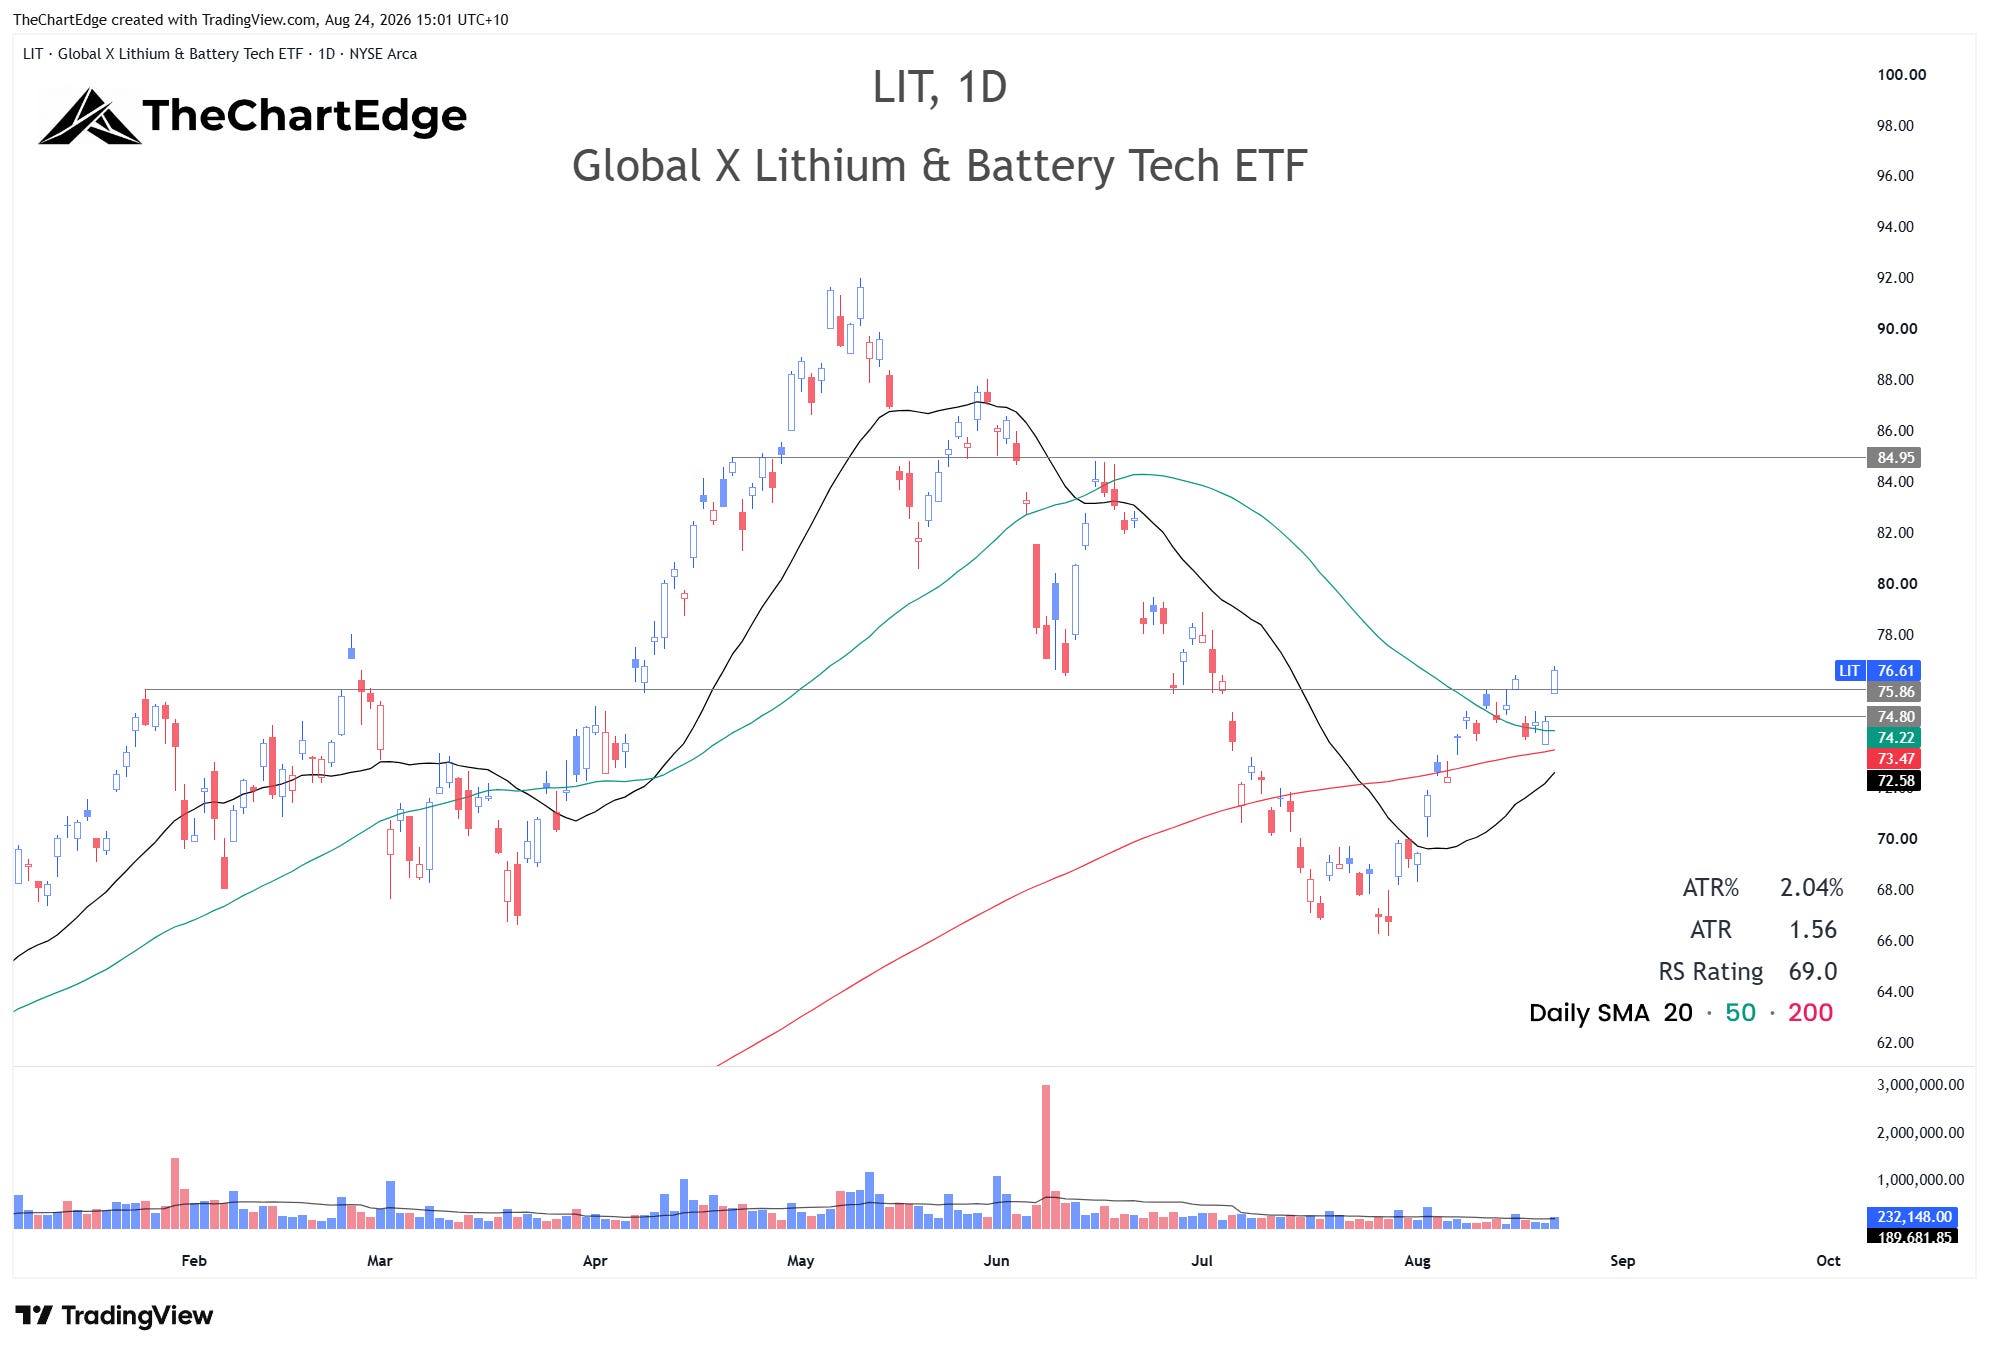
Lithium (LIT) had a nearly 30% drawdown between early May and late July but has started to recover with gold and silver so far in August. It hasn’t moved as much as the gold and silver miners, but the chart looks like it may be setting up for continued upside and is offering a good potential risk reward trade here. I am going to try and buy weakness back towards 75, with a stop-loss under the 20-day SMA (currently around 72.5 and rising) and a potential target around 84.
LIT Chart
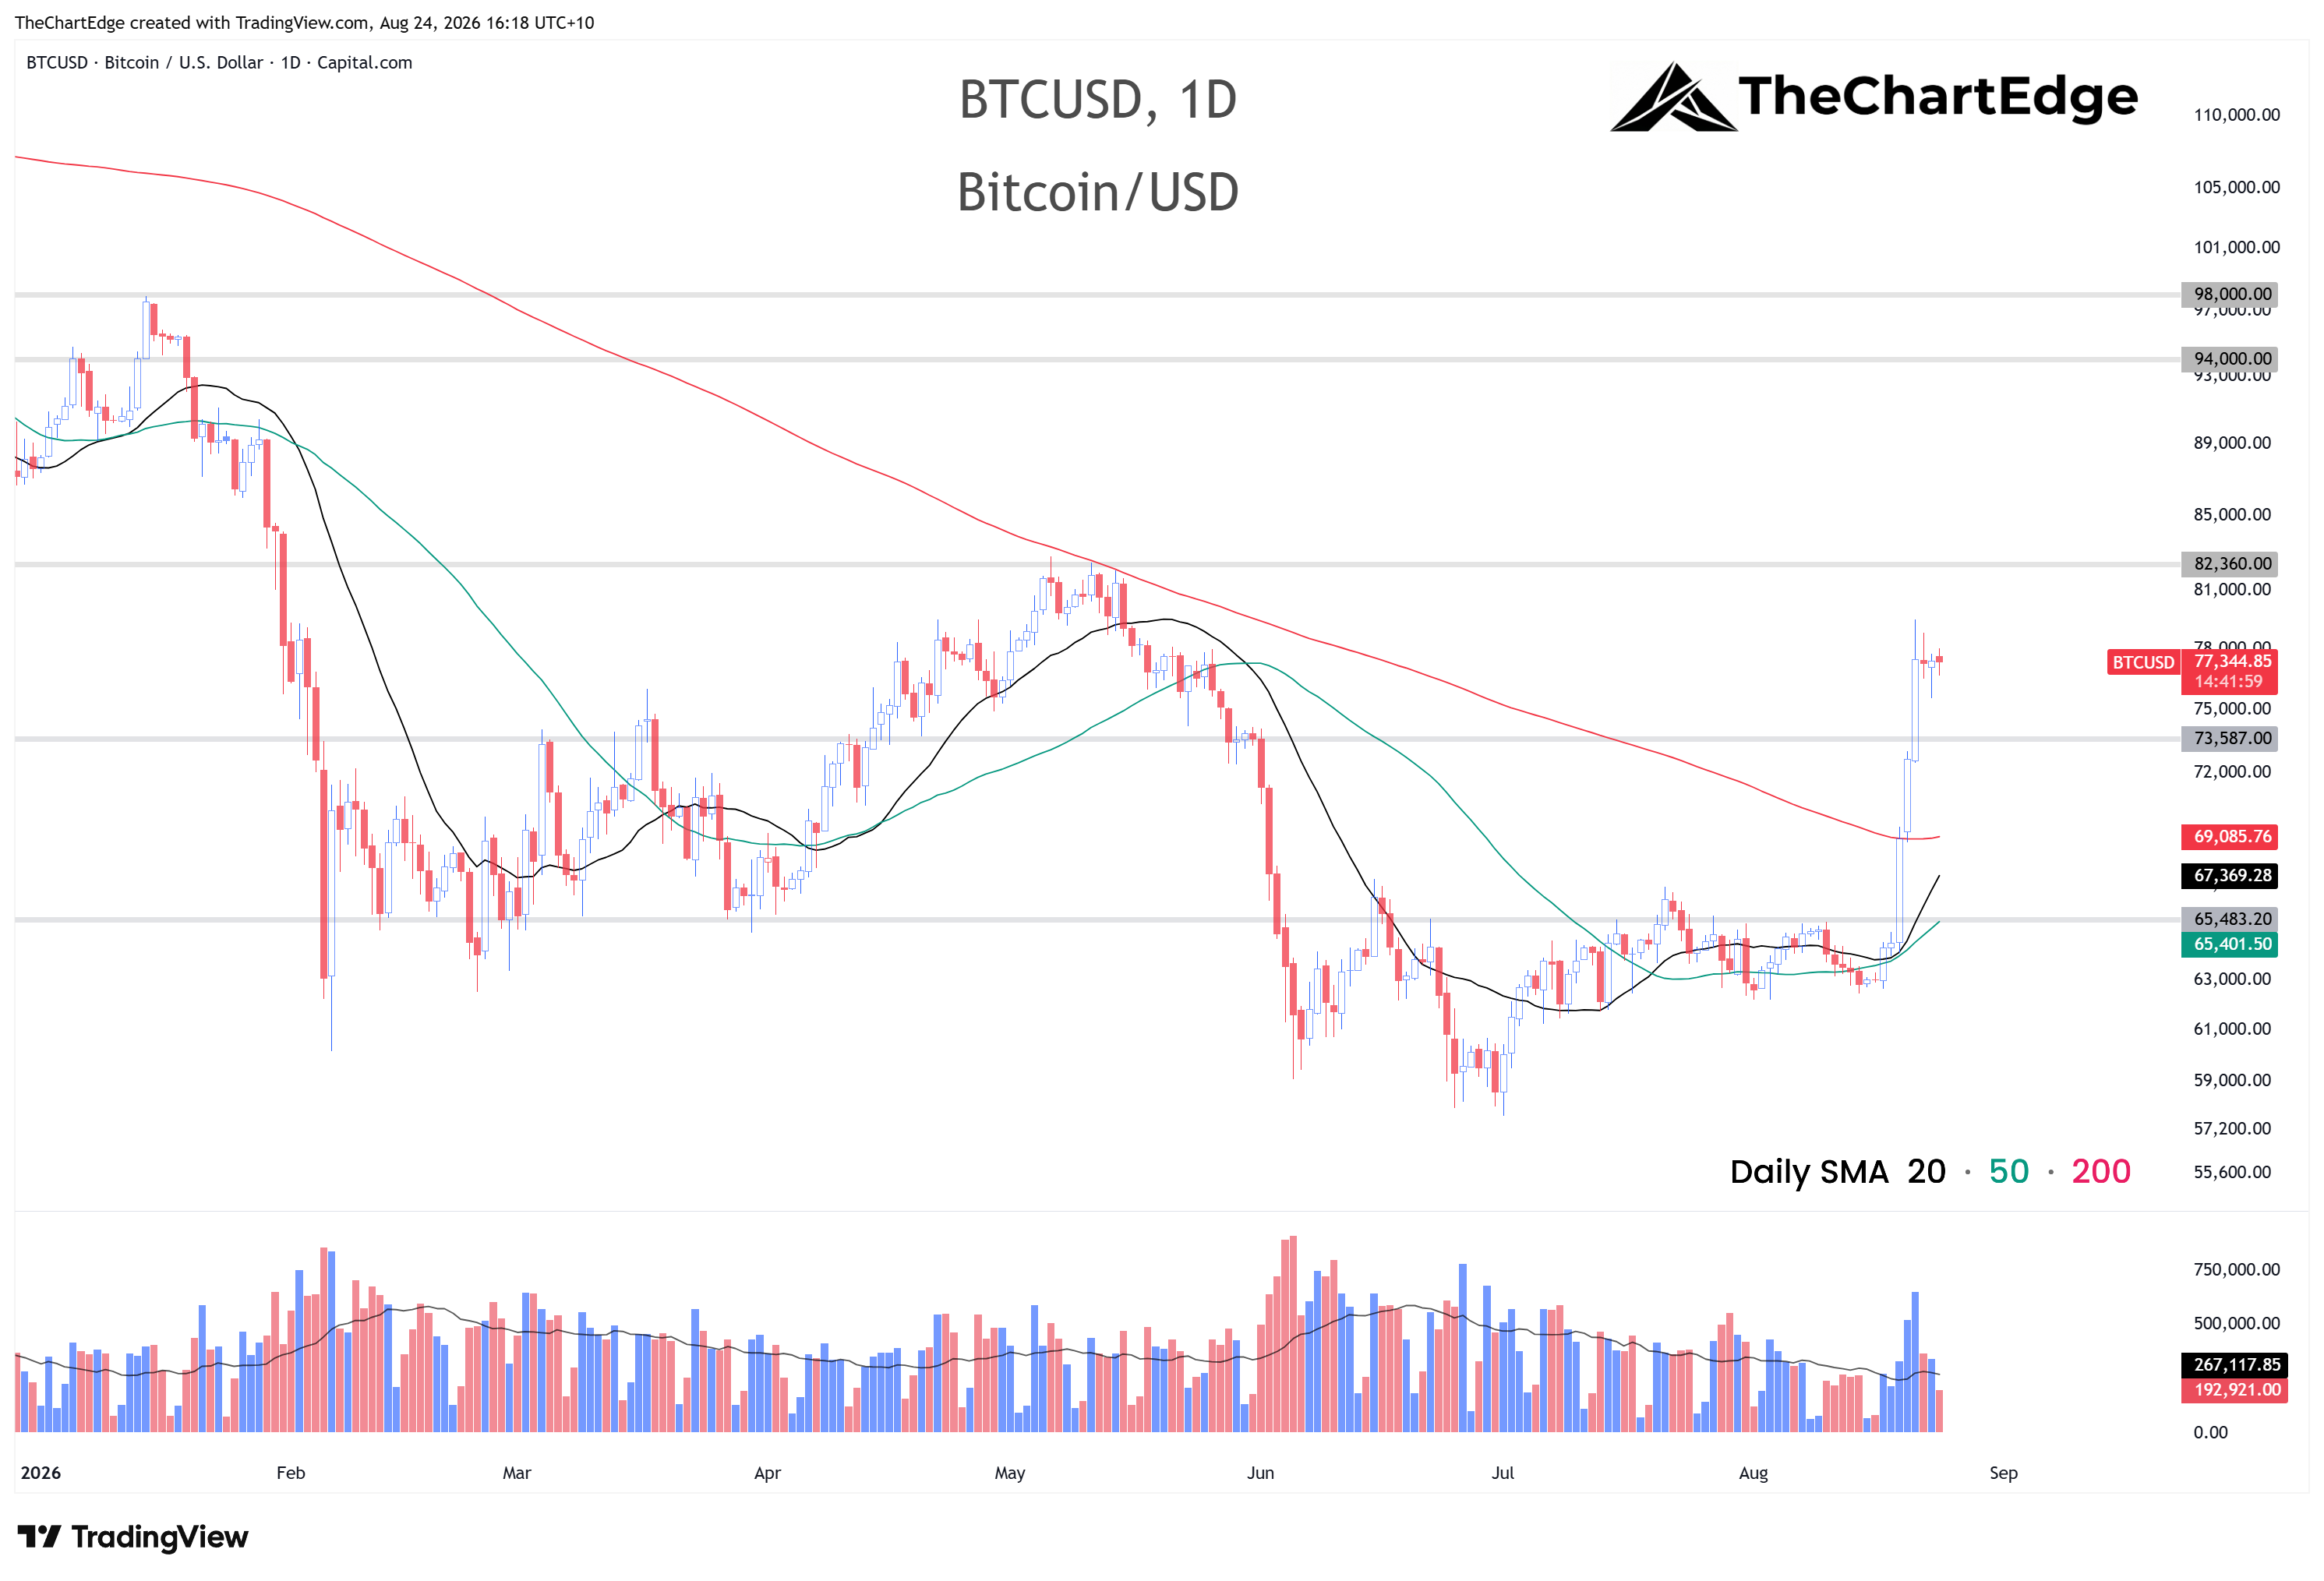
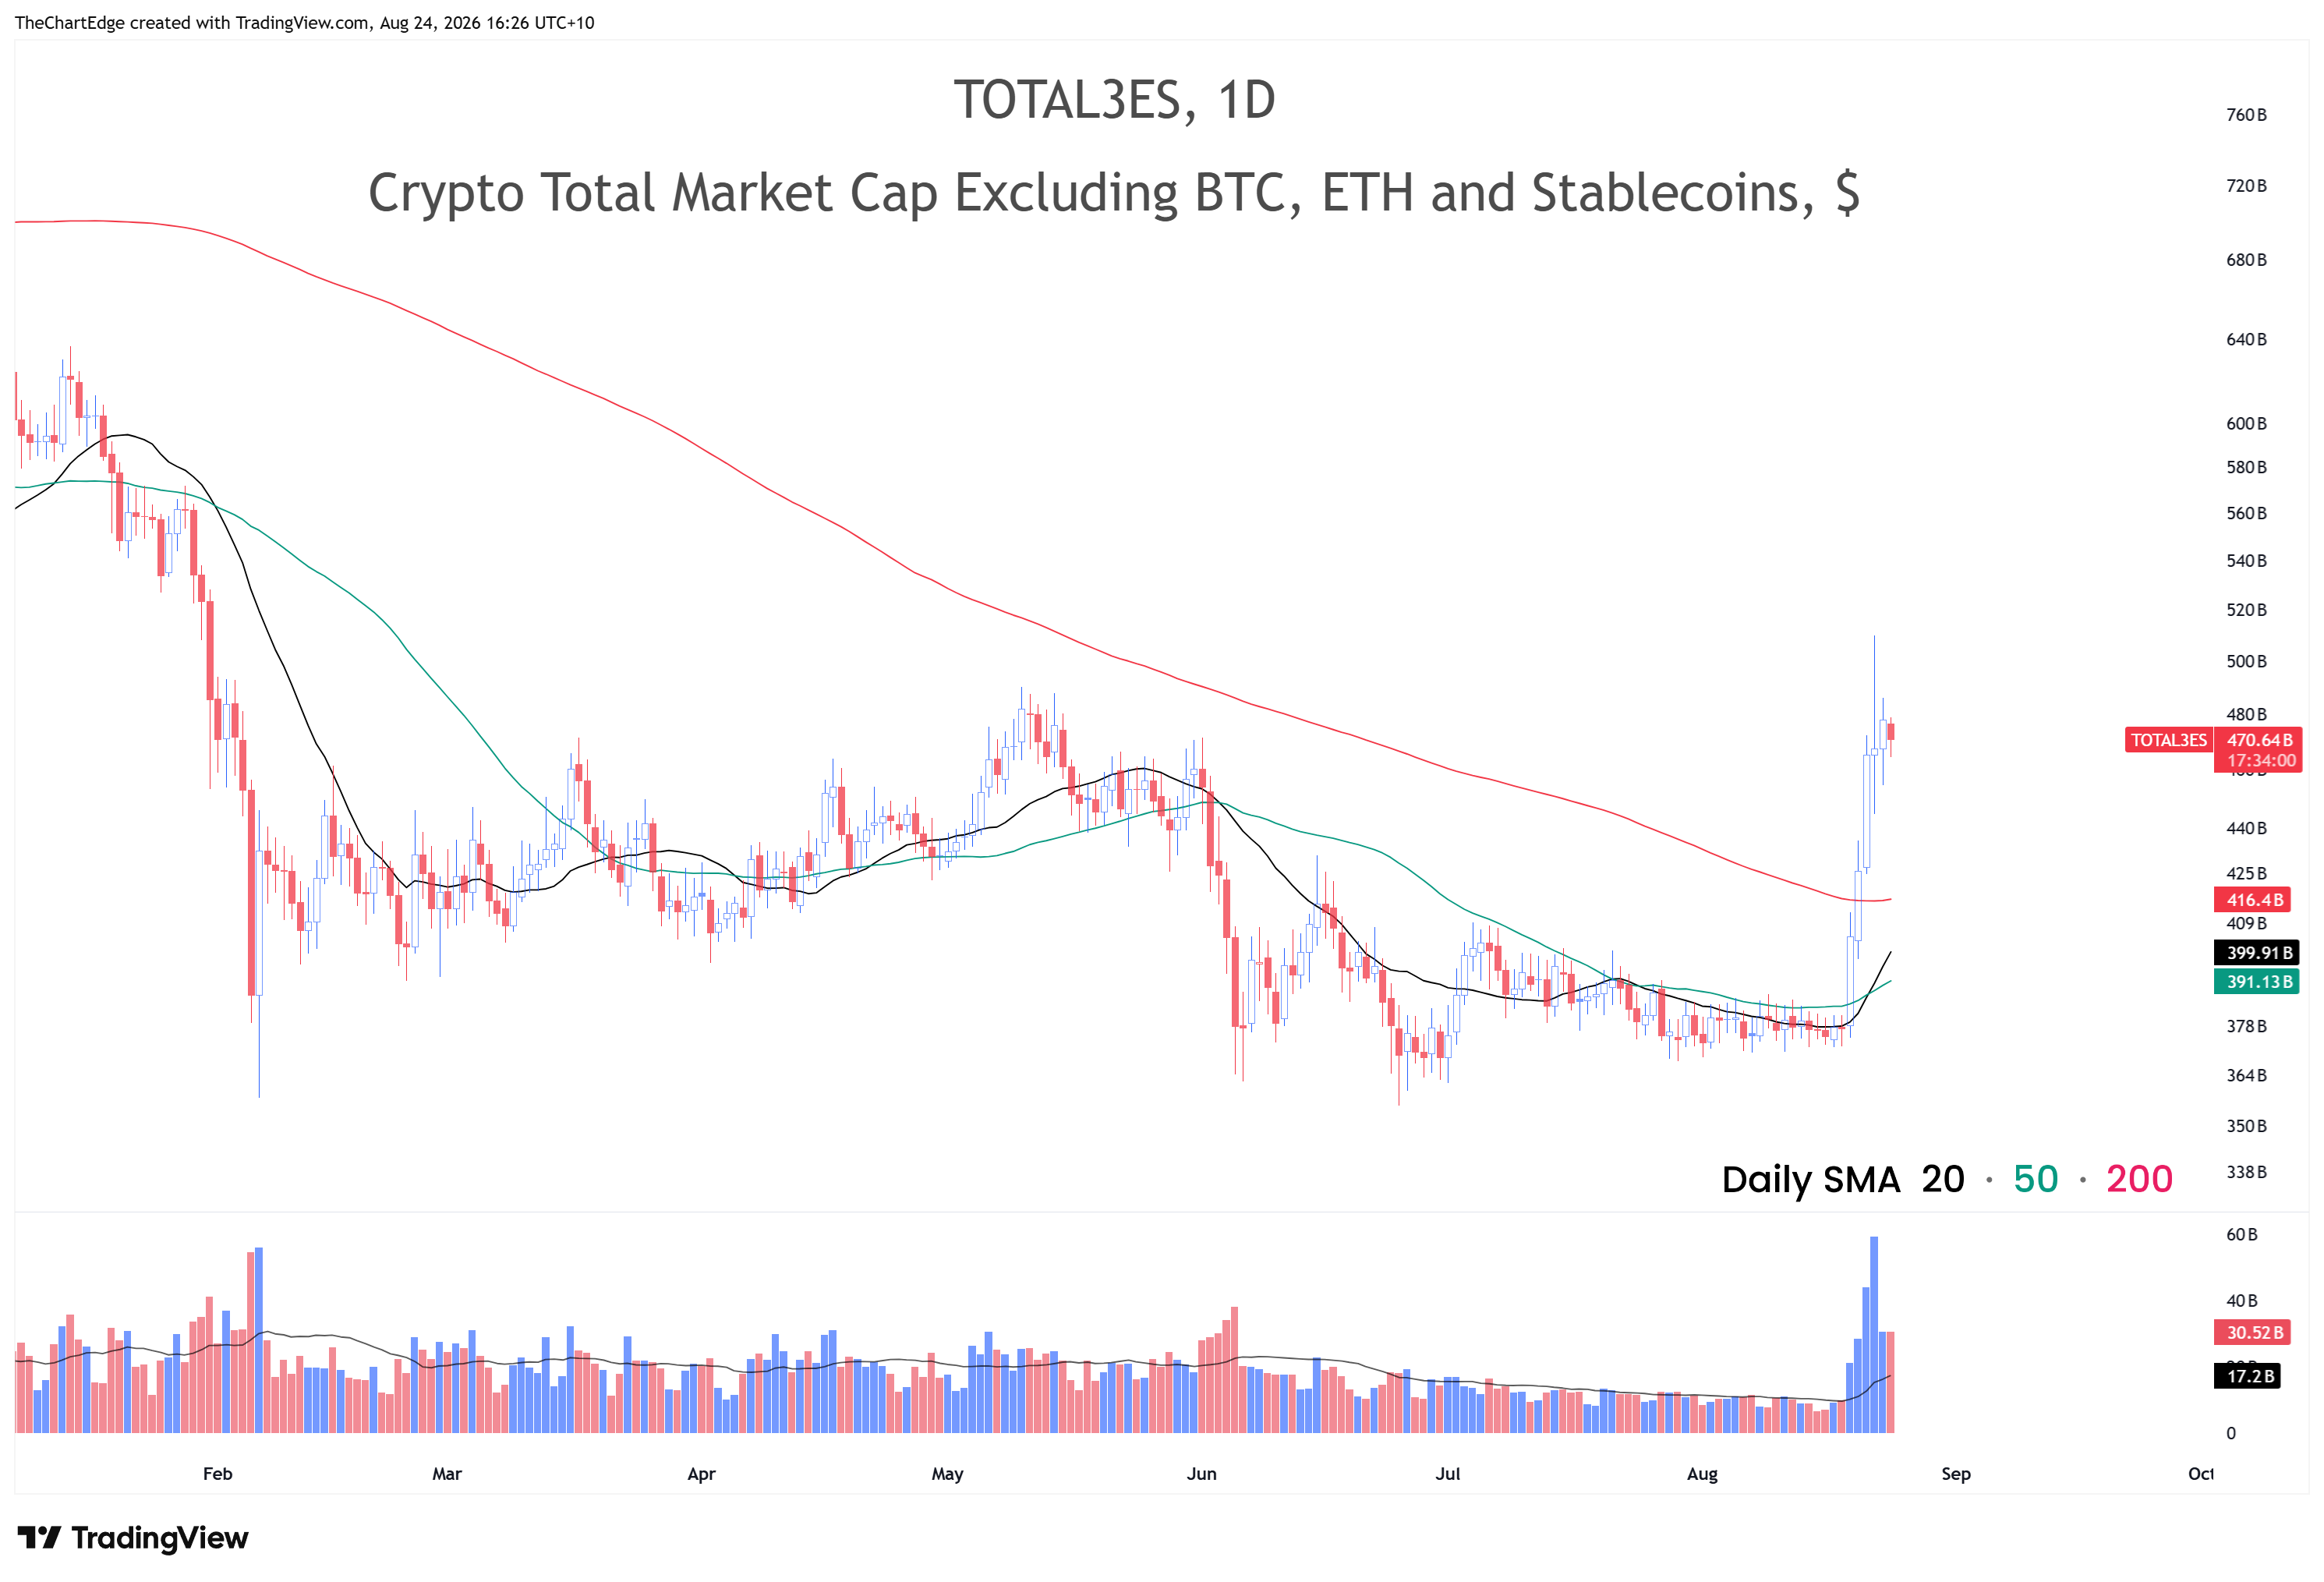
Bitcoin (IBIT) and Ethereum (ETHA) both had monster weeks up over 20%. Both are now above their 200-day SMA - the ETFs only just, but the spot charts are well above. It wasn’t just the big two either, with crypto total market cap excluding BTC, ETH and stablecoins up over 20% for the week as well. I will try to write a deep dive into crypto and which coins are leading later this week.
BTC Chart
Total3ES Chart
Follow-Up on Ethereum
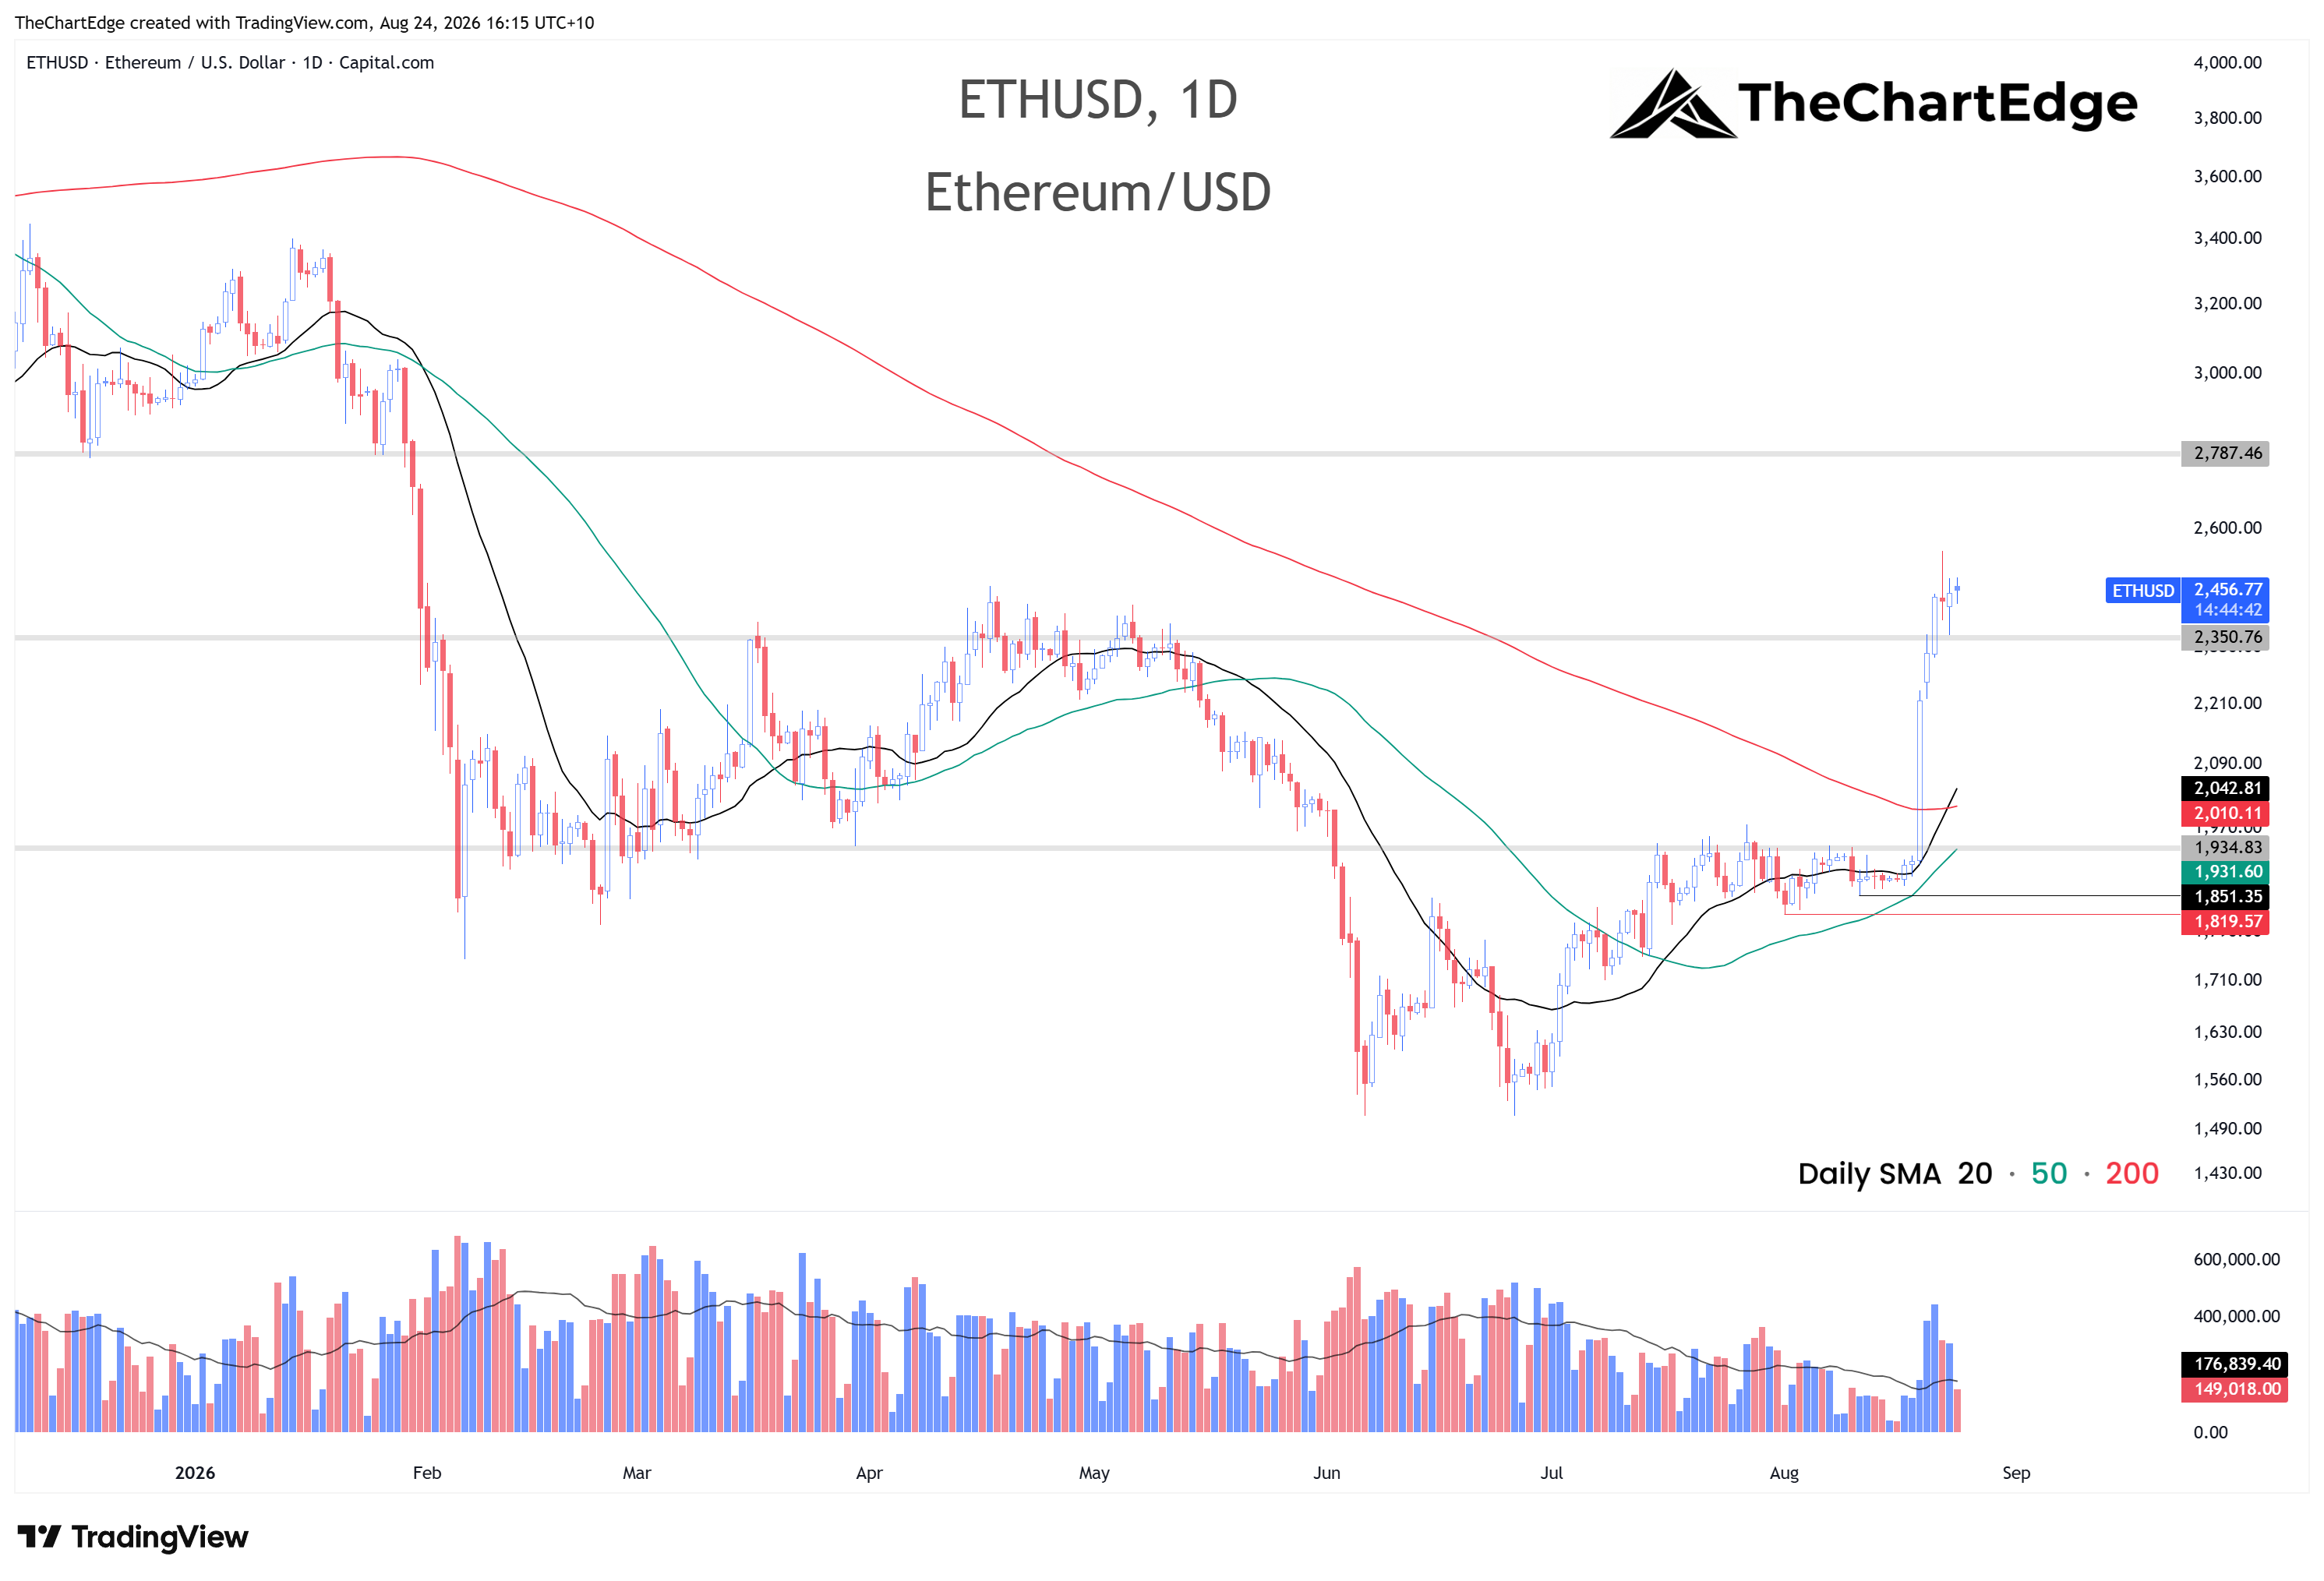
My buy stop order triggered last Wednesday. Due to the intensity of the move, I took profits near my first target around 2350. It has been consolidating above 2350 over the weekend and so far today on Monday (Melbourne time). If I were still in the trade, I would trail my stop-loss up under 2350 to lock in some gains. Ideally it can consolidate last week’s move here for a bit and offer a new entry with good risk-return.
Ethereum Chart
Healthcare and Biotech
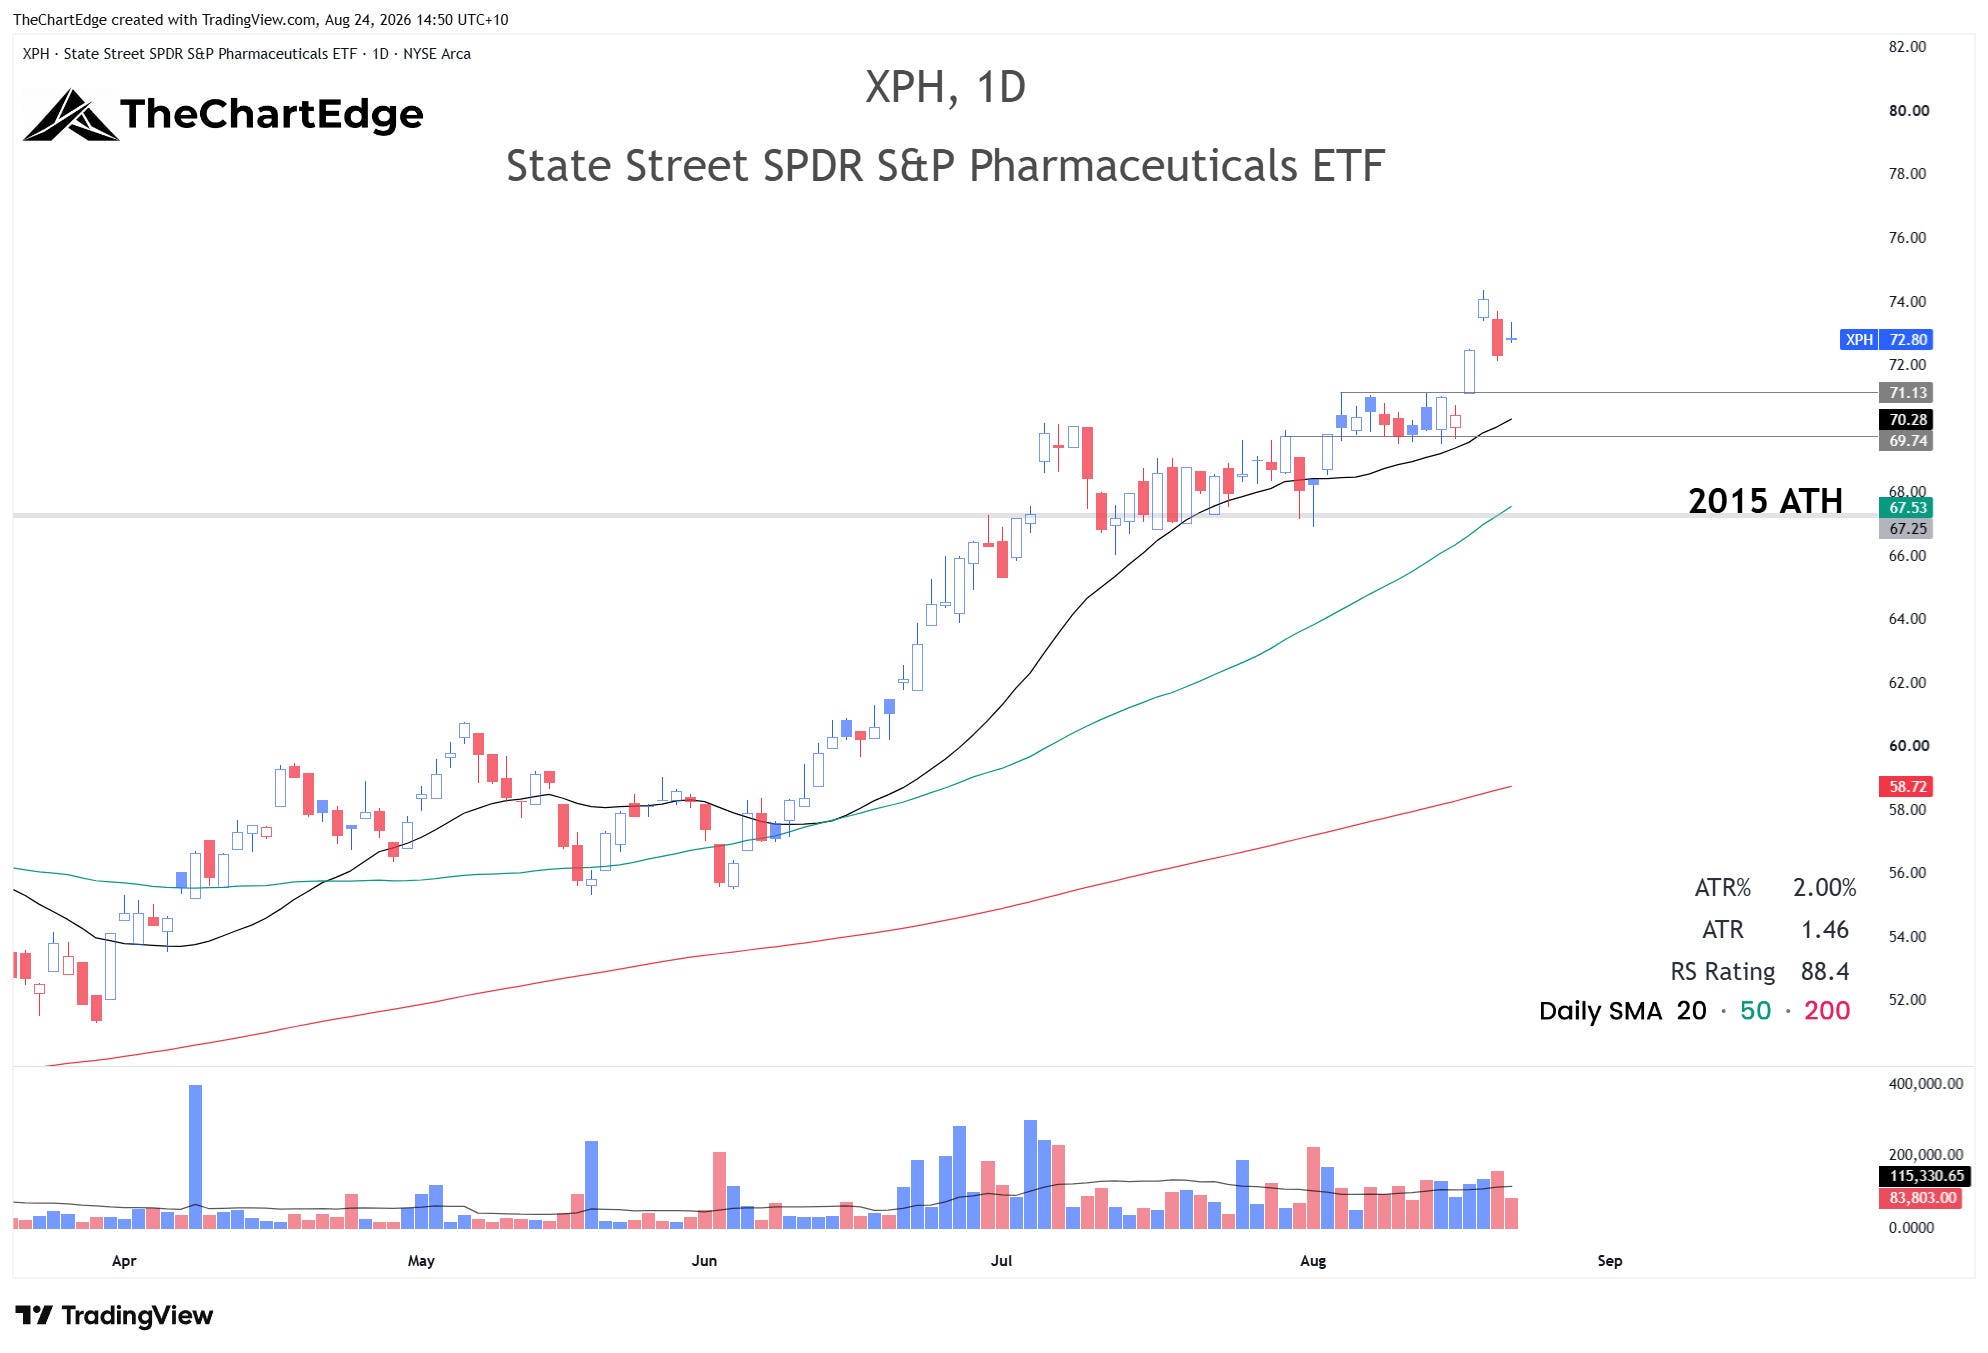
Healthcare (XLV) was the best GICS sector on the week and broader health care & biotech occupy 7 of the top 20 ETFs on the Momentum Leaderboard. Biotech Large-Cap (IBB) is a bit extended, around 4 x ATR from its 20-day SMA, and Genomics (ARKG) closer to 5 x ATR. Pharmaceuticals (XPH) is highly correlated with IBB but only around 2 x ATR from its 20-day. I am considering entering a position if we get a pullback towards 71, with a stop-loss under 69.
XPH Chart
Follow-Up on XBI
I am still waiting on a resolution from my broker on the missed 154.50 fill - XBI itself closed at 165.73, roughly midway between where the entry should have filled and my initial target of 174.
Yields
The 10-year yield finished at 4.74% and the 30-year at 5.28% - right around the levels I said I’d be watching last week. It’s hard to know what to make of this, especially given the announcement by Bessent that the Treasury would double its long-end buybacks, which initially caused yields to fall, only to rise again on Thursday and Friday. I am not overly concerned at this stage, but it’s something to keep an eye on in coming weeks.
The Week Ahead
Last week’s broadening stalled and semis (SMH & XSD) failed at their 50-day SMA. The four names on my watchlist (STX, TER, LITE and TSEM), some of the better-looking AI related names, had a bad week after one good day on Monday. Now only LITE is above its 20 and 50-day SMA. For now, it looks like there are better ponds to fish in.
On the positive side the major index pullbacks still look orderly for now and the market temperature held in the Goldilocks Zone. In terms of new trades, I am going to focus on SPY (or the S&P 500 CFD), LIT and XPH, and will be watching crypto closely this week.
Stay open-minded and manage risk carefully.
Cheers,
Marcus Grant, CFTe
Disclaimer: The content provided in this newsletter is for informational and educational purposes only and should not be considered as financial, investment, or legal advice. The information shared is based on our research and analysis, but we are not a licensed financial advisor, nor can we guarantee its accuracy, completeness, or timeliness. Market conditions and financial instruments can change rapidly, and any opinions expressed may not be suitable for all investors. Any opinions expressed and or securities mentioned do not constitute a recommendation to buy, sell, or hold that or any other security. You should conduct your own due diligence and consult with a licensed financial advisor or other professional before making any investment decisions. Past performance is not indicative of future results, and all investments carry the risk of loss. The authors and publishers of this newsletter are not responsible for any financial decisions made based on the content provided herein. By reading and or subscribing to this newsletter, you acknowledge and agree that you are using the information at your own risk.