

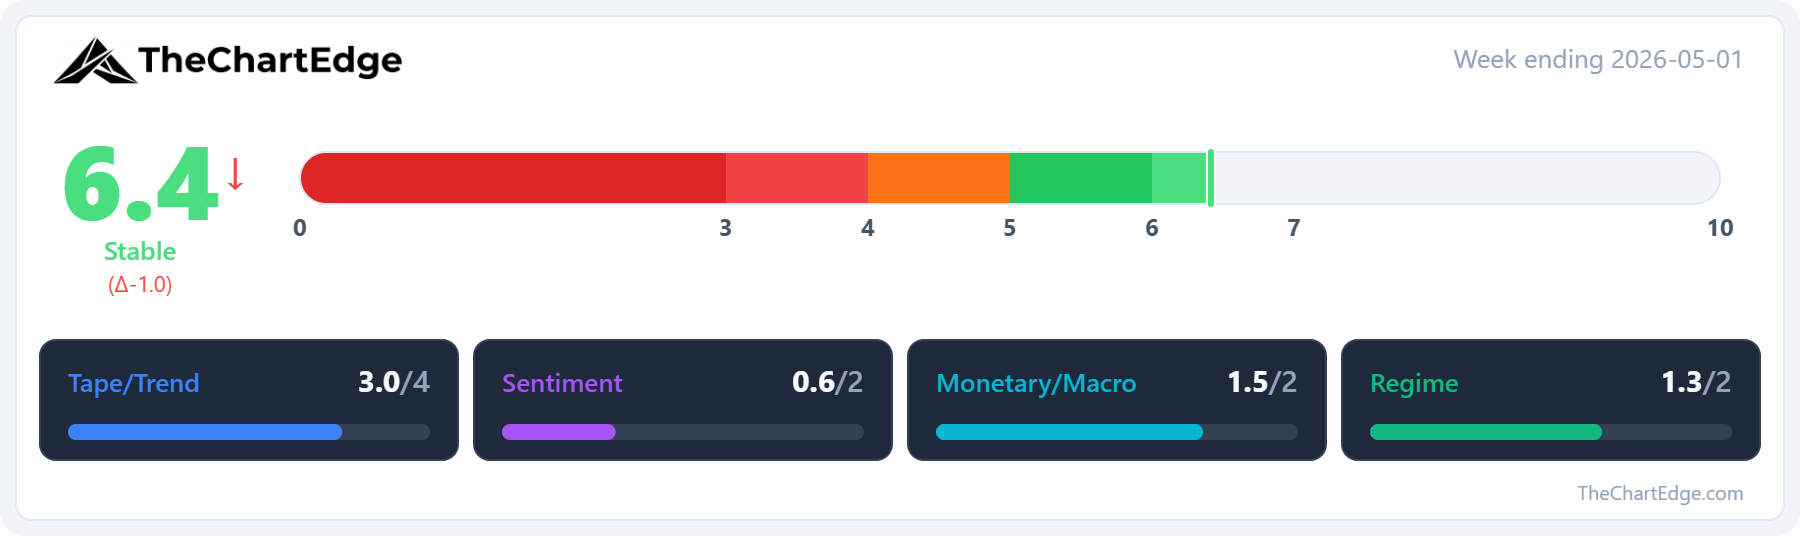
Market Temperature Drops to 6.4 - Major Indices Continue to Grind Higher
Semis, AI names and oil still leading, while lithium and rare earths bounce back

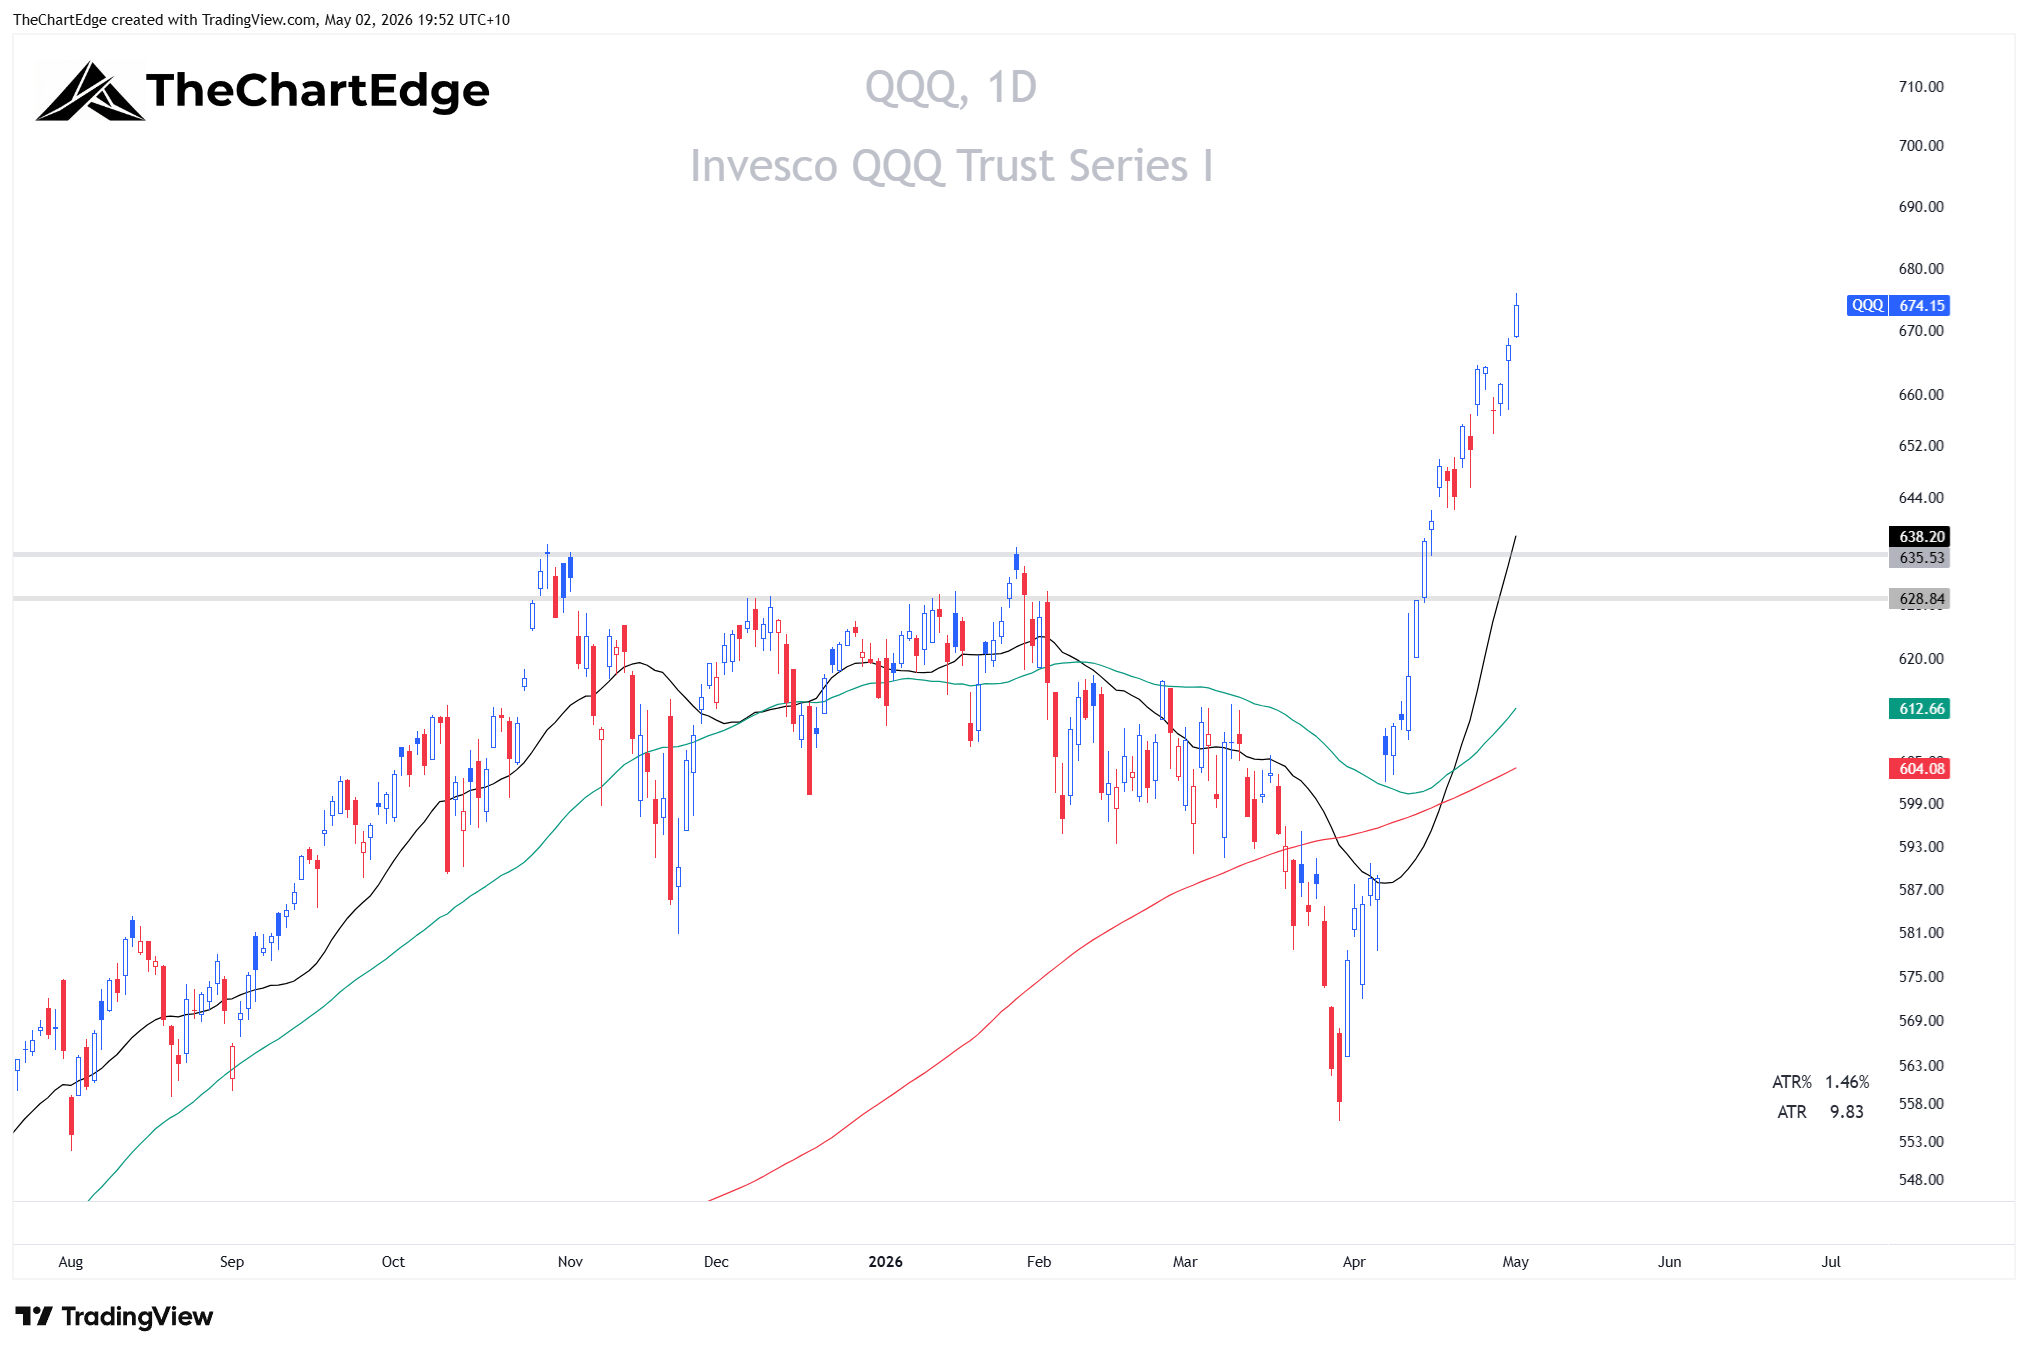
It was another constructive week for the major indices at or near all-time highs. The S&P 500 (SPY) gained 0.94%, the Nasdaq 100 (QQQ) was up 1.55%, and the Dow (DIA) added 0.57%. The S&P MidCap 400 (MDY) was essentially flat at -0.02%, and the Russell 2000 (IWM) gained 0.95%. Micro-caps (IWC) were up 1.27% and moved into the Leading quadrant. FANG+ (FNGS) gained 1.10% but dropped back from Leading to Improving.
Both SPY and QQQ closed at new all-time highs for the week. Worth noting though - SPY gapped up on Friday and pushed higher but reversed to close on the lows, just under where it opened. QQQ held its gains and continues to be the leader.
SPY Chart
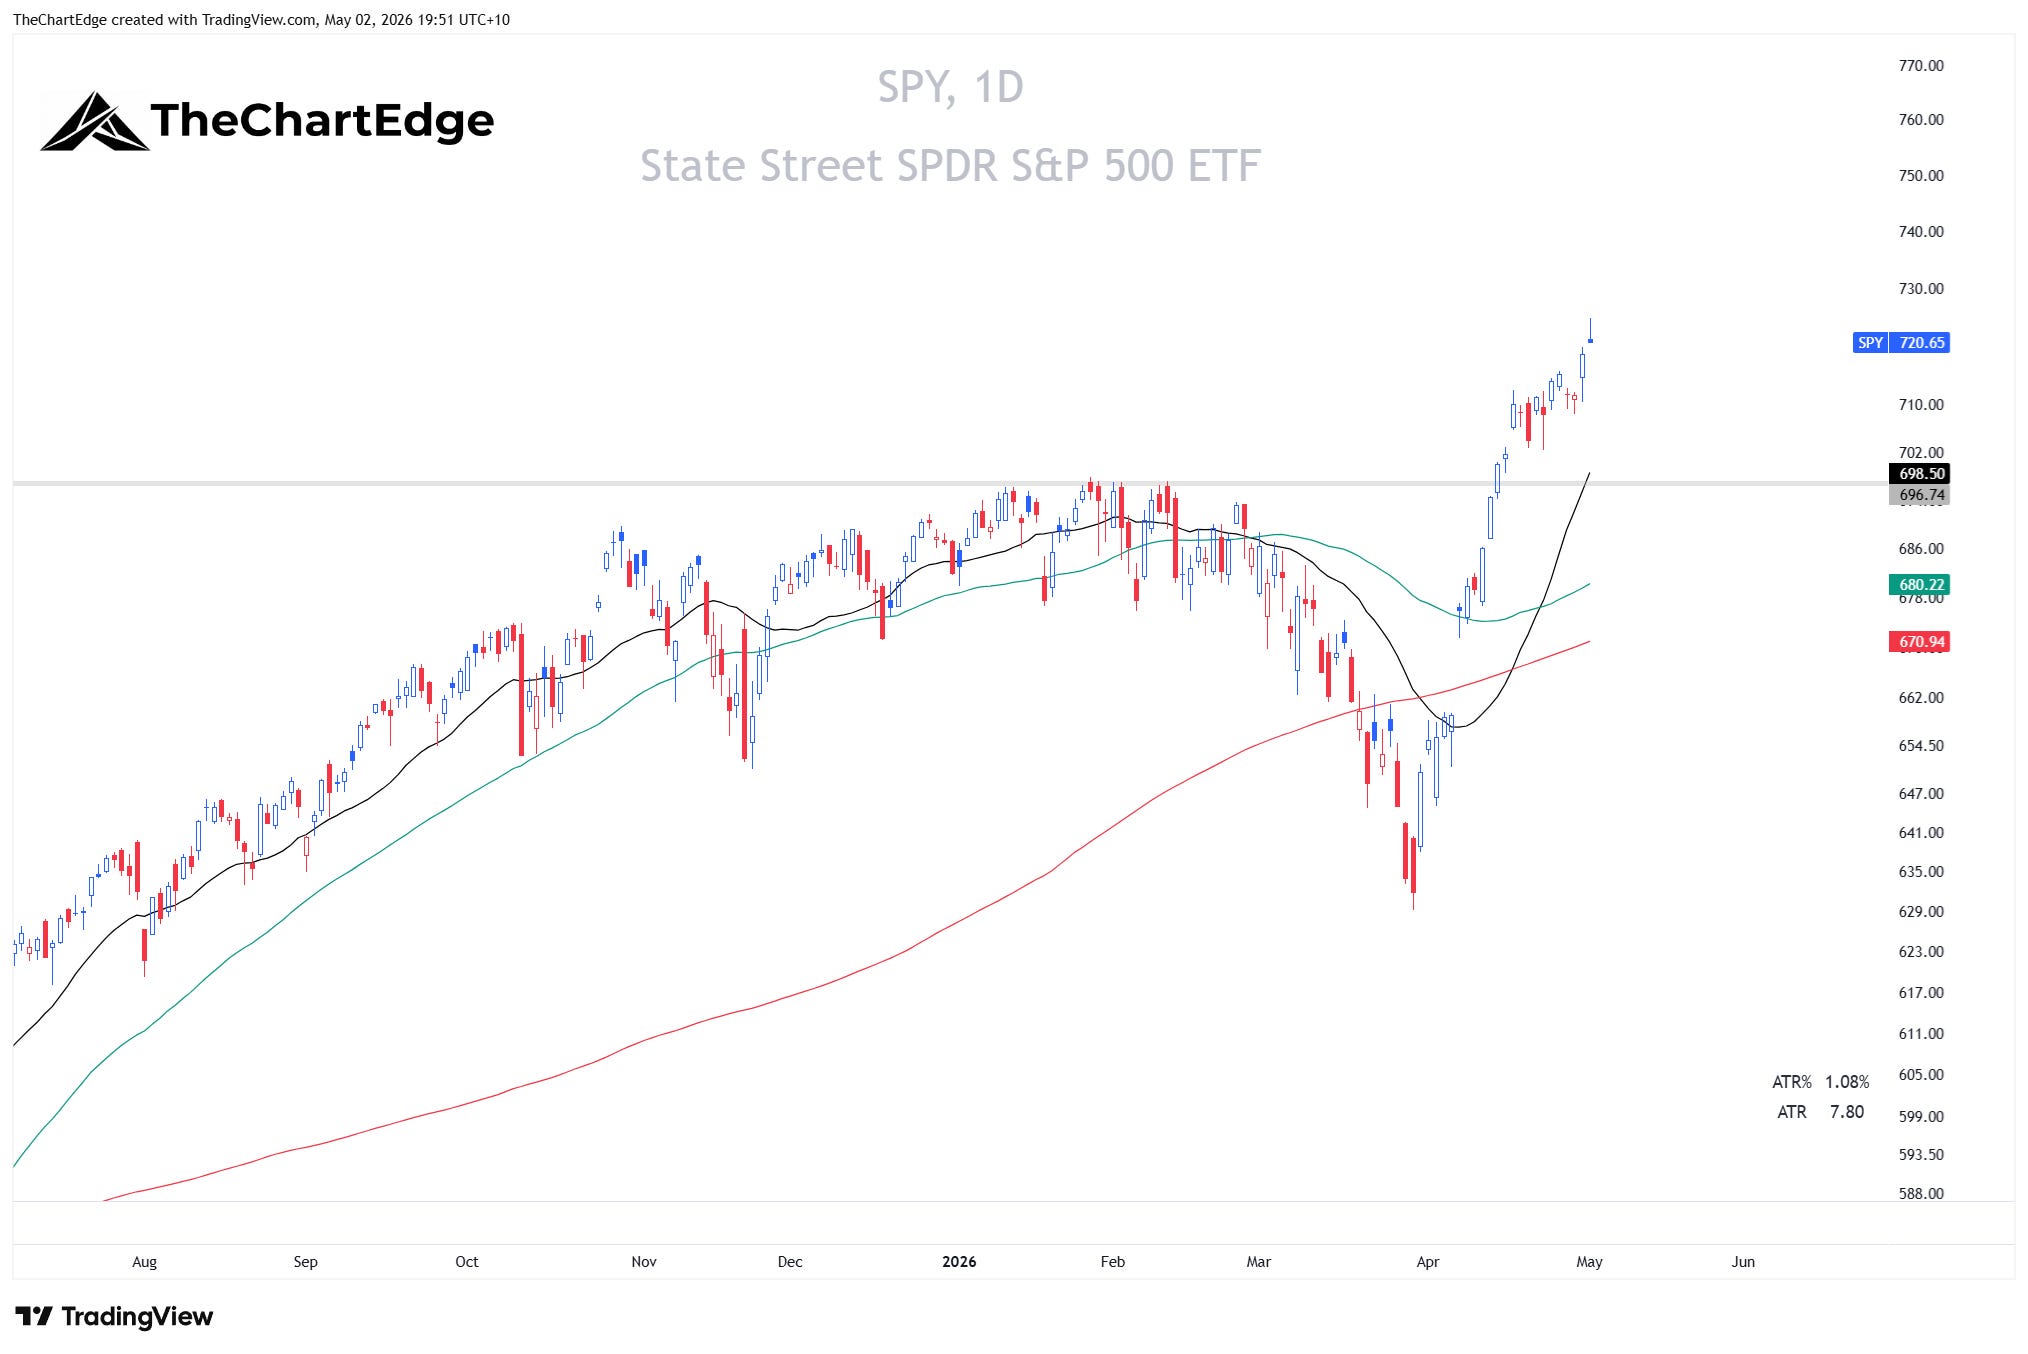
For all daily charts the black line is the 20-day SMA, the green is the 50-day SMA, and the red is the 200-day SMA.
QQQ Chart
The Market Temperature dropped from 7.4 to 6.4 - back below the Surge zone (7.0+) after one week. The 6.4 reading is classified as Stable due to the 1 point drop.
If you read last week’s post, I went through the historical context for Surge readings. In the model’s backtest period from 2016, post-correction thrusts into Surge have typically lasted just one week. November 2023, December 2023, and July 2025 all dropped back below 7.0 the following week. So this is consistent with the pattern.
What is a bit different this time is the size of the drop. Those three prior falls from Surge fell by 0.37 to 0.48 points. This week’s drop of 1.0 is roughly double that, and the landing level of 6.4 is lower than any of those precedents. Still comfortably in the Stable zone - but worth being aware of.
Pillar Breakdown
Two pillars drove the drop in roughly equal measure.
Tape/Trend fell from 3.40 to 3.03 (out of 4). SPY and QQQ both held their Strong Uptrend trend states - the decline came entirely from breadth and RSI momentum scores. There’s a nuance here though. The model uses a two-week lookback for breadth scoring, so it sees MMFI (percentage of US stocks above their 50-day MA) declining from 69.2% to 63.7%. But week-over-week, MMFI actually ticked up from 62.4% to 63.7%. MMTH (200-day) was essentially flat at 55.9%.
Regime fell from 1.66 to 1.28 (out of 2). Driven mostly by the IWF/IWD (growth vs value) ratio turning down. Year-to-date, IWD (Value) is up 9.40% while IWF (Growth) is up just 0.75%. XLY/XLP (discretionary vs staples) also declined for a second consecutive week - XLY is down 1.21% year-to-date while XLP is up 8.31%. Both ratios are trading below their 200-day moving averages.
Monetary and Sentiment were barely changed. However, one divergence worth flagging - VIX dropped from 18.71 to 16.99 while MOVE (bond market volatility) rose from 66.97 to 70.41. Equity vol falling, rate vol rising. That sits alongside deterioration across fixed income ETFs - more on that later.
Extension from SMAs
The 20-day moving averages are catching up. SPY closed the week (May 1st) 3.17% above its 20-day SMA, down from 4.84% the prior week. QQQ was 5.63% above, compared to 7.90% the prior week. The 50-day extensions are barely changed (SPY 5.46% to 5.94%, QQQ 9.48% to 10.04%).
SPDR Sector Relative Strength
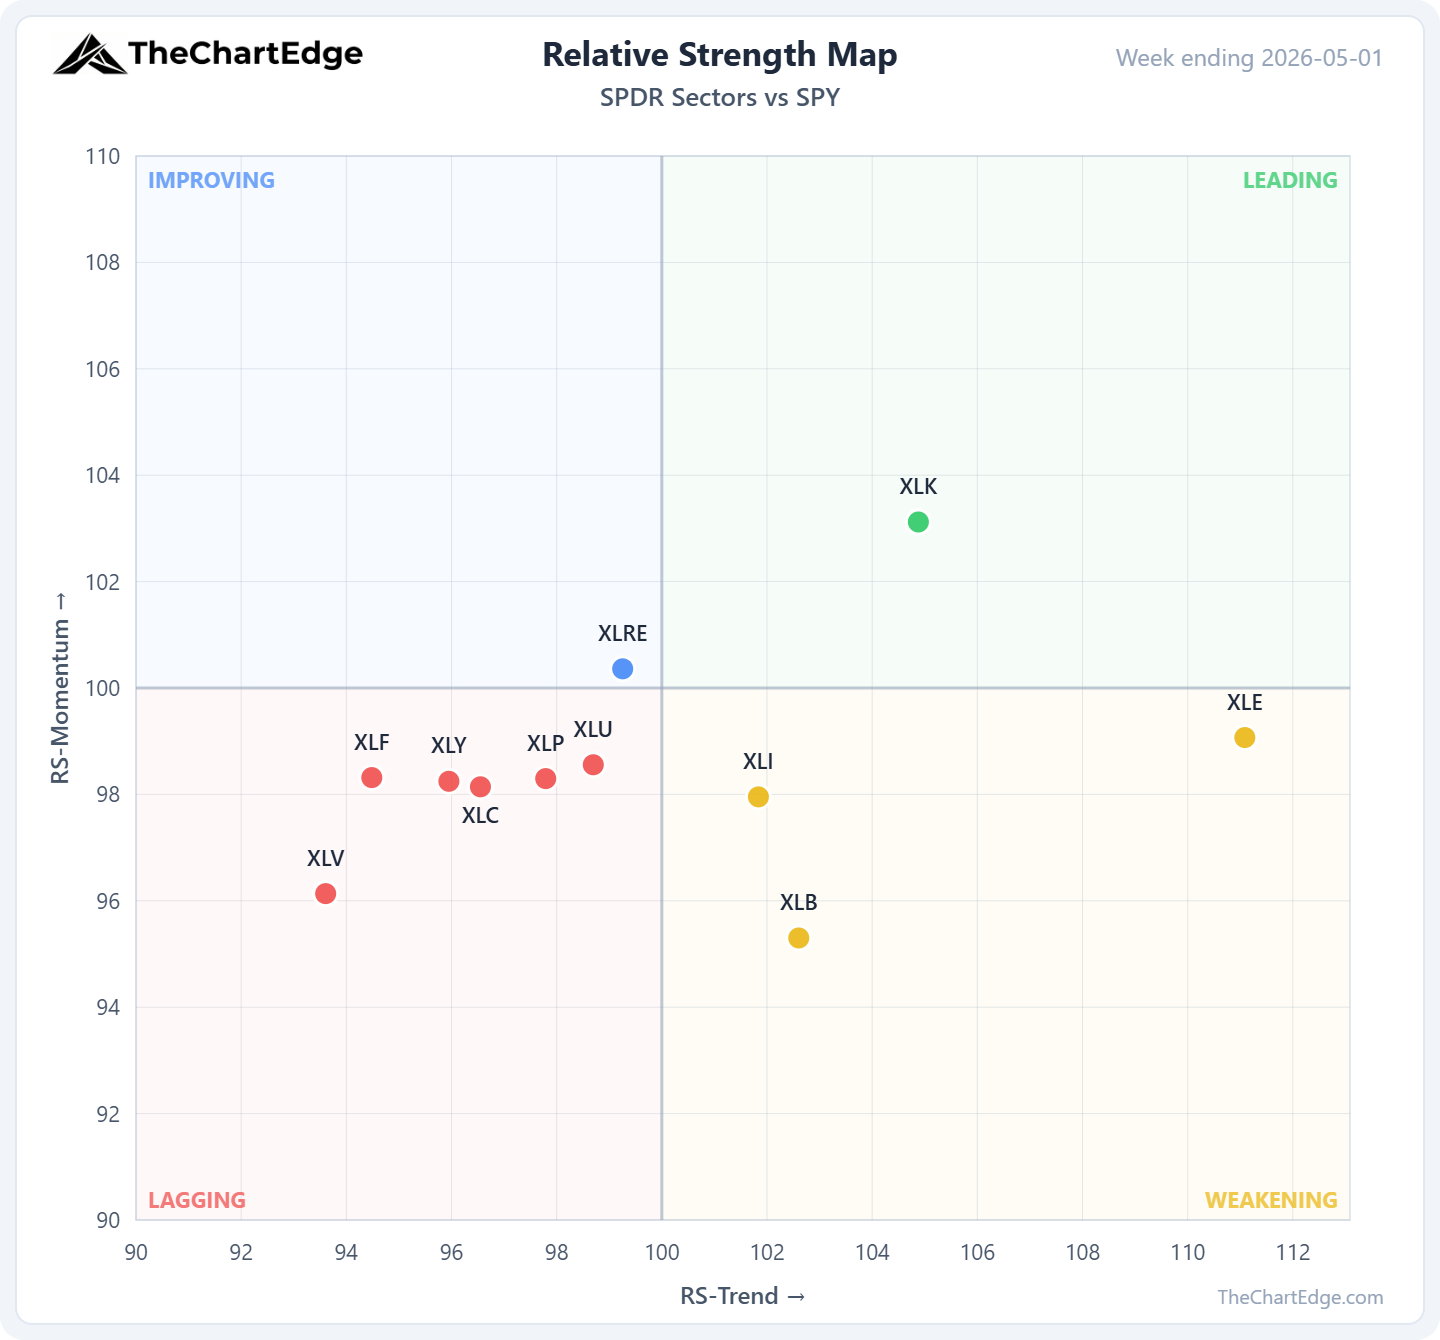
The SPDR sector picture is largely unchanged from last week. Technology (XLK) remains the only sector in the Leading quadrant. Real Estate (XLRE) is the one shift - it moved into Improving. Six of eleven sectors are Lagging, with Healthcare (XLV) and Financials (XLF) the weakest.
Semis and AI
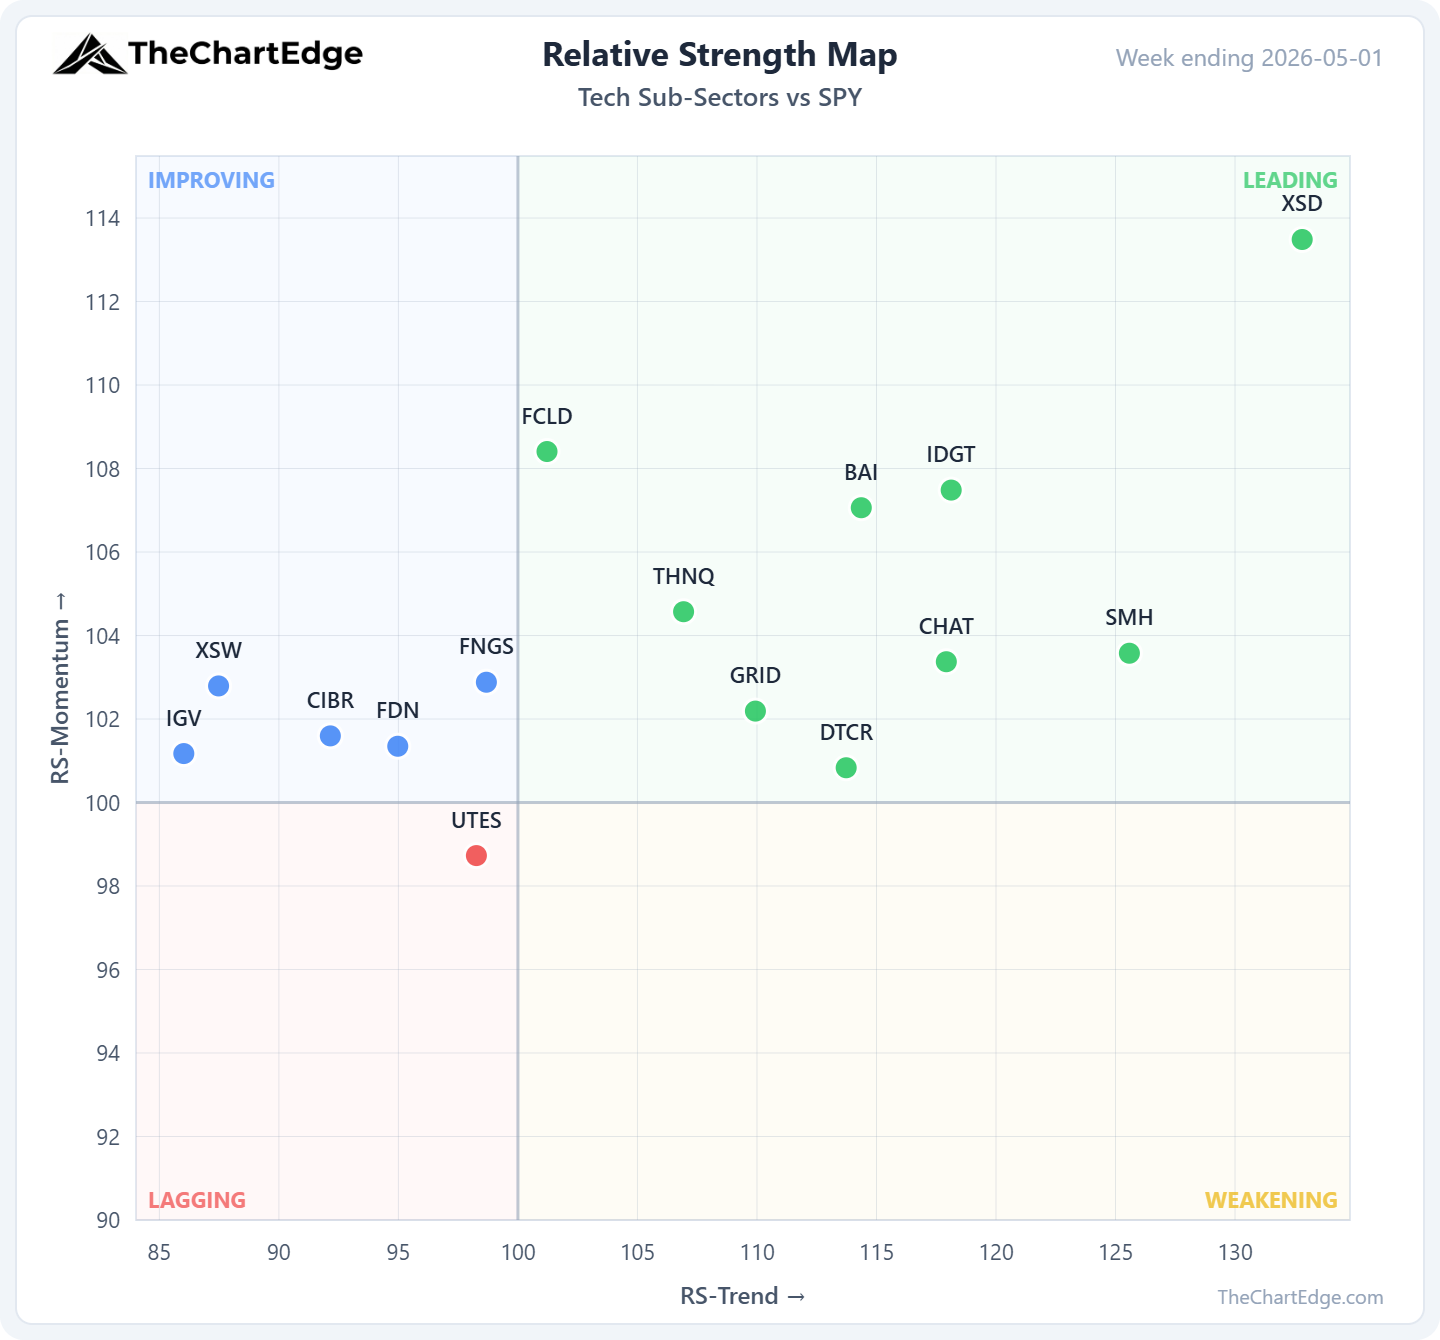
The semiconductor and AI infrastructure complex continues to lead. Every AI-related ETF I track - SMH, XSD, IDGT, DTCR, GRID, BAI, CHAT, THNQ - is in the Leading quadrant with a Strong Uptrend trend state. XSD (equal-weight semis) is still the strongest with an RS-Momentum of 113.49, up another 4.06% last week.
In our AI Custom Universe (81 names benchmarked against SMH), the number of Leading names rose from 16 to 25 and Lagging dropped from 37 to 28. Worth noting that last week’s elevated Lagging count was due to the SMH itself being up around 9%. Big moves in Leading names include Intel (+20.7% on the week), Bloom Energy (+25.8%) and STX (+24.00%).
FNGS slipped back from Leading to Improving. Its RS-Trend dropped back below 100 after only crossing it by 0.04 points last week.
Critical & Precious Metals
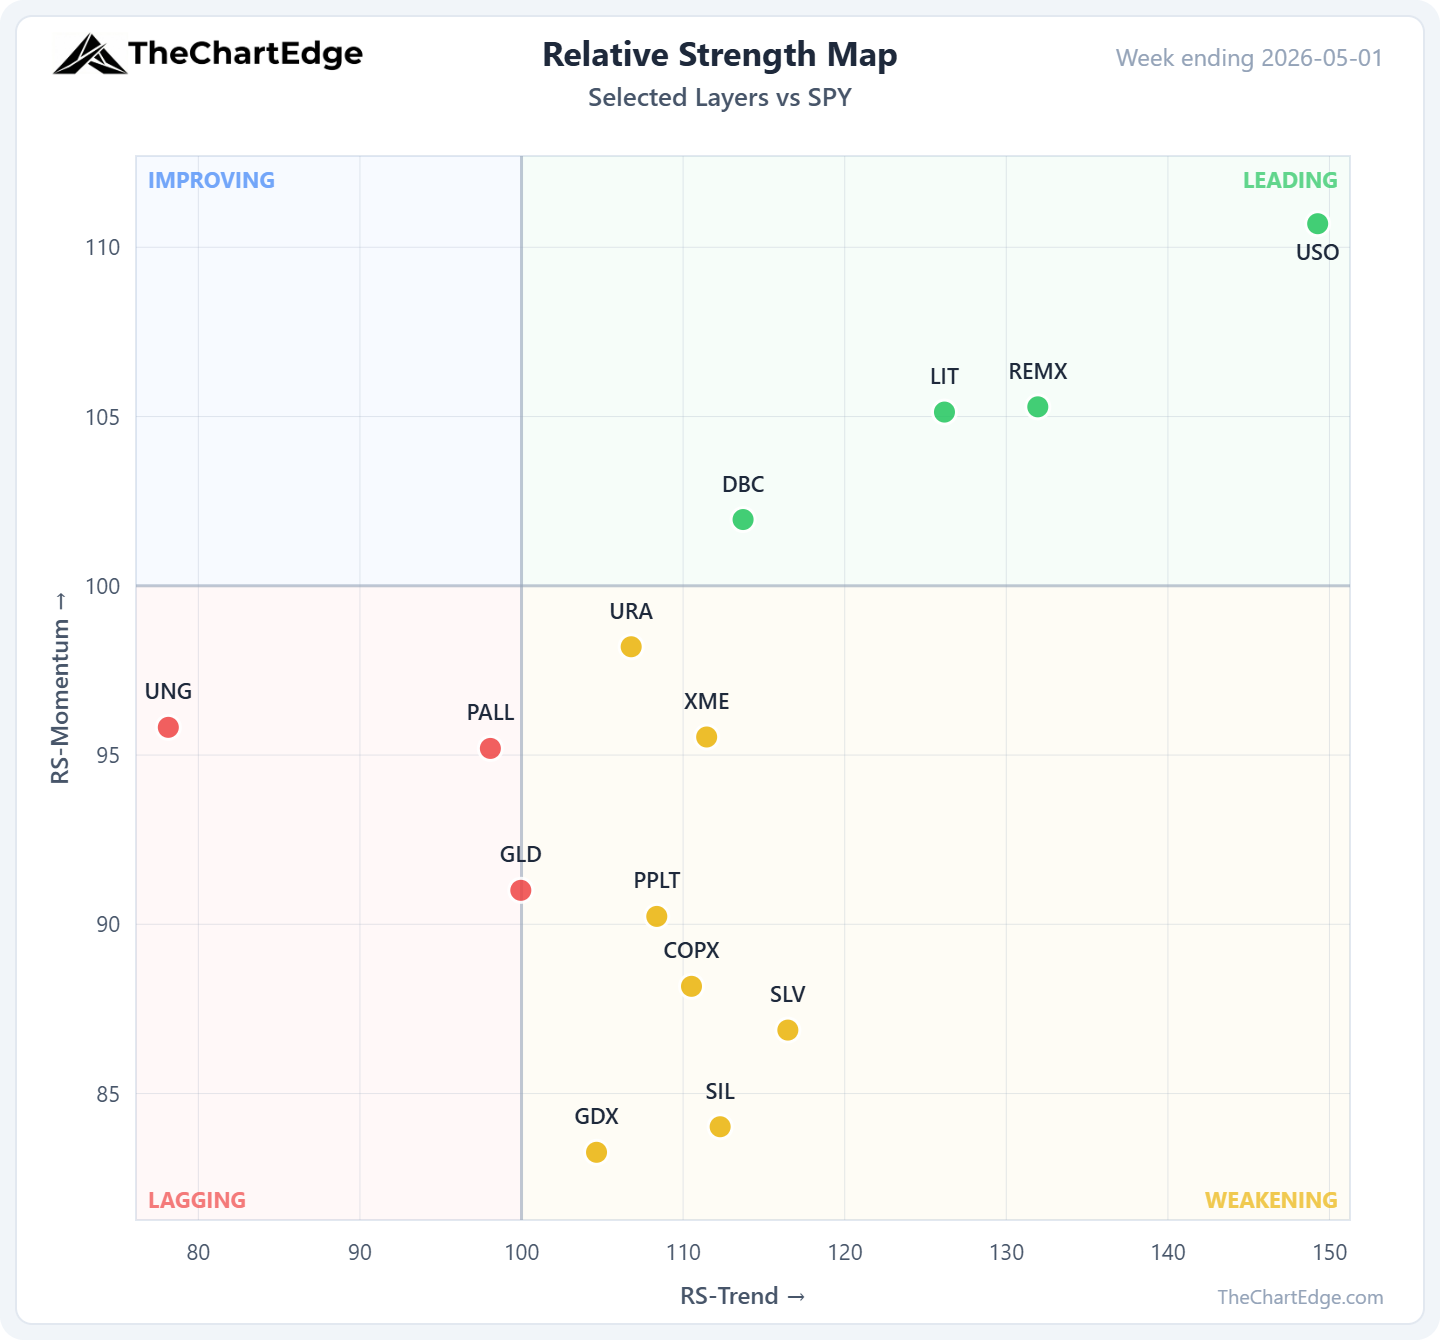
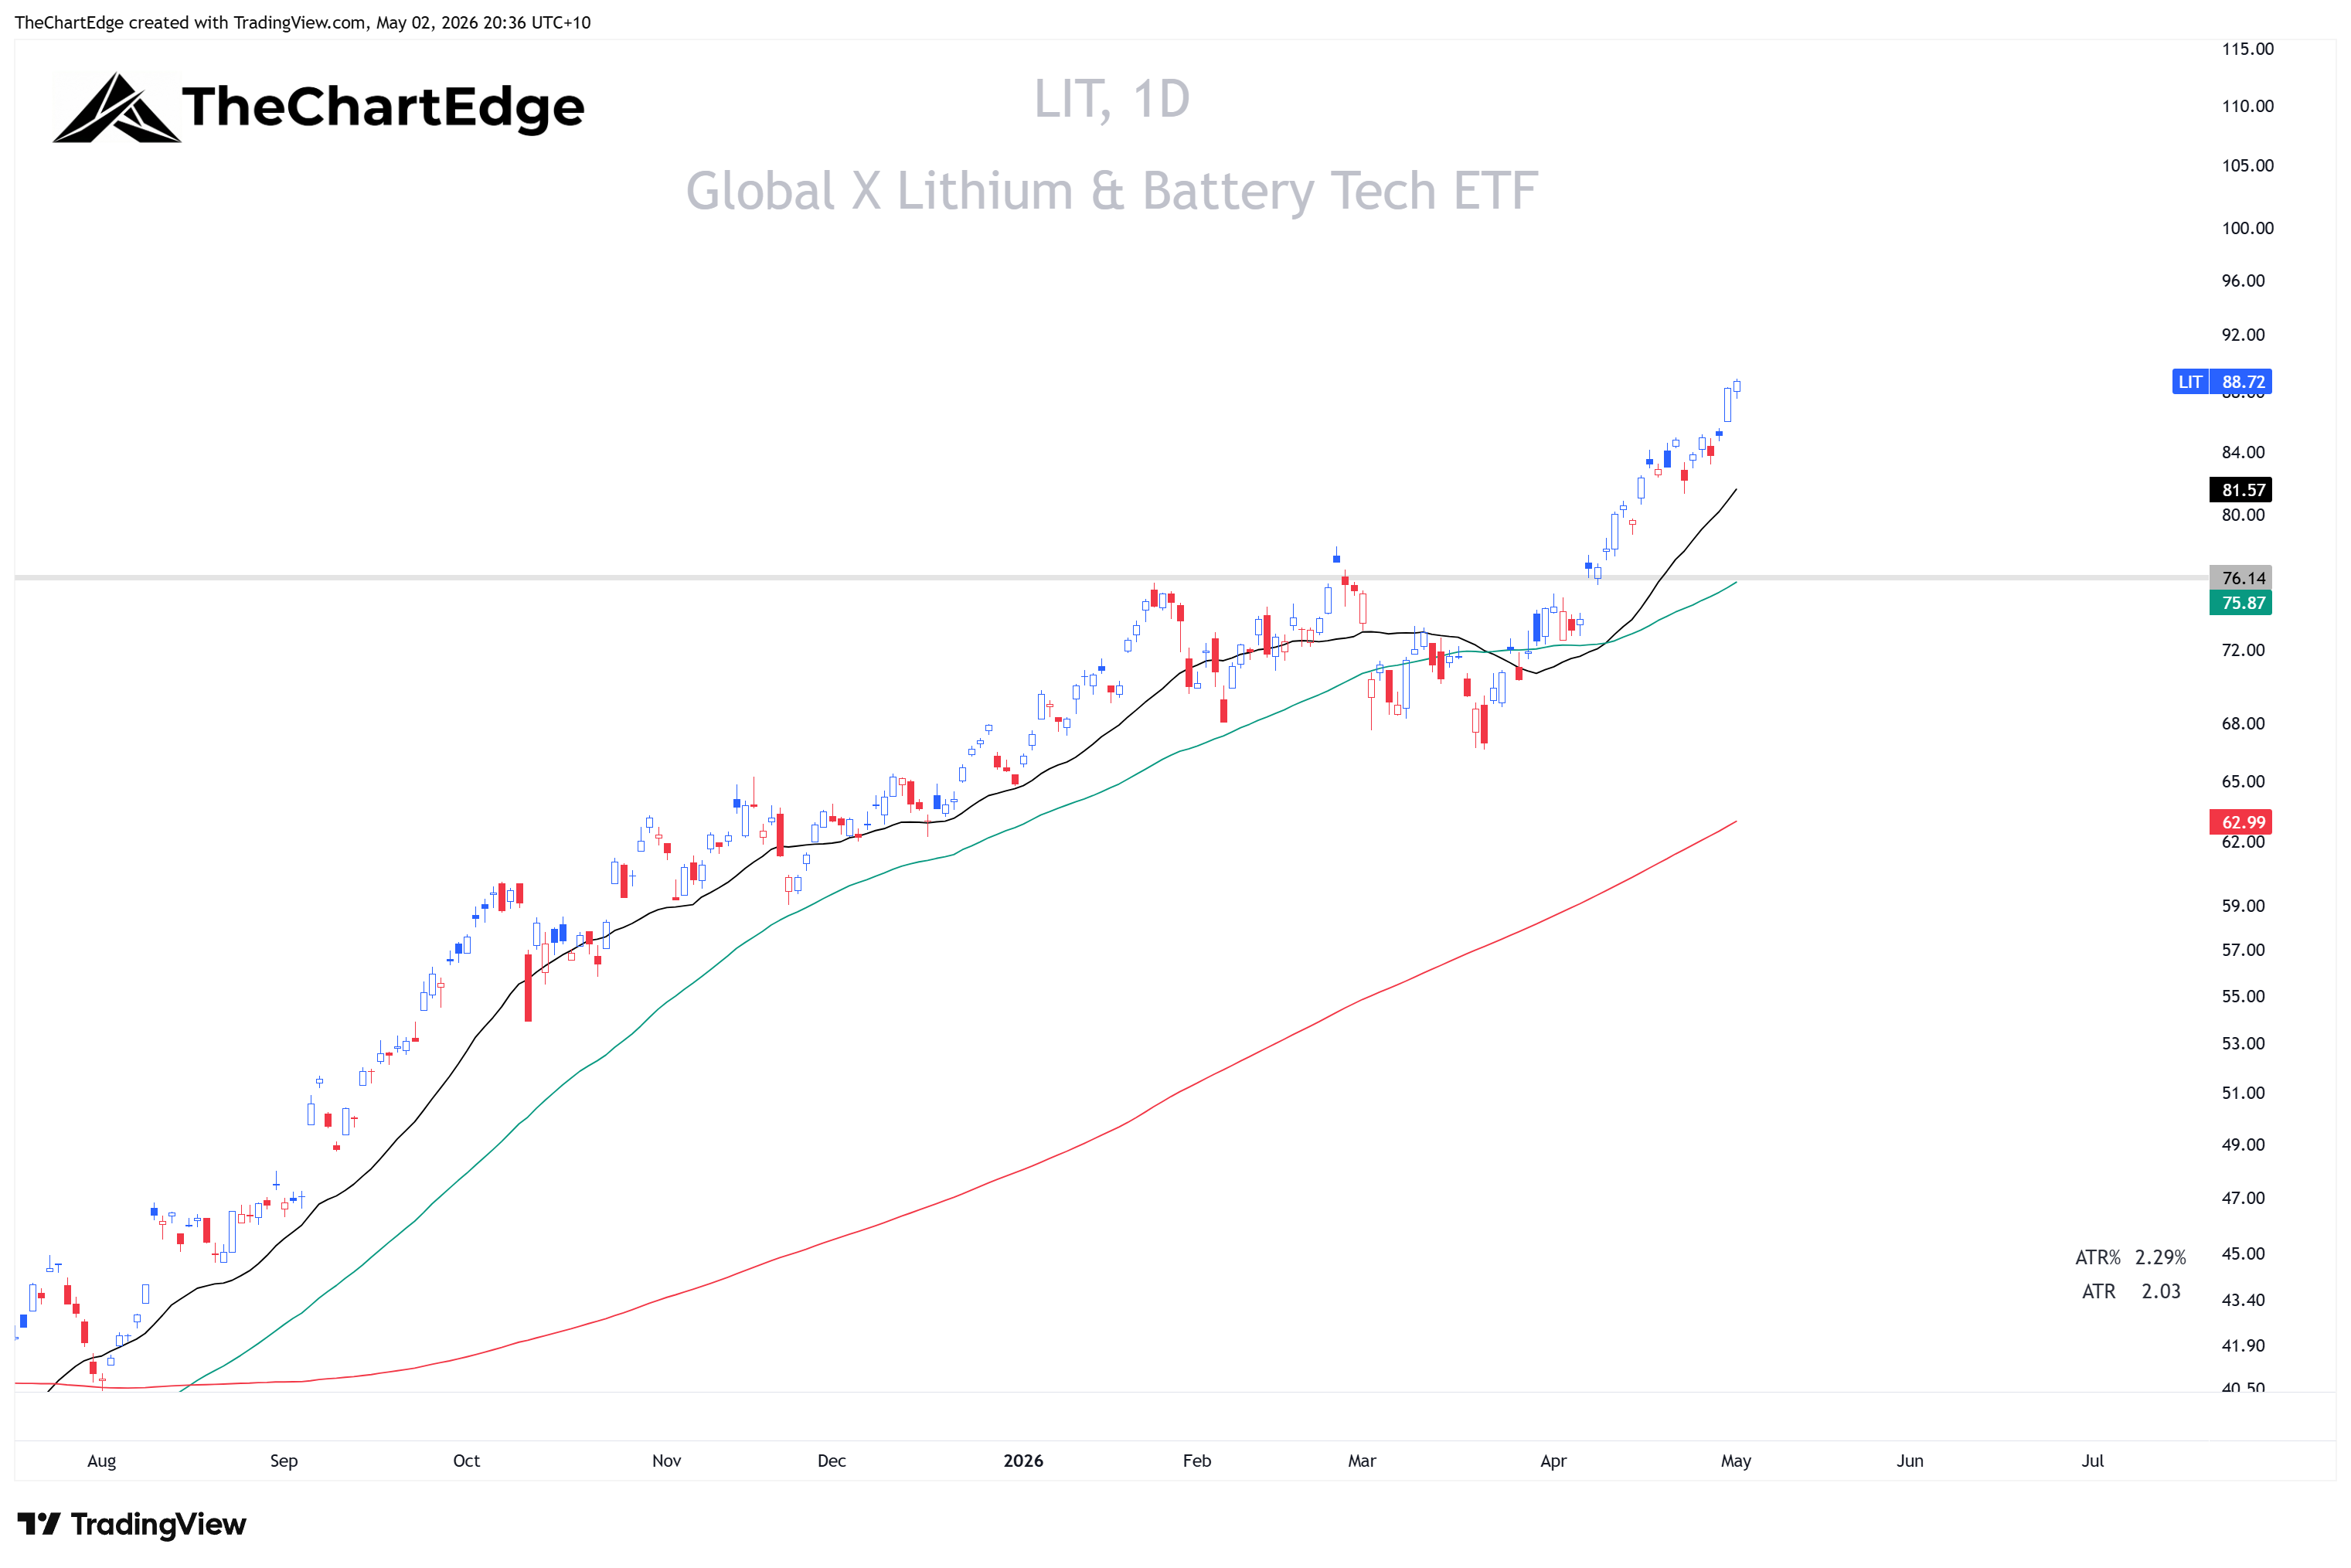
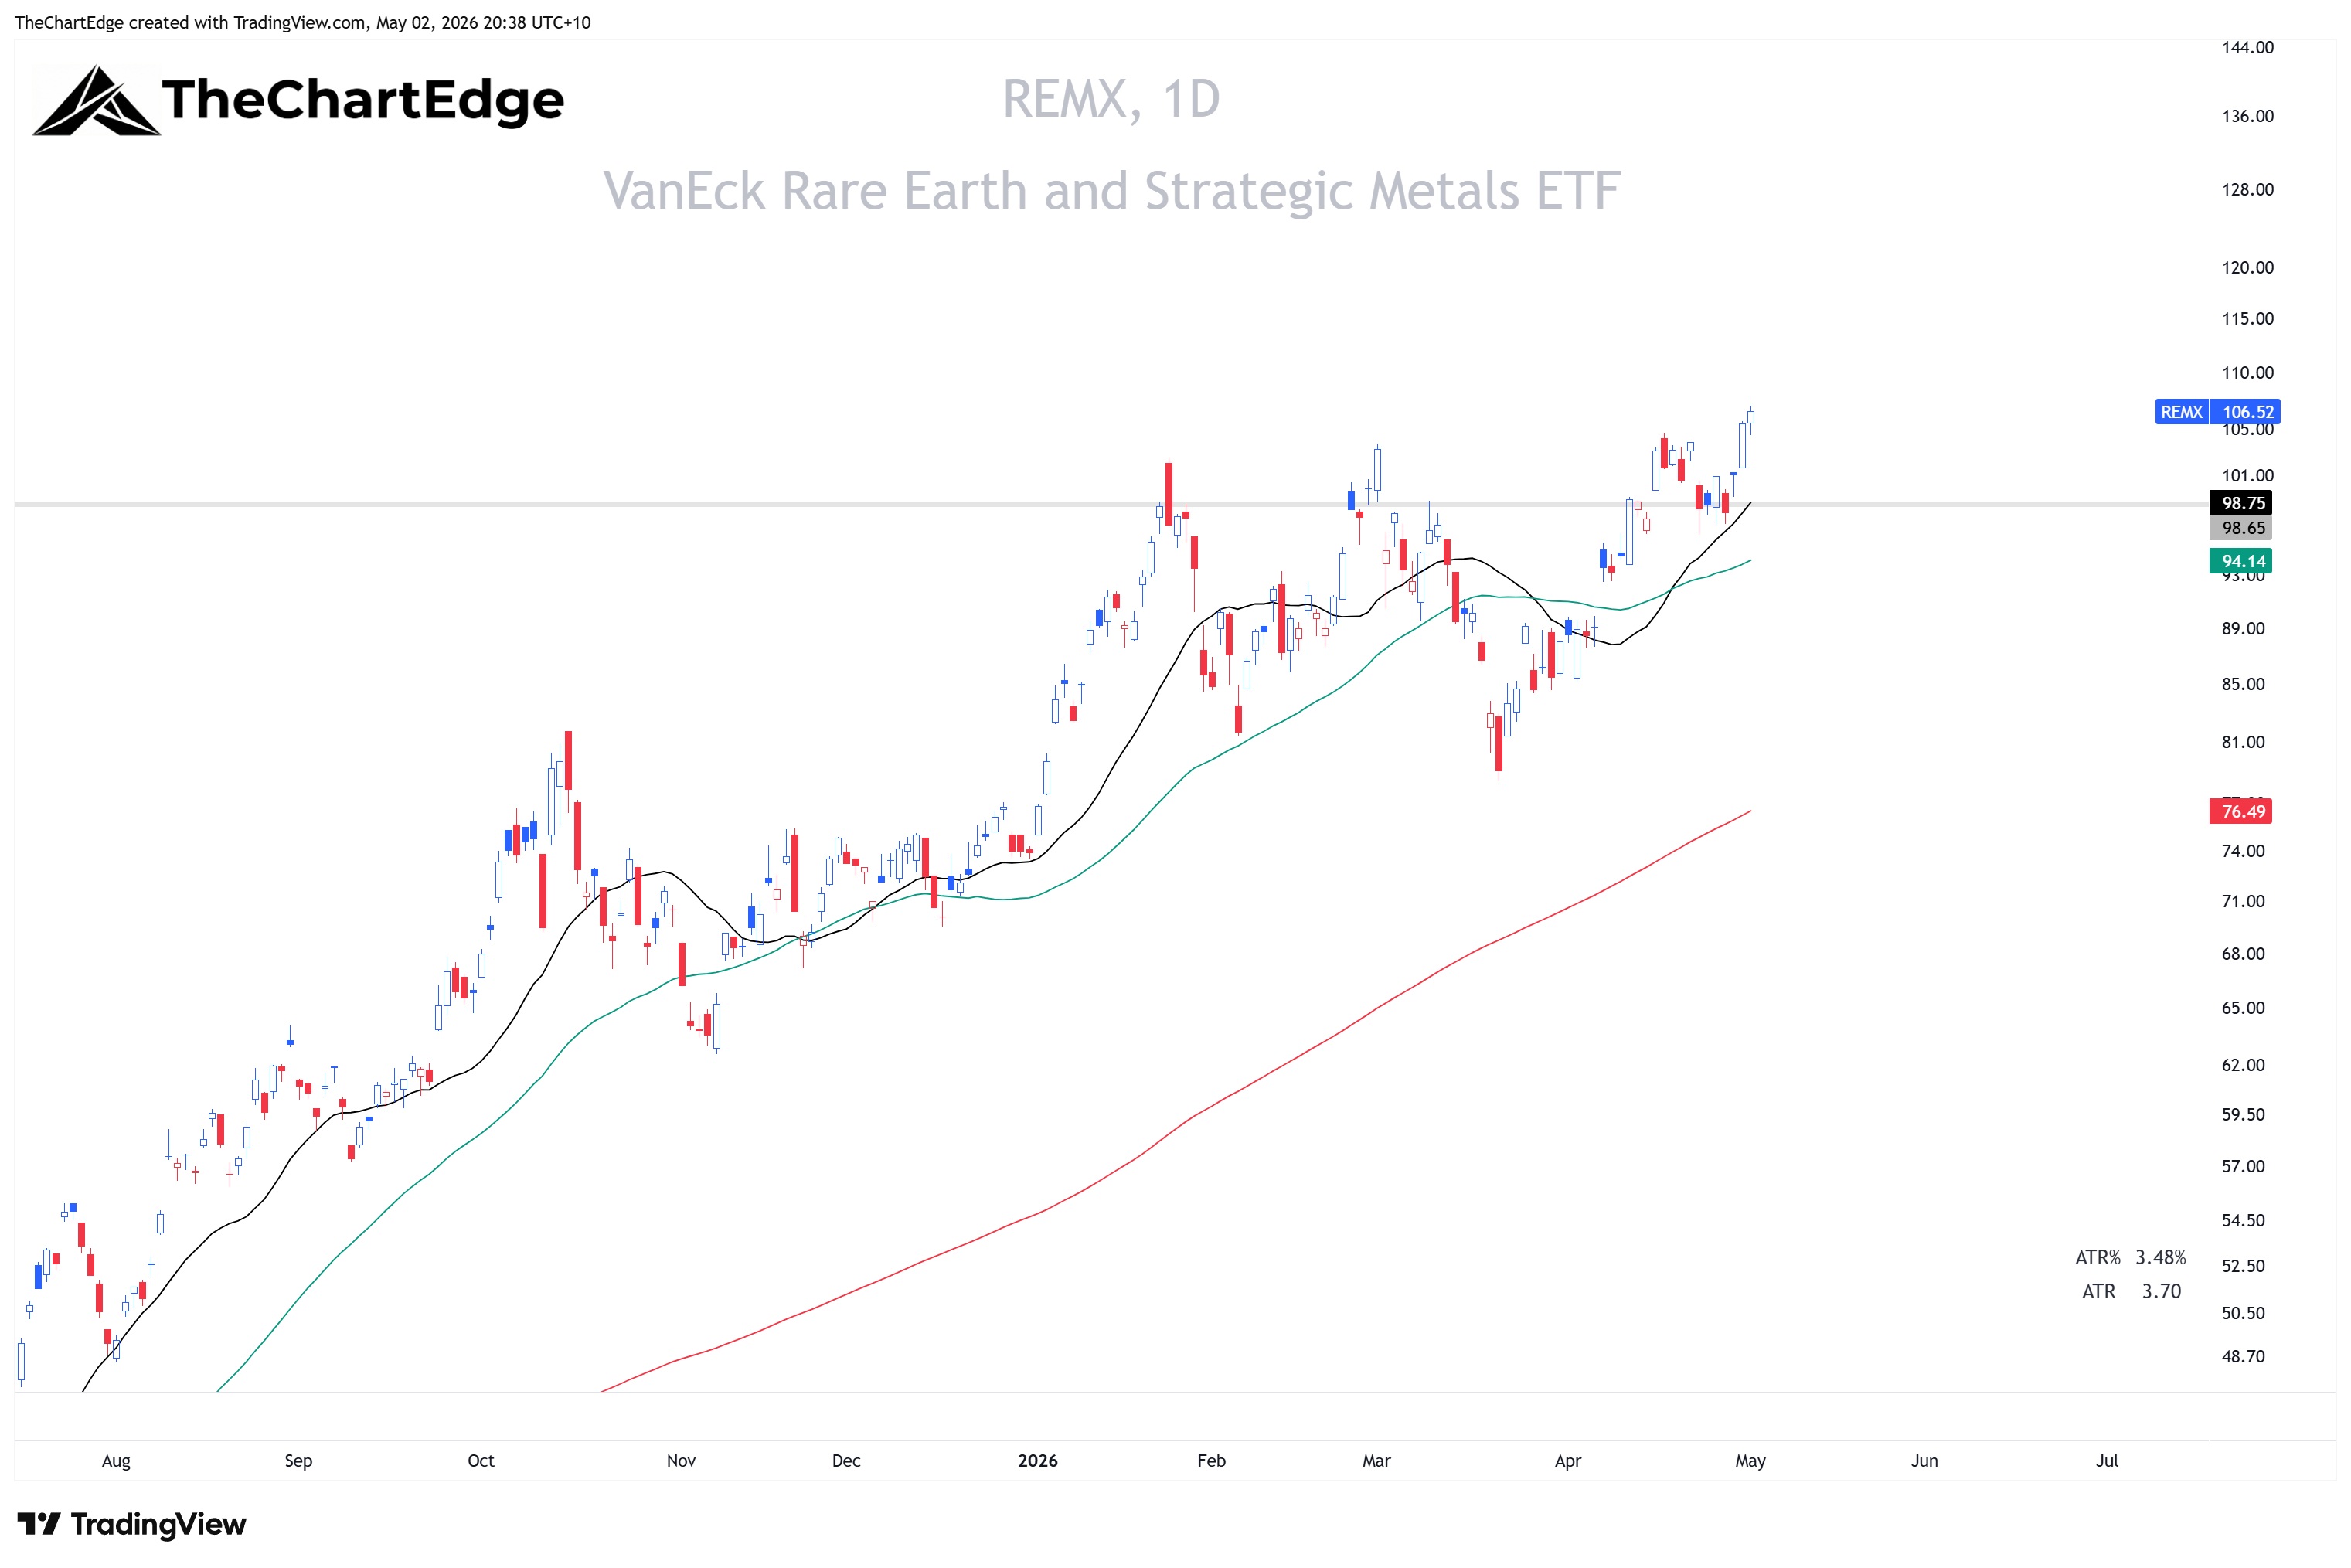
LIT (Lithium) and REMX (Rare Earths) both moved back into the Leading quadrant after slipping to Weakening last week. LIT was up 5.88% and REMX up 8.08%. Both remain in Strong Uptrends. URA (Uranium) stayed in Weakening but still has a Strong Uptrend trend state.
LIT Chart
REMX Chart
COPX Chart
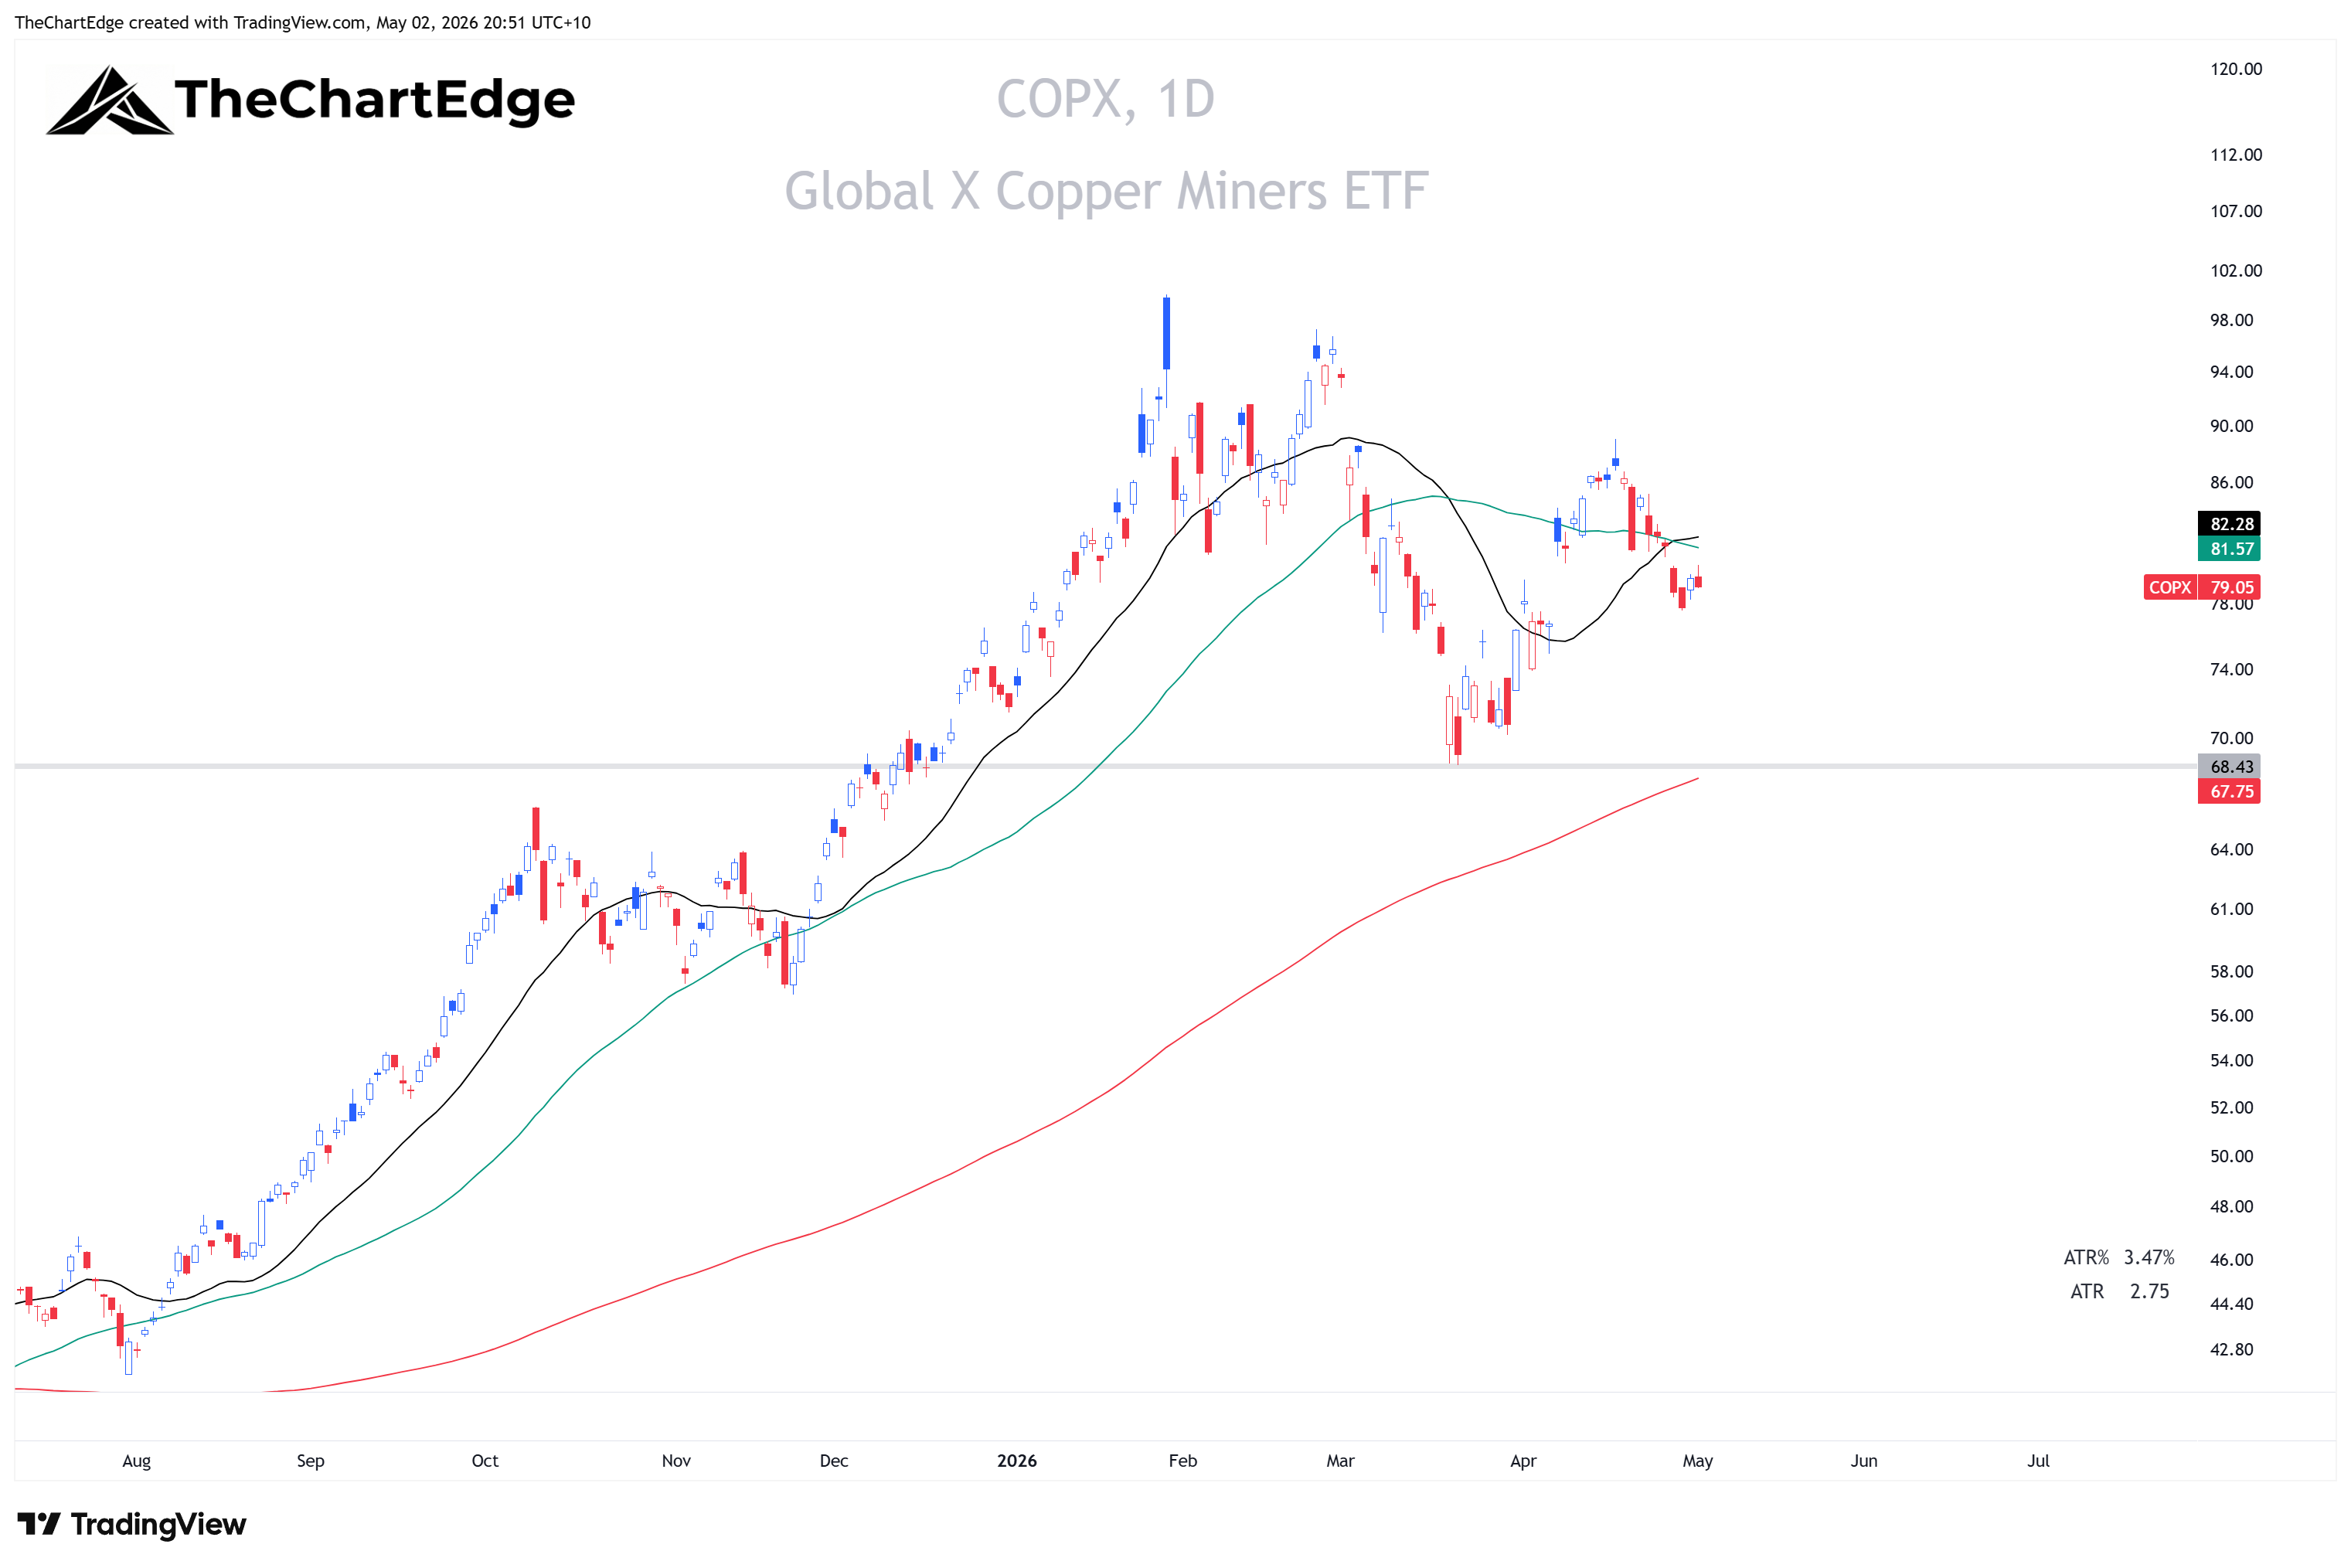
Copper Miners (COPX) have diverged from LIT and REMX. COPX was down 4.03% for the week and is now below its 20 and 50-day SMA.
SLV Chart
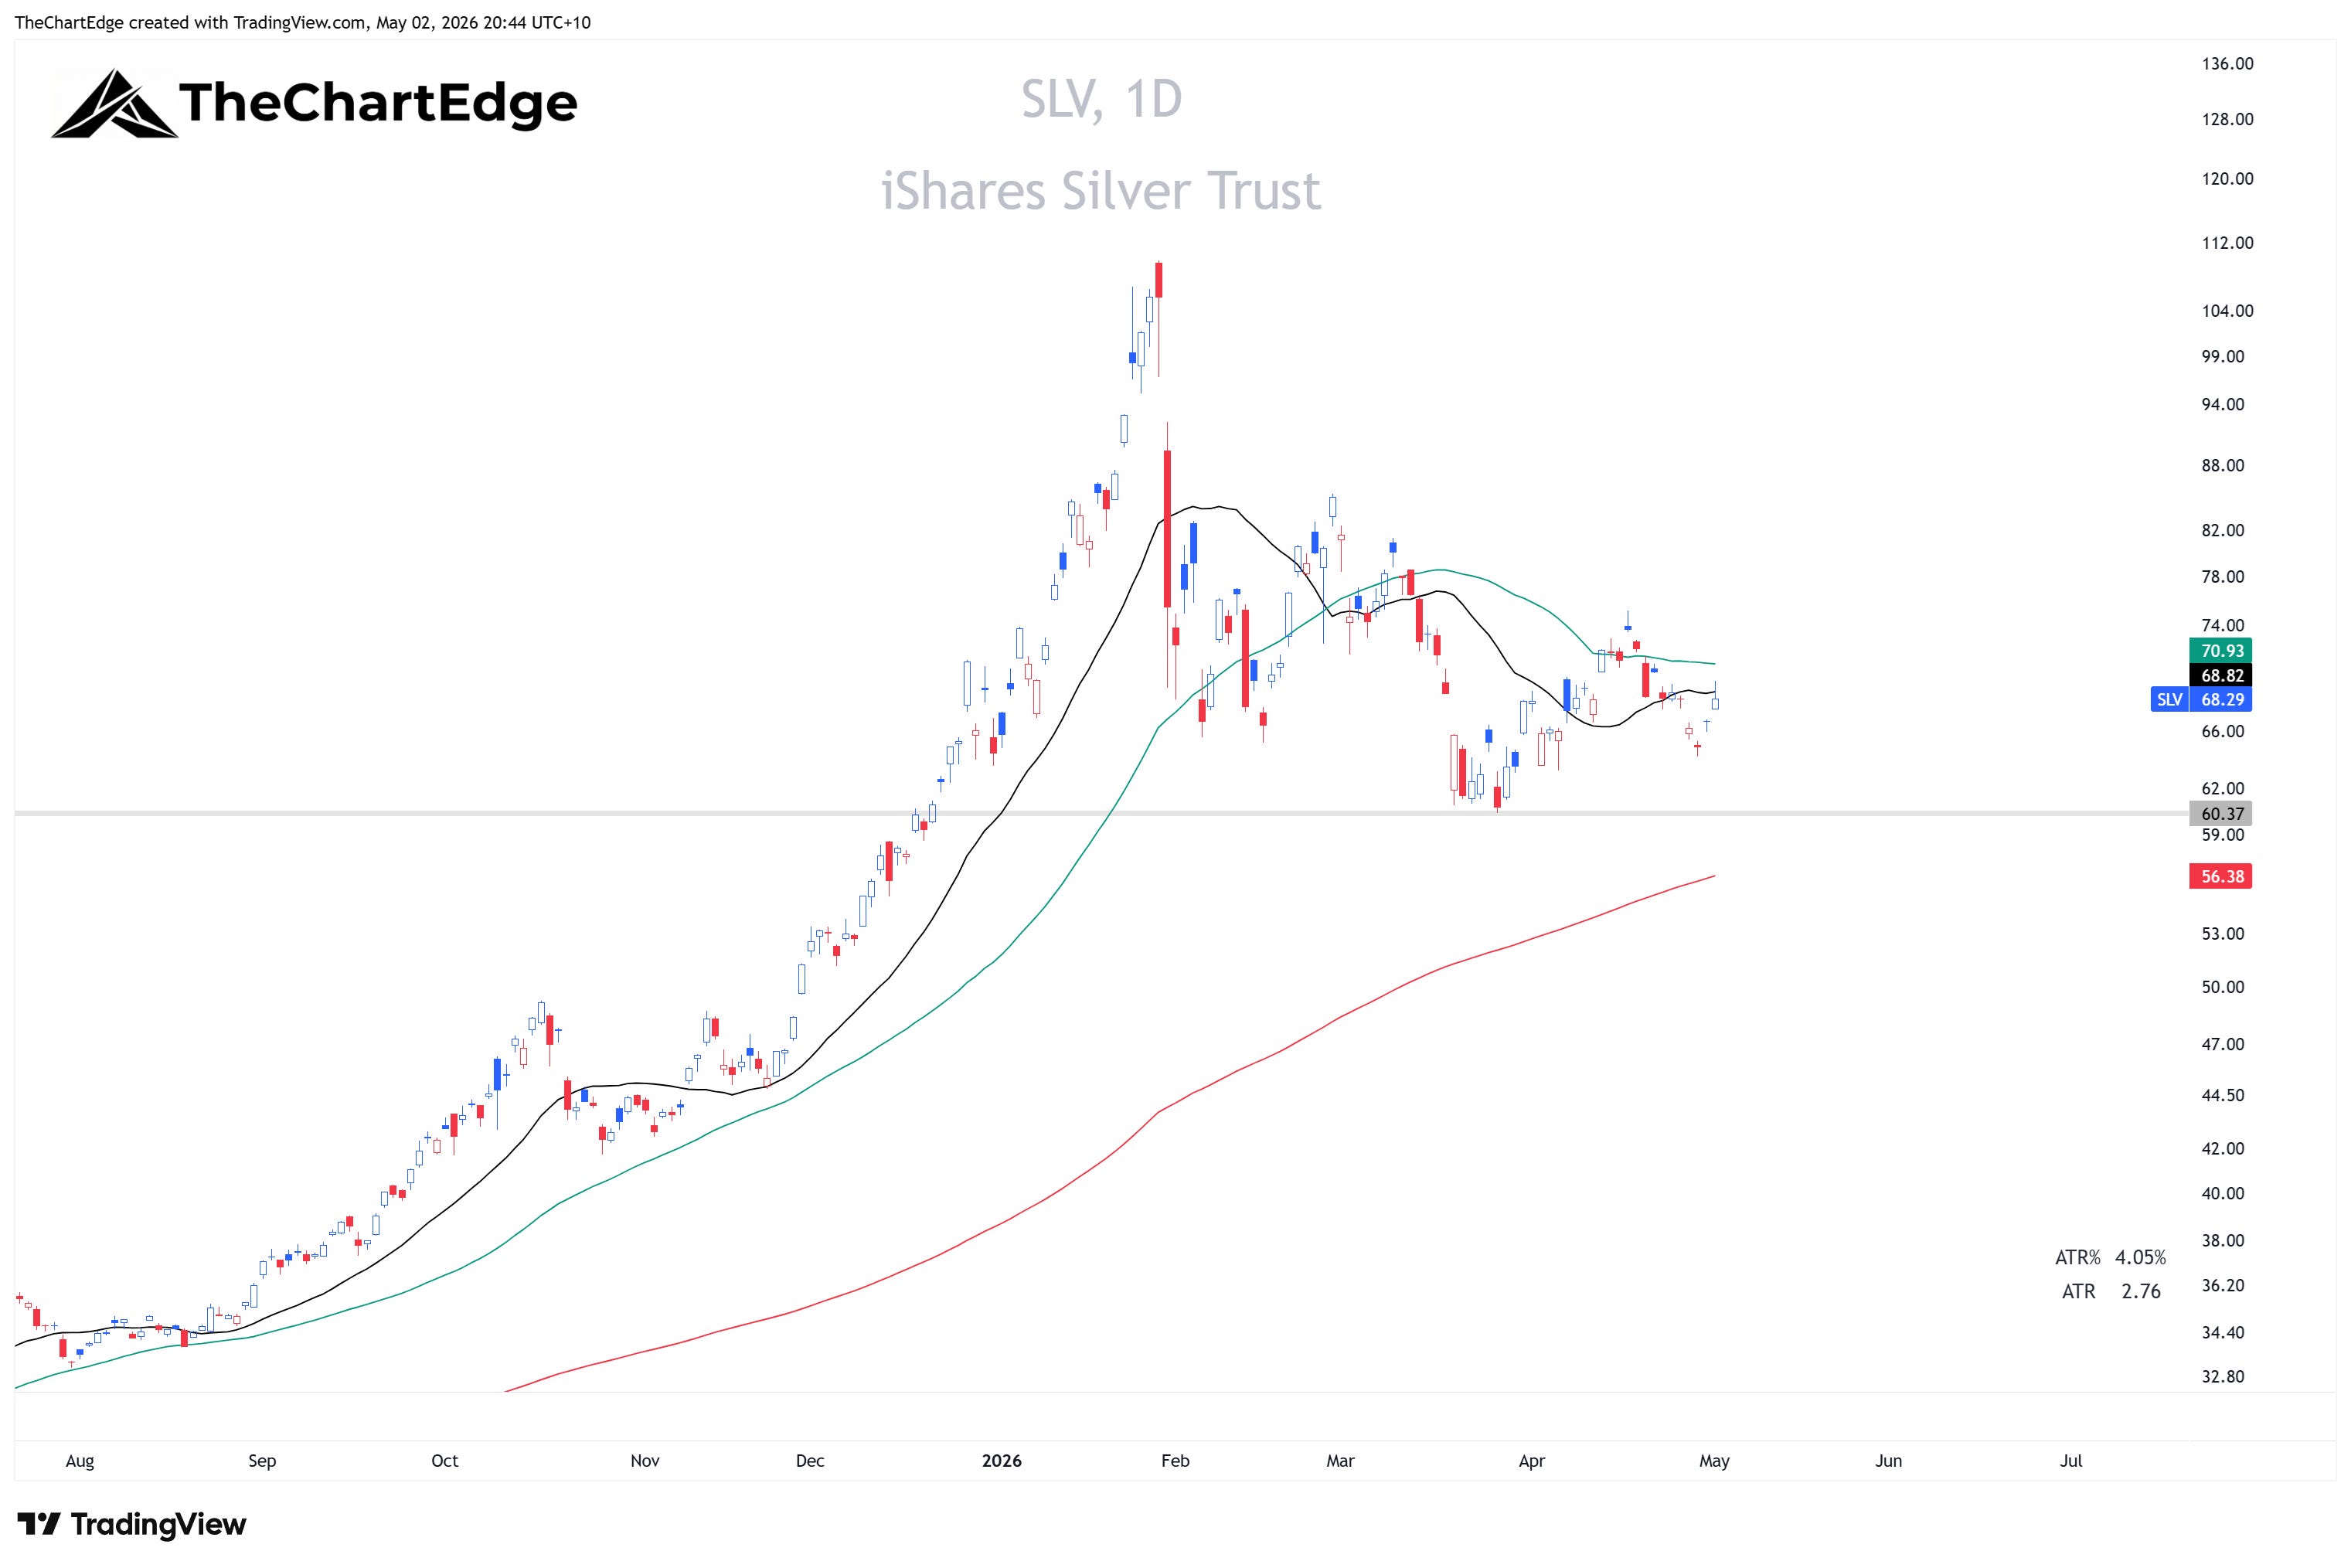
SLV (silver) looks weak, below its 20 and 50-day SMA, down 0.73% for the week, and SIL (silver miners) down 6.54%.
GLD Chart
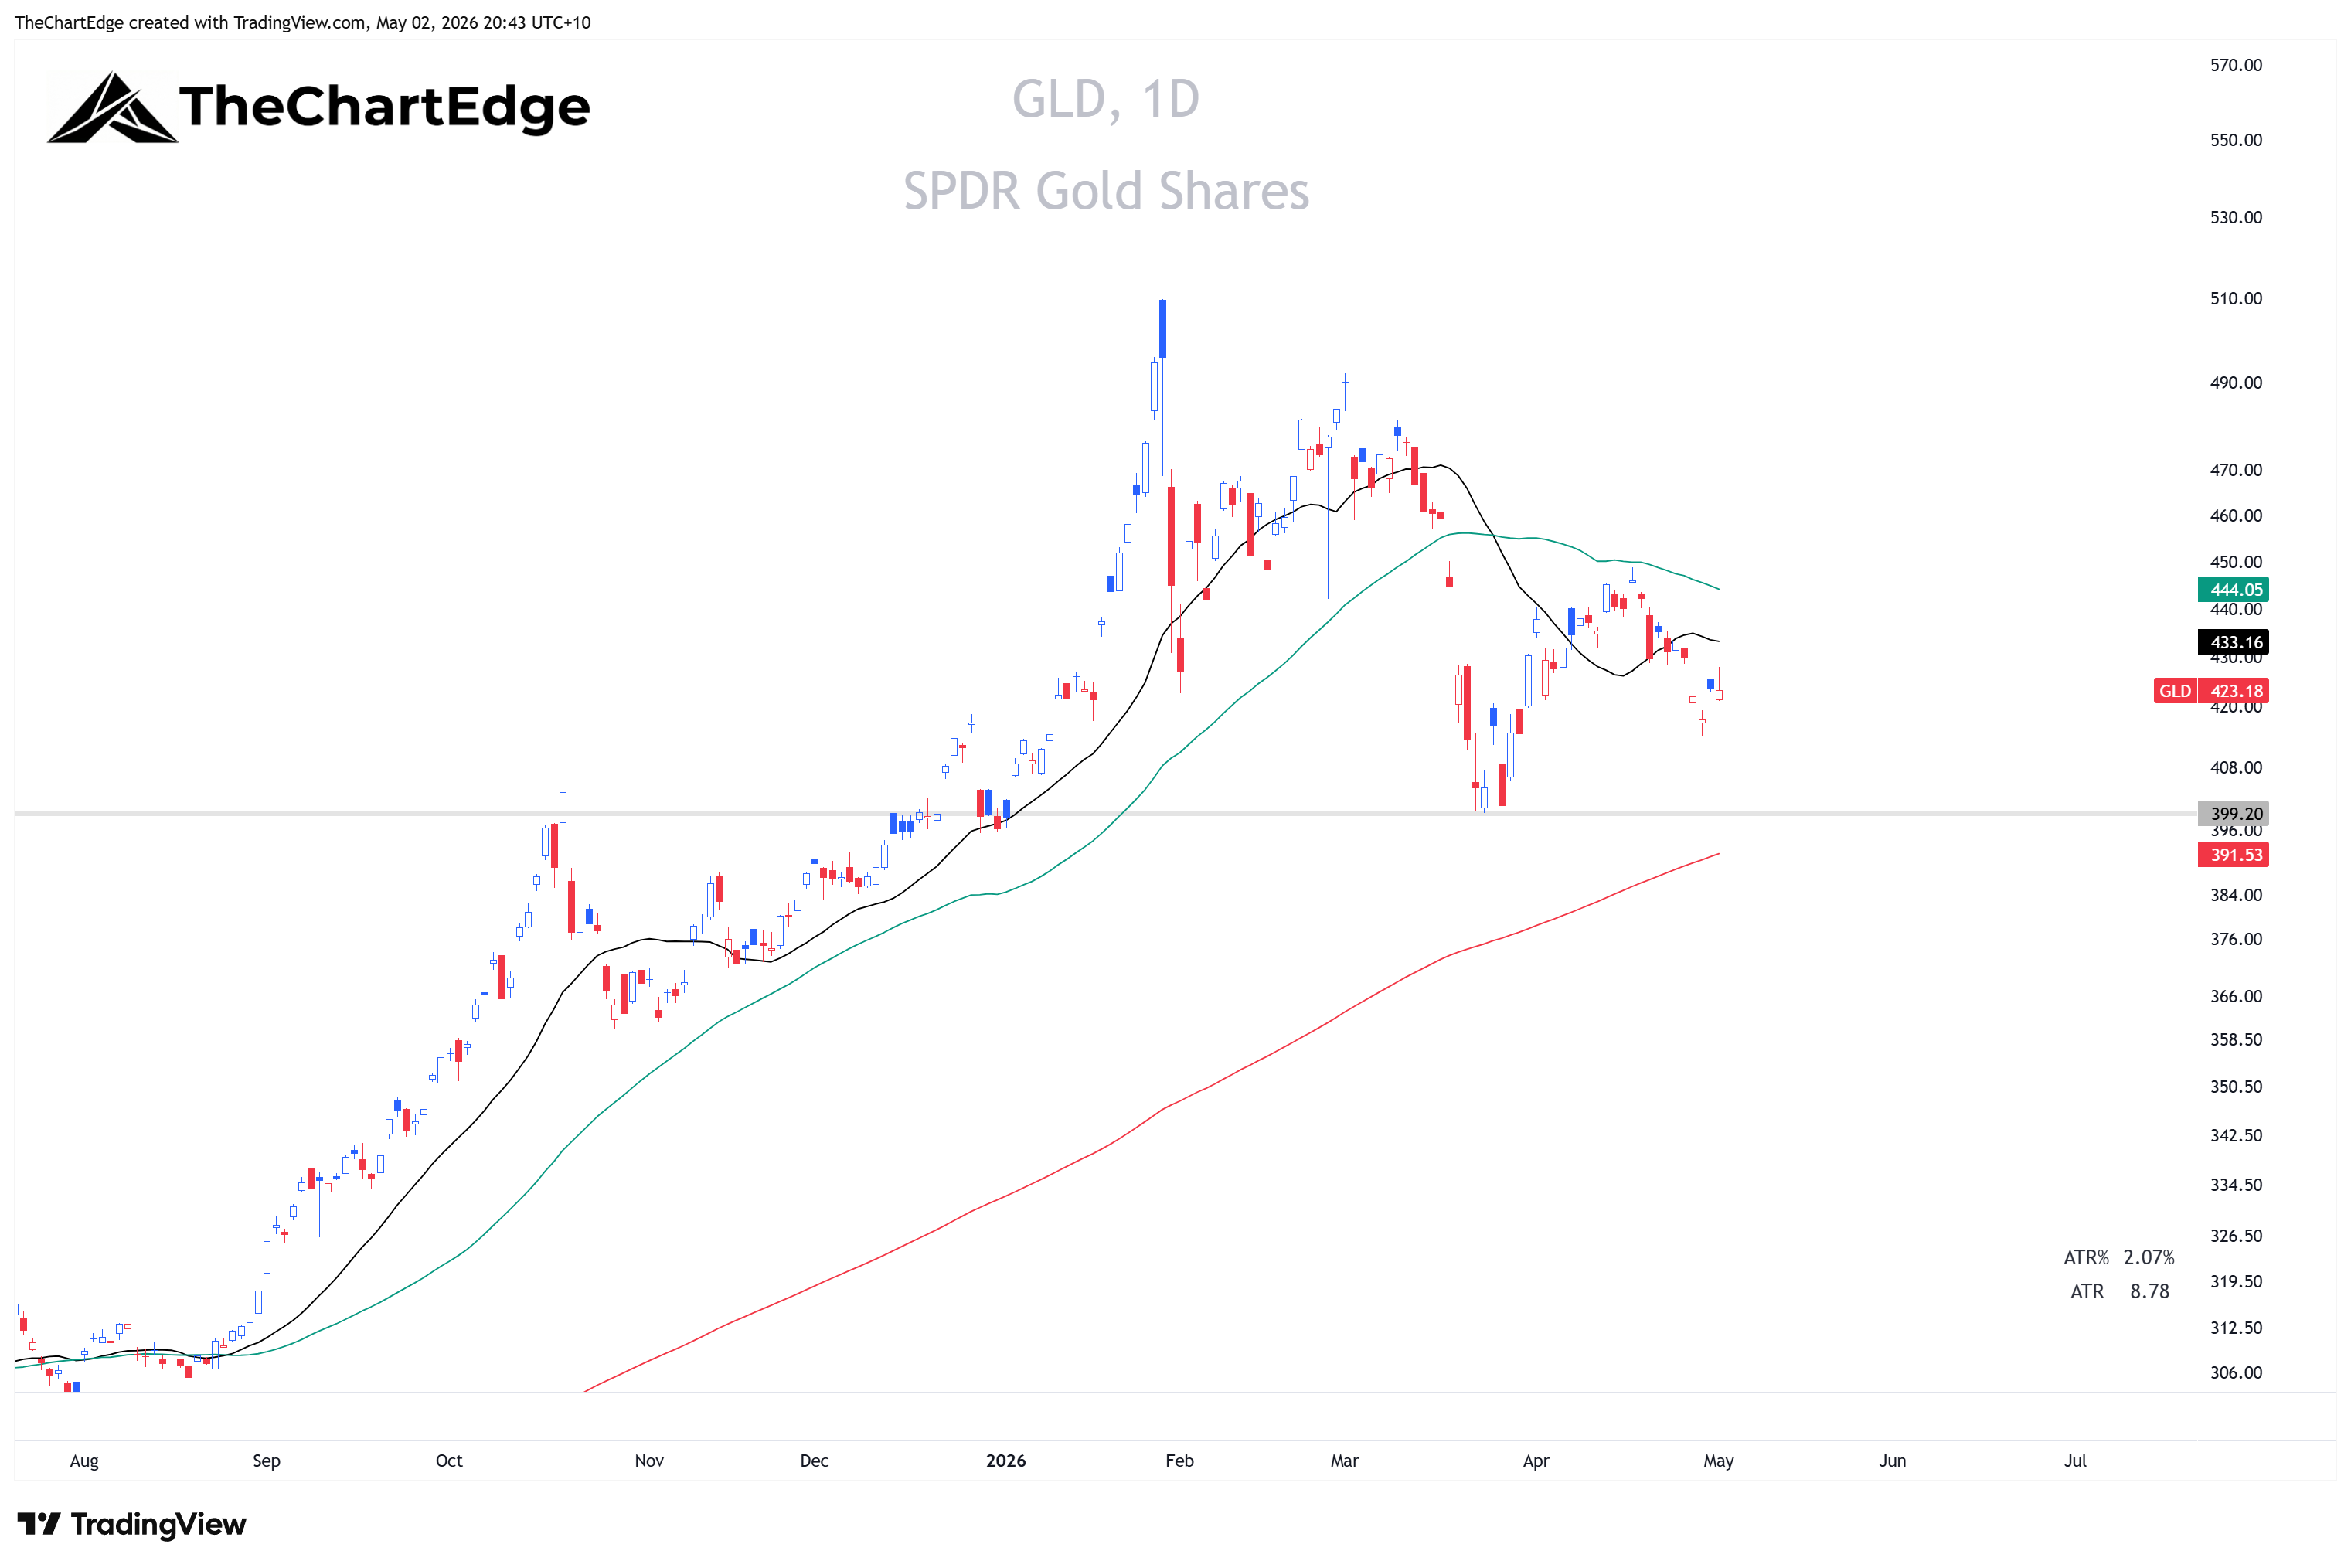
GLD also looks weak, below its 20 and 50-day SMA, down 2.32% for the week and dropped into the Lagging quadrant. GDX (gold miners) fell 7.66%. If GLD continues to fall and closes below the 395-400 zone, where the late March lows and the 200-day SMA are converging, I wouldn’t want to own it, even in a longer term “investment” portfolio.
Oil and Clean Energy
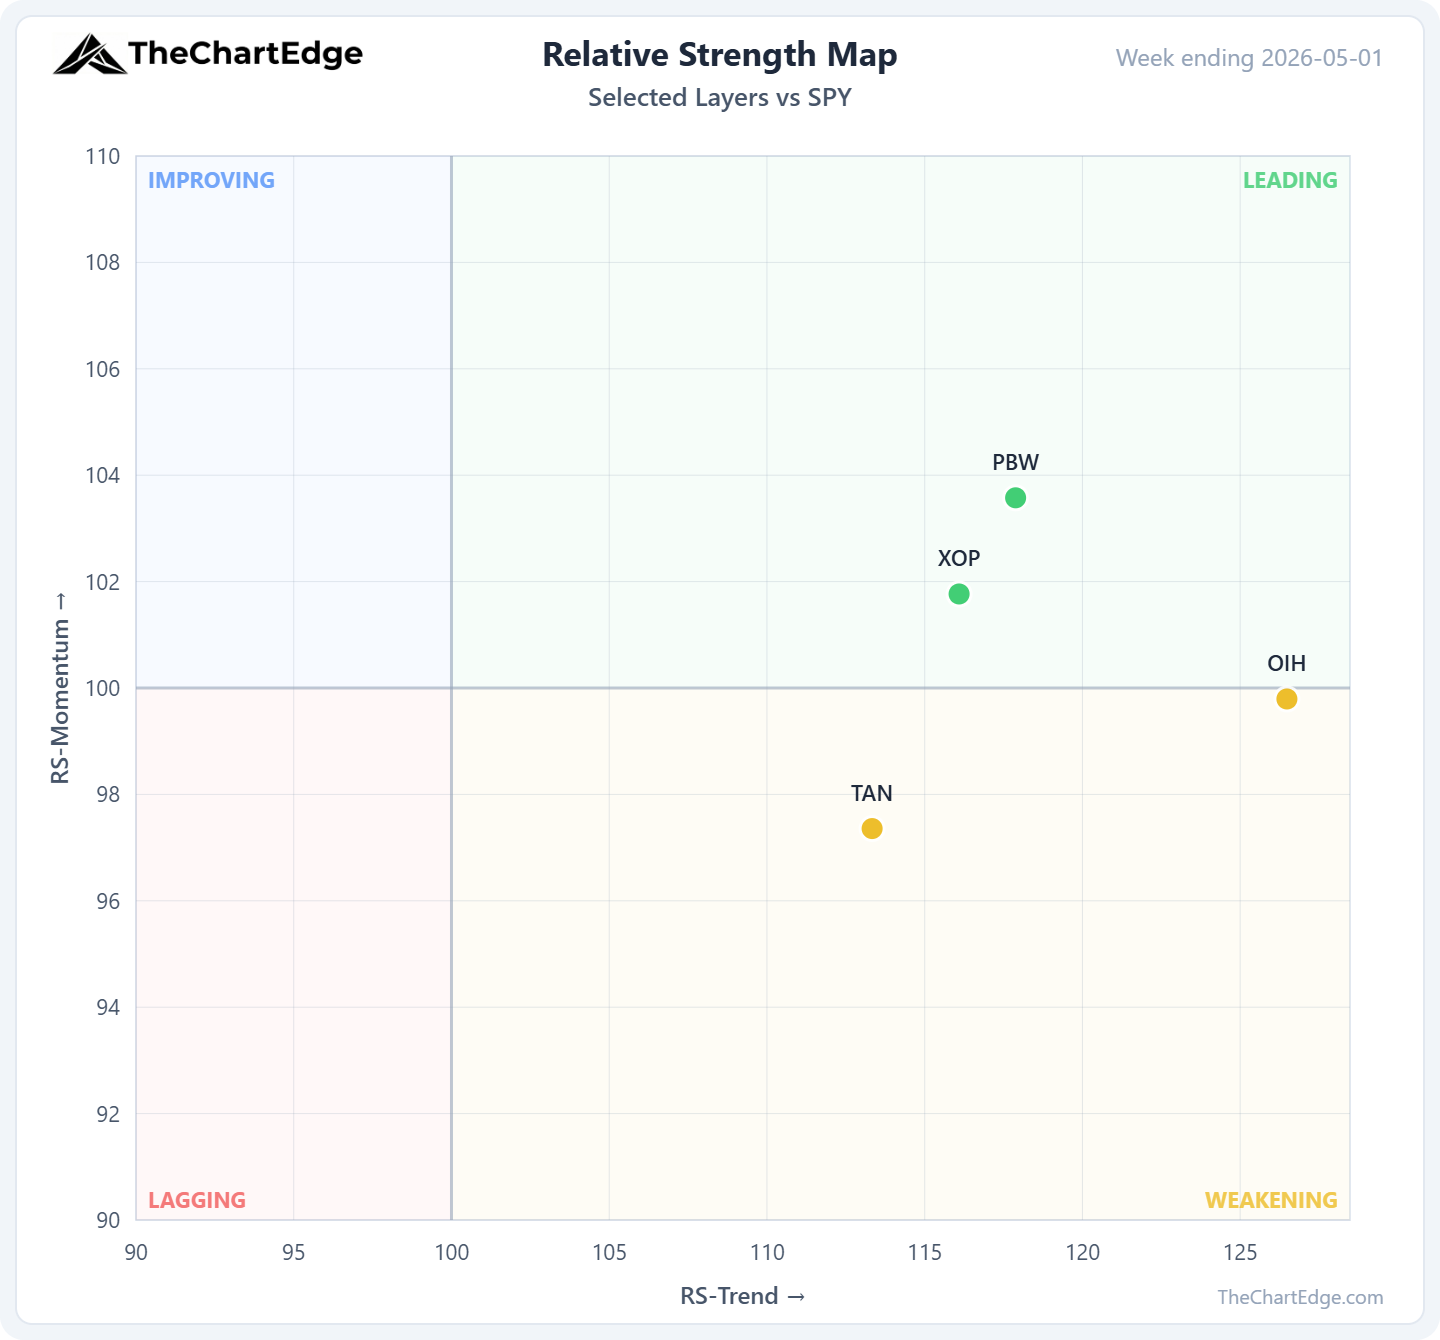
USO (crude oil) remains the strongest name in the entire 121-ETF universe by RS-Trend (149.27), up another 7.85% last week. OIH (oil services) slipped from Leading to Weakening - still outperforming on trend but the momentum paused. XOP (oil & gas E&P) moved the other way, from Weakening back to Leading.
PBW Chart
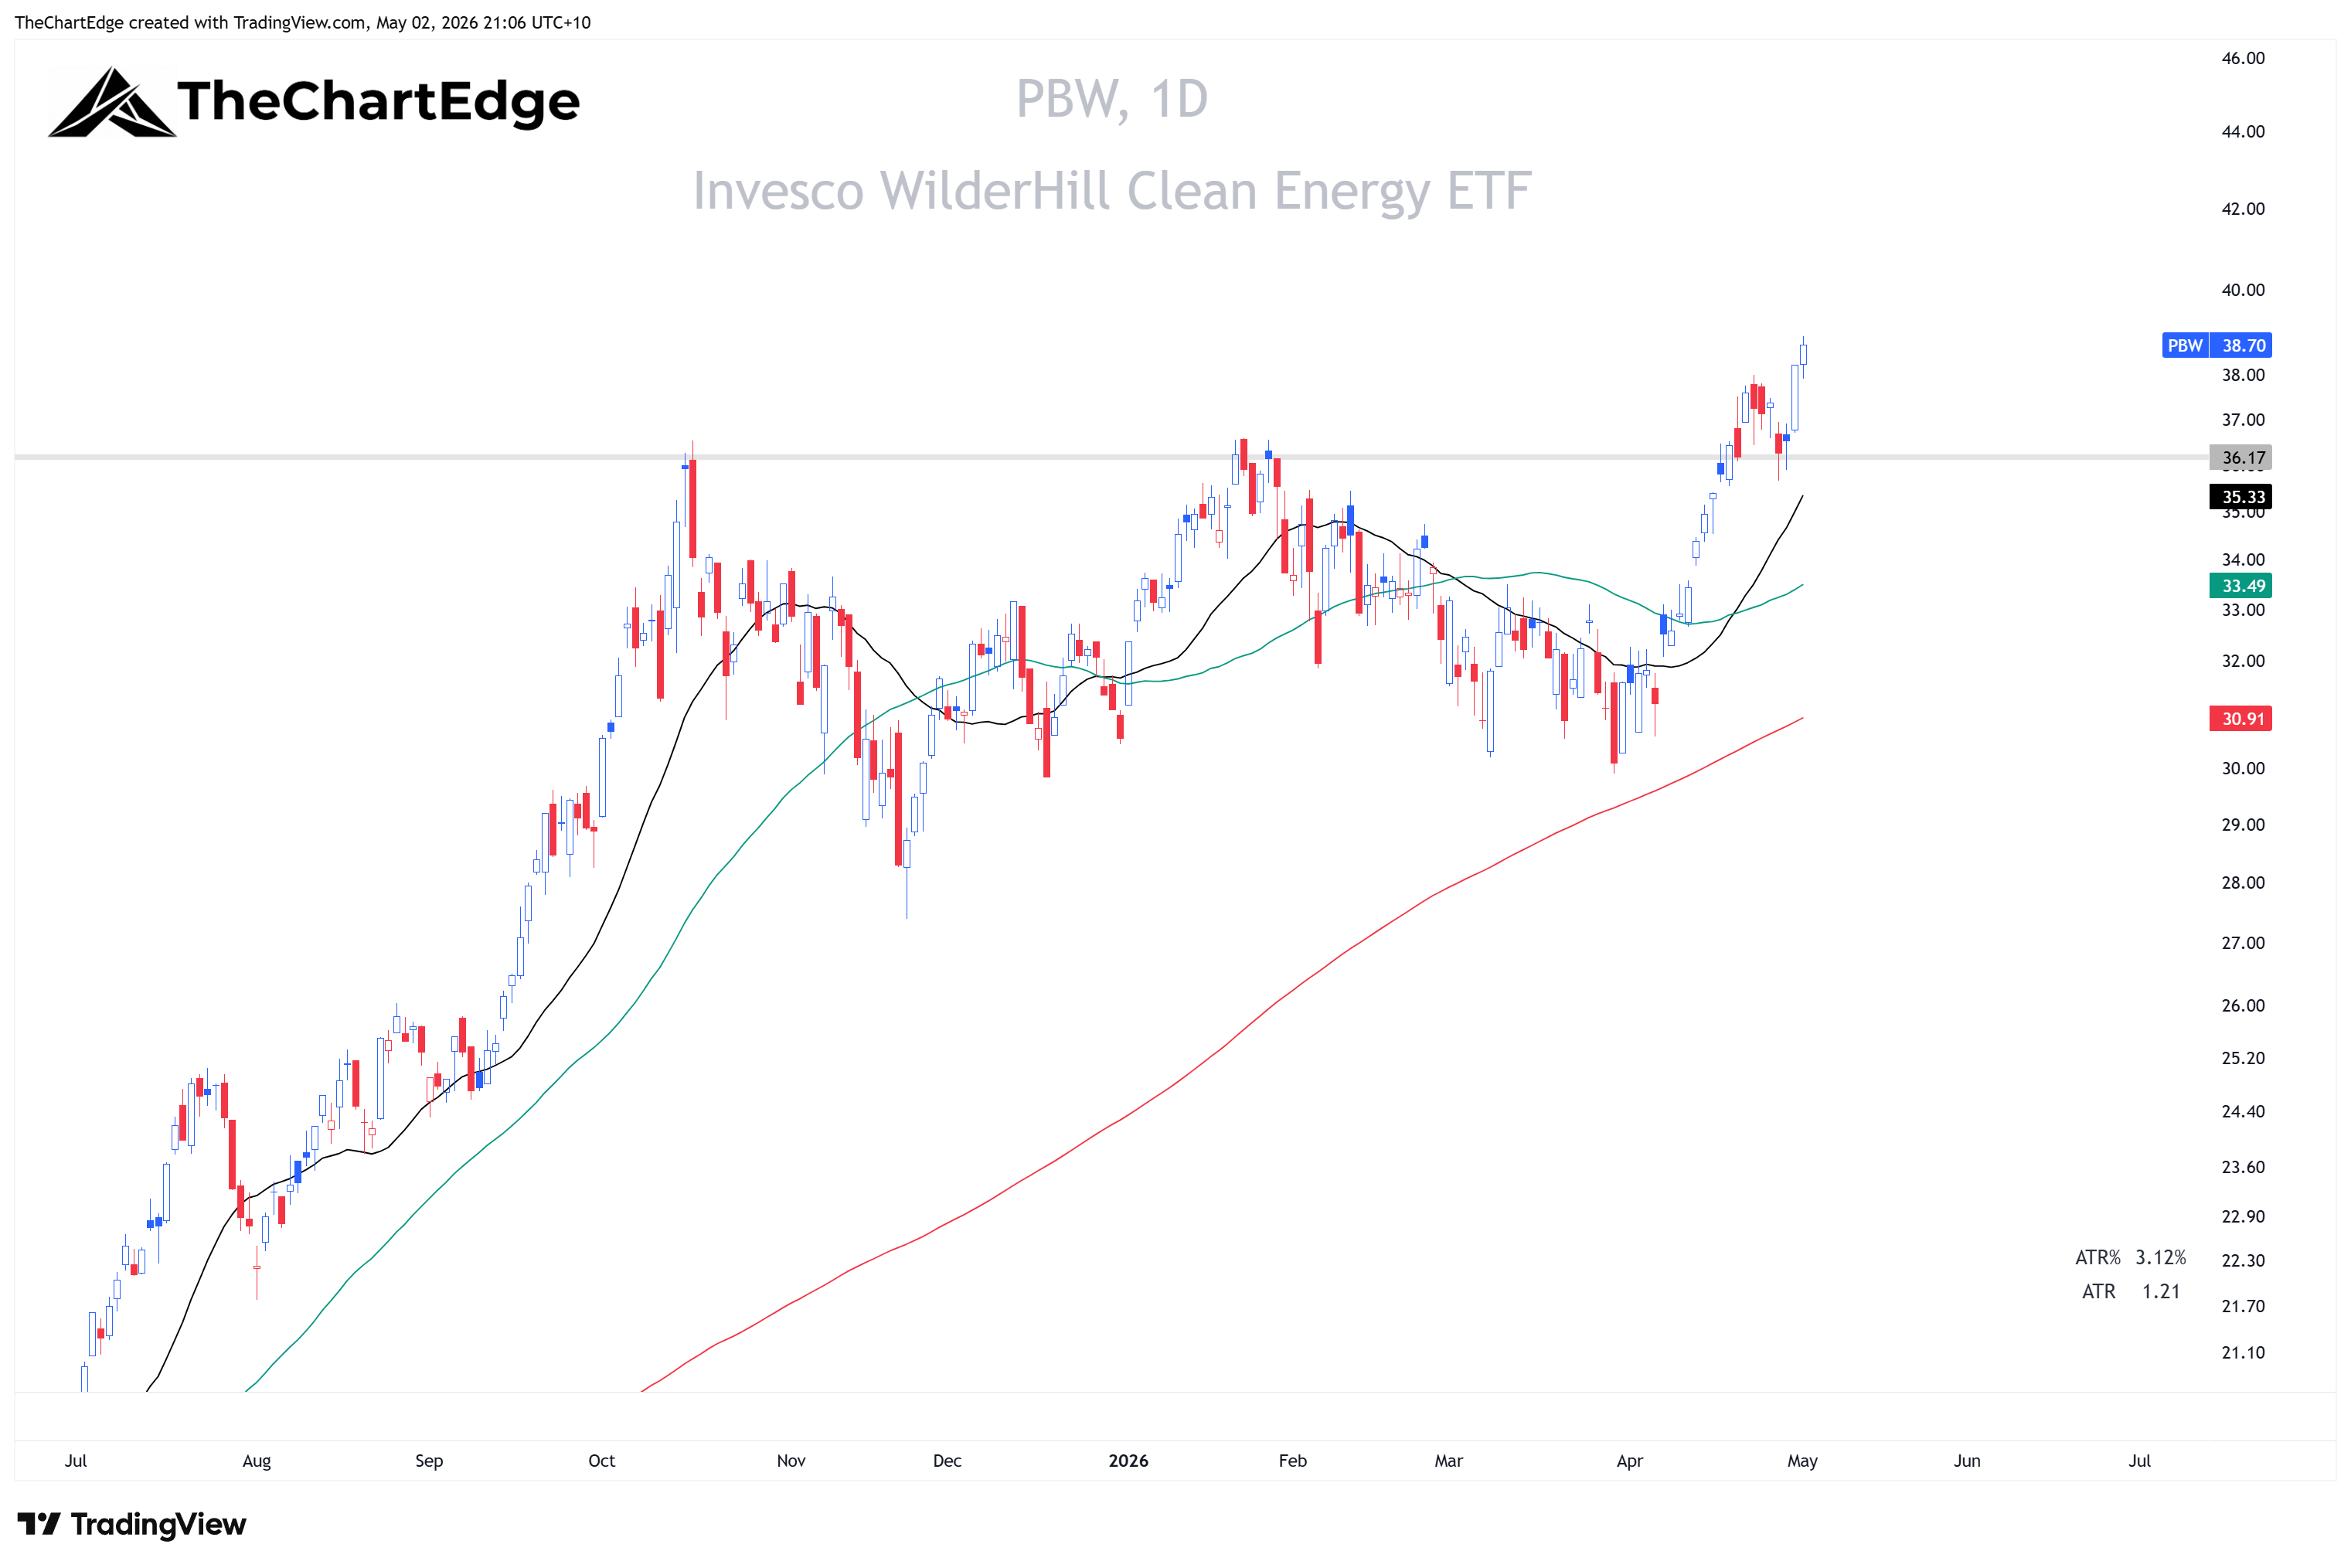
PBW (Clean Energy) is in the Leading quadrant with a Strong Uptrend, up 4.23% on the week.
TAN Chart
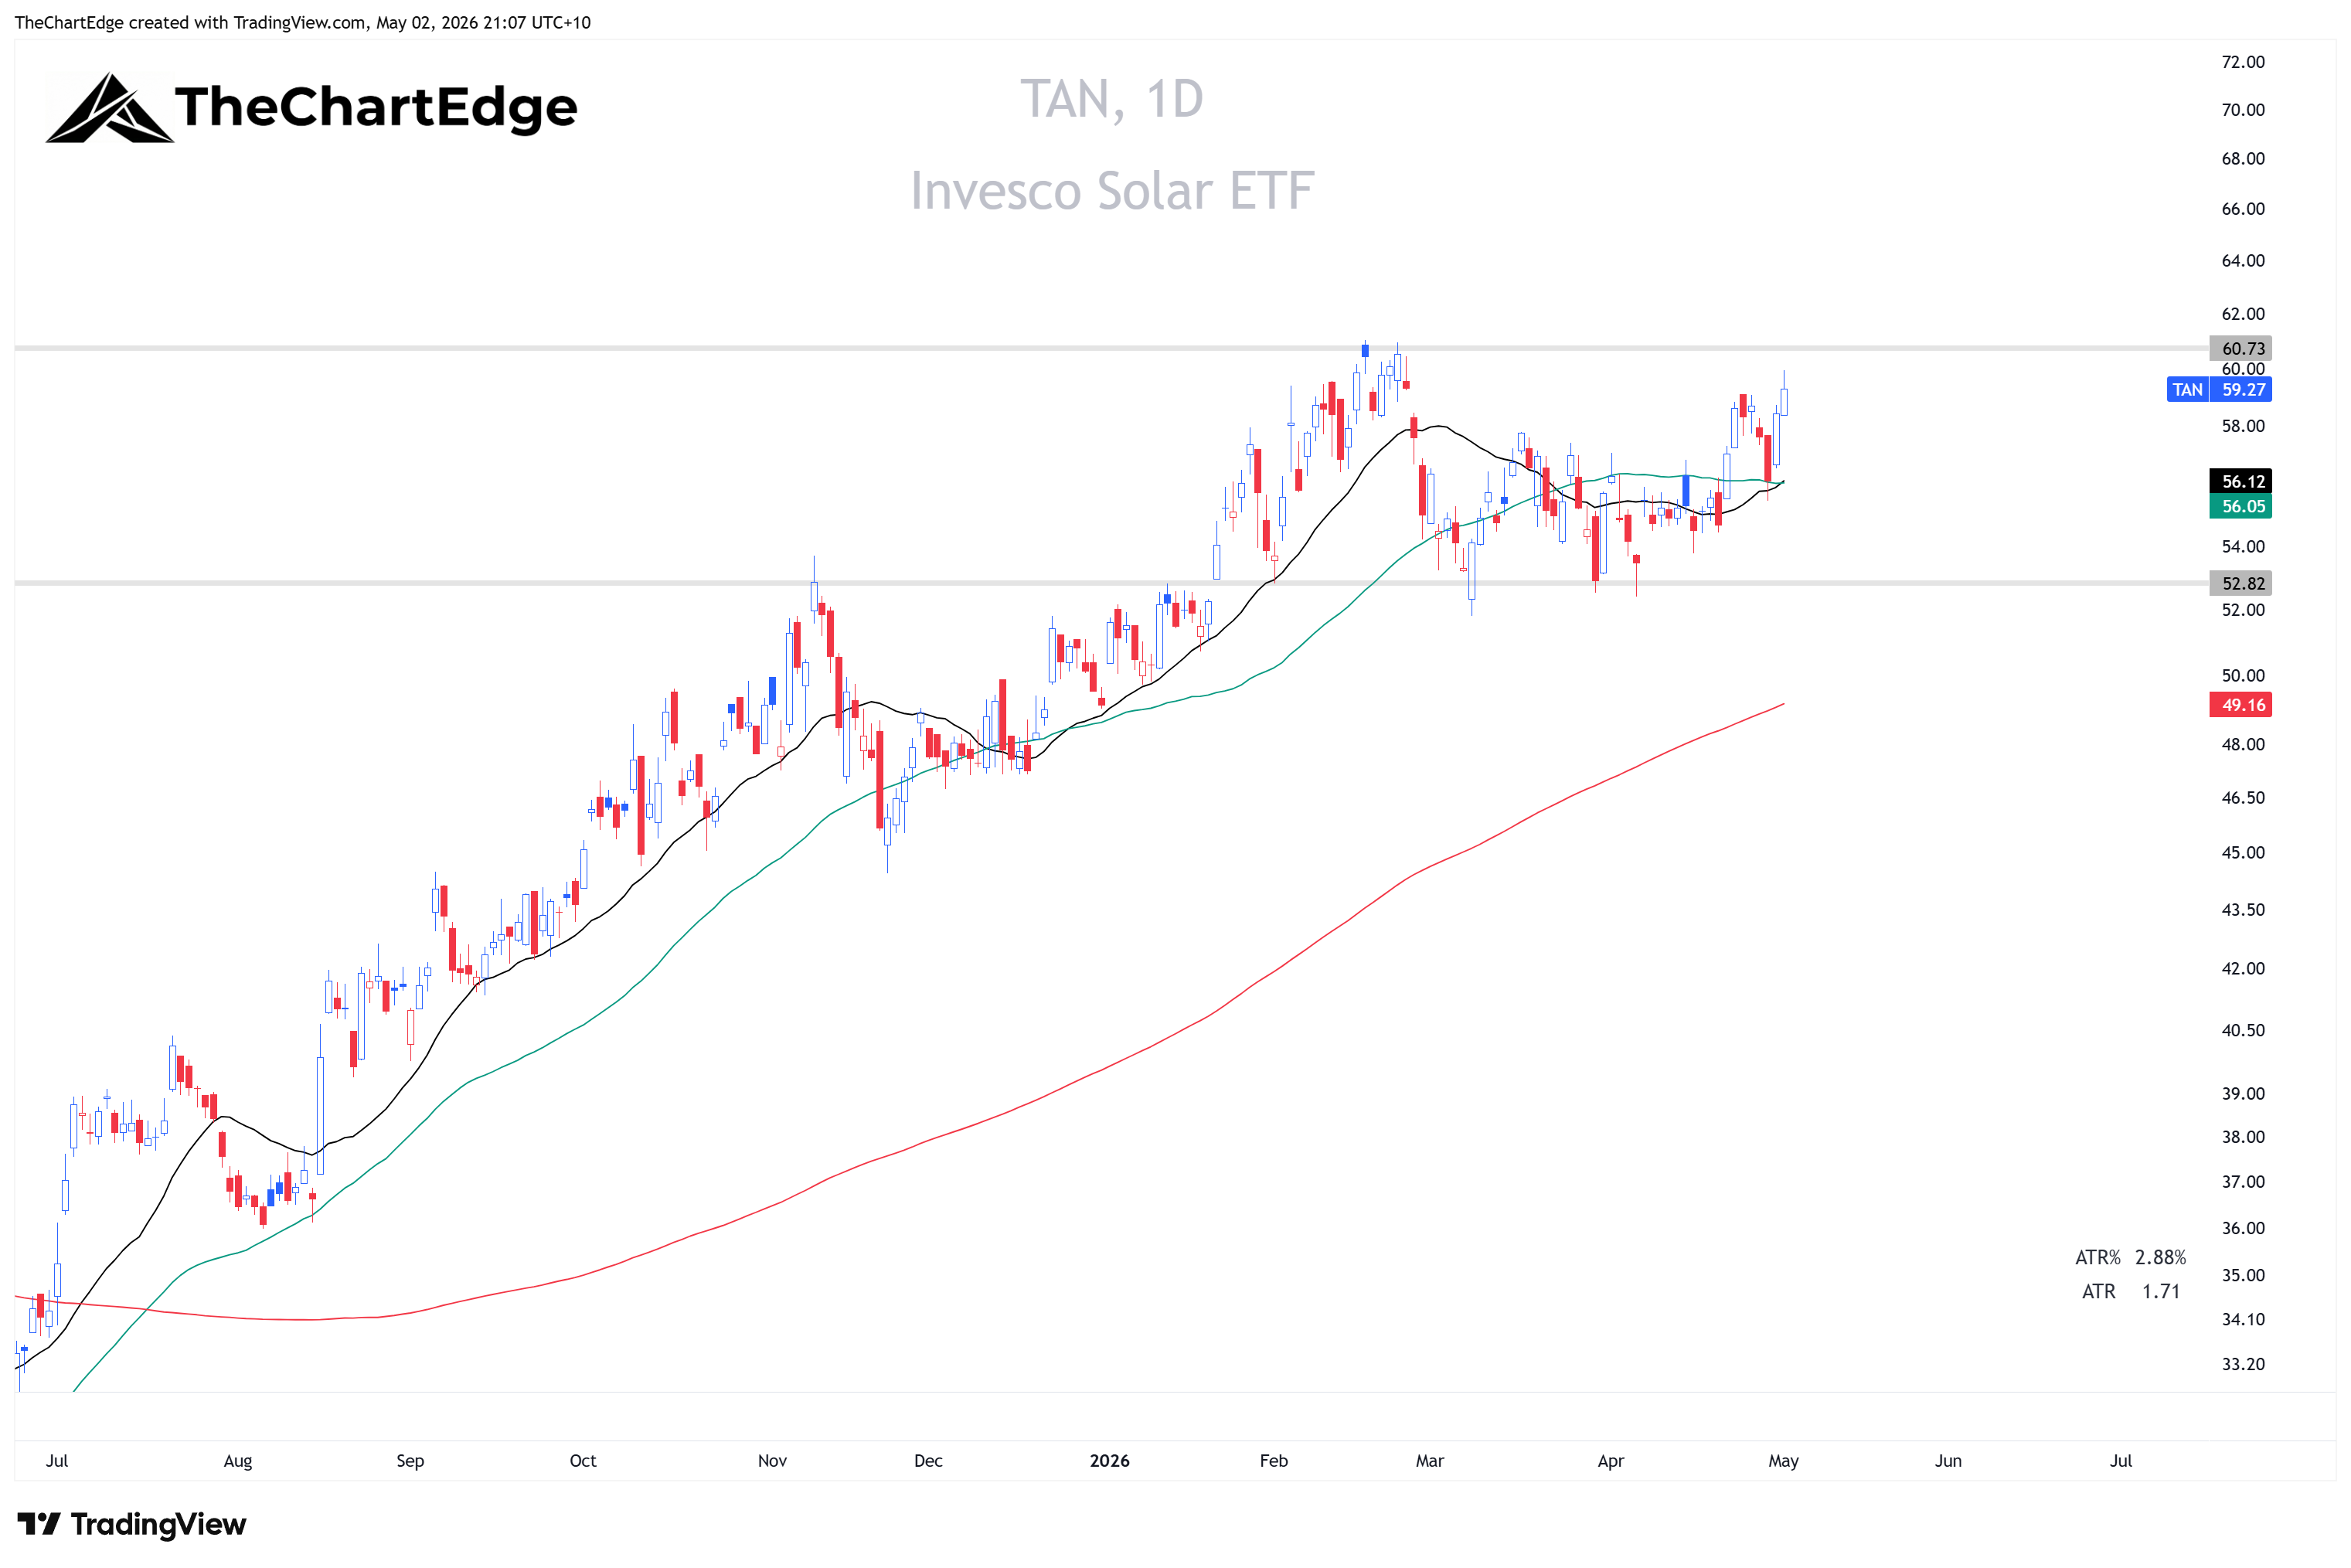
TAN (Solar) is Weakening - still outperforming on trend but momentum fading.
Speculative Growth, Quantum and Robotics and Micro-Caps
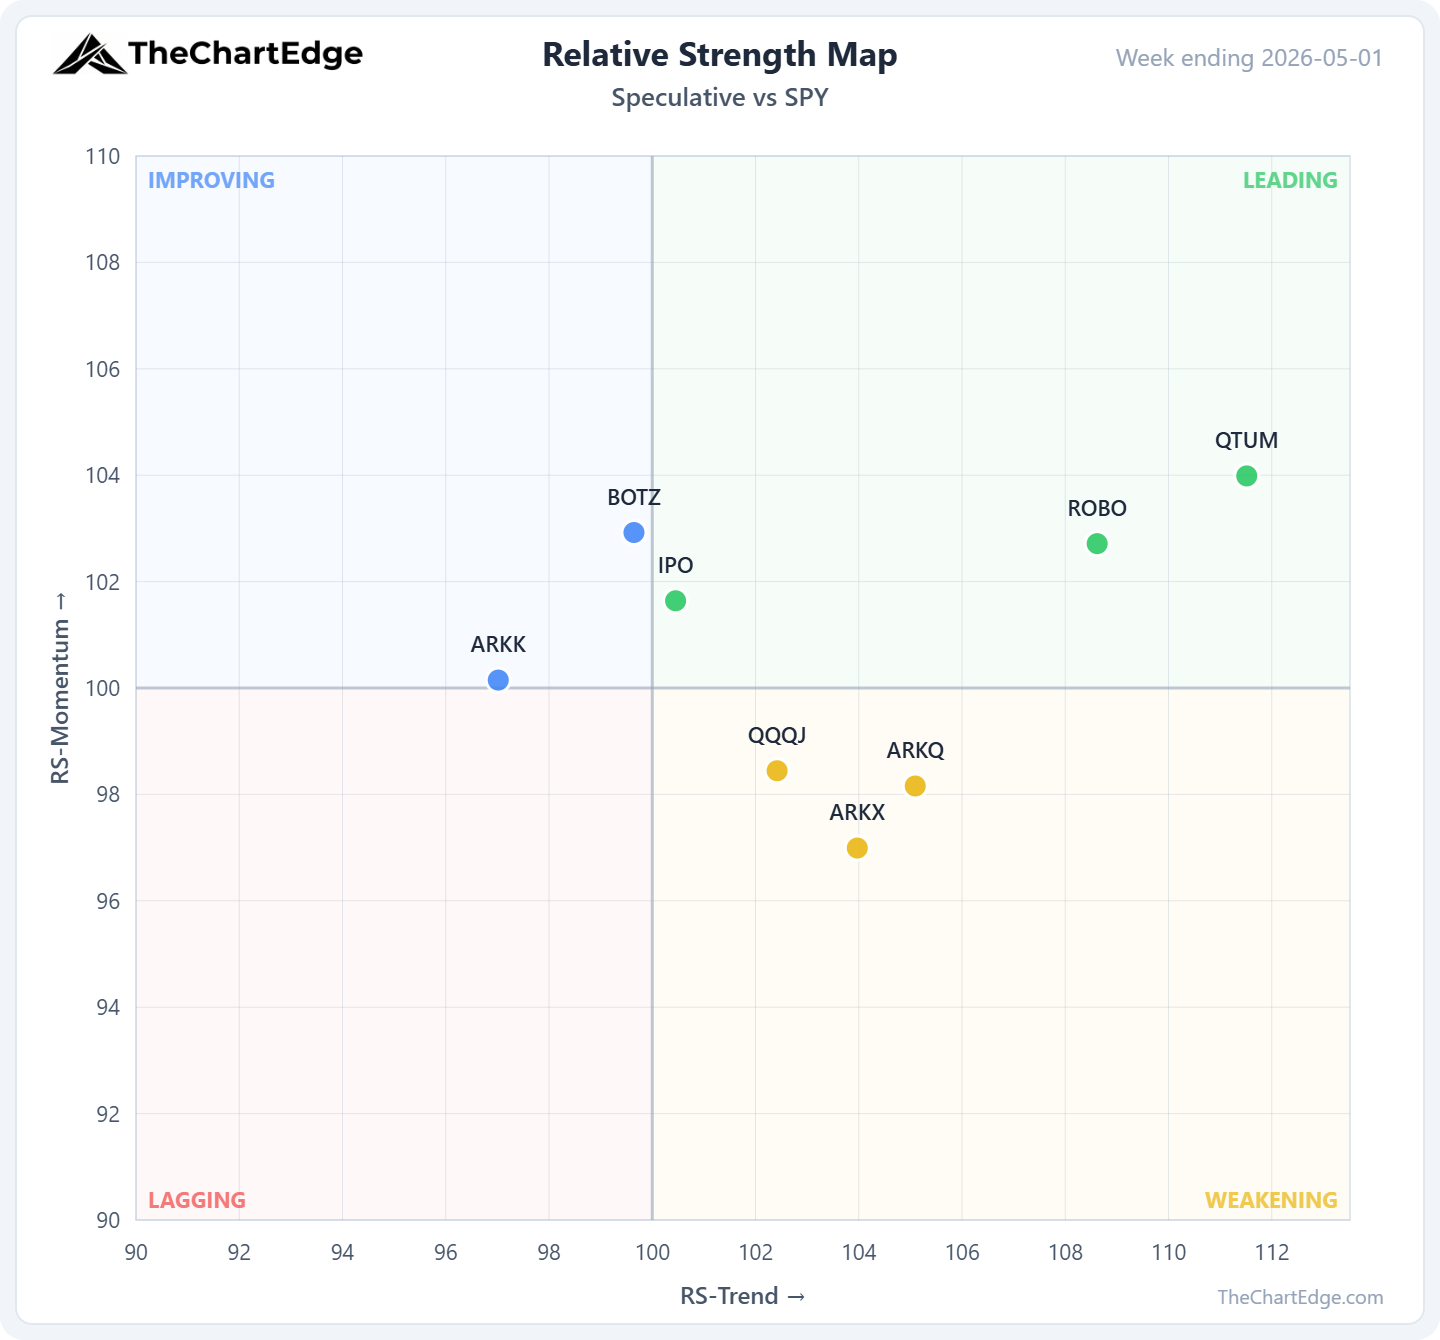
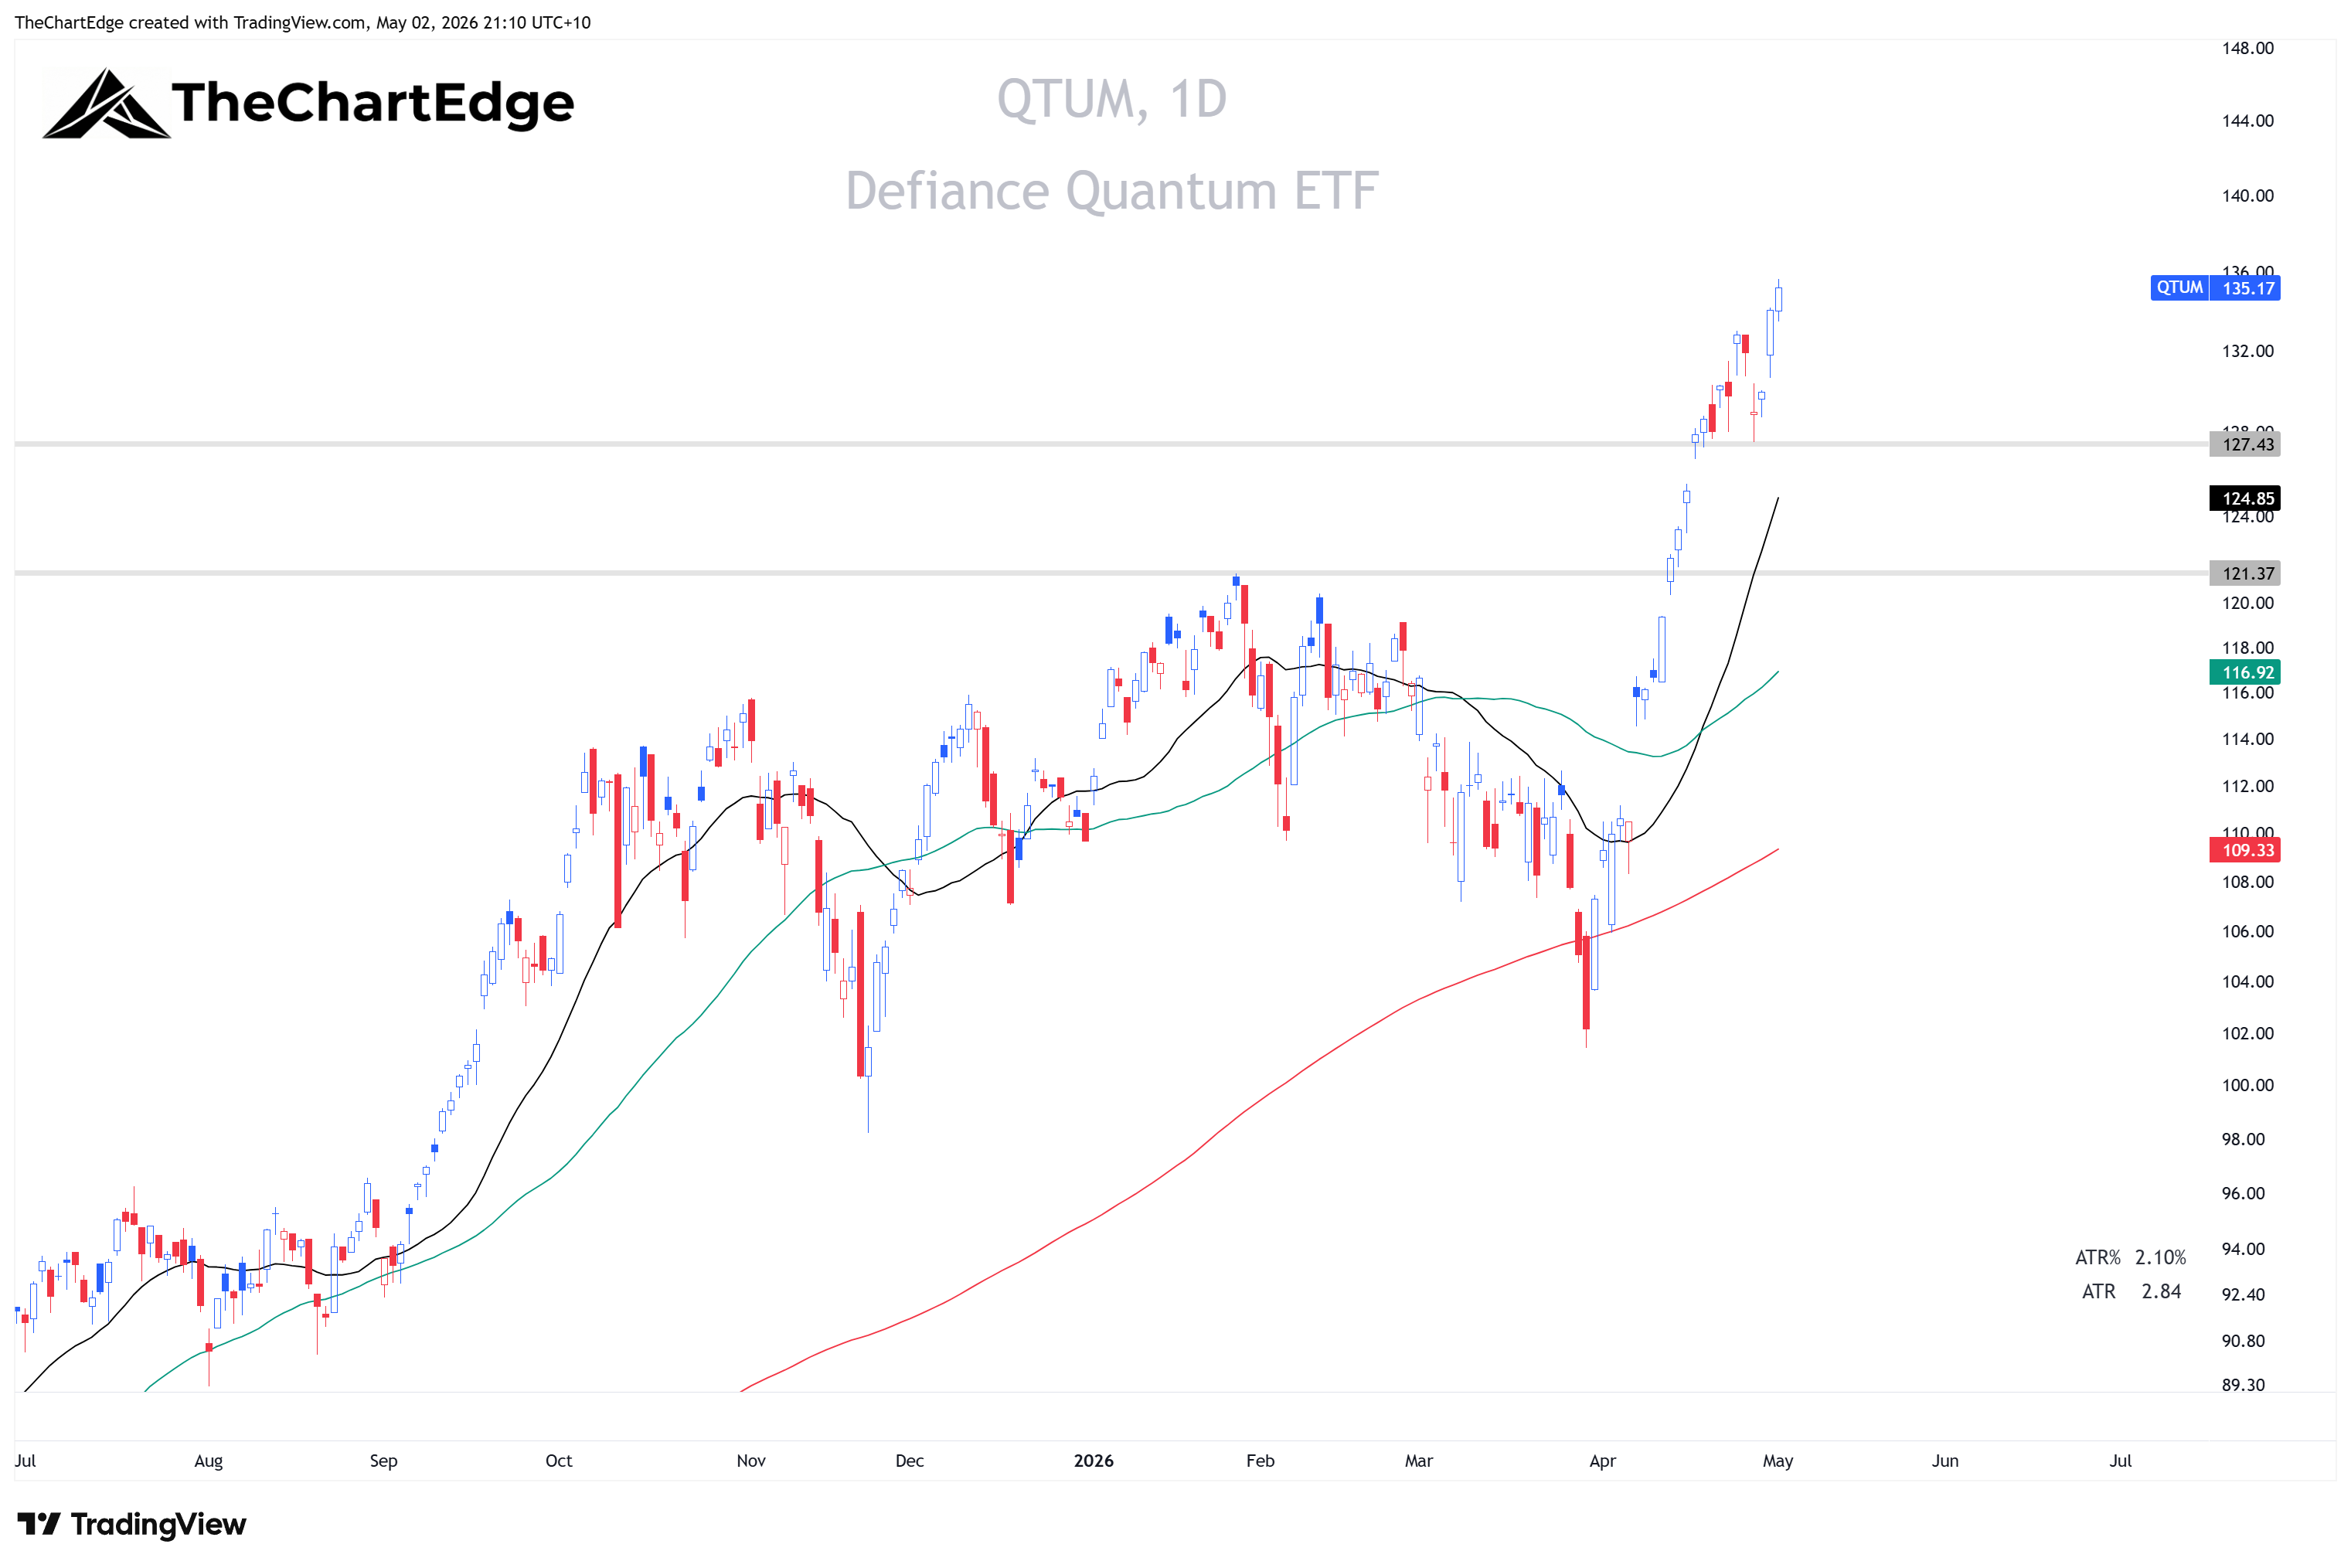
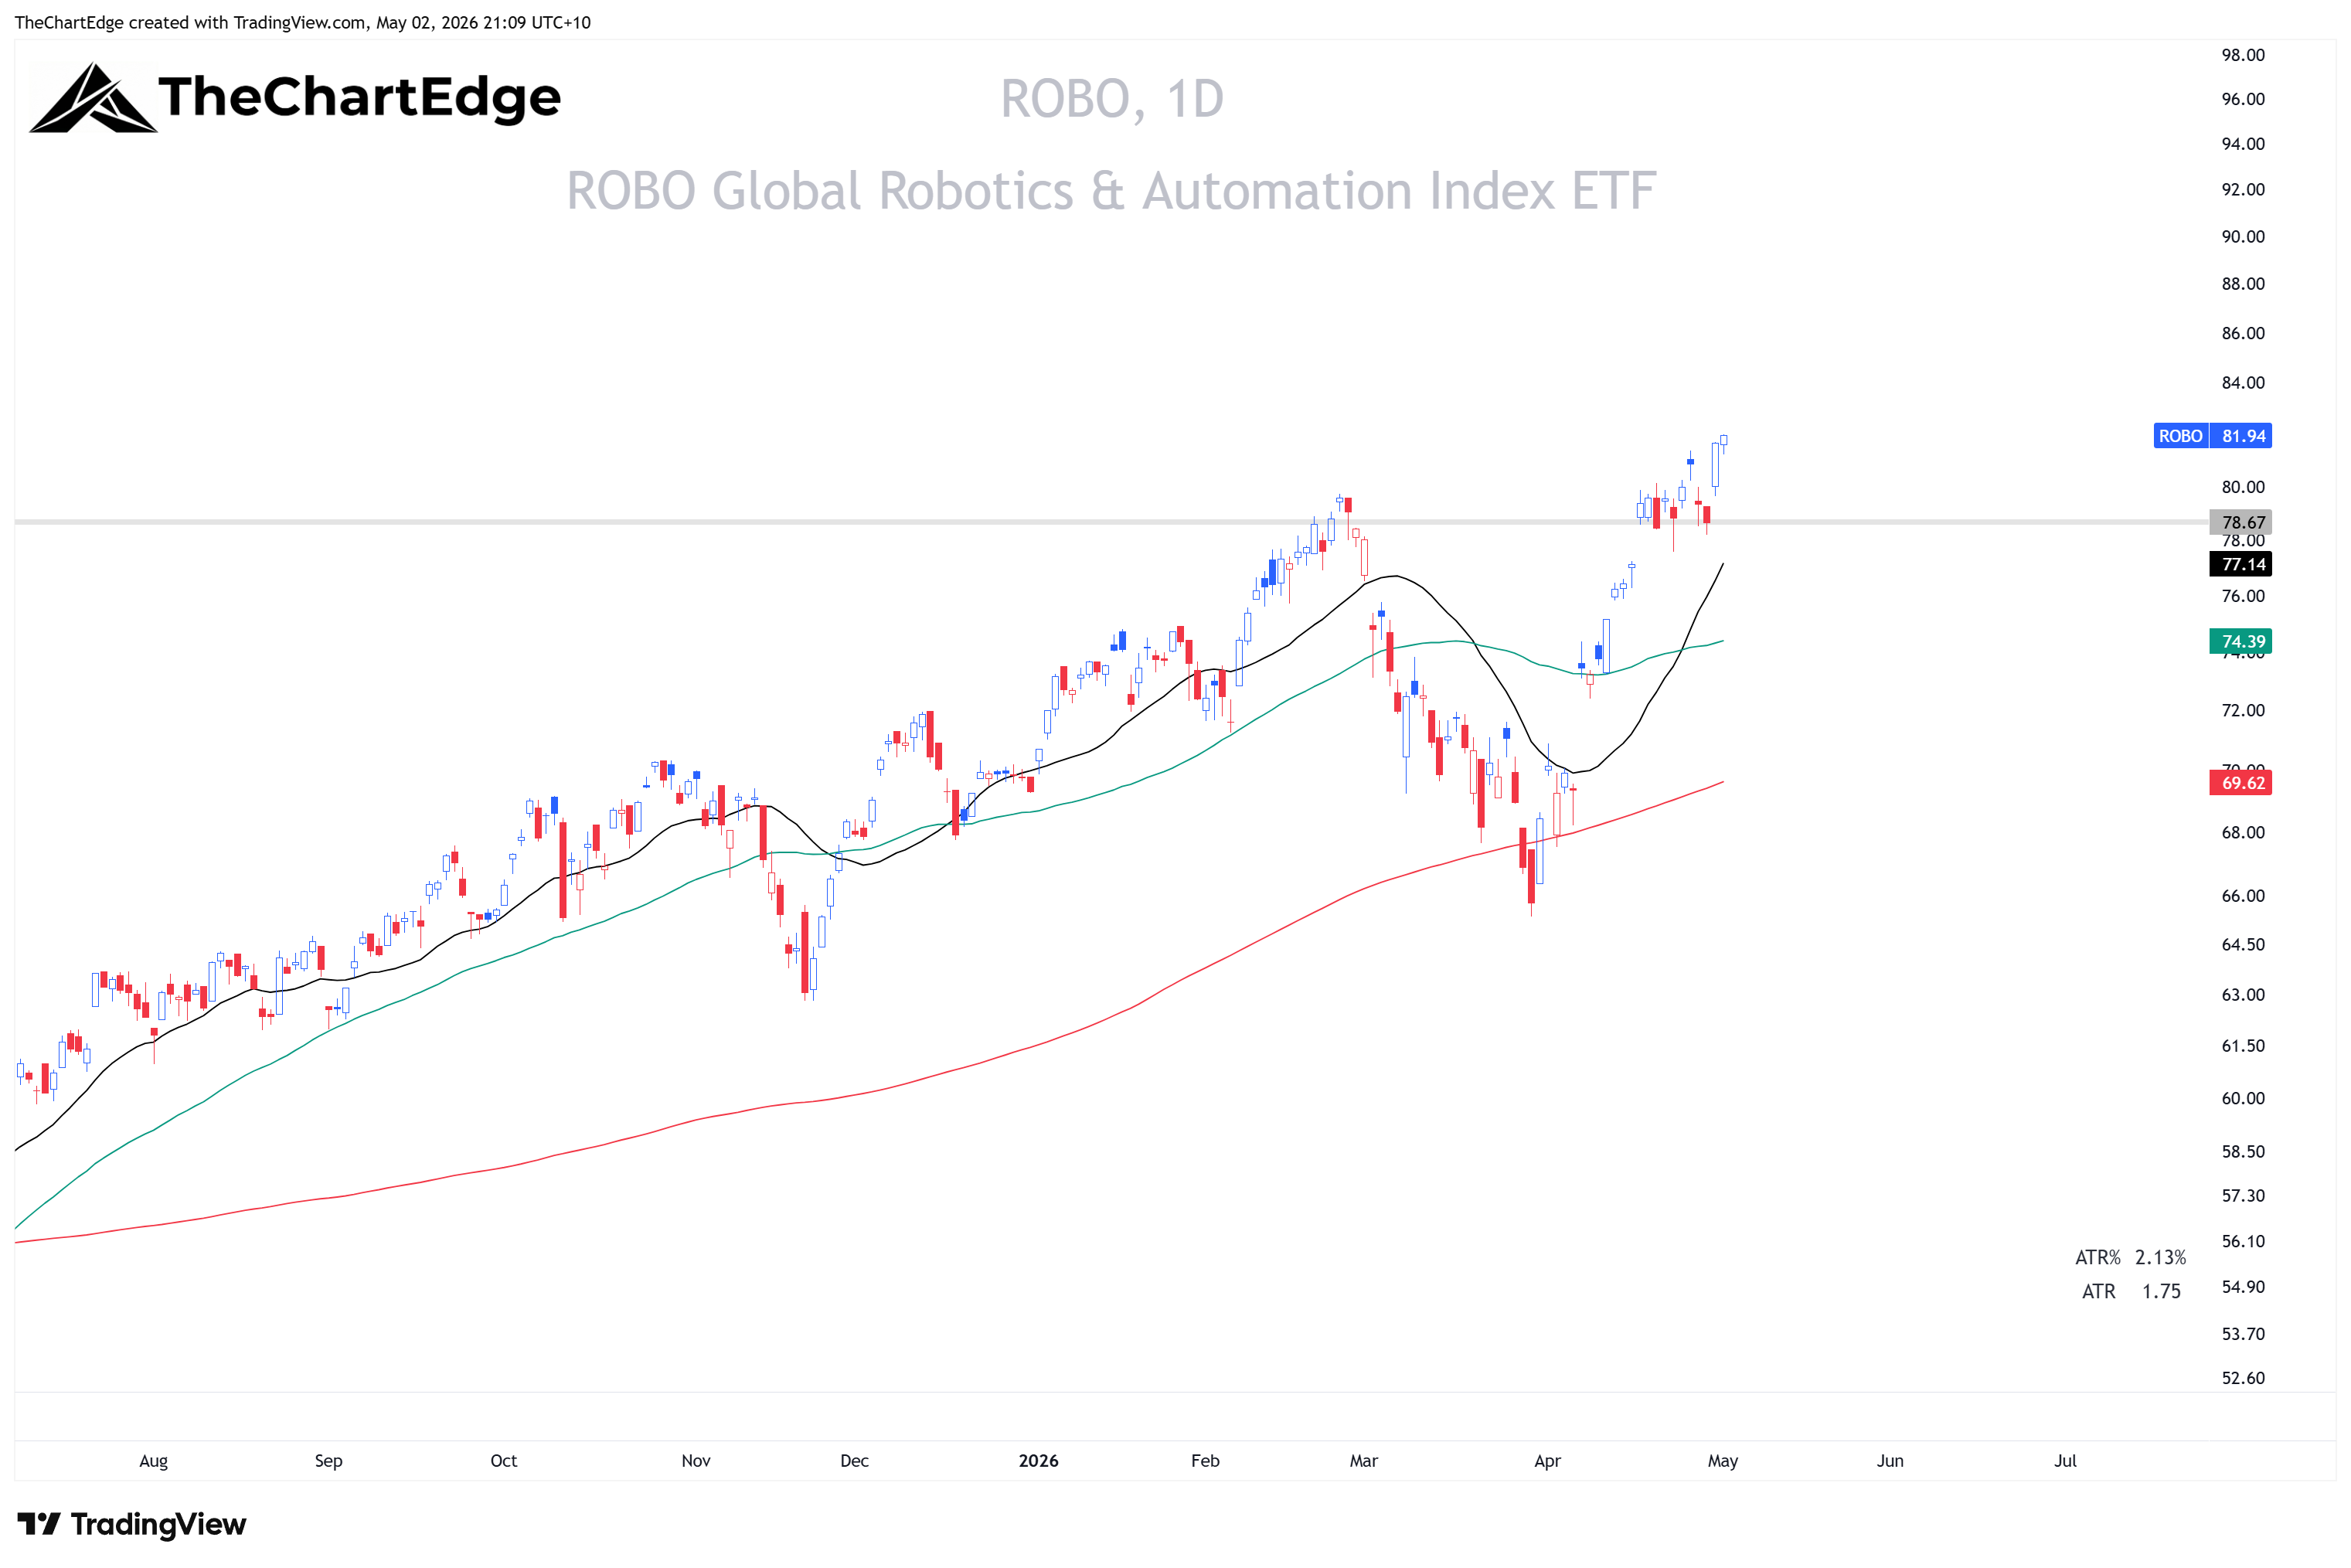
QTUM (Quantum Computing & AI) and ROBO (Robotics & AI) are both in the Leading quadrant with Strong Uptrend trend states.
QTUM Chart
ROBO Chart
IWC Chart
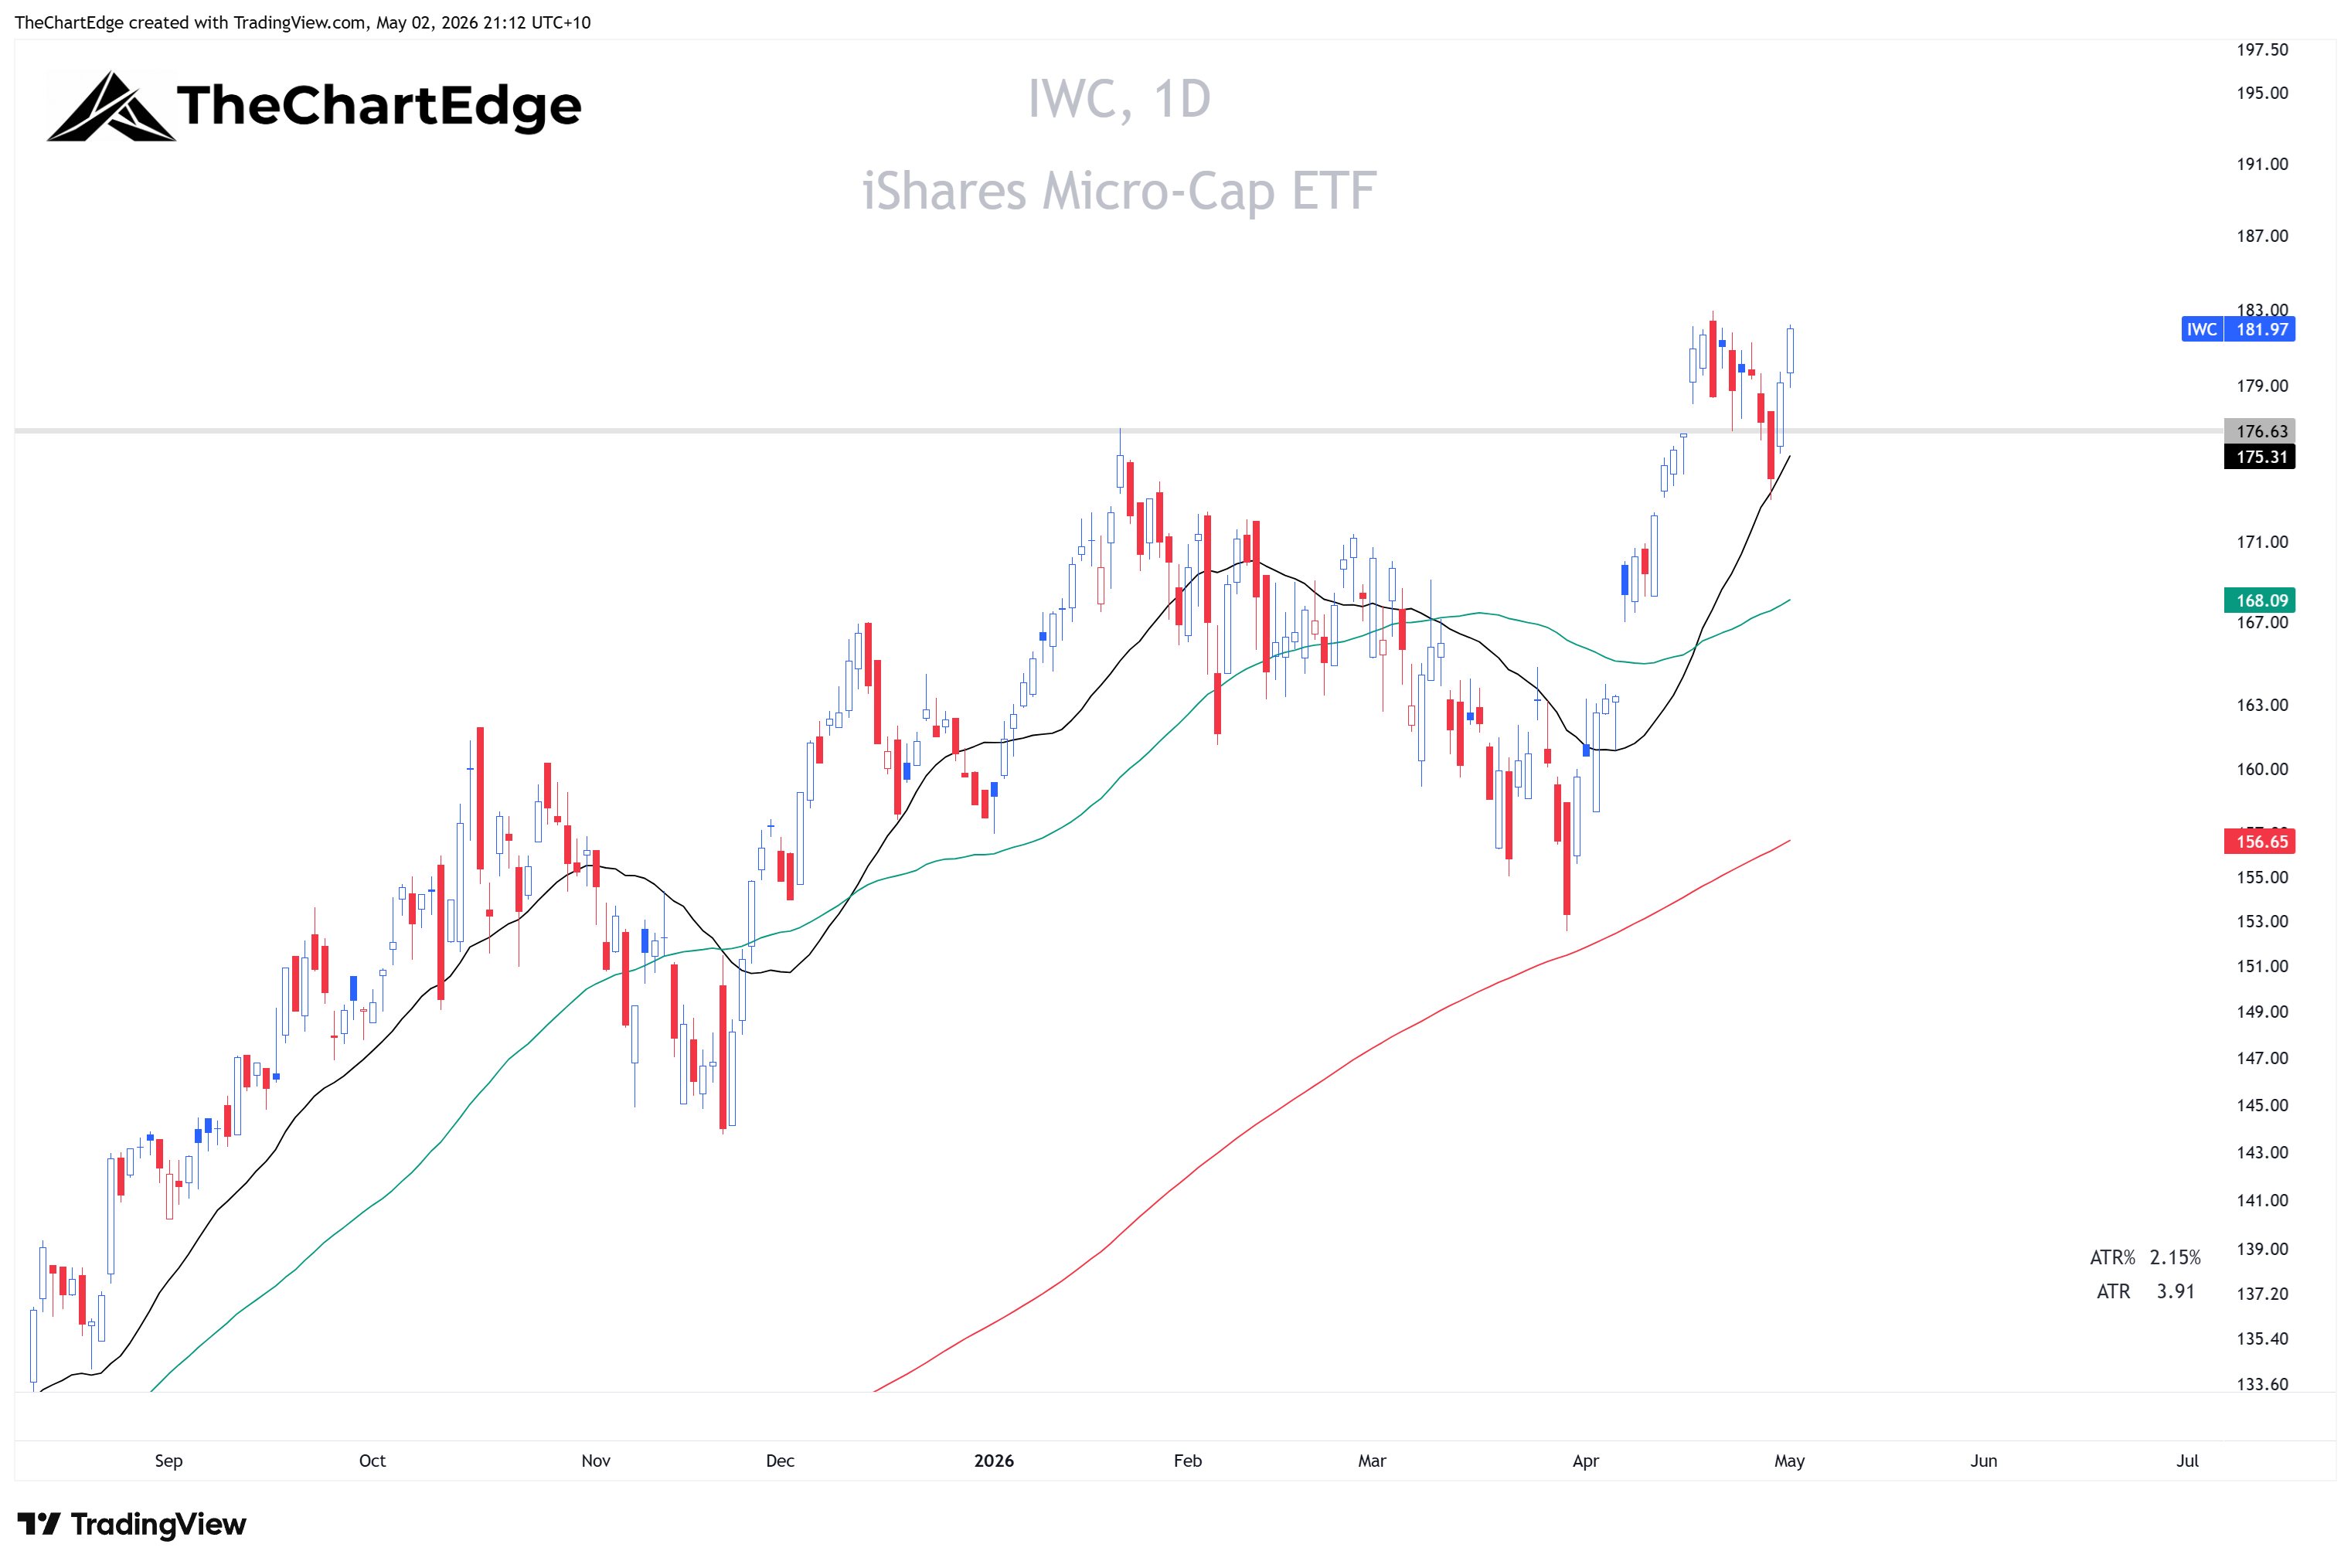
IWC (micro-caps) moved from Weakening to Leading - up 1.27% on the week and 14.19% year-to-date.
Biotech
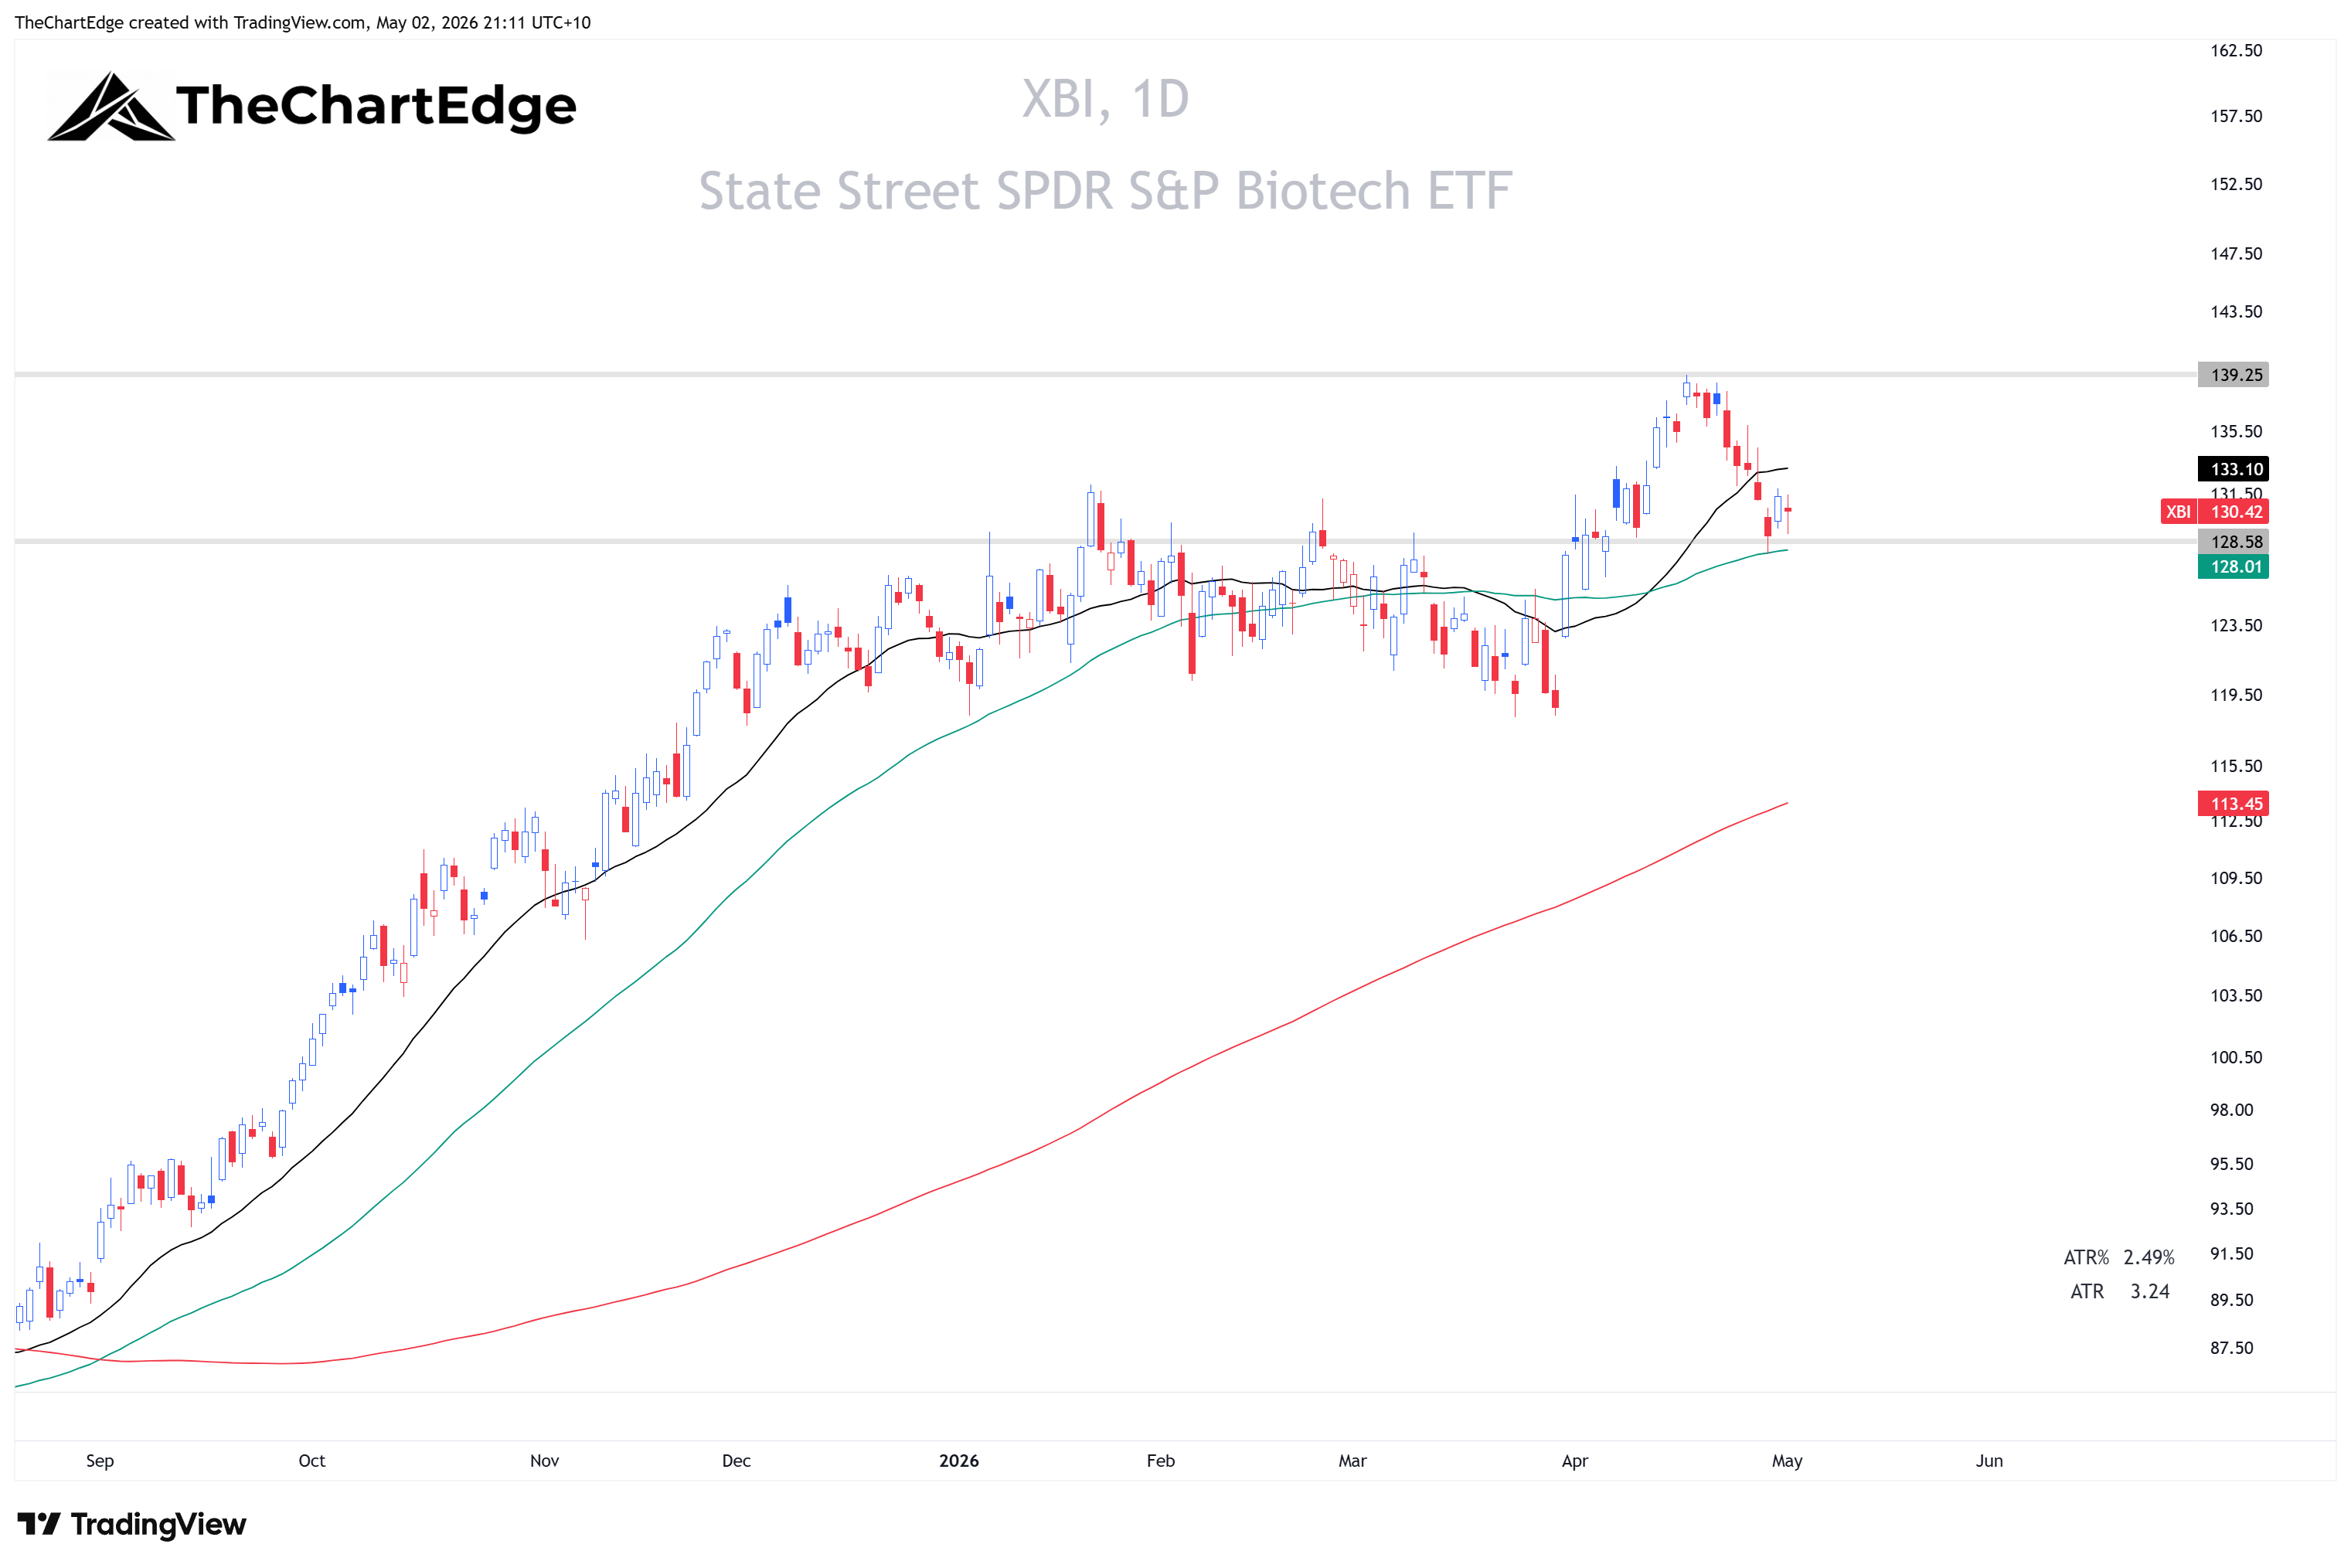
XBI (Biotech) pulled back last week but bounced off its 50-day moving average and the shelf of prior resistance (now potentially support) on Wednesday.
XBI Chart
Fixed Income
Nearly all fixed income ETFs are now in downtrends. TLT, IEF, and LQD are all Lagging with Strong Downtrend trend states, all down last week: TLT -1.27%, IEF -0.86%, LQD -0.91%. HYG (high yield) was down 0.52% and is Lagging with a Recovering Downtrend. TIP (U.S. Treasury Inflation-Protected Securities) is the only one holding a Recovering Uptrend.
SPY and QQQ are at all-time highs with VIX at 16.99 - but fixed income ETFs (excluding TIP) are broadly deteriorating, and the MOVE Index ticked up from 65.69 to 70.41 over the last 2 weeks. Equity vol falling while rate vol rises is a divergence worth watching. Continued consolidation or a mild pullback for the major indices around these levels would be constructive and potentially lead to new entries.
I’ll post another piece tomorrow with some potentially actionable names from my scans.
As always, I am open to all possibilities. Stay open minded and manage risk tightly.
Hope everyone has a great week!
Cheers,
Marcus Grant, CFTe
Disclaimer: The content provided in this newsletter is for informational and educational purposes only and should not be considered as financial, investment, or legal advice. The information shared is based on our research and analysis, but we are not a licensed financial advisor, nor can we guarantee its accuracy, completeness, or timeliness. Market conditions and financial instruments can change rapidly, and any opinions expressed may not be suitable for all investors. Any opinions expressed and or securities mentioned do not constitute a recommendation to buy, sell, or hold that or any other security. You should conduct your own due diligence and consult with a licensed financial advisor or other professional before making any investment decisions. Past performance is not indicative of future results, and all investments carry the risk of loss. The authors and publishers of this newsletter are not responsible for any financial decisions made based on the content provided herein. By reading and or subscribing to this newsletter, you acknowledge and agree that you are using the information at your own risk.