

Market Temperature Drops to 5.7 - Oil Leads, Breadth Weakens
Only 21 of 121 ETFs positive, energy sweeps into the Leading quadrant

Apologies for the delayed post this week - my car was stolen on the weekend, and I spent most of the week dealing with the fallout. This is a condensed version of the weekly note covering the week ending May 15, focusing on the Market Temperature reading and the key themes rather than the full rotation breakdown.
The S&P 500 (SPY) gained just 0.21% last week. The Nasdaq 100 (QQQ) slipped 0.32%. FANG+ (FNGS) was down 0.32%. The equal-weight S&P 500 (RSP) lost 1.24%, the S&P MidCap 400 (MDY) dropped 2.36%, and the Russell 2000 (IWM) fell 2.31%.
Flat index returns, but that doesn’t tell the real story. Only 21 of 121 ETFs in our universe posted a positive return last week. The other 100 were down.
That divergence got worse on Friday. SPY was up around 1.4% through Thursday before falling 1.20% on Friday alone. QQQ dropped 1.51%, IWM lost 2.41%, and SMH (Semiconductors) gave back 3.80%. The only GICS sector positive on Friday was Energy.
Market Temperature
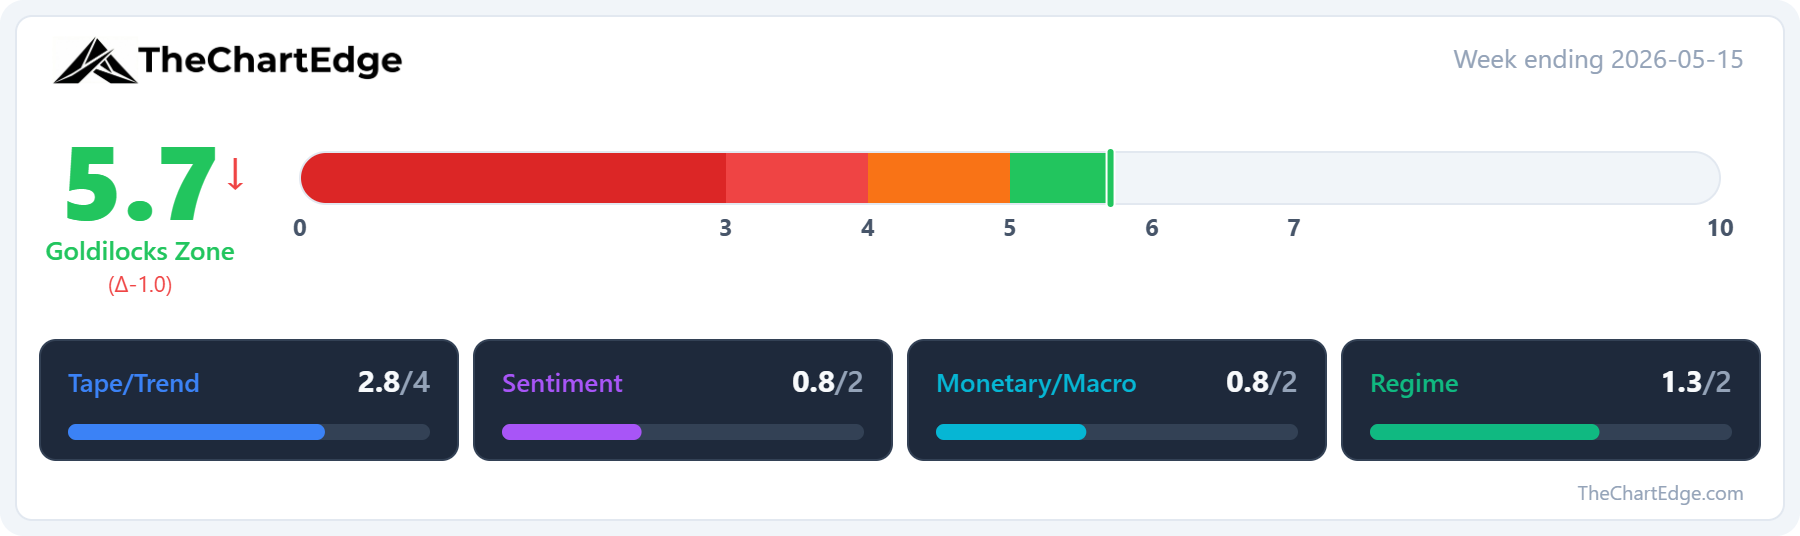
The Market Temperature dropped a full point to 5.7, back into the Goldilocks Zone after sitting at 6.7 the prior week.
Breadth deteriorated quite sharply - MMFI (% of US stocks above their 50-day moving average) fell from 63.15 to 49.74. MMTH (% of US stocks above their 200-day moving average) declined from 56.34 to 50.44.
The Monetary pillar weakened as well. The MOVE Index (rate volatility) spiked from 67.25 to 79.87, and the dollar strengthened with UUP rising from 27.34 to 27.77.
The discretionary vs staples ratio (XLY/XLP) also deteriorated, dragging the Regime pillar lower.
What’s holding the reading up? SPY and QQQ both remain in Strong Uptrends and the weekly RSI is still healthy at 69.45. SPHB/SPLV is still signalling Risk-On. But other components in the model - breadth, rates vol, dollar, defensive leadership - all pulled the temperature score down last week.
Energy Sweeps Into Leading
The dominant theme of the week. Five energy and commodity ETFs flipped from Weakening to Leading in a single week: USO (Crude Oil) +10.96%, XLE (Energy) +6.71%, RSPG (Energy Equal-Weight) +5.95%, XOP (Oil & Gas E&P) +5.43%, and OIH (Oil Services) +4.68%. DBC (Broad Commodities) also moved to Leading. UNG (Natural Gas) jumped 7.19% and moved from Lagging to Improving.
SPDR Sector Relative Strength
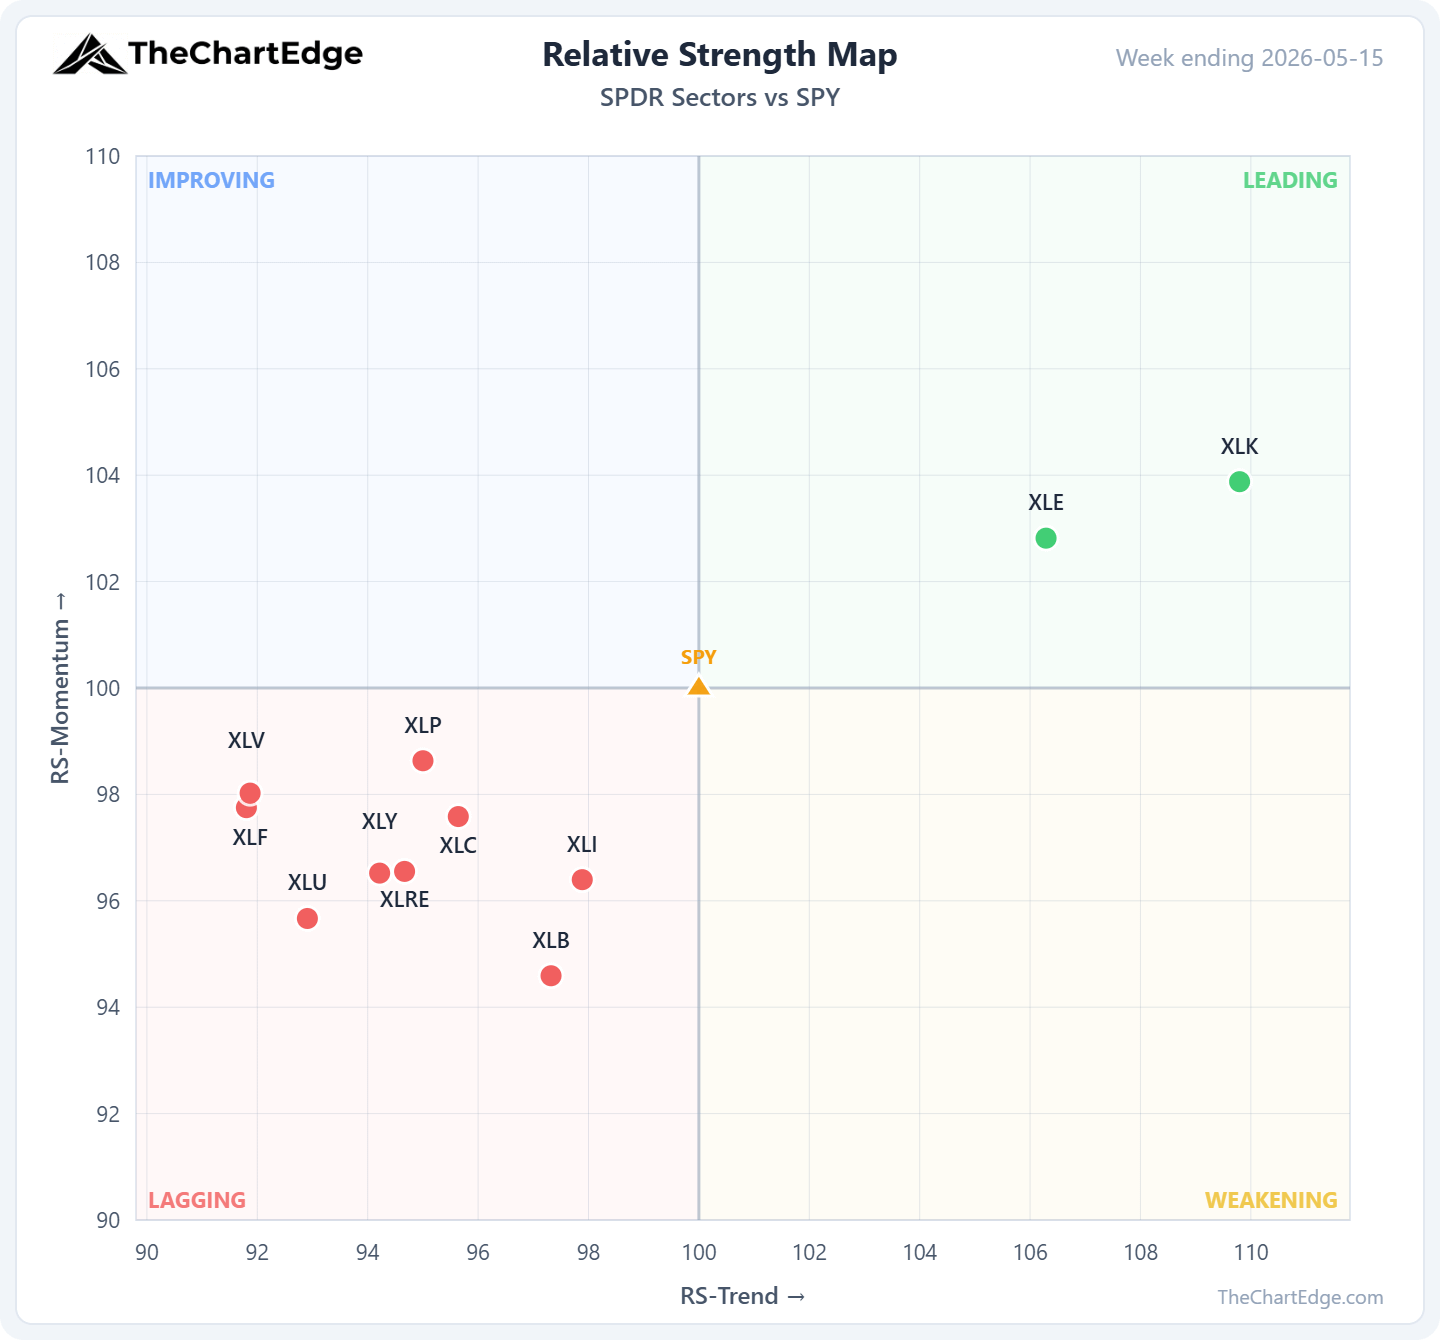
XLK (Technology) and XLE (Energy) are the only two SPDR sectors in the Leading quadrant. The other nine are all Lagging. XLP (Consumer Staples) is worth watching - its trend state upgraded to Strong Uptrend despite sitting in the Lagging quadrant, and it was one of only four GICS sectors positive on the week alongside XLK, XLE and XLV.
The Other Side
Housing (ITB -7.04%, XHB -6.04%), retail (XRT -6.65%), airlines (JETS -6.99%), and utilities (UTES -4.62%) were among the worst performers. These are all rate-sensitive or inflation-sensitive sectors. Higher oil and rising rates hit them directly.
The mining and metals complex also pulled back hard. URA (Uranium) fell 9.51%, REMX (Rare Earth) dropped 9.22%, GDX (Gold Miners) lost 7.65%, and LIT (Lithium) was down 6.75%. Every mining-related ETF in our universe was negative on the week.
TLT (Long-Term Treasuries) fell 2.81%, and the MOVE Index spike from 67 to 80 signals ongoing rate volatility. In last week’s post I flagged the prior MOVE/VIX divergence resolving - it un-resolved. Rate vol is climbing again while equity vol remains relatively subdued.
What I’m Watching
The Leading quadrant contracted from 25 to 21 names despite SPY being flat. Lagging expanded from 62 to 66.
At 5.7, the temperature is still comfortably in the Goldilocks Zone. But breadth is weakening with large-cap indices holding near highs. It remains to be seen whether this is a short-term rotation and pullback or the early stages of longer consolidation or deeper pullback. We are still quite extended from the 50-day SMAs in SPY, QQQ, SMH and other tech/AI ETFs.
Stay open-minded and manage risk tightly.
Cheers,
Marcus Grant, CFTe
Disclaimer: The content provided in this newsletter is for informational and educational purposes only and should not be considered as financial, investment, or legal advice. The information shared is based on our research and analysis, but we are not a licensed financial advisor, nor can we guarantee its accuracy, completeness, or timeliness. Market conditions and financial instruments can change rapidly, and any opinions expressed may not be suitable for all investors. Any opinions expressed and or securities mentioned do not constitute a recommendation to buy, sell, or hold that or any other security. You should conduct your own due diligence and consult with a licensed financial advisor or other professional before making any investment decisions. Past performance is not indicative of future results, and all investments carry the risk of loss. The authors and publishers of this newsletter are not responsible for any financial decisions made based on the content provided herein. By reading and or subscribing to this newsletter, you acknowledge and agree that you are using the information at your own risk.