

Market Temperature Drops to 5.2 - The Pullback Arrives
Friday’s selling was a change in character

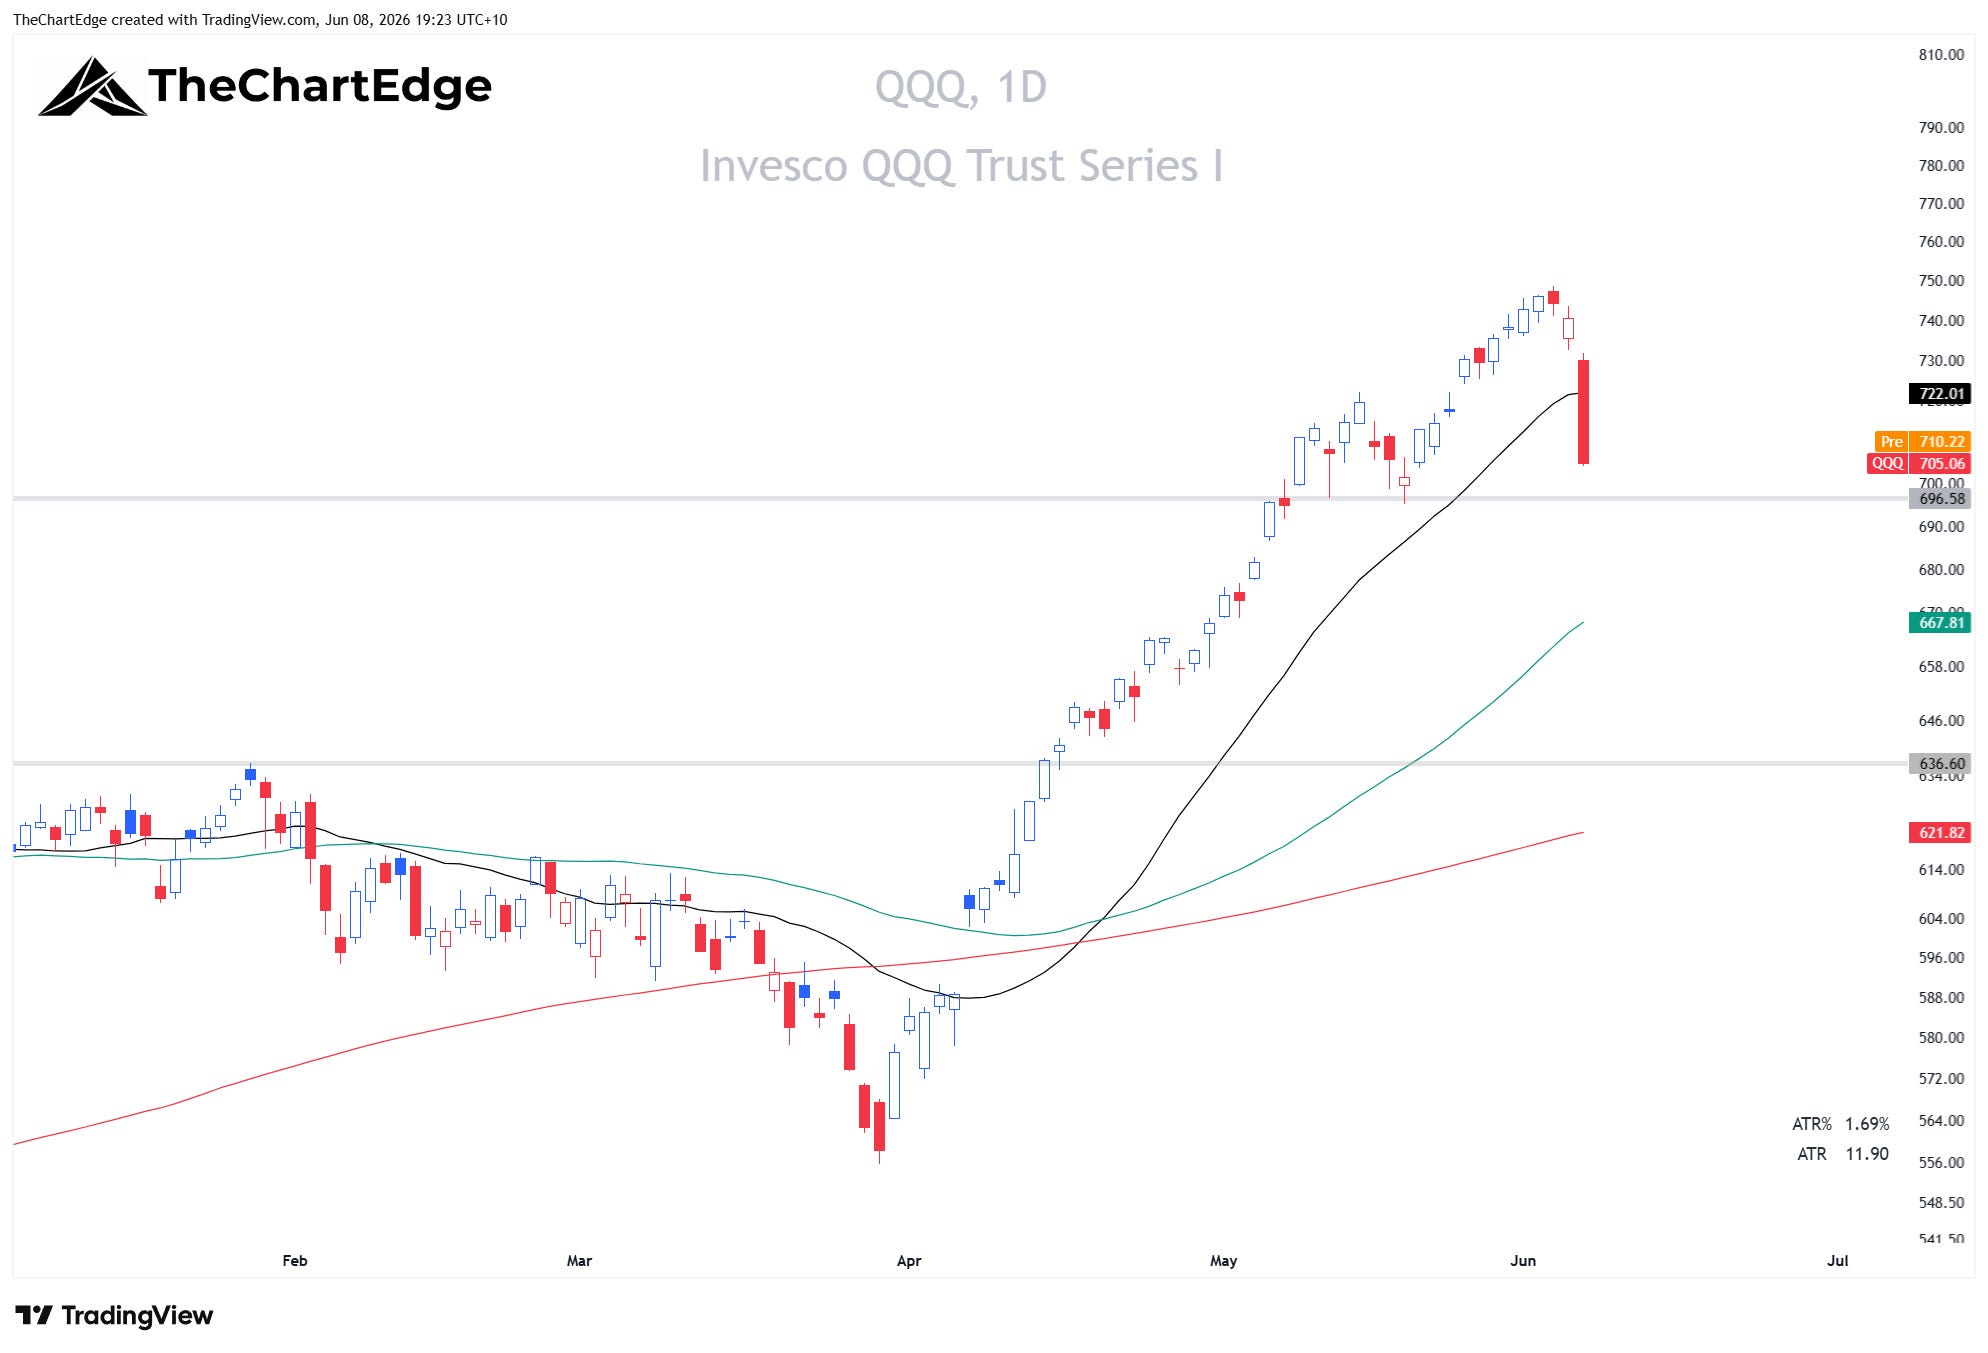
After nine consecutive up weeks, the S&P 500 (SPY) fell 2.5% (week ending June 5), the Nasdaq 100 (QQQ) dropped 4.5%, the Russell 2000 (IWM) 3%, microcaps (IWC) over 5%, and FANG+ (FNGS) over 7%.
The Dow (DIA) was barely down at 0.2%, the S&P MidCap 400 (MDY) off 0.9%, the equal weight S&P (RSP) 0.5%, and Russell 1000 Value (IWD) 0.7%. The damage was concentrated in growth, the mega caps, small caps and speculative areas. The broad, value-tilted and defensive parts of the market held up far better.
SPY Chart
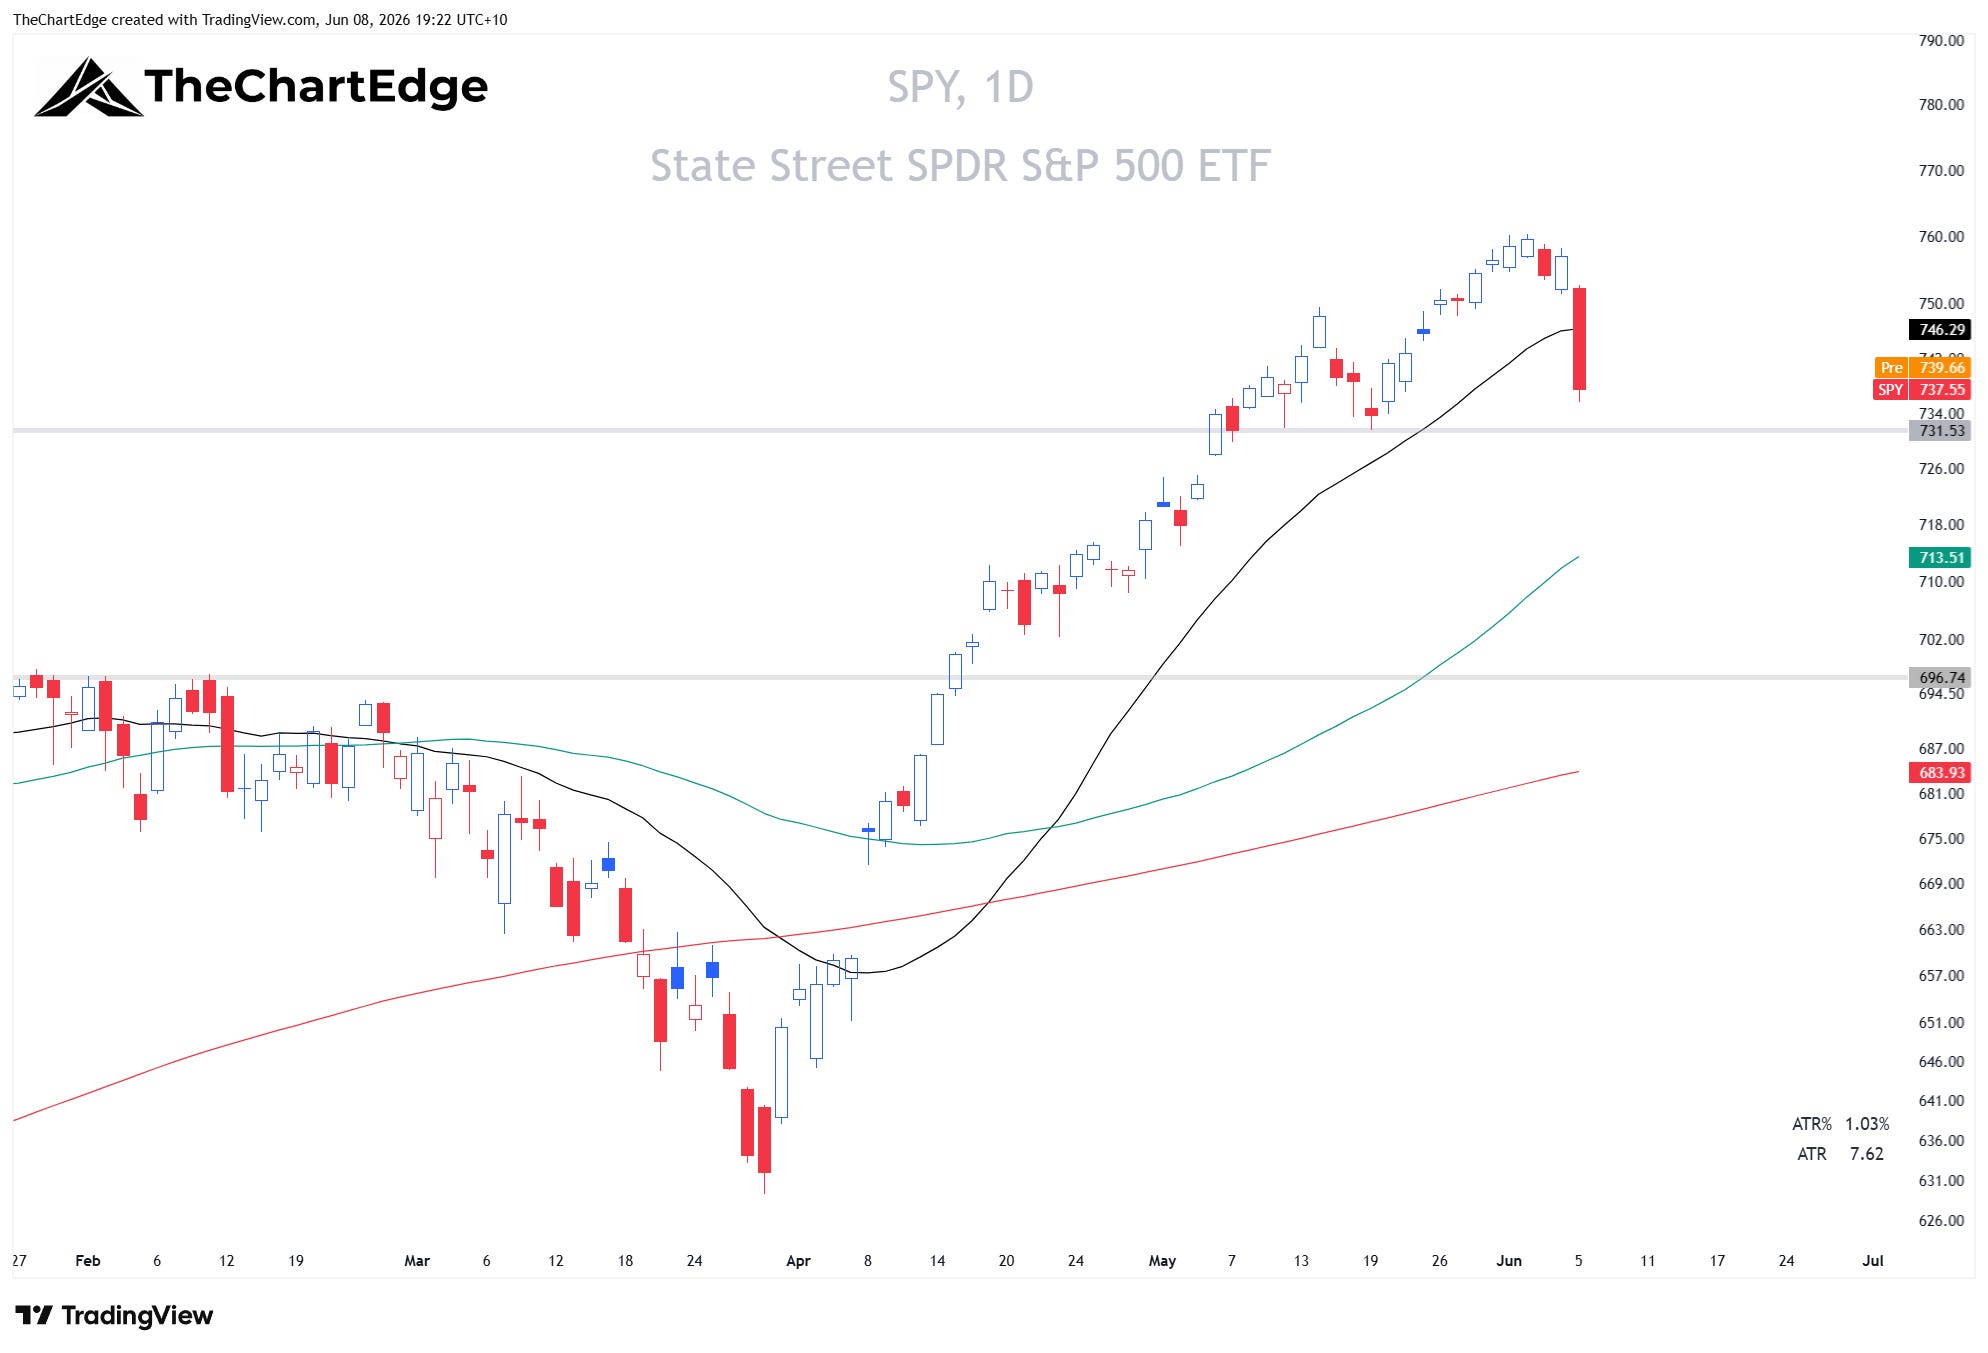
For all daily charts the black line is the 20-day SMA, the green is the 50-day SMA, and the red is the 200-day SMA.
QQQ Chart
Market Temperature Drops to 5.2
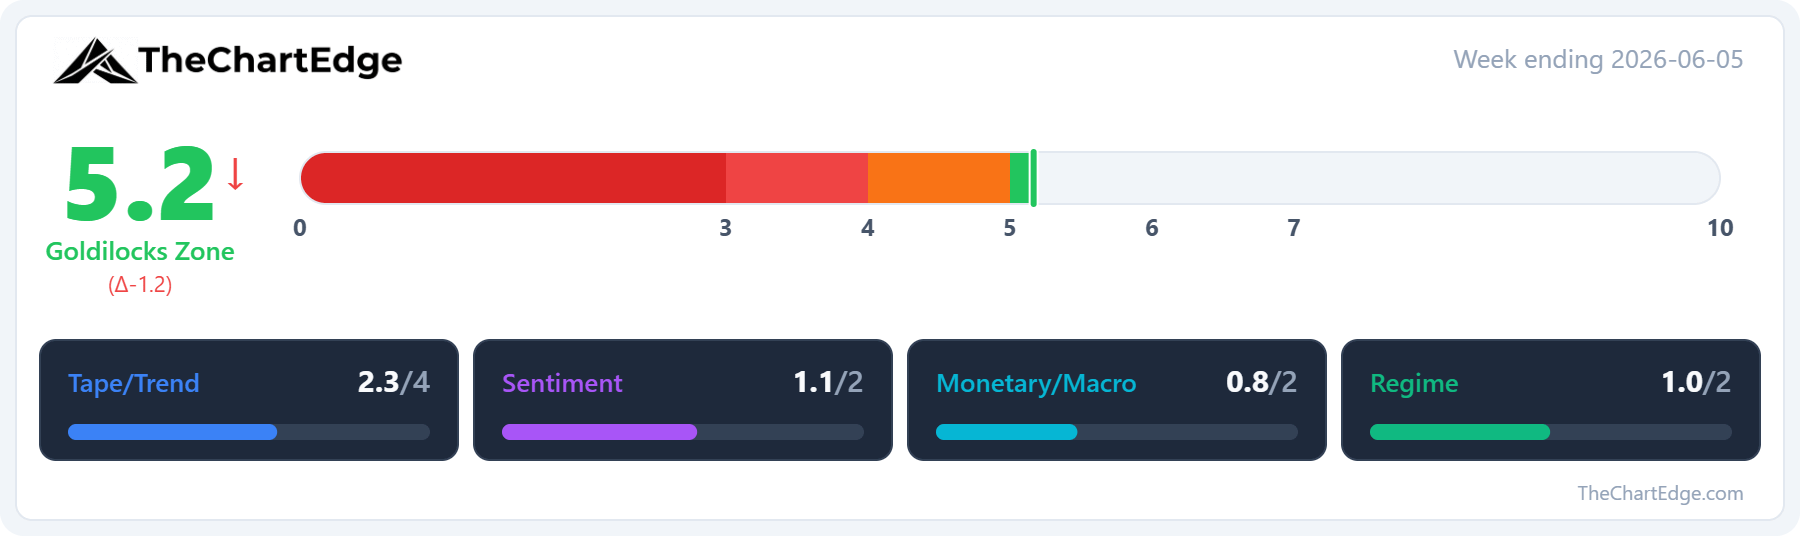
The Market Temperature fell to 5.2 from 6.4, dropping out of Strong and into the Goldilocks Zone.
The Tape/Trend pillar suffered the most damage. Both the SPY and QQQ trend states downgraded from Strong Uptrend to Uptrend, the weekly RSI on the S&P came in from 72.97 to 64.04, and breadth weakened. The percentage of US stocks above their 50-day moving average fell from 58.88 to 49.55 and the percentage above their 200-day fell from 55.66 to 52.48.
The Regime pillar also softened as discretionary lost ground to staples and growth underperformed value.
On the Monetary/Macro side, the dollar firmed back above 100 on the US Dollar Index and bond volatility (the MOVE index) rose from 70.22 to 75.20.
The one pillar that improved was Sentiment - the VIX jumped from 15.32 to 21.51 - the model reads a rising VIX as a contrarian positive.
Friday’s Change of Character
A normal, healthy pullback in a strong trend tends to be more orderly - a few down days, drifting back toward the 20-day, buyers stepping in - Friday wasn’t that.
Many of the leading ETFs and the major indices sliced straight through their 20-day moving averages in a single session. By the close, 79 of the 121 ETFs I track were sitting below their 20-day. Of the names that had been in the Leading quadrant and dropped into Weakening last week, 14 of 15 finished below their 20-day.
The character of the selling matters more than the size of it. A 2.5% down week on the S&P 500 isn’t extreme on its own. But the speed and breadth of Friday’s move is the kind of thing worth respecting until the market shows you otherwise.
FNGS Chart
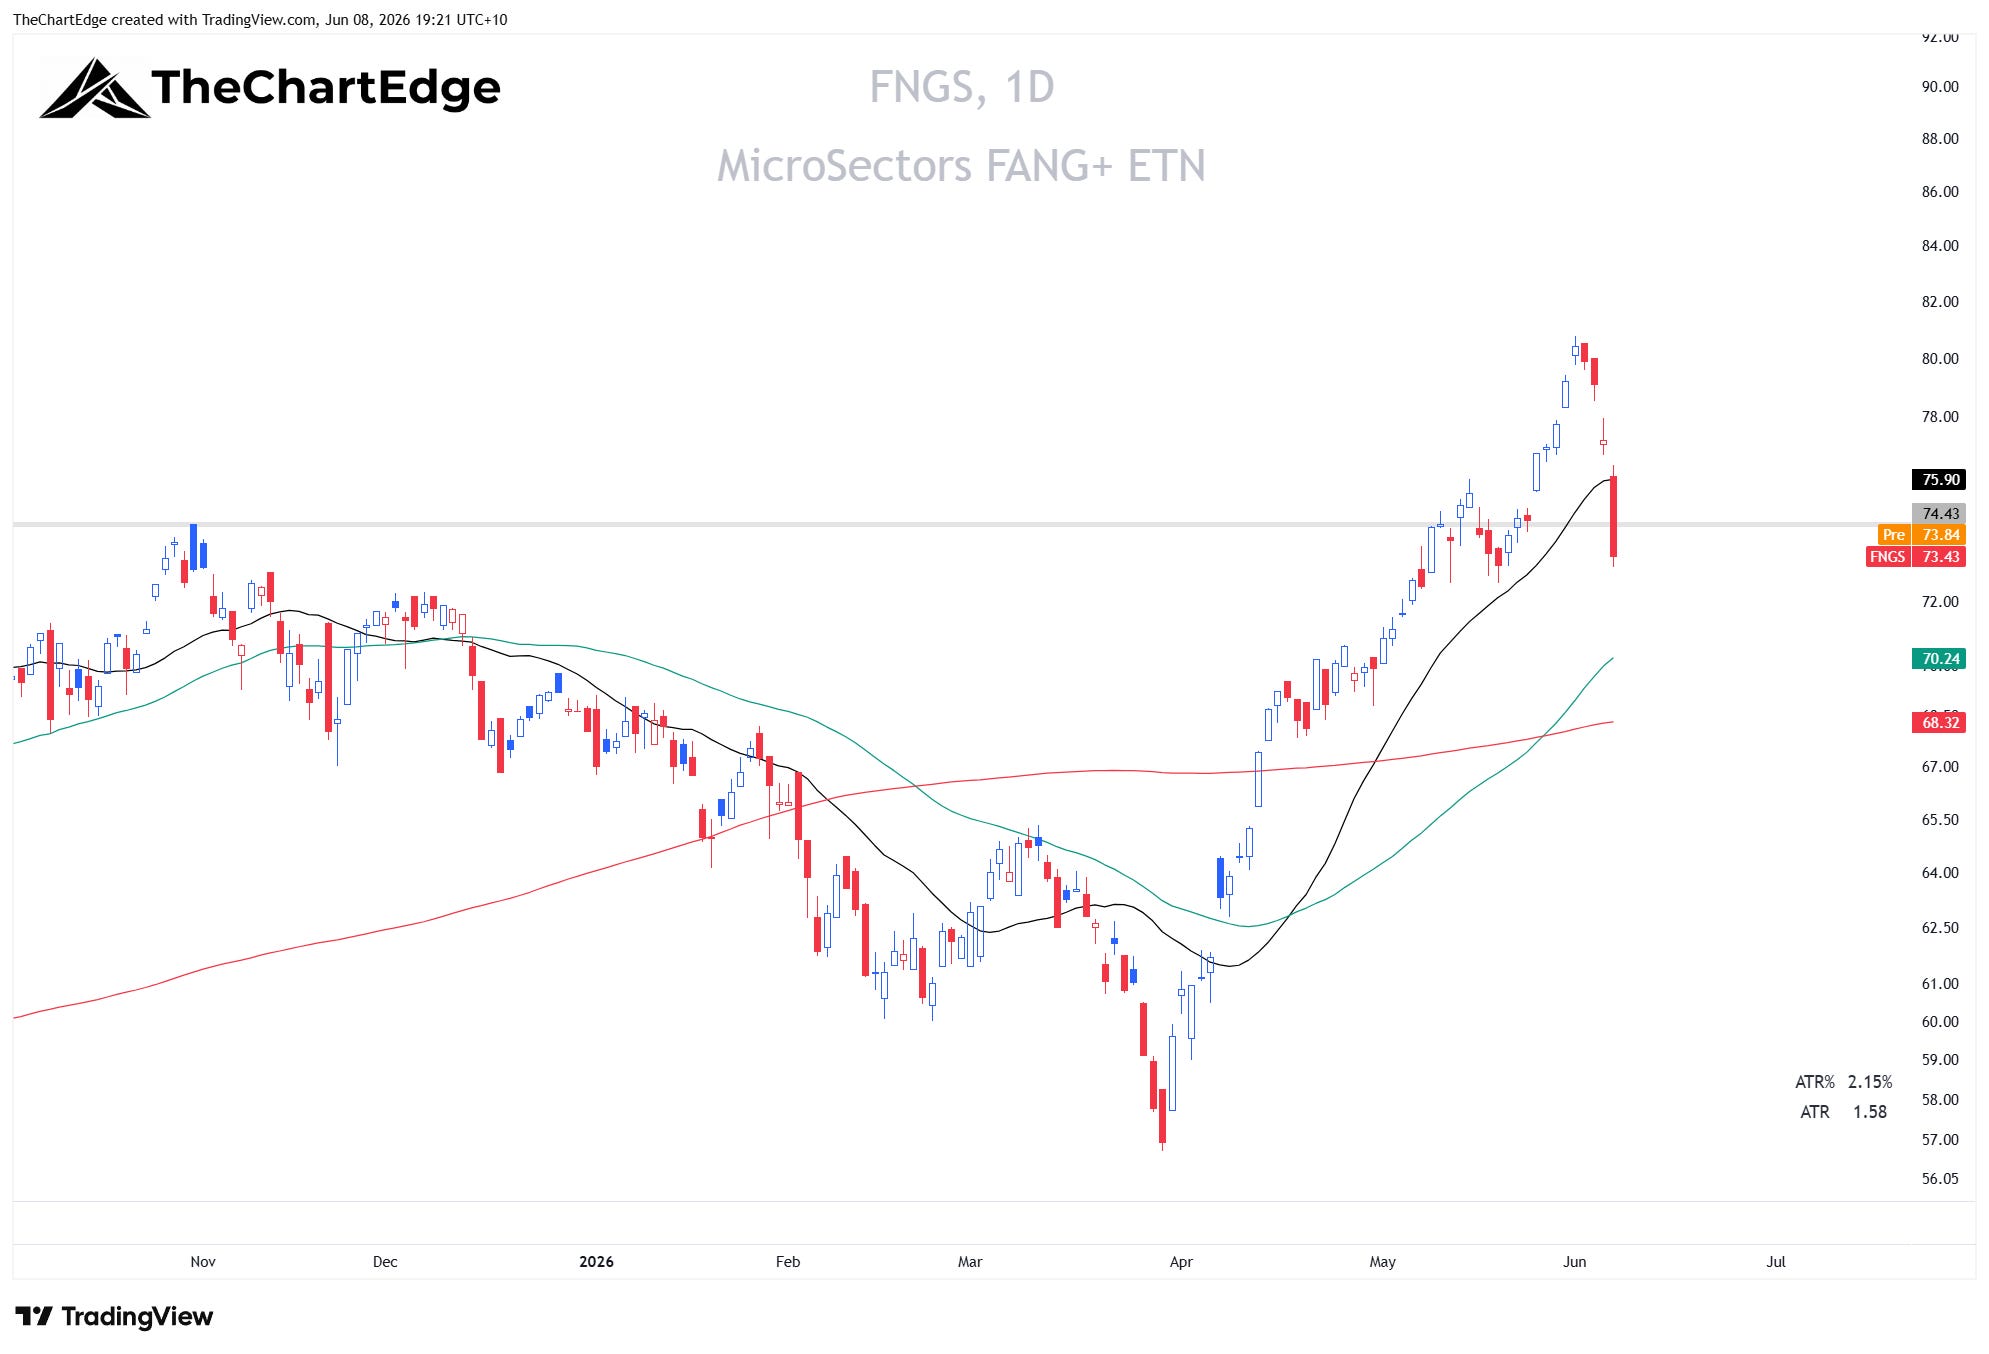
FNGS not only broke decisively through its 20-day SMA but also closed below its breakout zone.
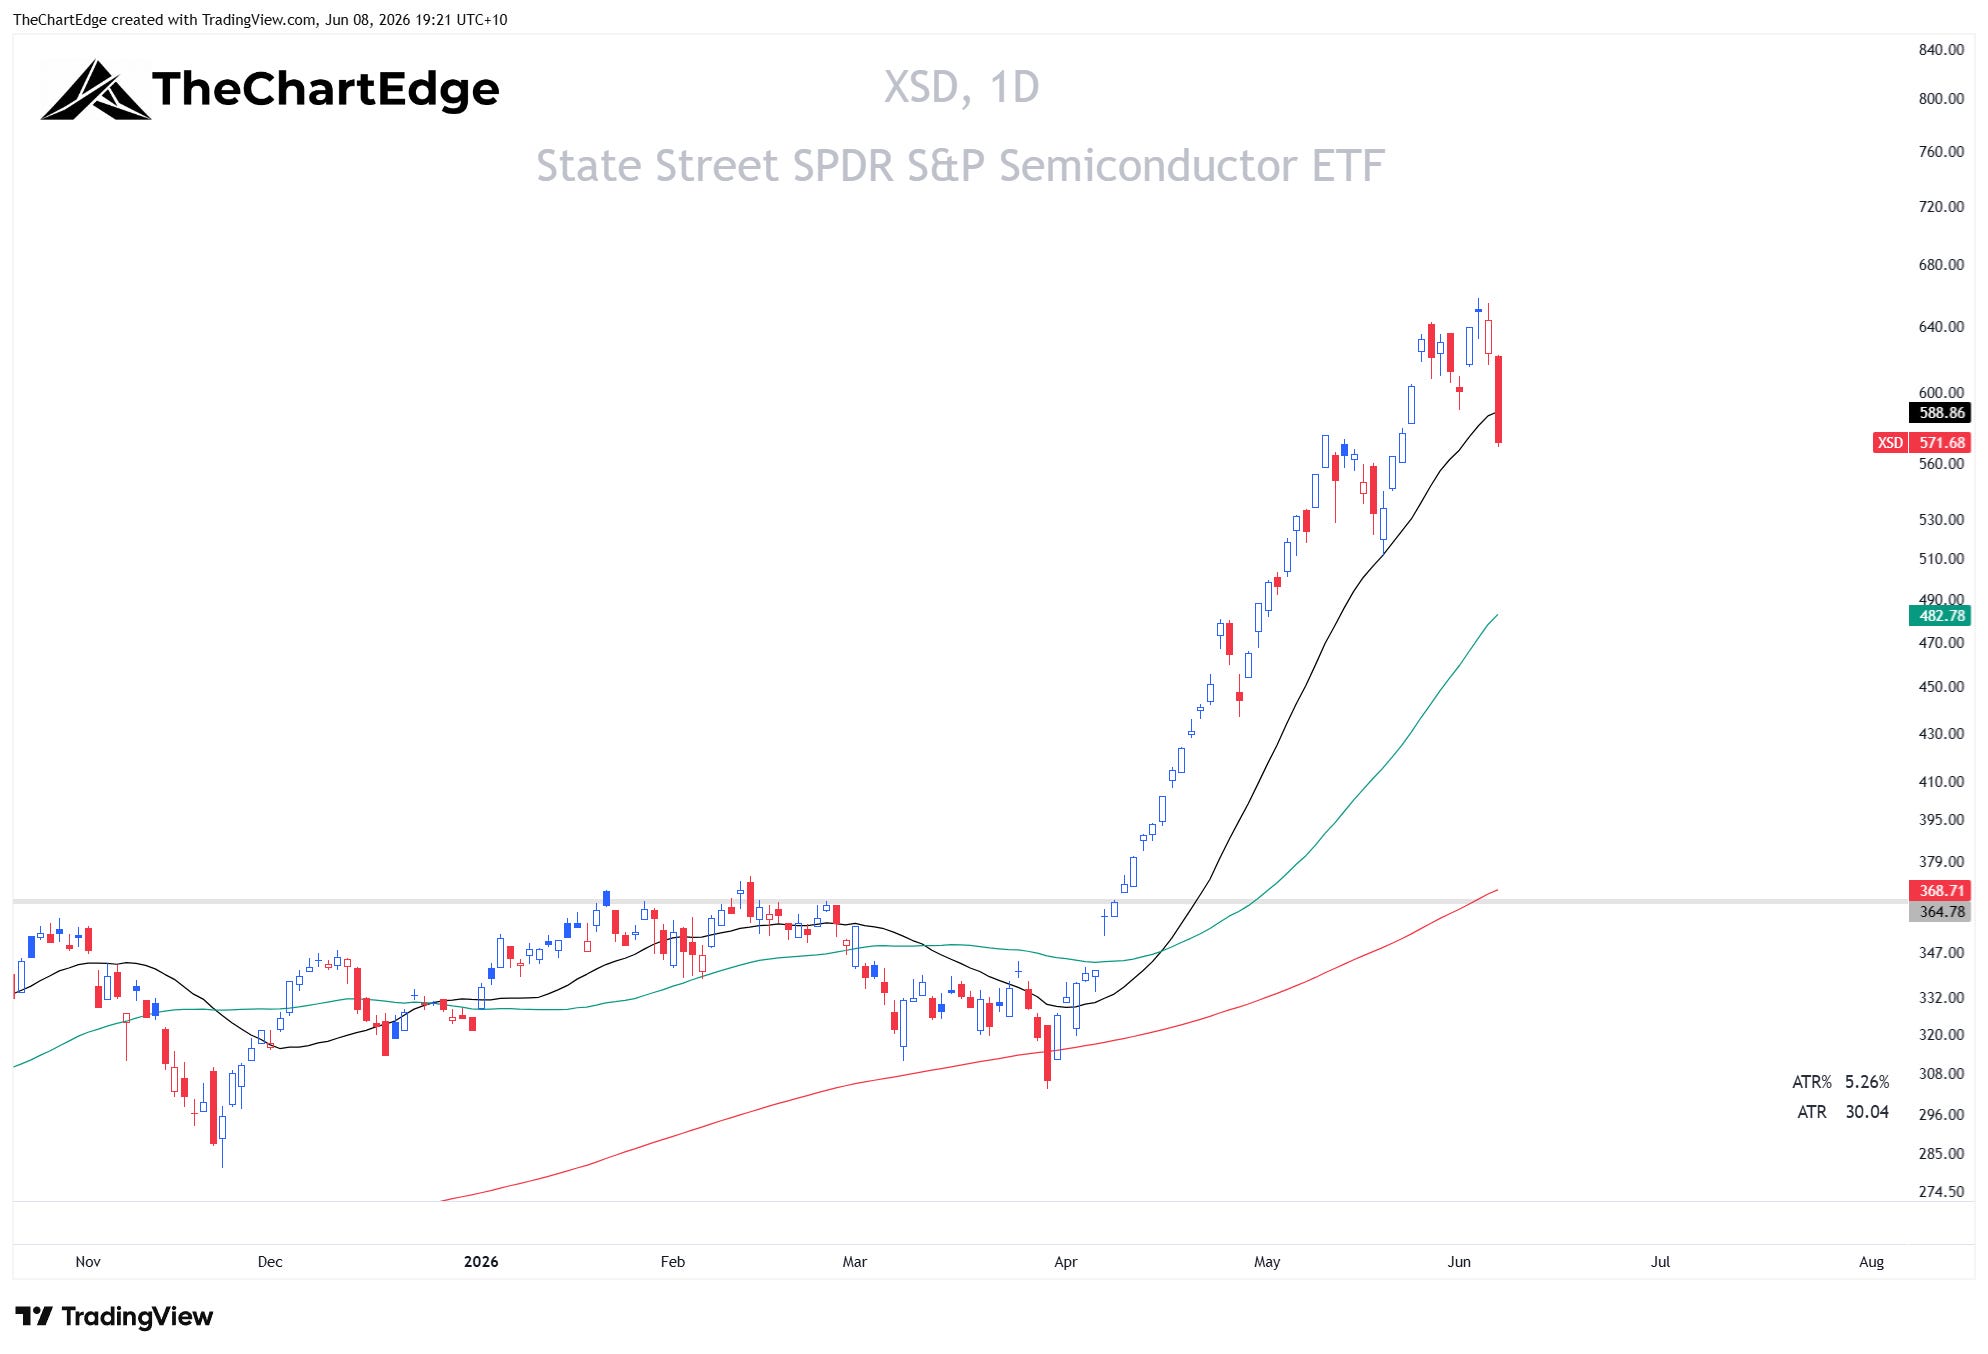
XSD Chart
SPDR Sector Relative Strength
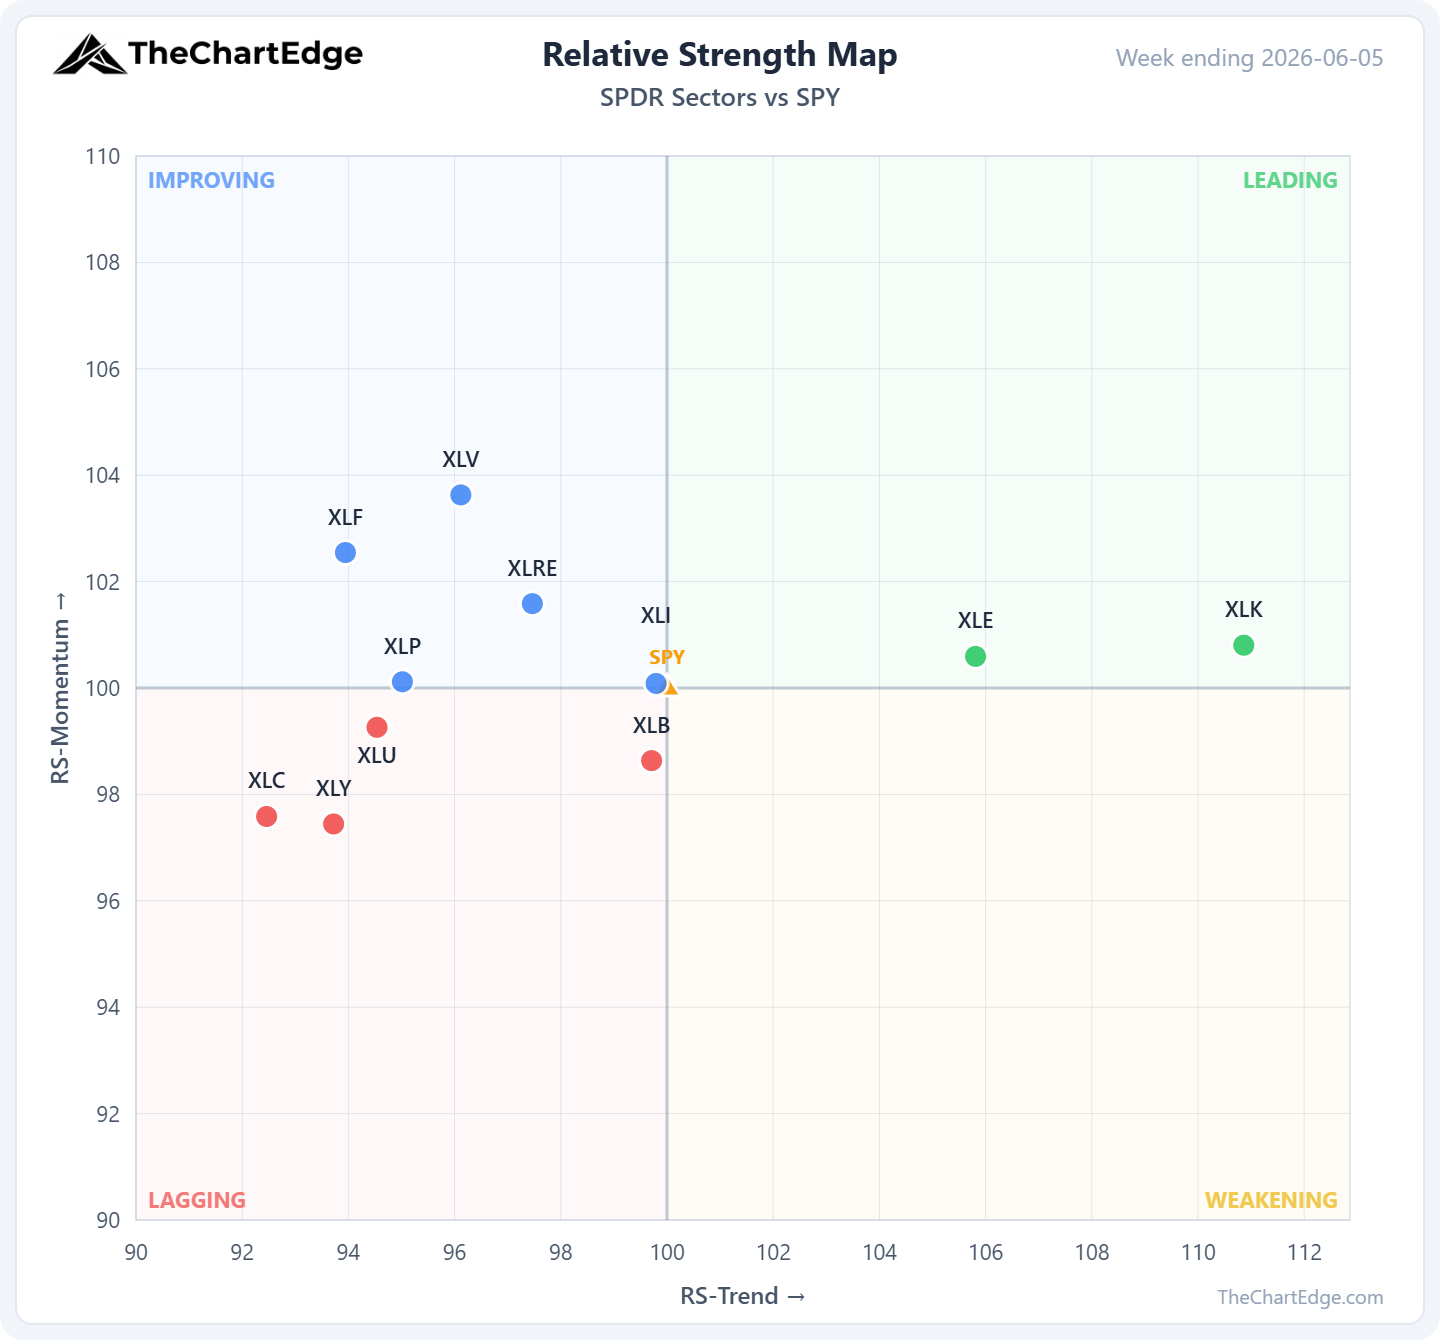
Only two of the eleven GICS sectors are in Leading: Technology (XLK) and Energy (XLE). Energy crossed in from Weakening after a 2.45% week - crude (USO) was up 3%.
Five sectors moved up into Improving, all from Lagging: Healthcare (XLV) up 2.4%, Real Estate (XLRE) 1.6%, Financials (XLF) 1.4%, Staples (XLP) 0.6% and Industrials (XLI) 0.6%.
The biggest weekly falls came from the growth-tilted sectors - Technology (XLK) -5.6%, Consumer Discretionary (XLY) -5.0% and Communications (XLC) -3.5%.
What Held and What Didn’t
The rotation showed up clearly at the top of my momentum board. Two weeks ago it was wall-to-wall growth - crypto, cloud, software, AI, semis, solar - and all of it rising. Last week half that group dropped off, replaced by healthcare, financials, insurance, real estate and anti-beta. The growth names that hung on near the top, cyber (CIBR), software (IGV), genomics (ARKG) and equal-weight tech (RSPT), were all down for the week. They kept their place on longer-term momentum, not because they rose.
The names going up were defensive, value, and interestingly also cyclicals; regional banks (KRE), banks (KBE), insurance (KIE), homebuilders (XHB) and medical equipment (IHI) all finished green. Low volatility (SPLV) rose 1.7% - while high beta (SPHB) fell 4.5%.
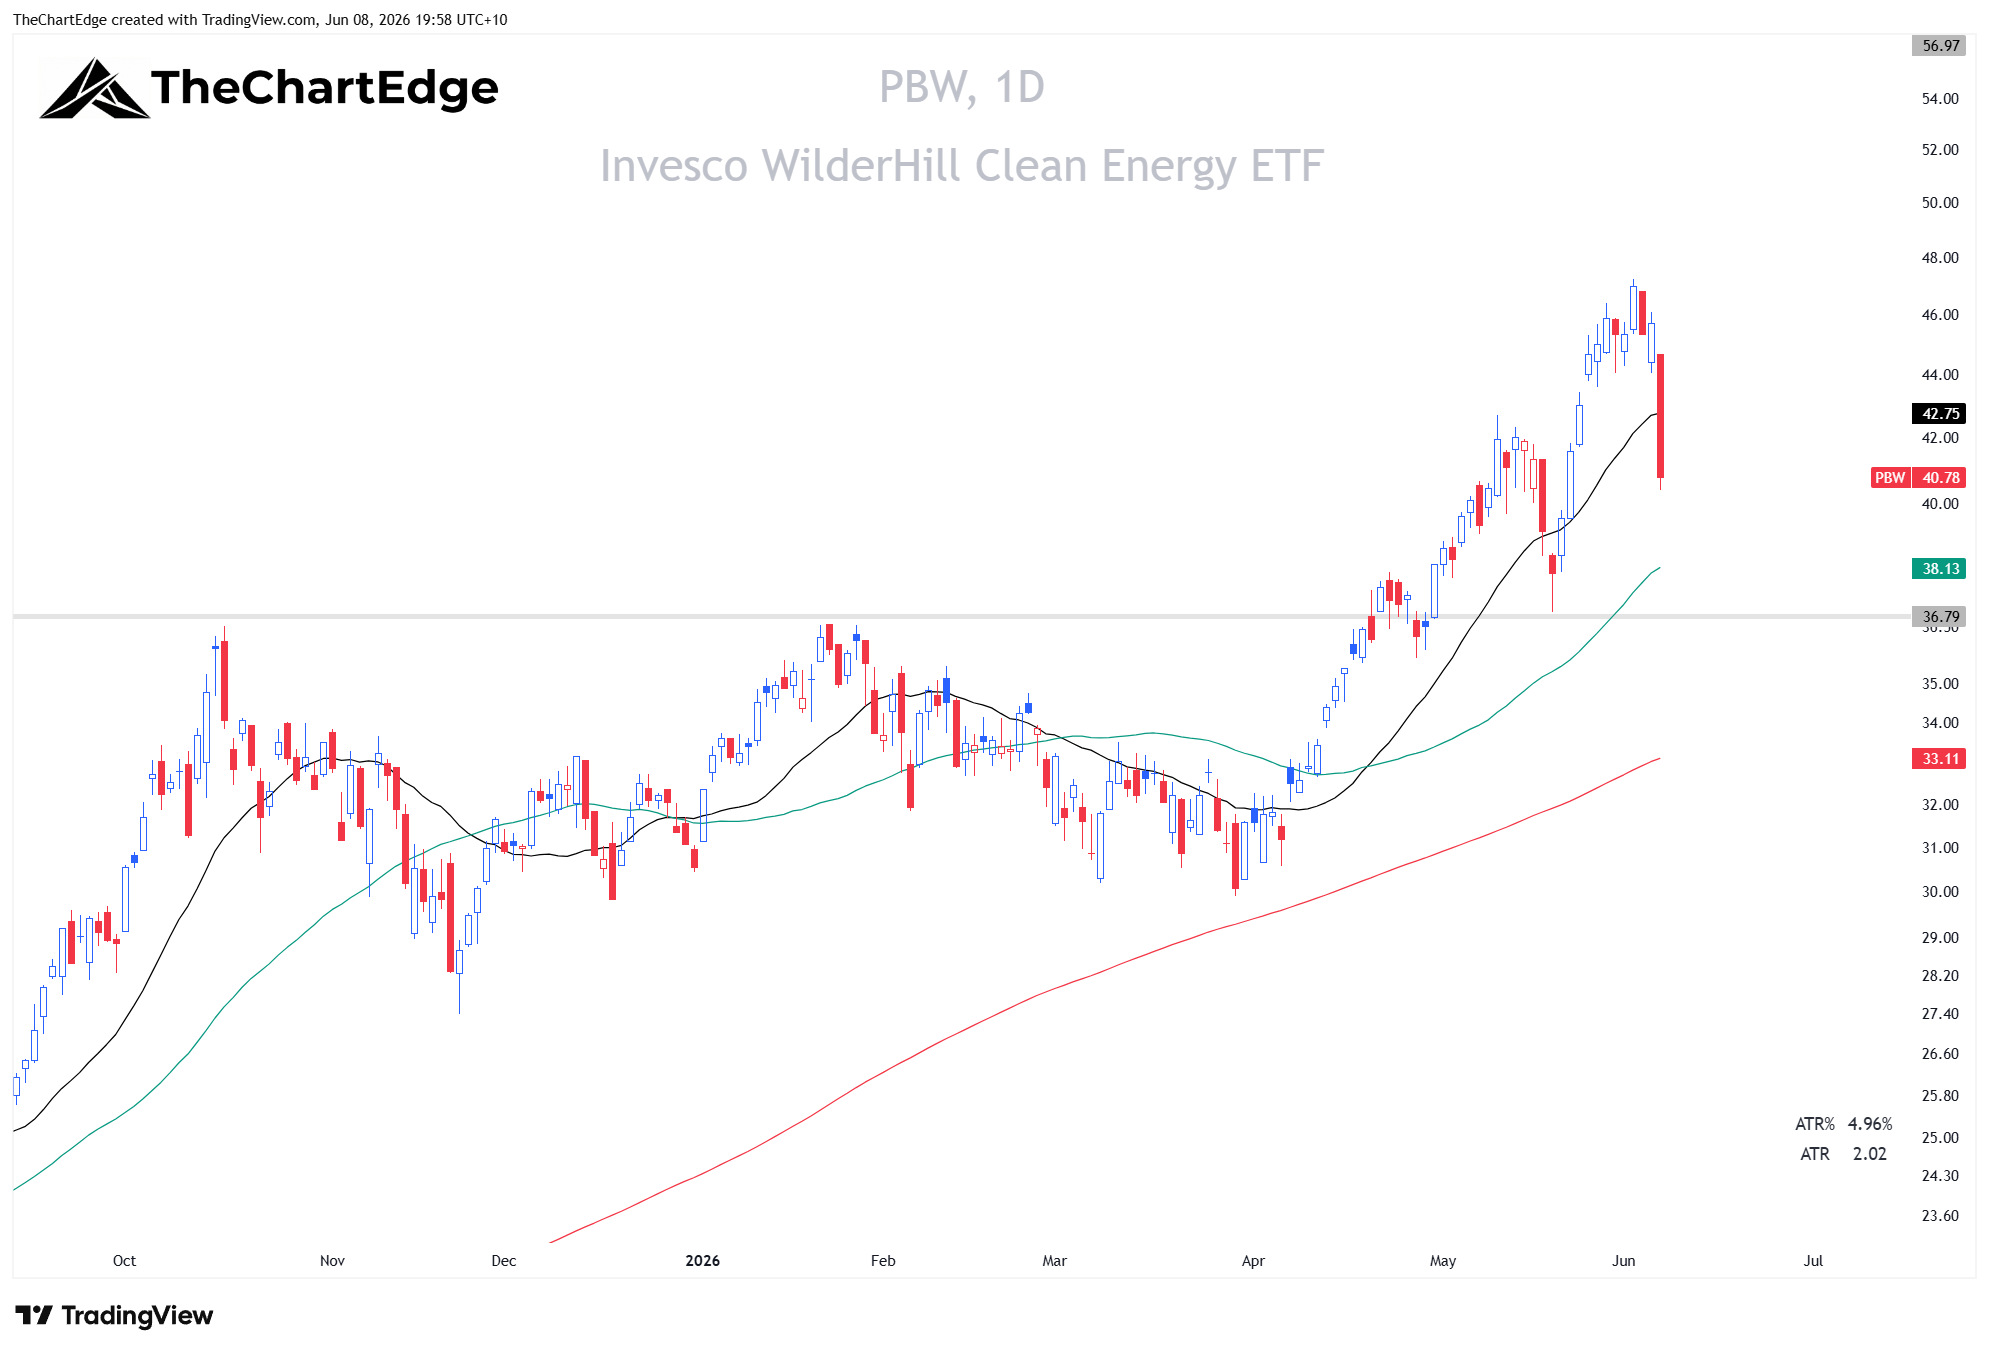
On the other side, the hardest hit were the names that had been leading. Solar (TAN) fell over 13%, clean energy (PBW) 10%, and the ARK funds (ARKK, ARKQ) around 9%. South Korea (EWY) fell nearly 15%. Semiconductors (SMH) was down 4.9% and equal-weight semis (XSD) 6.8%.
PBW Chart
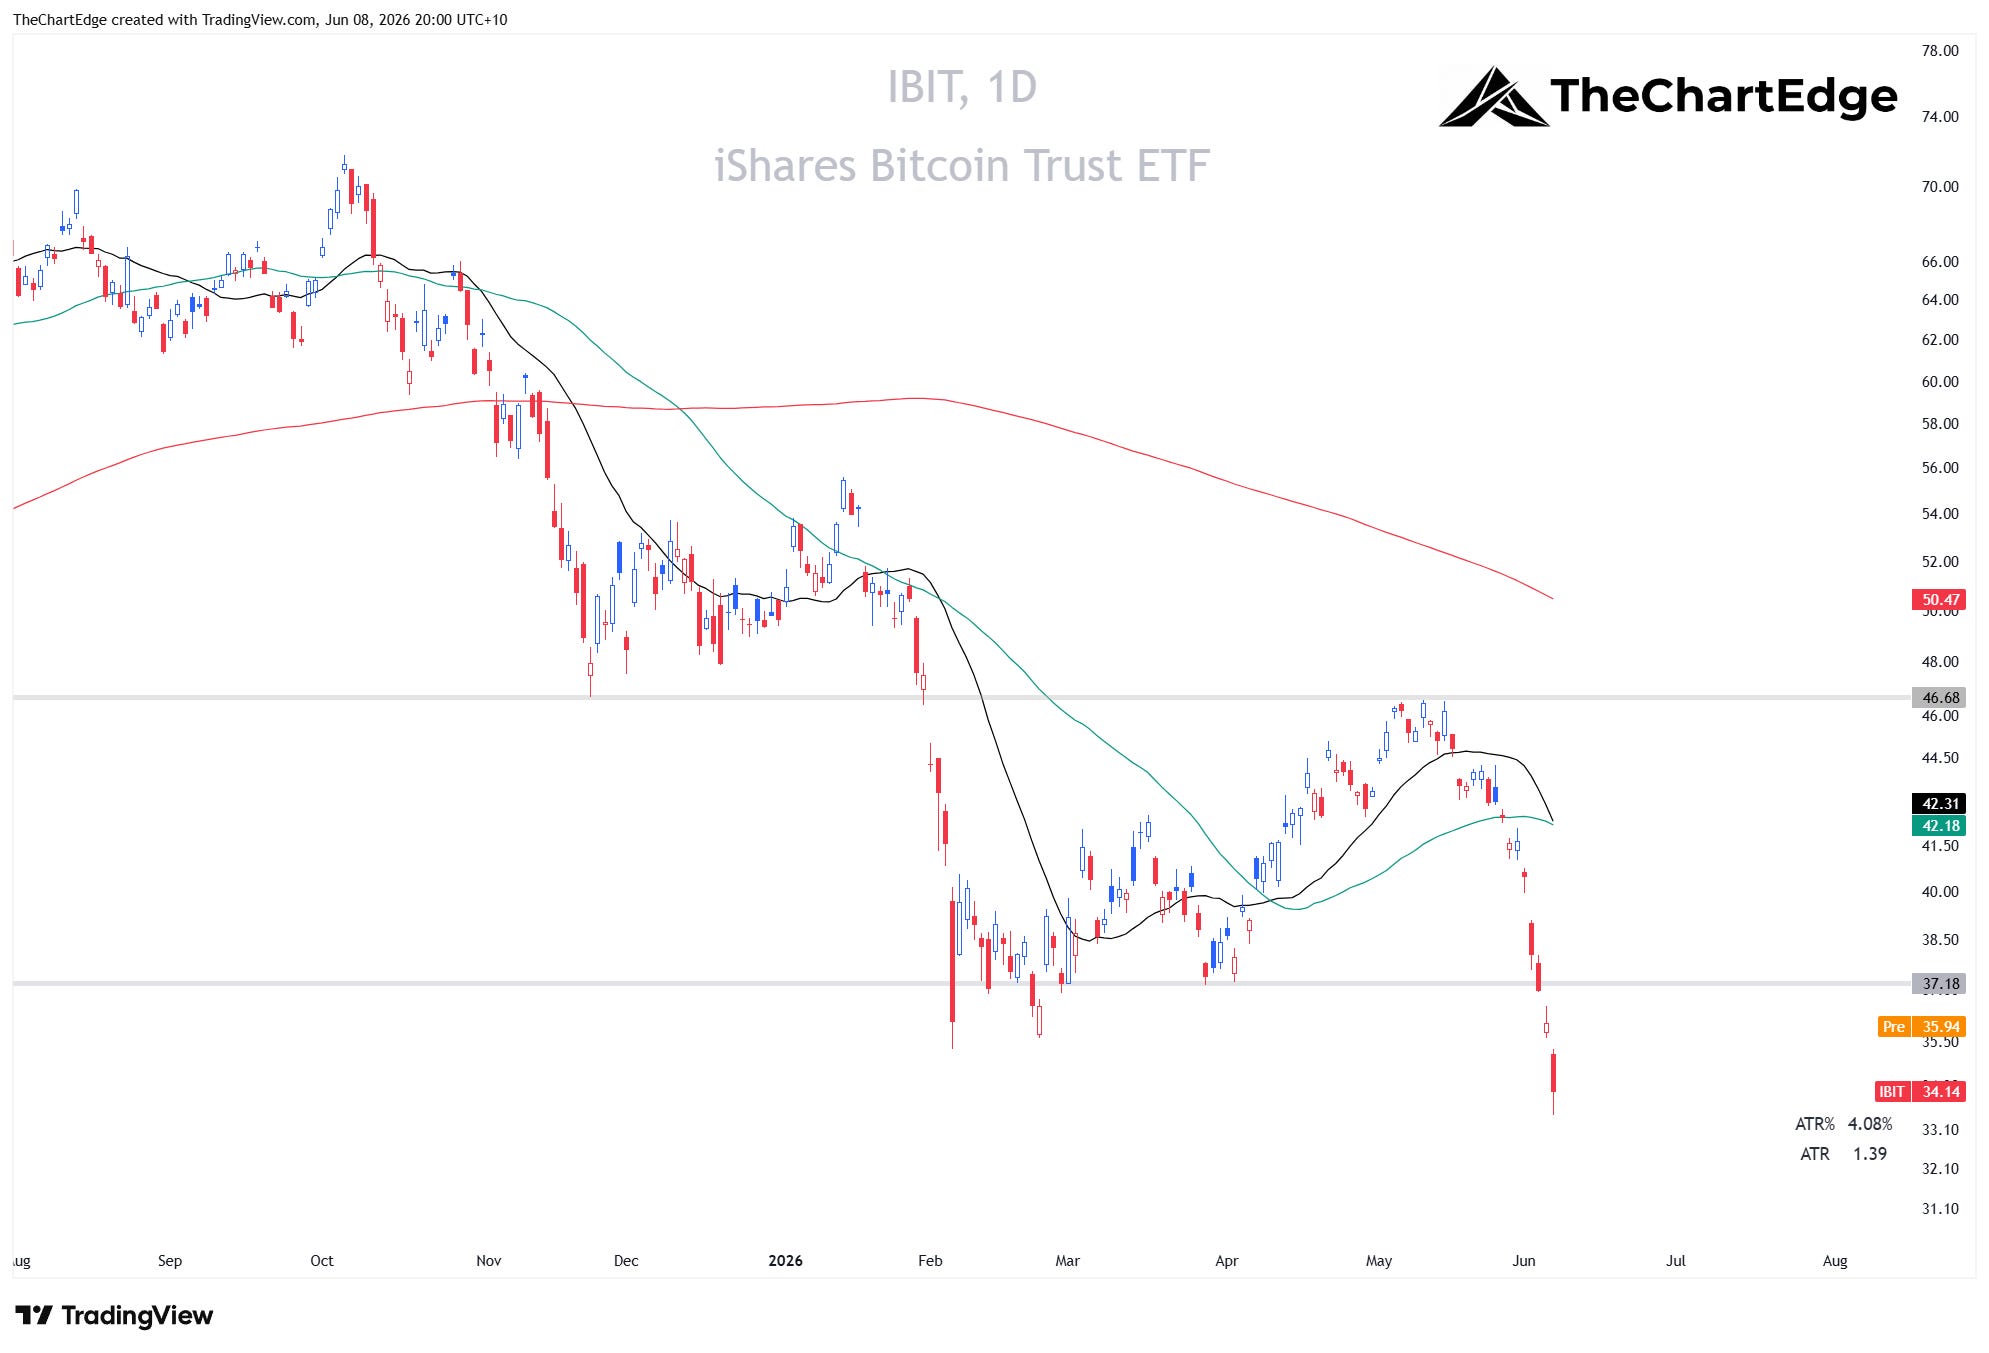
Crypto had some of the worst selling - Bitcoin (IBIT) down around 18%, Ethereum (ETHA) over 21%, the crypto miners (WGMI) nearly 10%.
IBIT Chart
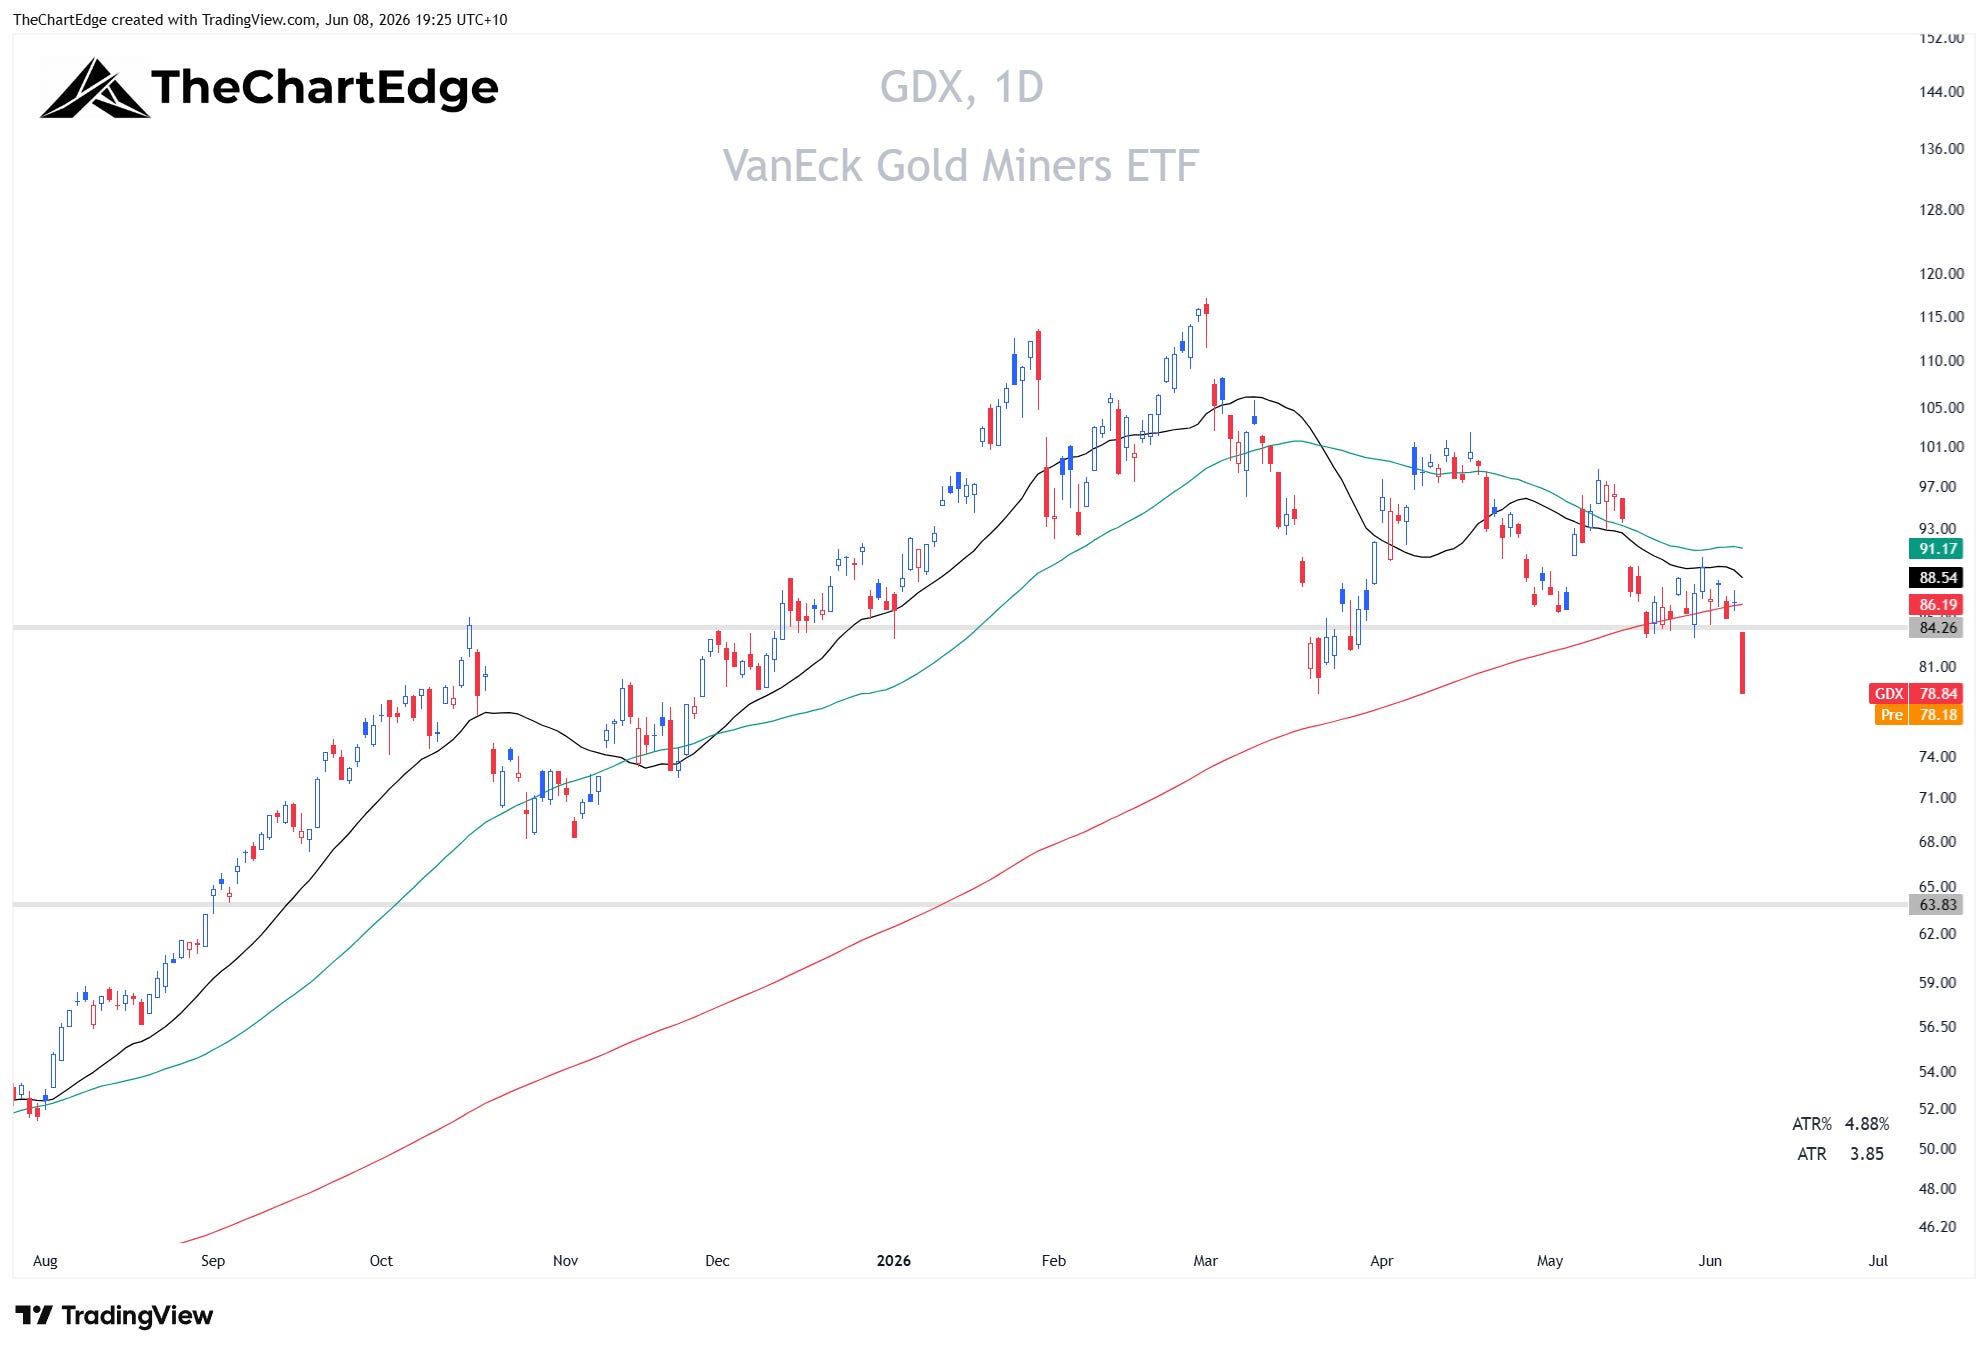
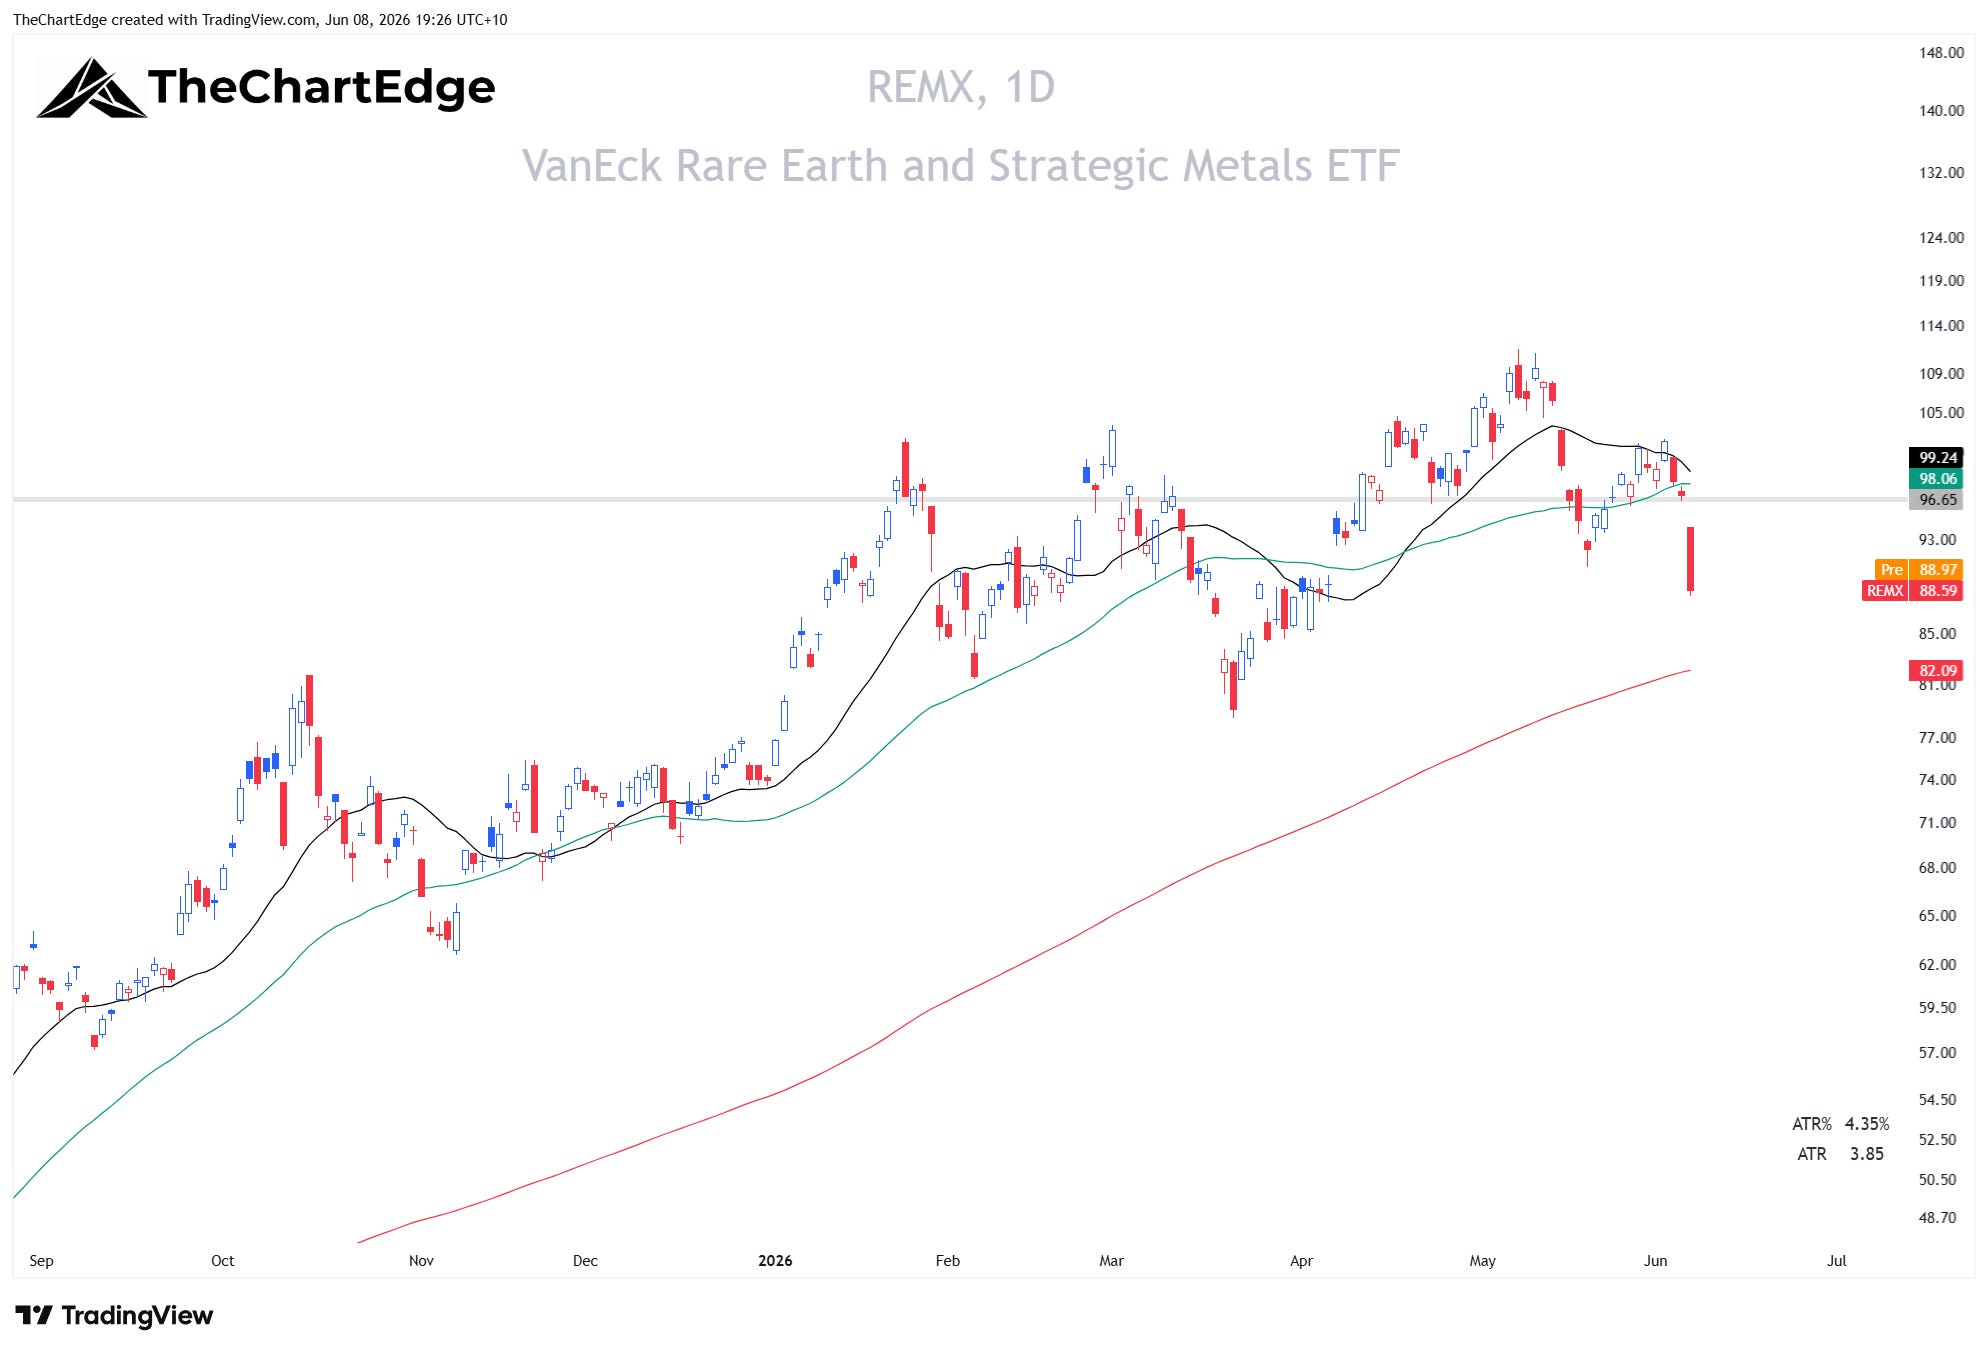
The metals all got hit, no split between the precious and strategic names - gold miners (GDX) off around 12%, silver miners (SIL) 15%, lithium (LIT) and rare earth (REMX) both down 10 to 11%.
GDX Chart
REMX Chart
Bonds Didn’t Catch a Bid
The whole Treasury curve was down on the week, from the short end (SHY) to the long end (TLT), along with investment grade (LQD) and high yield (HYG) credit. A few of these moved into the Improving quadrant, but only because they fell less than equities, not because they rose, and most are still in downtrends.
Where to From Here
I’m in no hurry to buy this pullback. The major indices are only 2 to 6% off their highs - SPY and QQQ fell from Strong Uptrend to Uptrend, so the longer-term uptrends are not broken - but Friday’s action deserves some caution.
A test of the 50-day SMAs is possible and wouldn’t be abnormal - which sit around 3.4% below current prices for the S&P 500 and 5.6% for the Nasdaq 100.
If we continue to correct, I will be watching for relative strength, particularly stocks and ETFs holding their 20-day SMA, and their 50-day if the correction becomes longer and deeper.
Stay open-minded and manage risk carefully.
Cheers,
Marcus Grant, CFTe
Disclaimer: The content provided in this newsletter is for informational and educational purposes only and should not be considered as financial, investment, or legal advice. The information shared is based on our research and analysis, but we are not a licensed financial advisor, nor can we guarantee its accuracy, completeness, or timeliness. Market conditions and financial instruments can change rapidly, and any opinions expressed may not be suitable for all investors. Any opinions expressed and or securities mentioned do not constitute a recommendation to buy, sell, or hold that or any other security. You should conduct your own due diligence and consult with a licensed financial advisor or other professional before making any investment decisions. Past performance is not indicative of future results, and all investments carry the risk of loss. The authors and publishers of this newsletter are not responsible for any financial decisions made based on the content provided herein. By reading and or subscribing to this newsletter, you acknowledge and agree that you are using the information at your own risk.