


Everything below is as of Friday September 11 close.
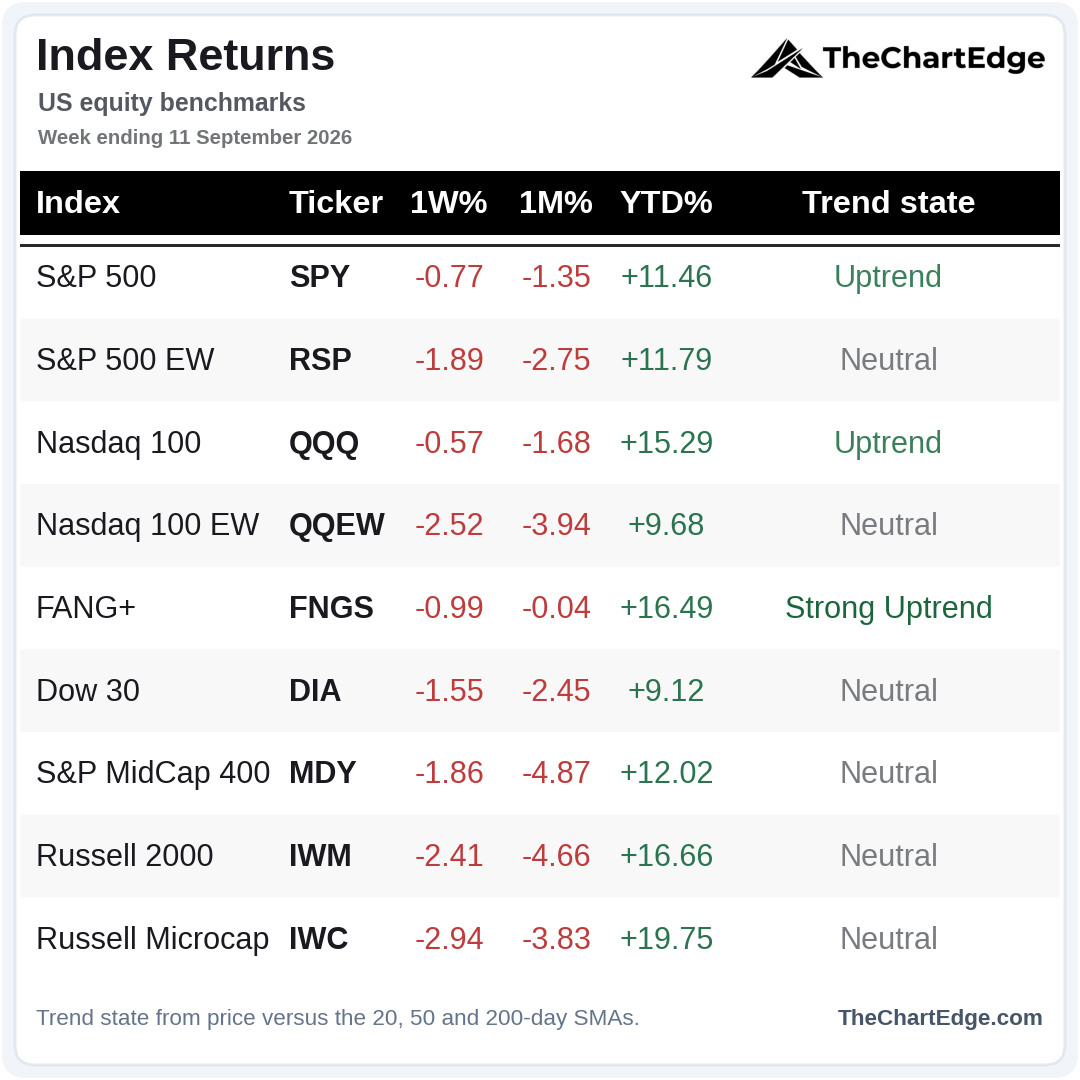
Of the major indices I track, all 9 finished the week lower. Only SPY, QQQ and FNGS remain above their 50-day SMAs. The other indices all look much worse, below their 50-day SMAs and in the Neutral trend state. The question now is whether SPY, QQQ and FNGS follow them lower.
SPY Chart
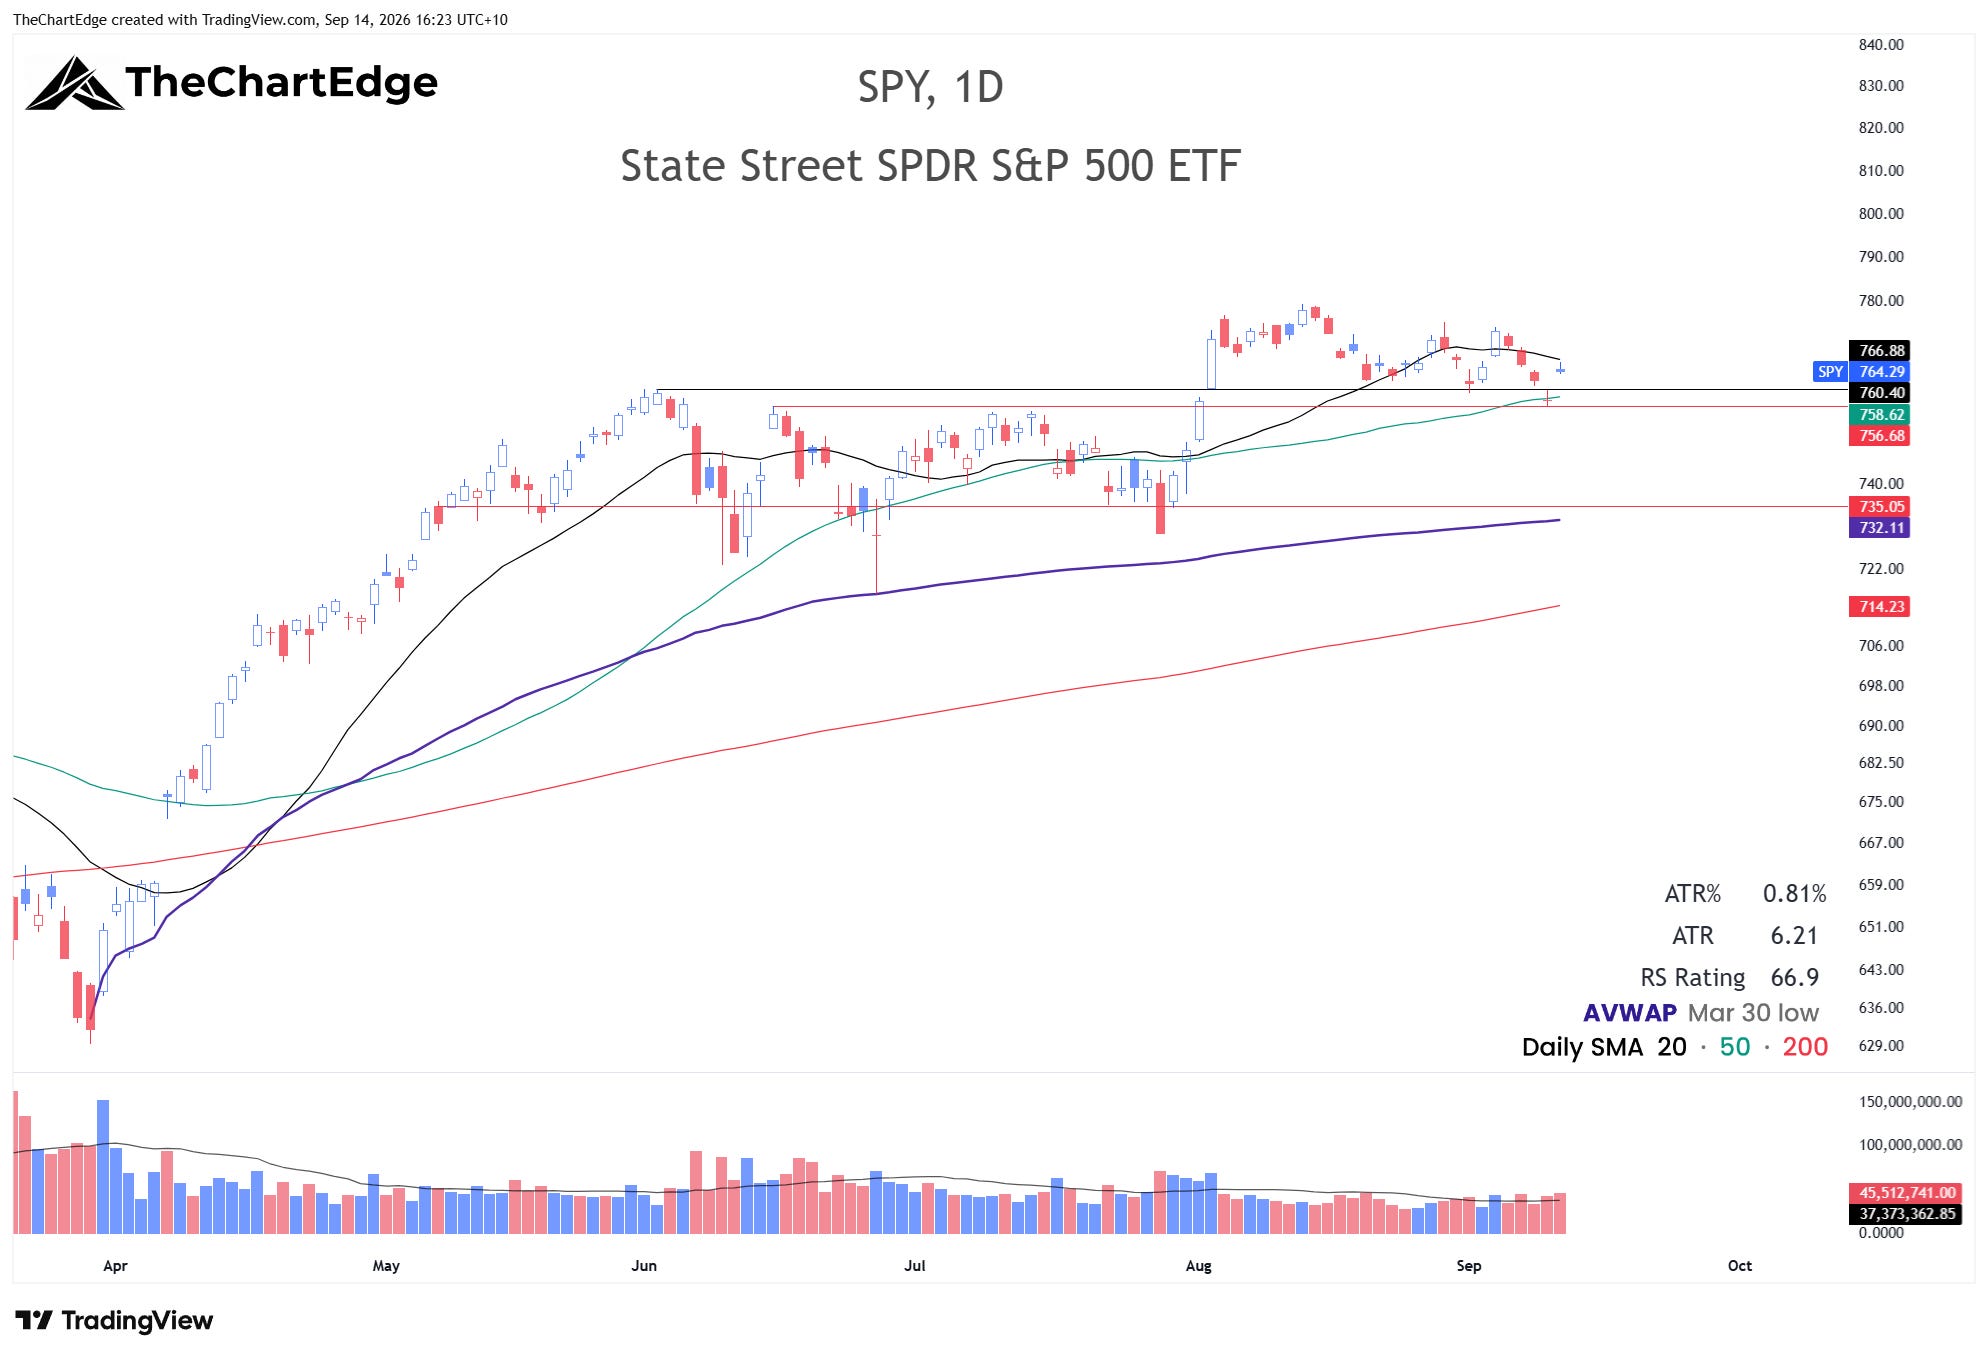
SPY closed at 764.29, slipping from a Strong Uptrend to an Uptrend. It’s only 1.9% below its all-time high, but for now looks choppy and rangebound. A close below Thursday’s low around 756.6 - which would also be below the 50-day - could open the way for a deeper pullback towards 735.
QQQ Chart
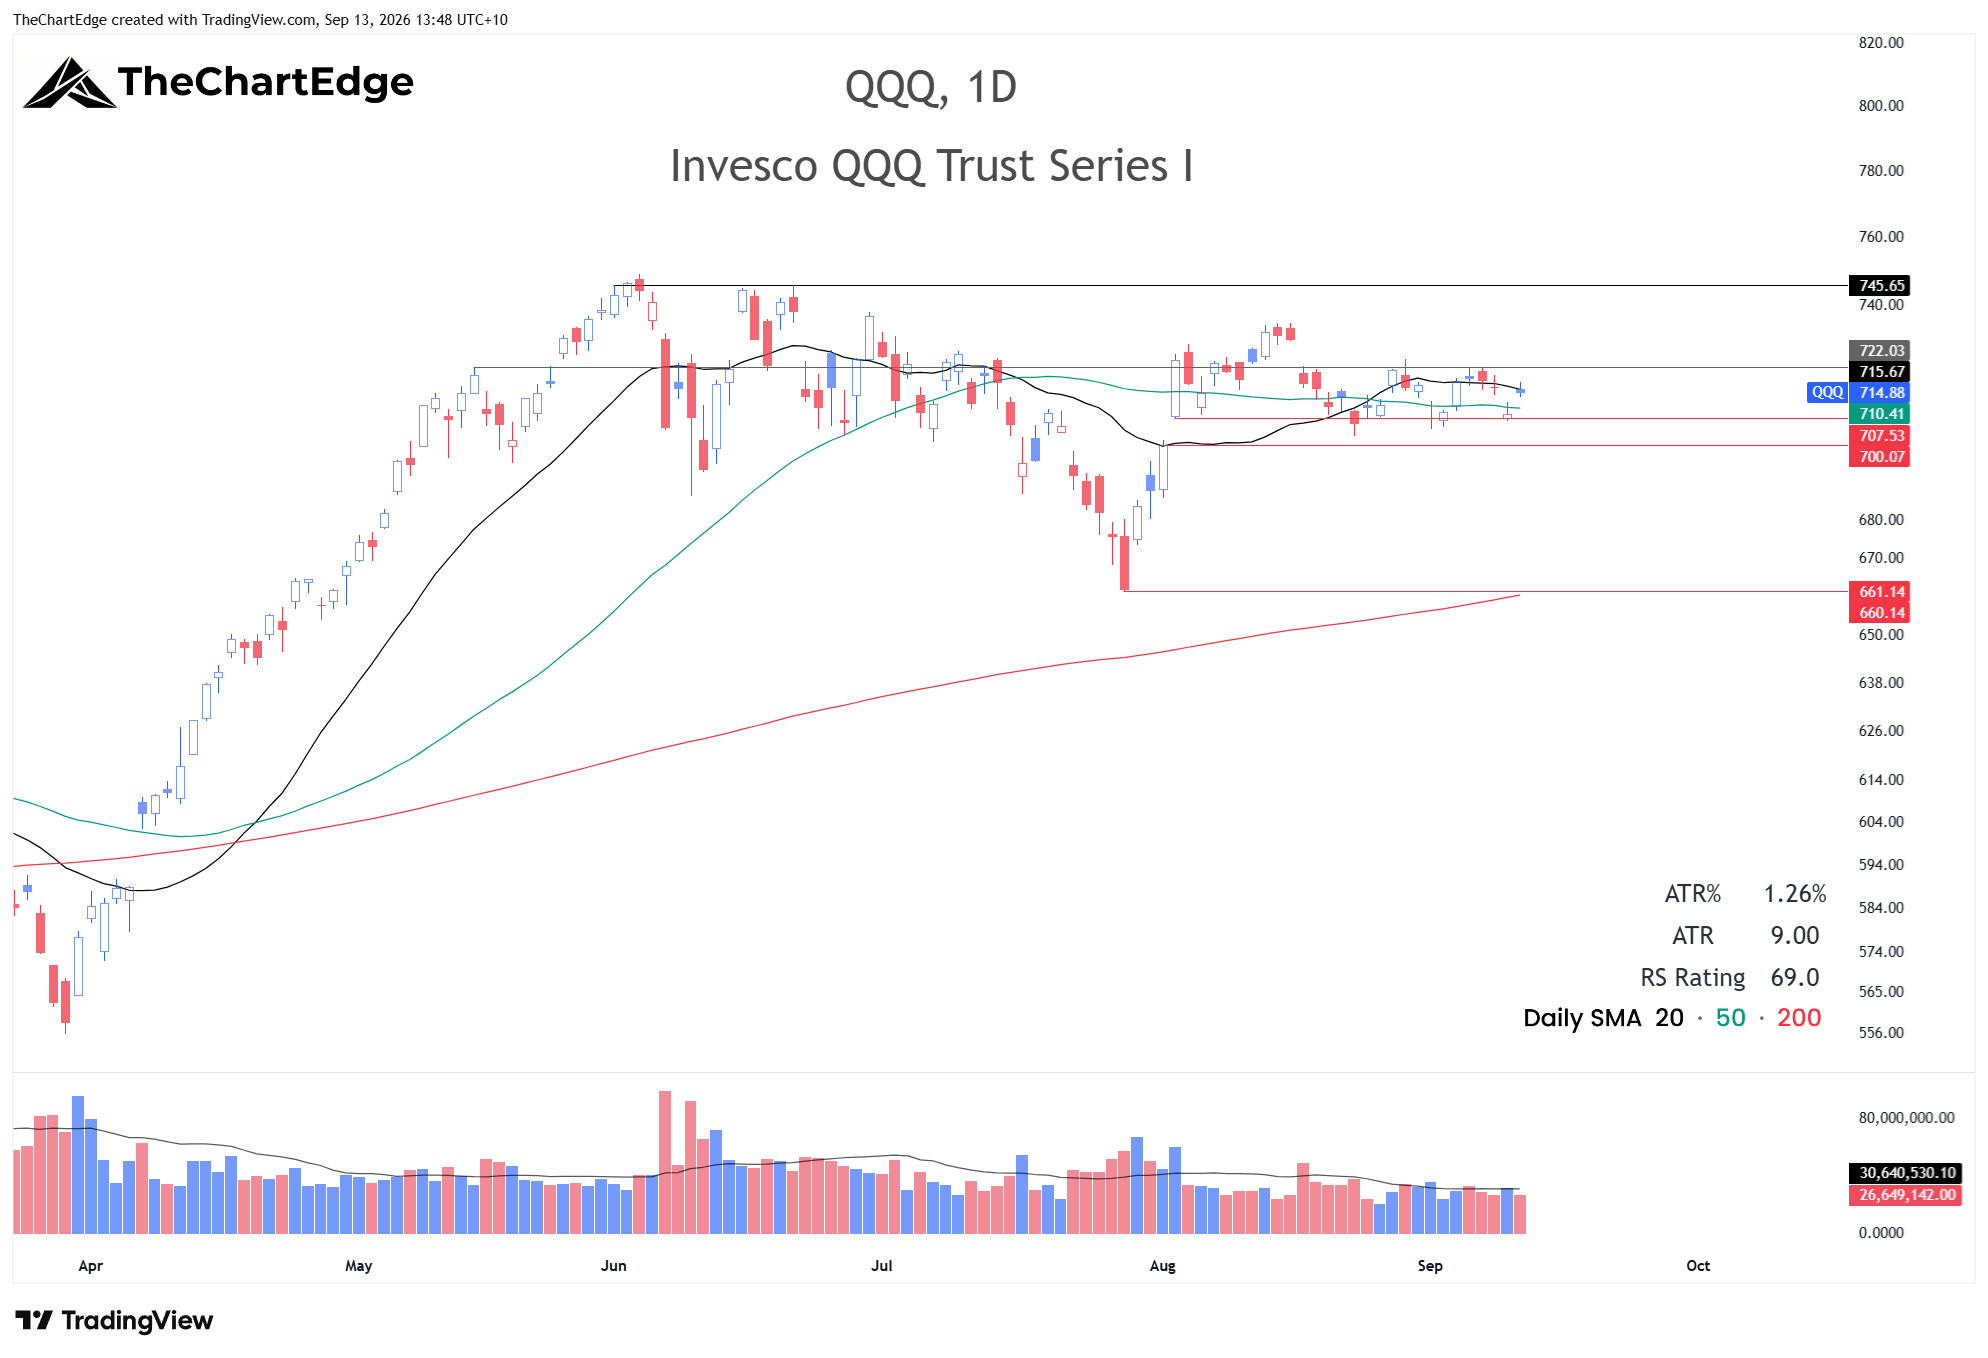
QQQ closed at 714.88, also back to an Uptrend after one week in a Strong Uptrend. Like SPY it has been stuck in a range - I’m watching 722 on the upside and 700 on the downside. Until we resolve one way or another, I intend to remain patient and sit on my hands.
Market Temperature
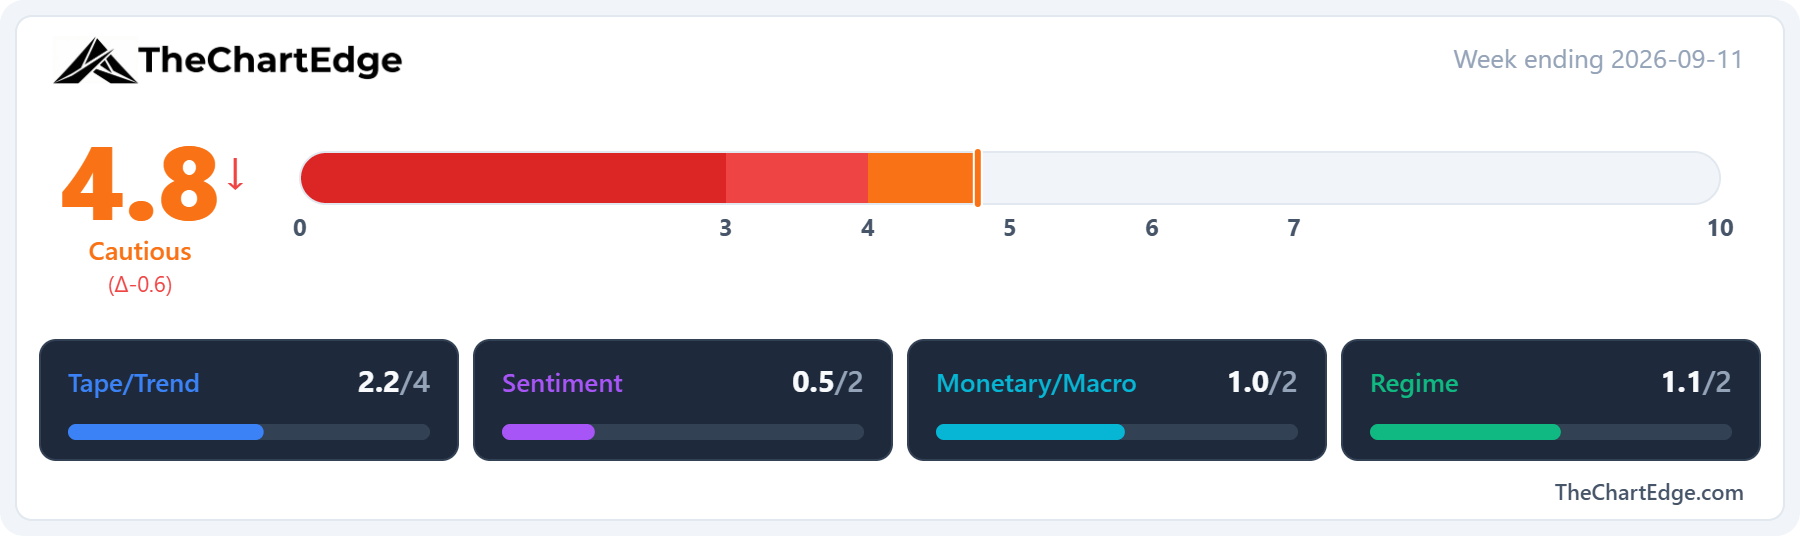
The Market Temperature came in at 4.8, down from 5.4 and is now in the Cautious Zone after a run of 5 straight weeks in Goldilocks.
The Tape/Trend pillar was responsible for all the fall, with SPY and QQQ both slipping out of the Strong Uptrend state and breadth deteriorating. Only 39.7% of US stocks finished above their 50-day moving average, from 50.3% last week and 50.7% two weeks ago. The 200-day measure fell to 51.7% from 57.7%.
The other three pillars had minimal moves, mostly cancelling each other out.
Sentiment added a little as the VIX rose to 15.8 from 14.5.
Monetary/Macro pillar fell slightly, due to the MOVE index climbing to 82 from 73, against a four-week comparison near 70.
The Regime pillar rose a touch. The XLY/XLP ratio was down week over week but scored higher due to a more favourable comparison as the strong early-August reading rolled off.
GICS Sector Relative Strength
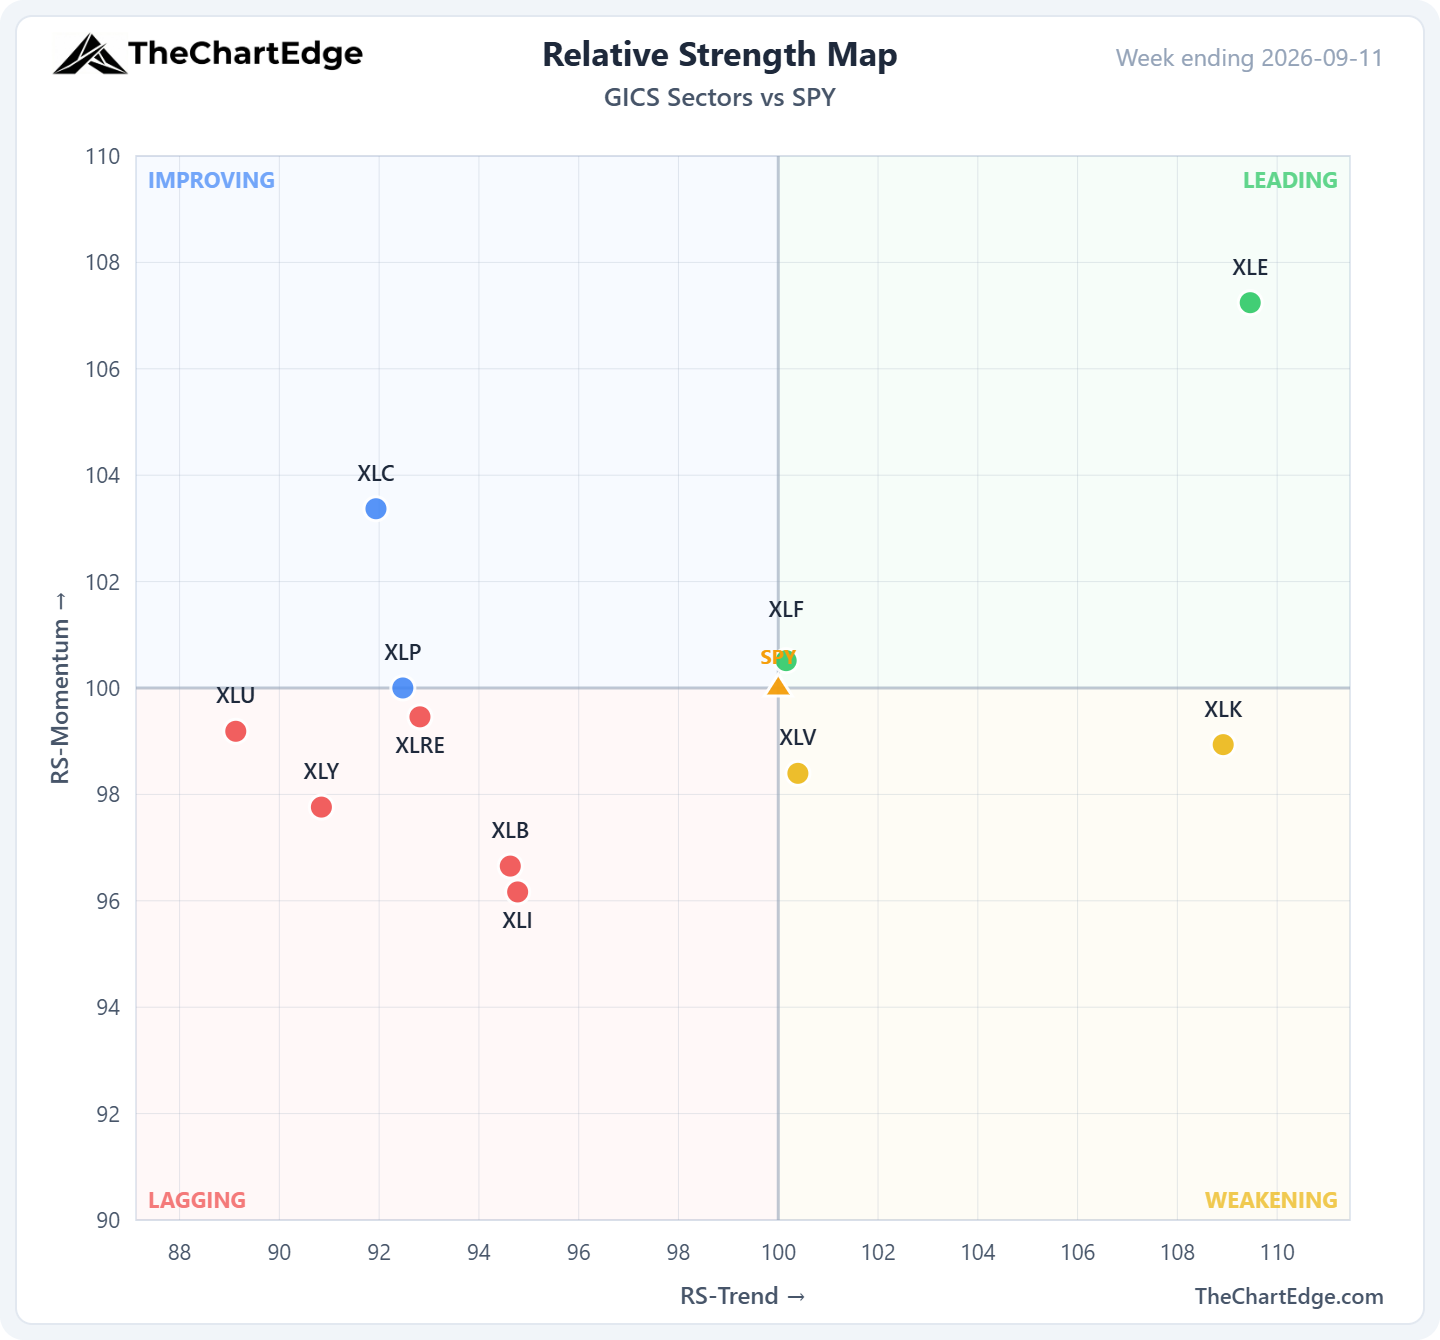
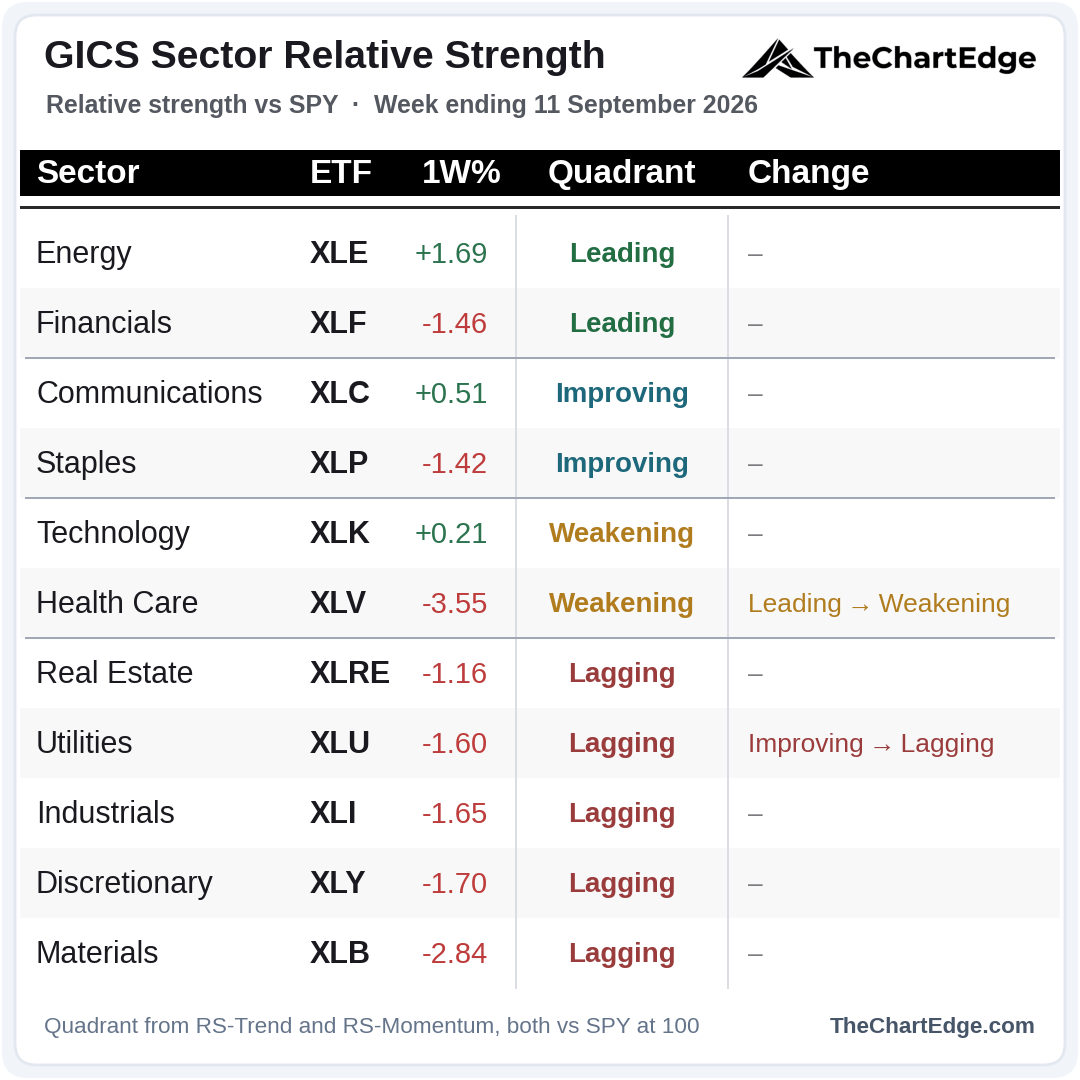
Health care’s return to Leading only lasted a week - it’s back in Weakening after posting the worst week of any sector, down over 3.5%.
Energy, communications and technology were the only sectors to finish higher. Energy and financials are the only two left in Leading, and financials are barely above 100 on both RS axes.
Momentum Leaderboard
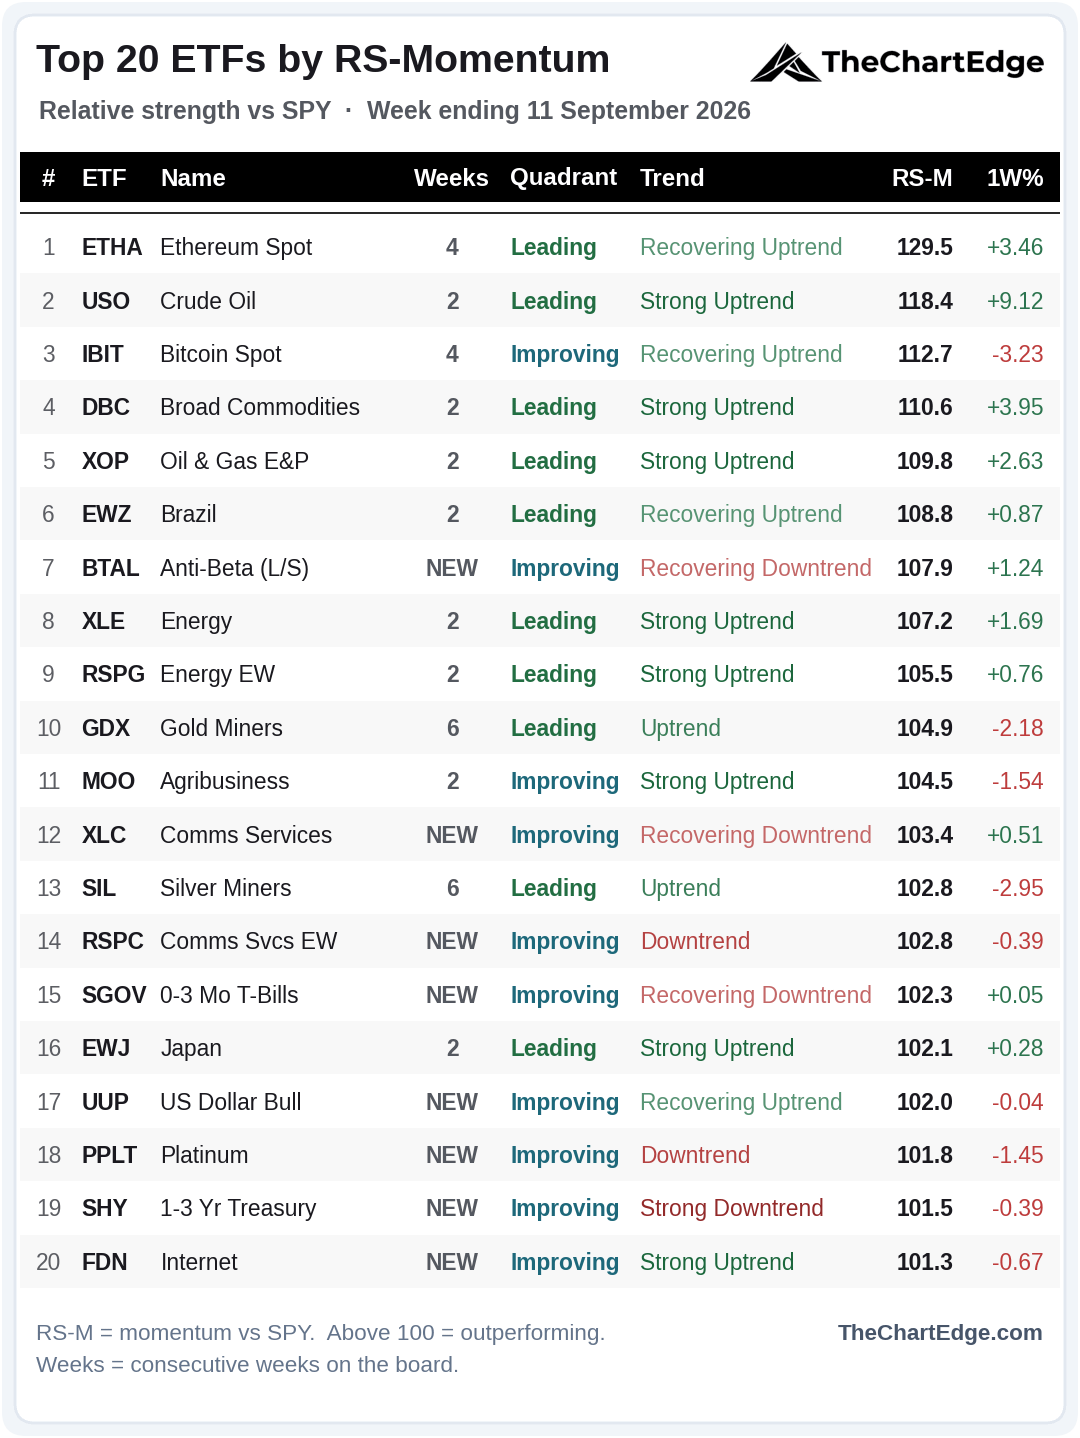
8 of the 20 are new this weekend. The health care and biotech names that rejoined the board last week - IBB, XBI, RSPH and XLV - are all gone, and Genomics (ARKG) dropped off with them, ending its 5-week streak.
The new arrivals signal risk-off with Anti-Beta (BTAL), the US dollar (UUP), 0-3 month T-bills (SGOV) and 1-3 year Treasuries (SHY) all joining the board. SGOV and UUP were basically flat on the week and SHY fell slightly - it wasn’t their strength causing them to climb onto the board, rather weakness in almost everything else.
Ethereum (ETHA) holds the top spot for a second week, while Gold Miners (GDX) and Silver Miners (SIL) now share the longest streak at 6 weeks.
Only 8 of the 20 are in Strong Uptrends, from 14 last weekend.
Trend States Across the Universe
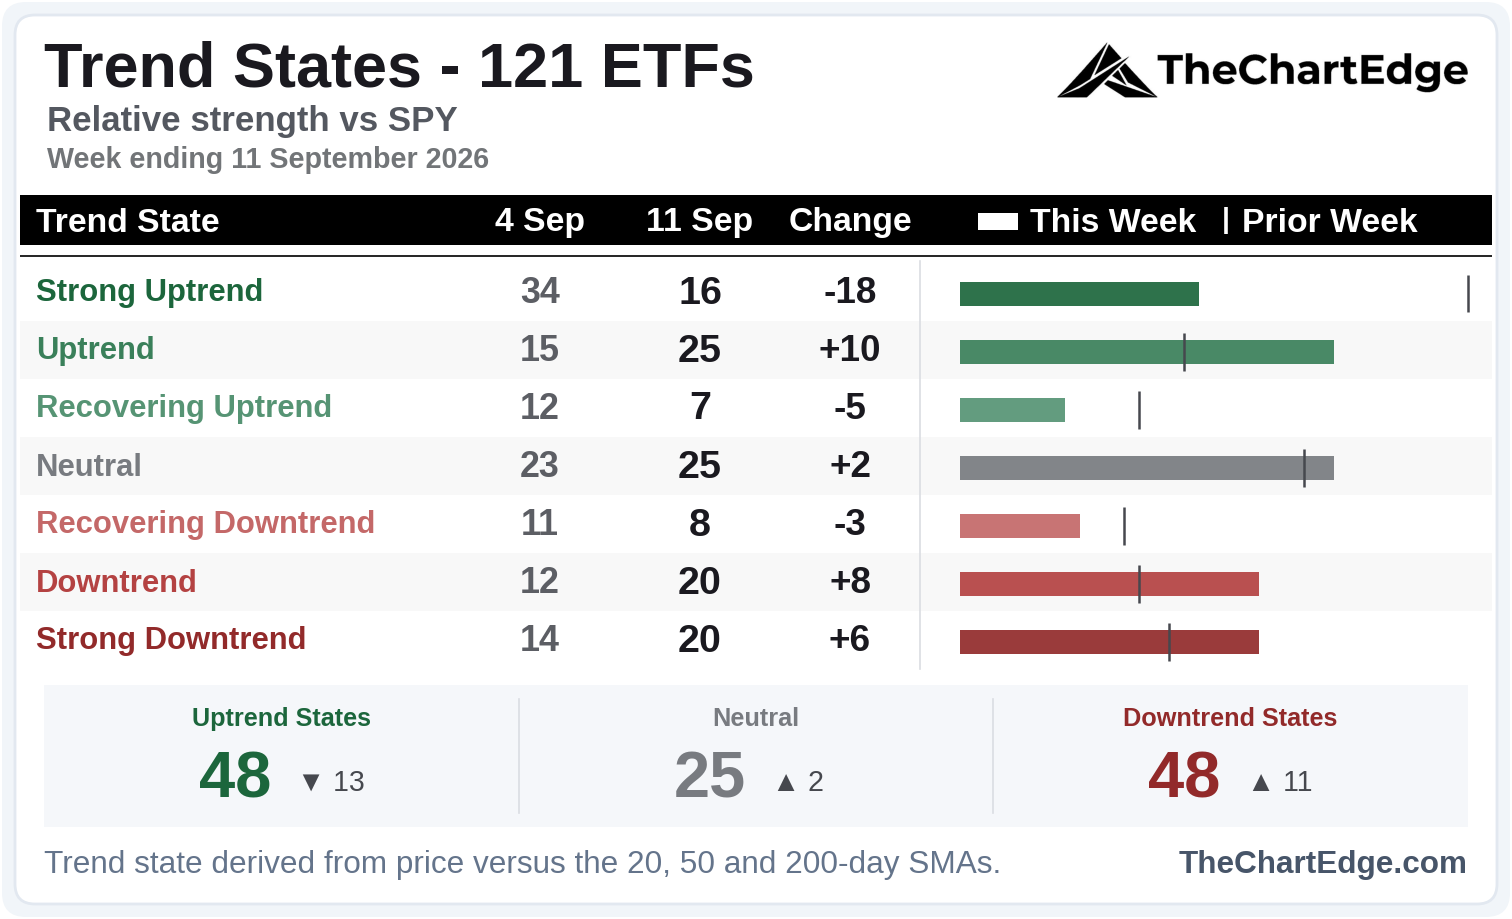
Strong Uptrends halved from 34 to 16 - SPY, QQQ, financials (XLF and RSPF), software (XSW) and the whole biotech complex all slipped a state.
Downtrend states now match uptrend states at 48 apiece.
Equal-weight technology (RSPT) was the only ETF to move up into a Strong Uptrend.
Industry Breadth - Leading Stocks
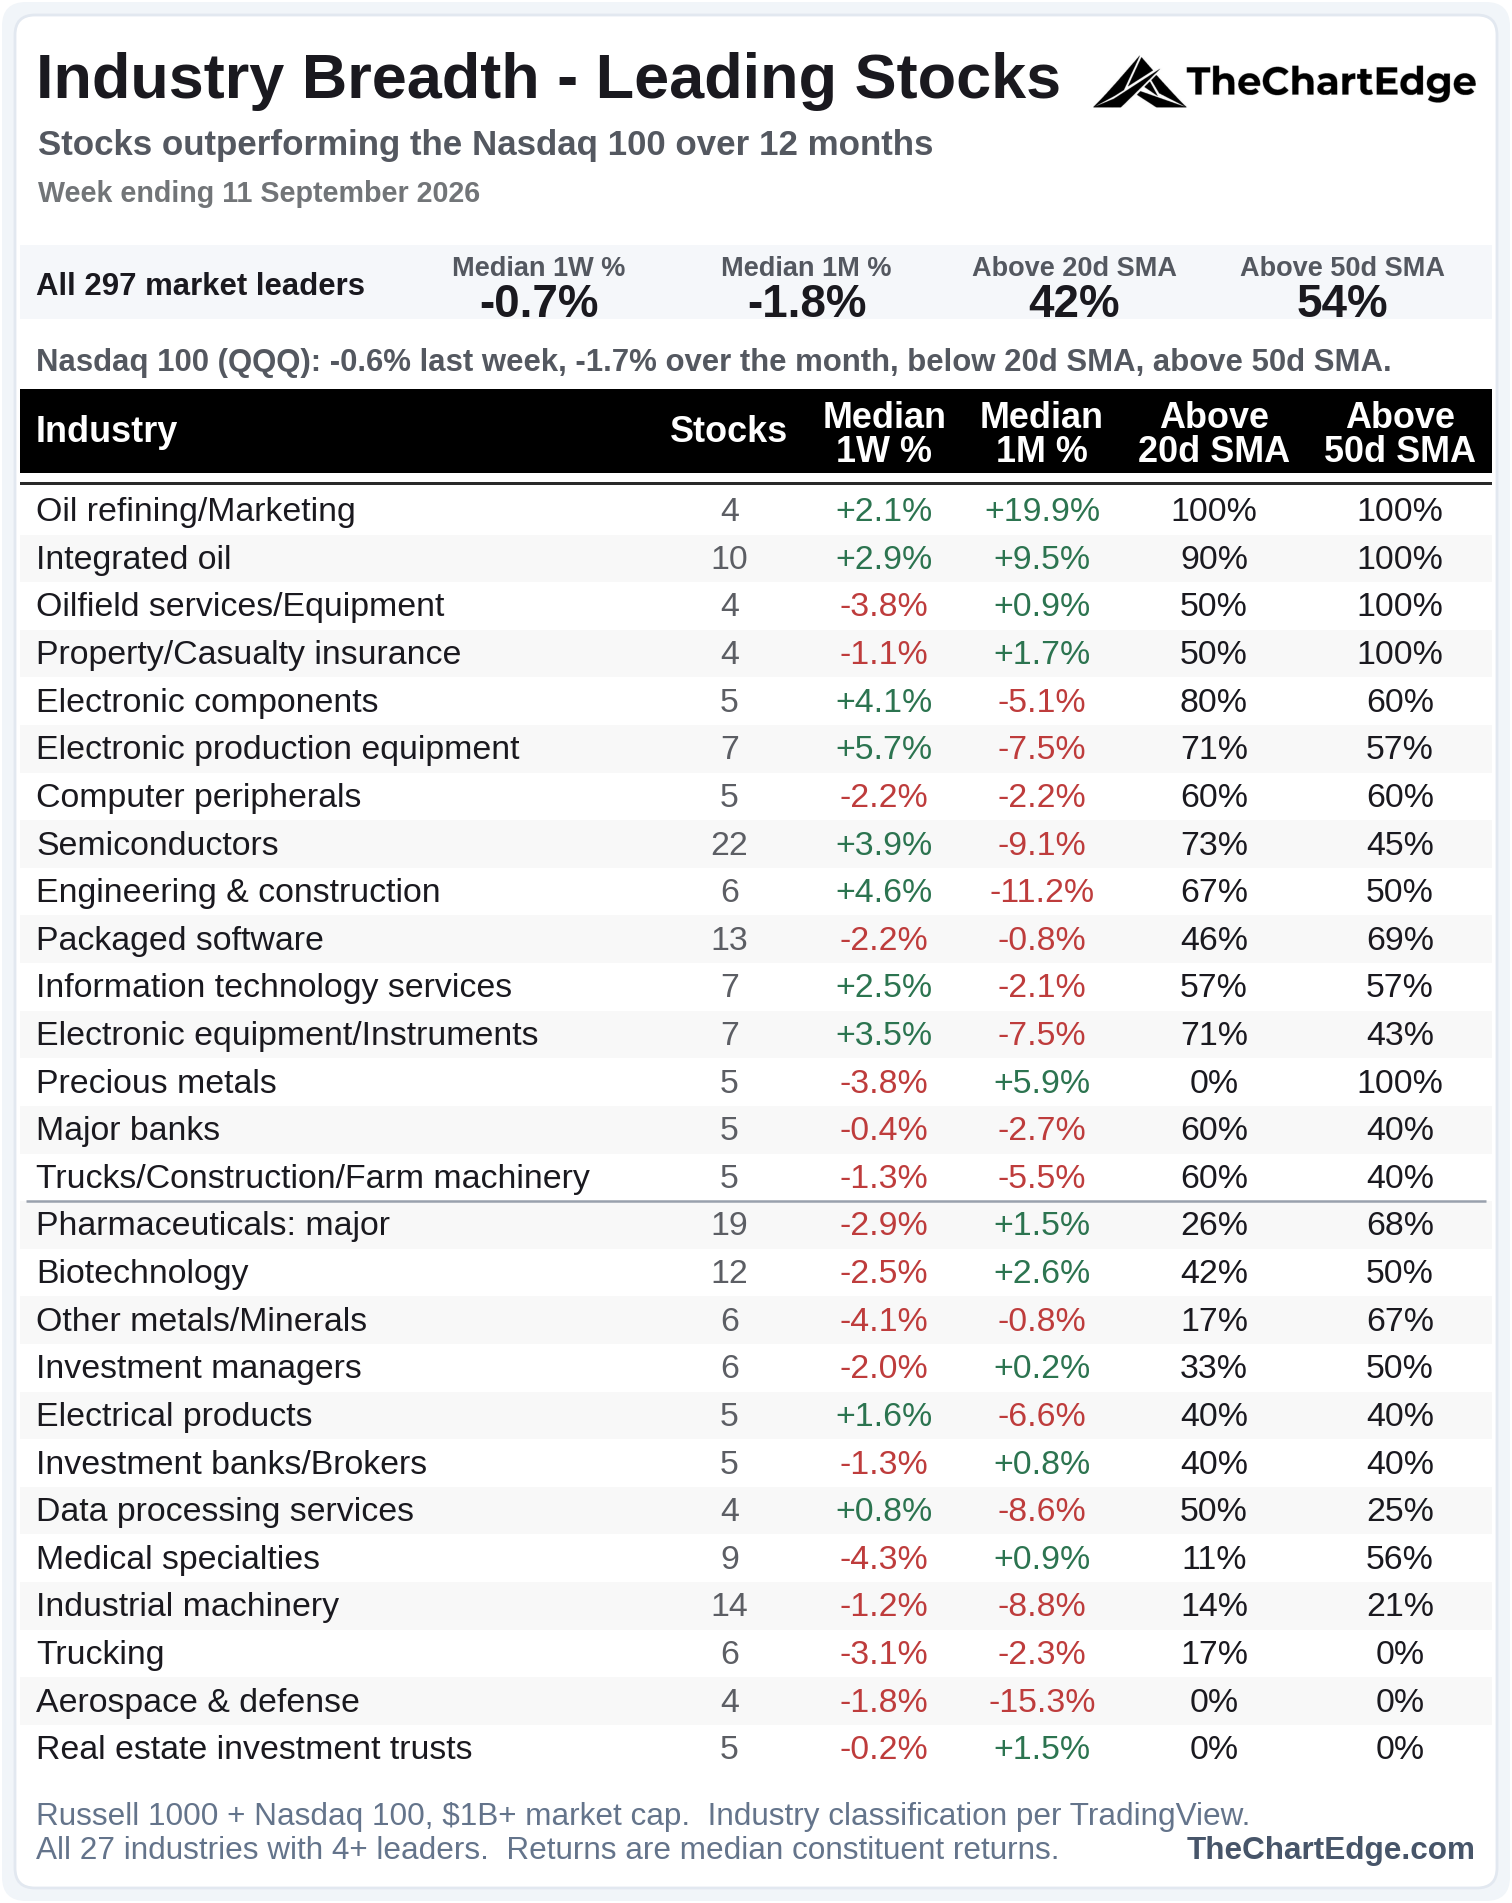
On aggregate 42% of leaders are above their 20-day SMA, from 48% last weekend - but underneath, the membership of the top and bottom flipped.
Semiconductors jumped from 20th to 8th, with 73% of its 22 names above the 20-day SMA, from 27% last weekend. Electronic components, electronic production equipment, electronic equipment and IT services all crossed above the 50% line - the entire hardware complex moved up the board in one week. Names above both their 20 and 50-day SMAs, and in the Strong Uptrend state, include Micron (MU), Marvell (MRVL), Qorvo (QRVO), Semtech (SMTC), Amphenol (APH), Teradyne (TER), Keysight (KEYS), Arista (ANET), NetApp (NTAP) and HP (HPQ). The flip on this board is only one week so far, but I am watching for a possible rotation back into semis, AI names and hardware as I mentioned last week.
Pharmaceuticals, biotechnology and medical specialties all crossed below the line. Precious metals went from all 5 names above the 20-day to none, though all 5 are still above the 50-day.
Semis & AI Relative Strength
Interestingly, only 19 of the 121 ETFs I track posted a positive return last week - and 7 of those were tech and AI related: equal-weight semiconductors (XSD), digital infrastructure (IDGT), smart grid infrastructure (GRID), equal-weight technology (RSPT), data centre infrastructure (DTCR), semiconductors (SMH) and technology (XLK).
SMH Chart
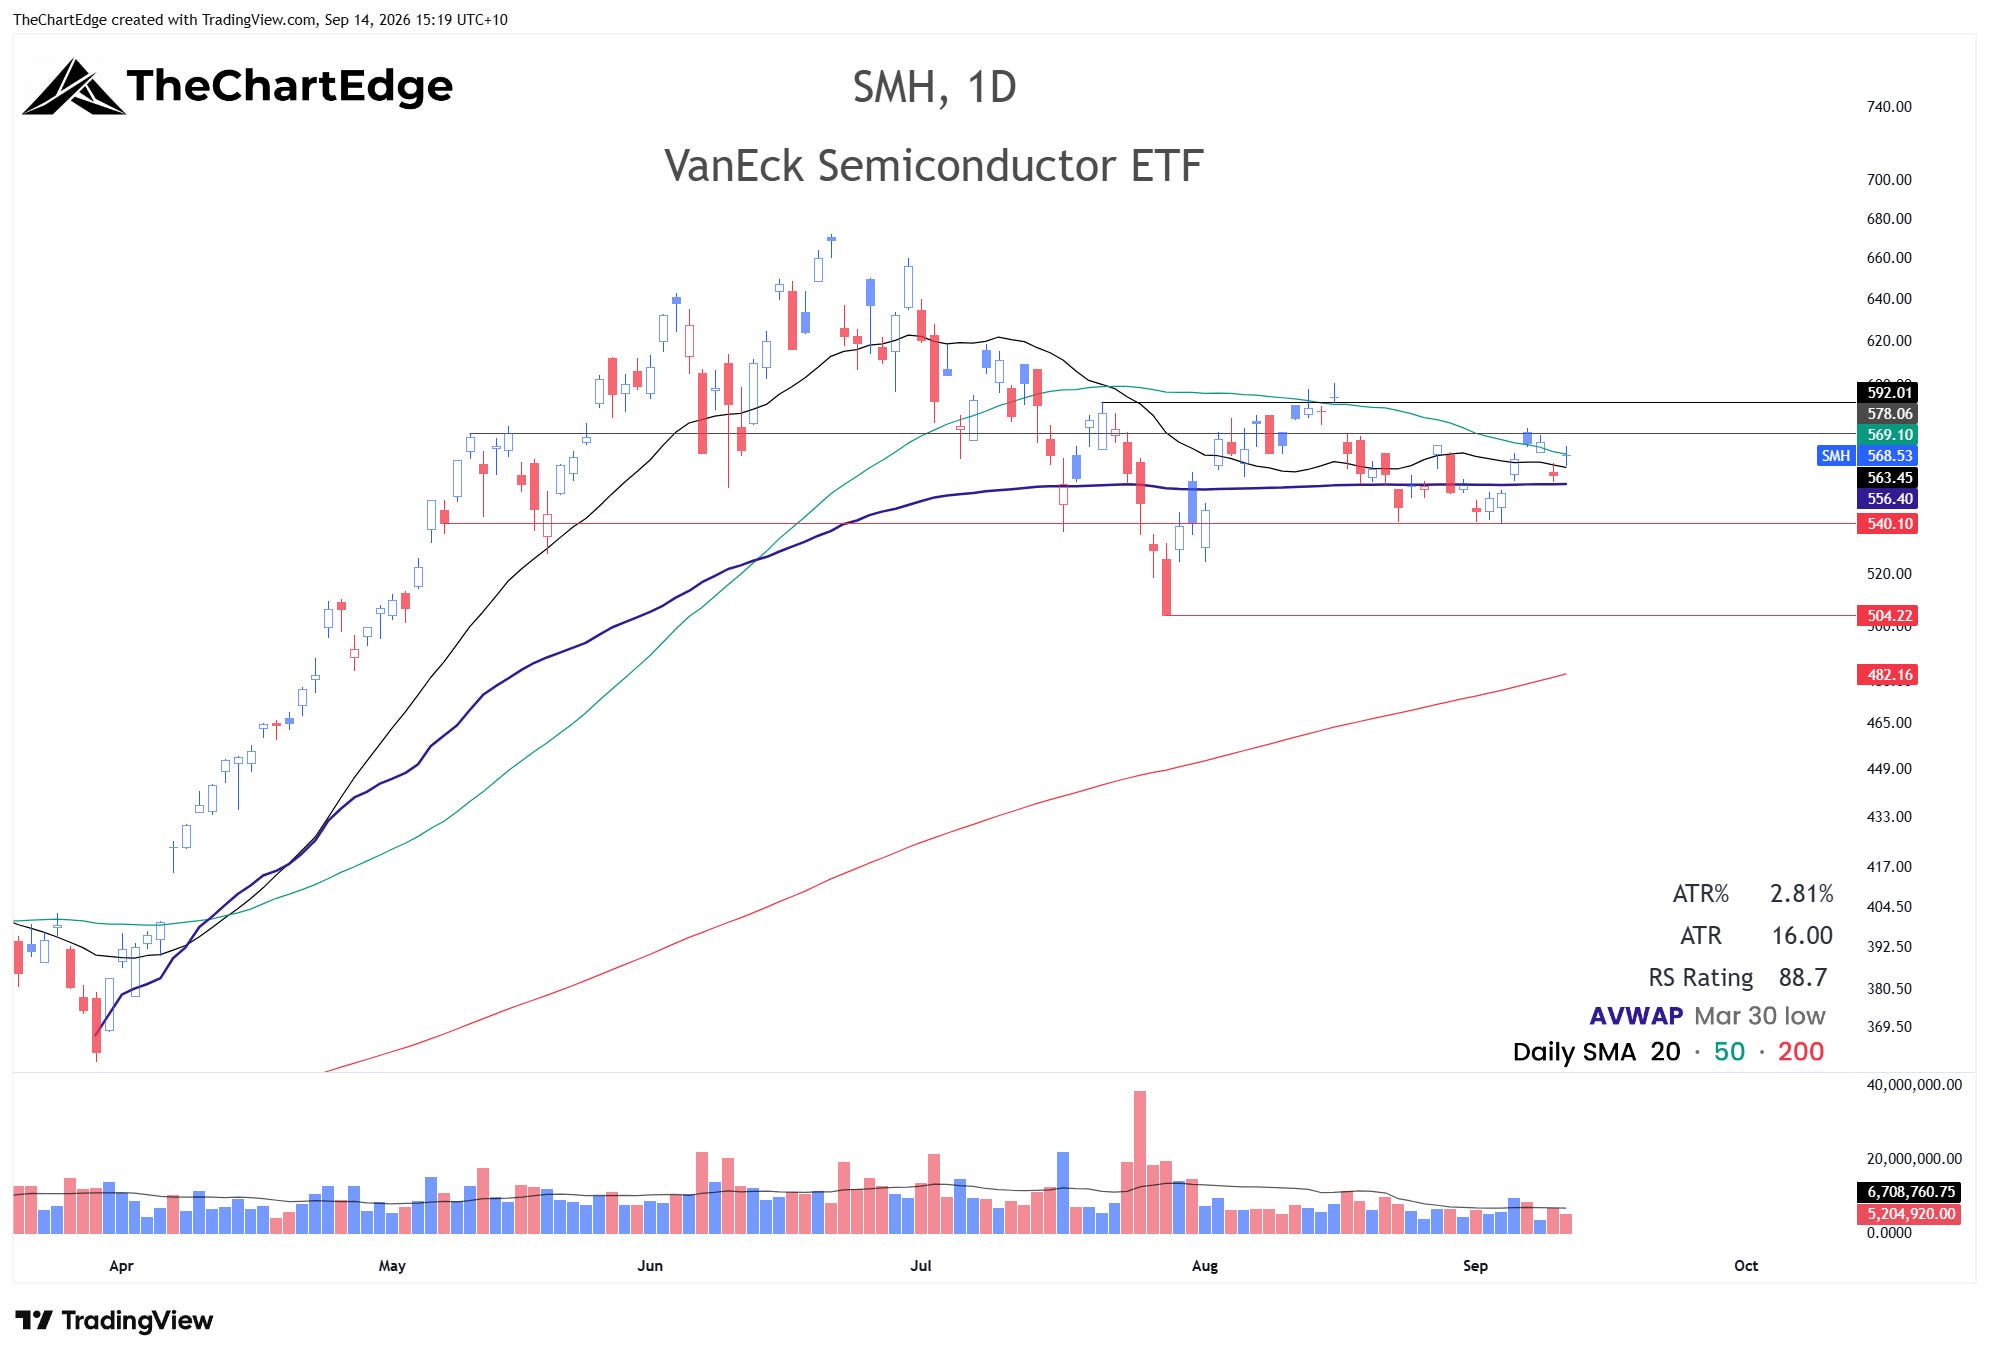
SMH held up in a down week, closing at 568.53. Still in a range for now, but I’m watching 578 in the short-term and then 592 on the upside, and 540 on the downside.
Trades & Follow-Ups
All 4 of the positions I carried into the week - XPH, XSW, LIT and ATI - hit my stop-losses at the levels I originally set.
My resting buy orders for FCLD and GDX triggered last week.
Cloud Computing (FCLD) Chart
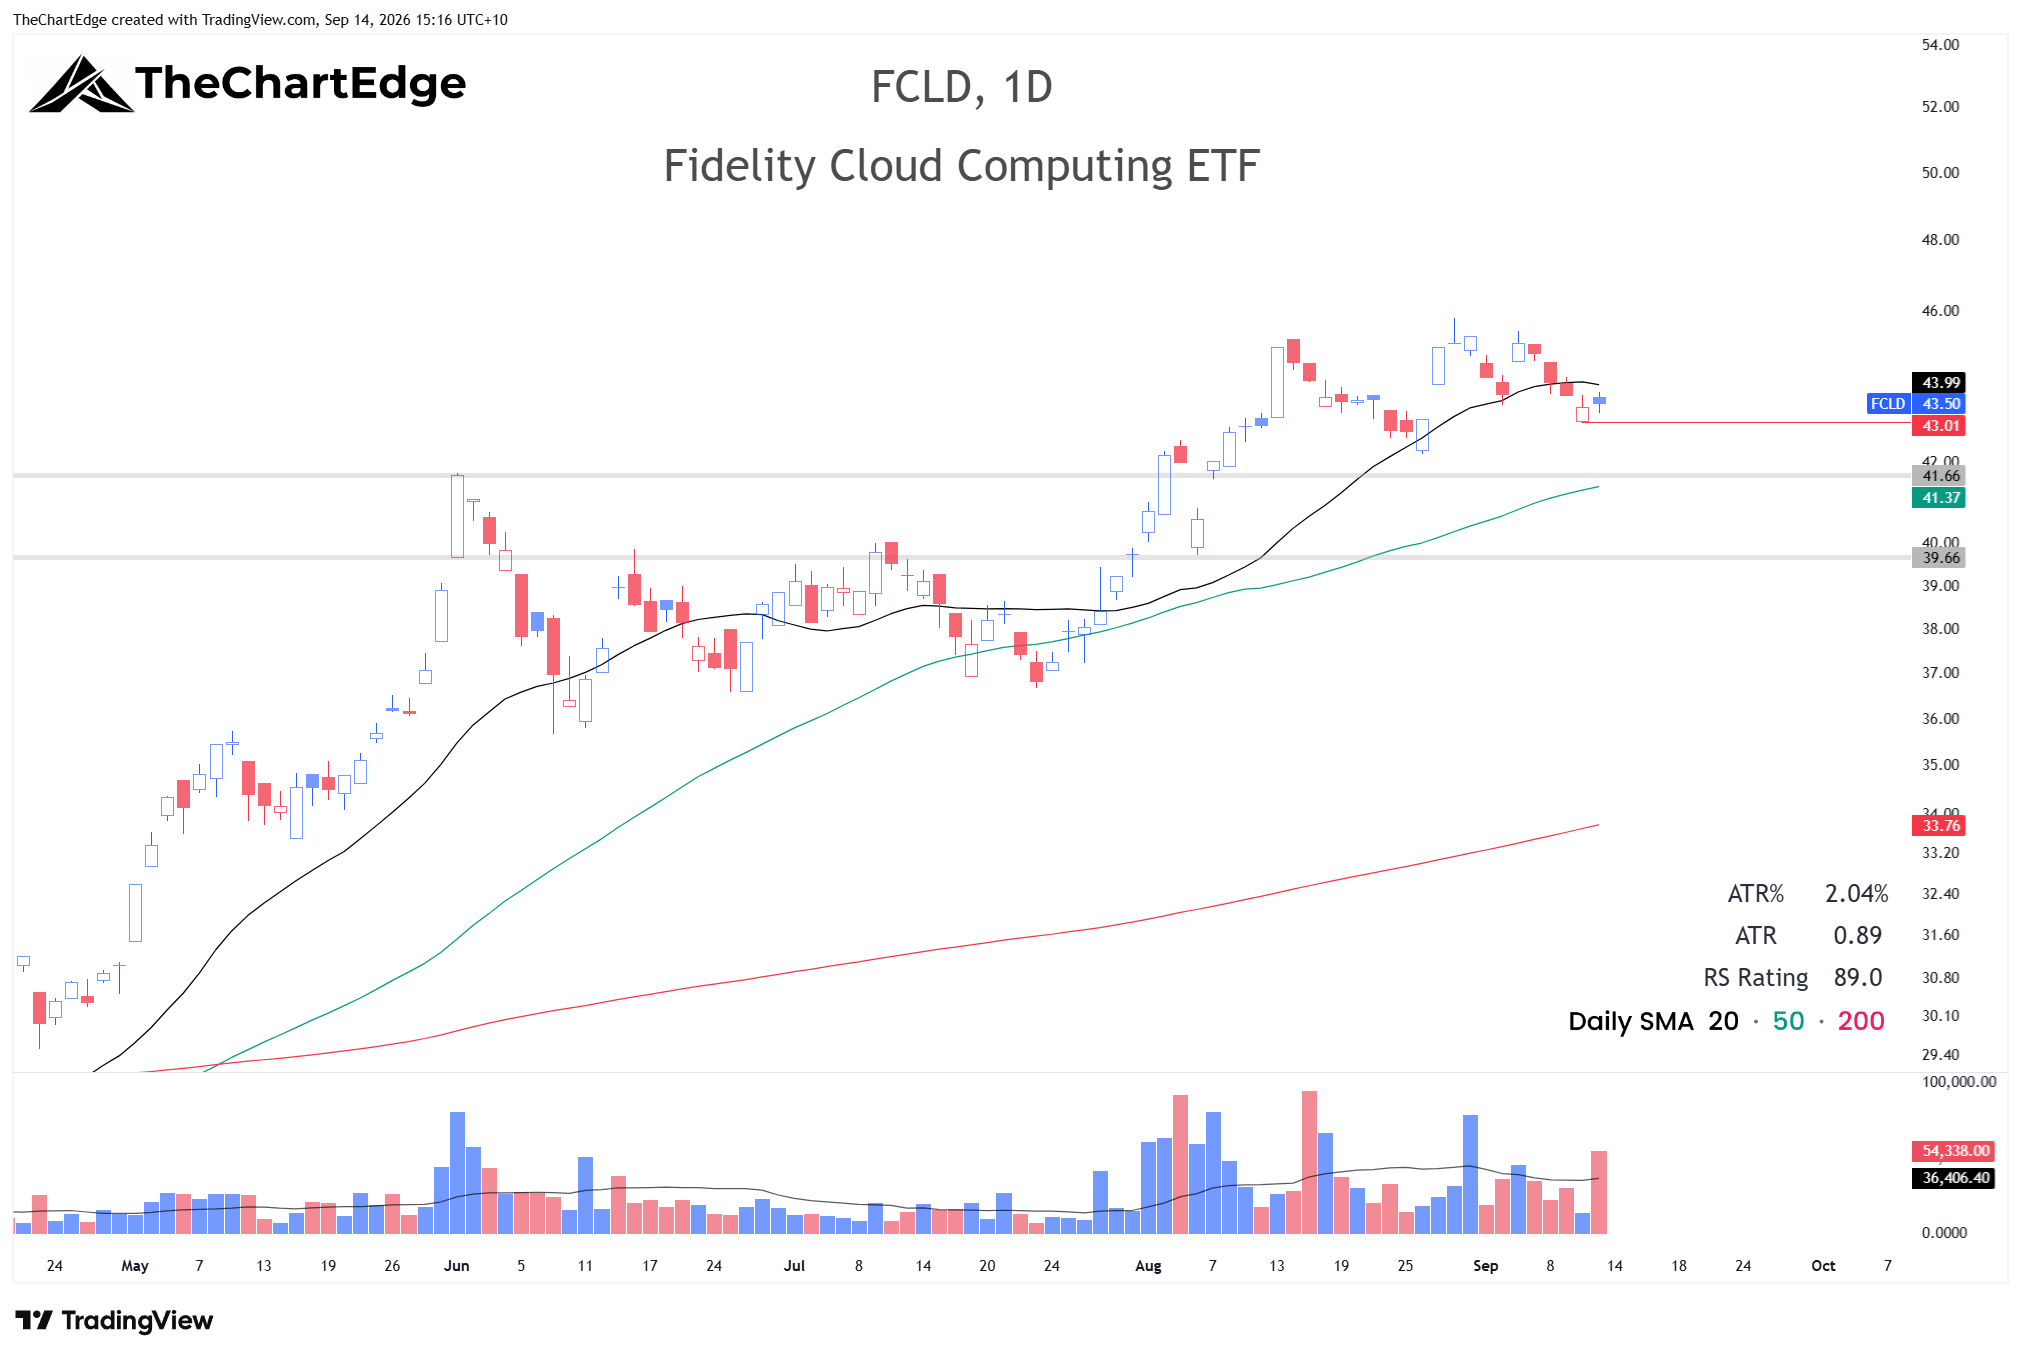
FCLD triggered at 44.25 on Tuesday and closed the week at 43.50, failing to hold its 20-day SMA. My stop is at 42.90, just under Thursday’s low of 43. I would usually give it a bit more room under a low, but I set this stop when I placed the order last week. As I finish writing this on Monday evening in Melbourne it looks like there will be some pretty large gap downs across most of tech if current extended hours prices hold, so I expect to be stopped out of this on the open.
Gold Miners (GDX) Chart
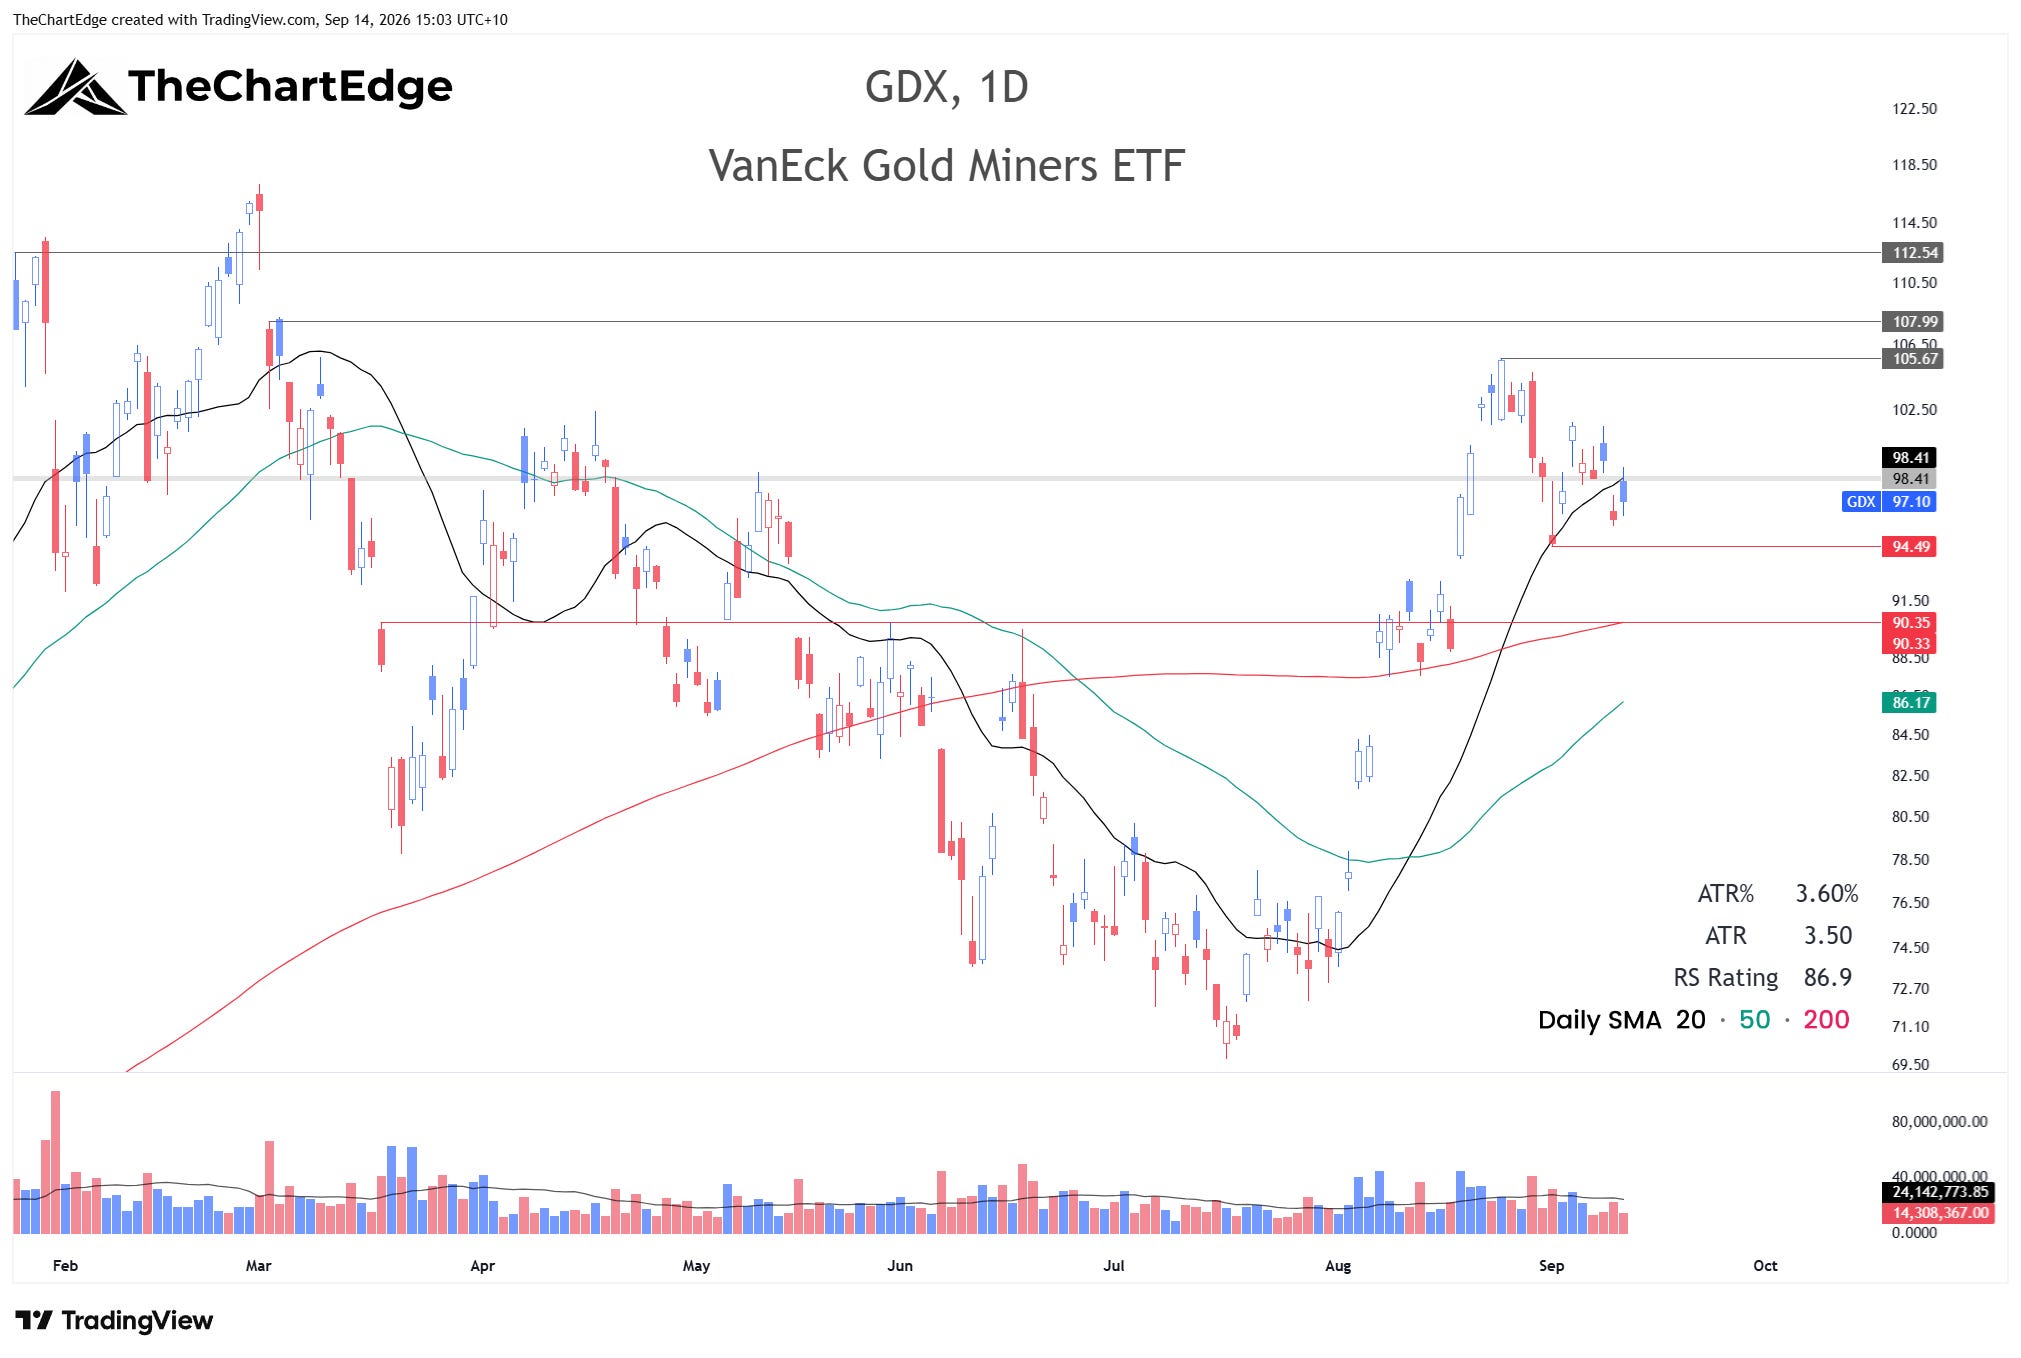
GDX triggered at 97 on Thursday and closed the week at 97.10. It gapped up on Friday and initially pushed higher, but reversed, finishing the week under its 20-day SMA. My stop is at 93, and also looks under threat with GDX down in the premarket.
Ethereum Chart
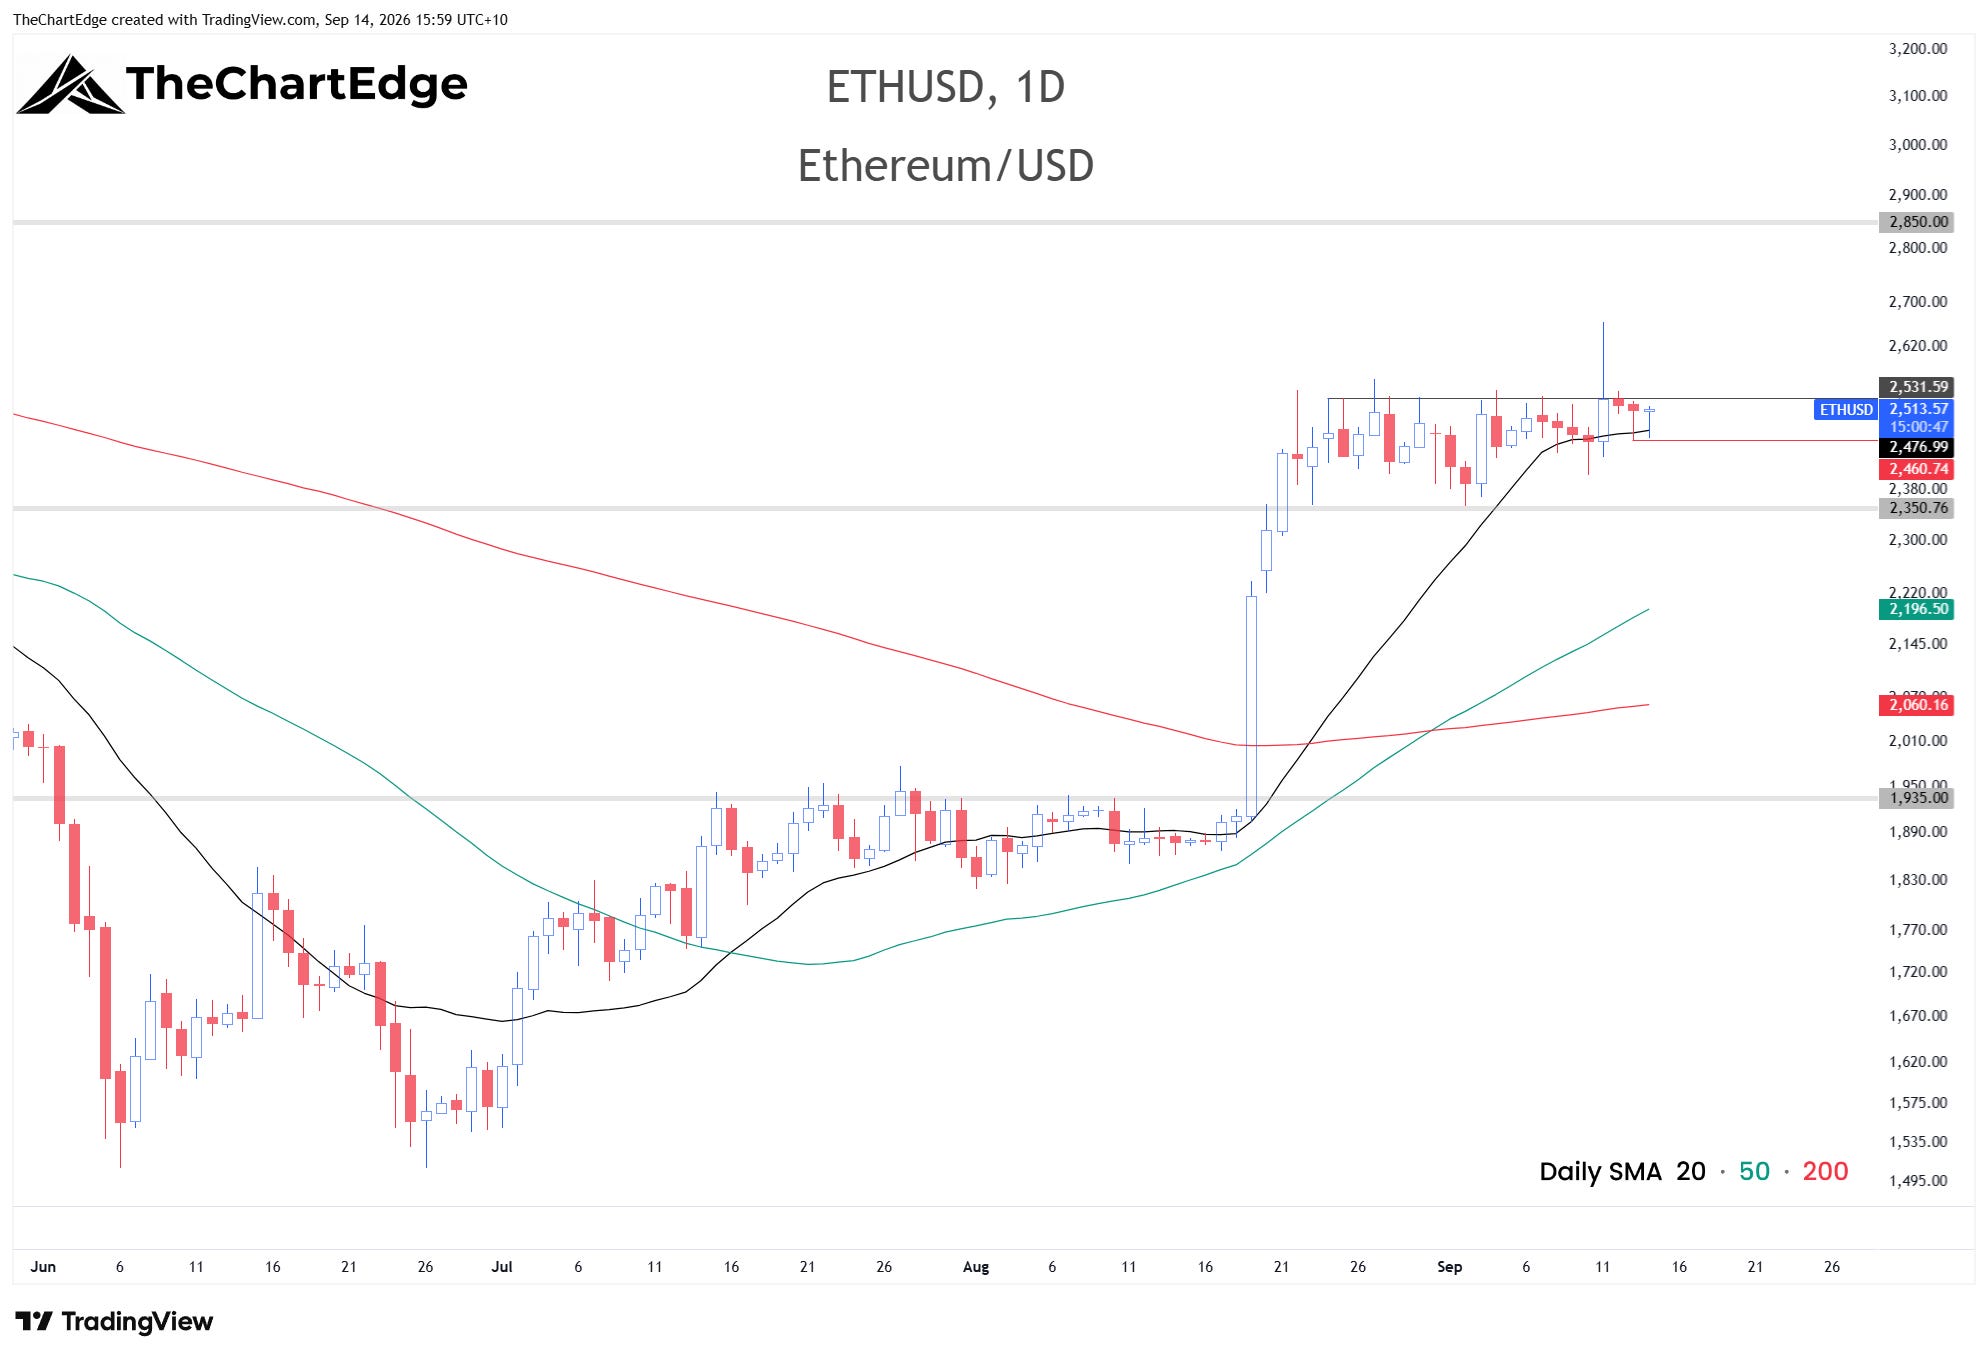
Ethereum broke out of the 2350-2550 range with a rapid move after the CPI release on Friday, going from around 2450 to 2650, between 10:30pm and midnight Melbourne time, triggering my buy stop order at 2570. There was no follow-through however, and it has since dropped back into the old range, currently trading around 2510. My stop-loss is at 2460 and has twice come very close to getting hit. I will leave the position on with the stop as is for now, despite the failed breakout on Friday.
Yields and the FOMC on Wednesday
The 10-year yield closed at 4.98% and the 30-year at 5.36%. Both are now above the levels I flagged a few weeks ago - 4.74% on the 10-year and 5.27% on the 30-year. The FOMC rate decision on Wednesday US time (early Thursday morning here) and the market’s reaction to it will be interesting.
The Week Ahead
The Market Temperature is now in the Cautious Zone after 5 weeks in Goldilocks. The Momentum Leaderboard is signalling reduced risk appetite. Of the major indices only FNGS, SPY and QQQ remain in an uptrend state and there are multiple signs of deterioration underneath the surface. The market feedback from my own trades is also telling me that less is more currently, with 4 stop-outs last week.
In terms of positioning, I have small positions in FCLD and GDX, as well as Ethereum, all with relatively tight stops. I am not in a hurry to add new positions at this stage, although I will continue to monitor semi and AI names - if SMH can clear 578-592 (and SPY and QQQ don’t break down), I’ll be looking for opportunities in that area again. Although this doesn't look probable in the short term - premarket prices are down quite significantly, with SPY, QQQ and SMH all trading near the downside levels I flagged above.
Stay open-minded and manage risk carefully.
Cheers,
Marcus Grant, CFTe
Disclaimer: The content provided in this newsletter is for informational and educational purposes only and should not be considered as financial, investment, or legal advice. It is general information only and does not take into account your objectives, financial situation or needs. The information shared is based on our research and analysis, but we are not a licensed financial advisor, nor can we guarantee its accuracy, completeness, or timeliness. Market conditions and financial instruments can change rapidly, and any opinions expressed may not be suitable for all investors. Any opinions expressed and/or securities mentioned do not constitute a recommendation to buy, sell, or hold that or any other security. You should conduct your own due diligence and consult with a licensed financial advisor or other professional before making any investment decisions. Past performance is not indicative of future results, and all investments carry the risk of loss. The authors and publishers of this newsletter are not responsible for any financial decisions made based on the content provided herein. By reading and/or subscribing to this newsletter, you acknowledge and agree that you are using the information at your own risk.