

Market Temperature Drops to 4.7 - Mega-Caps Underperform While Breadth Broadens
The S&P 500 and Nasdaq 100 got hit, as money rotated into healthcare, biotech and rate-sensitive names

Last week (ending June 26) the large-cap indices fell - the S&P 500 (SPY) down 2.4% and the Nasdaq 100 (QQQ) off 4.6% - while the FANG+ index (FNGS) dropped 6.3%. However, the S&P MidCap 400 (MDY) rose 0.6%, the Russell 2000 (IWM) 1.4%, microcaps (IWC) 1.5%, the Dow (DIA) 0.4% and the equal-weight S&P 500 (RSP) 0.2% - all of them still above their 20-day simple moving averages. The selling was concentrated in the heavyweights and recent AI winners.
SPY Chart
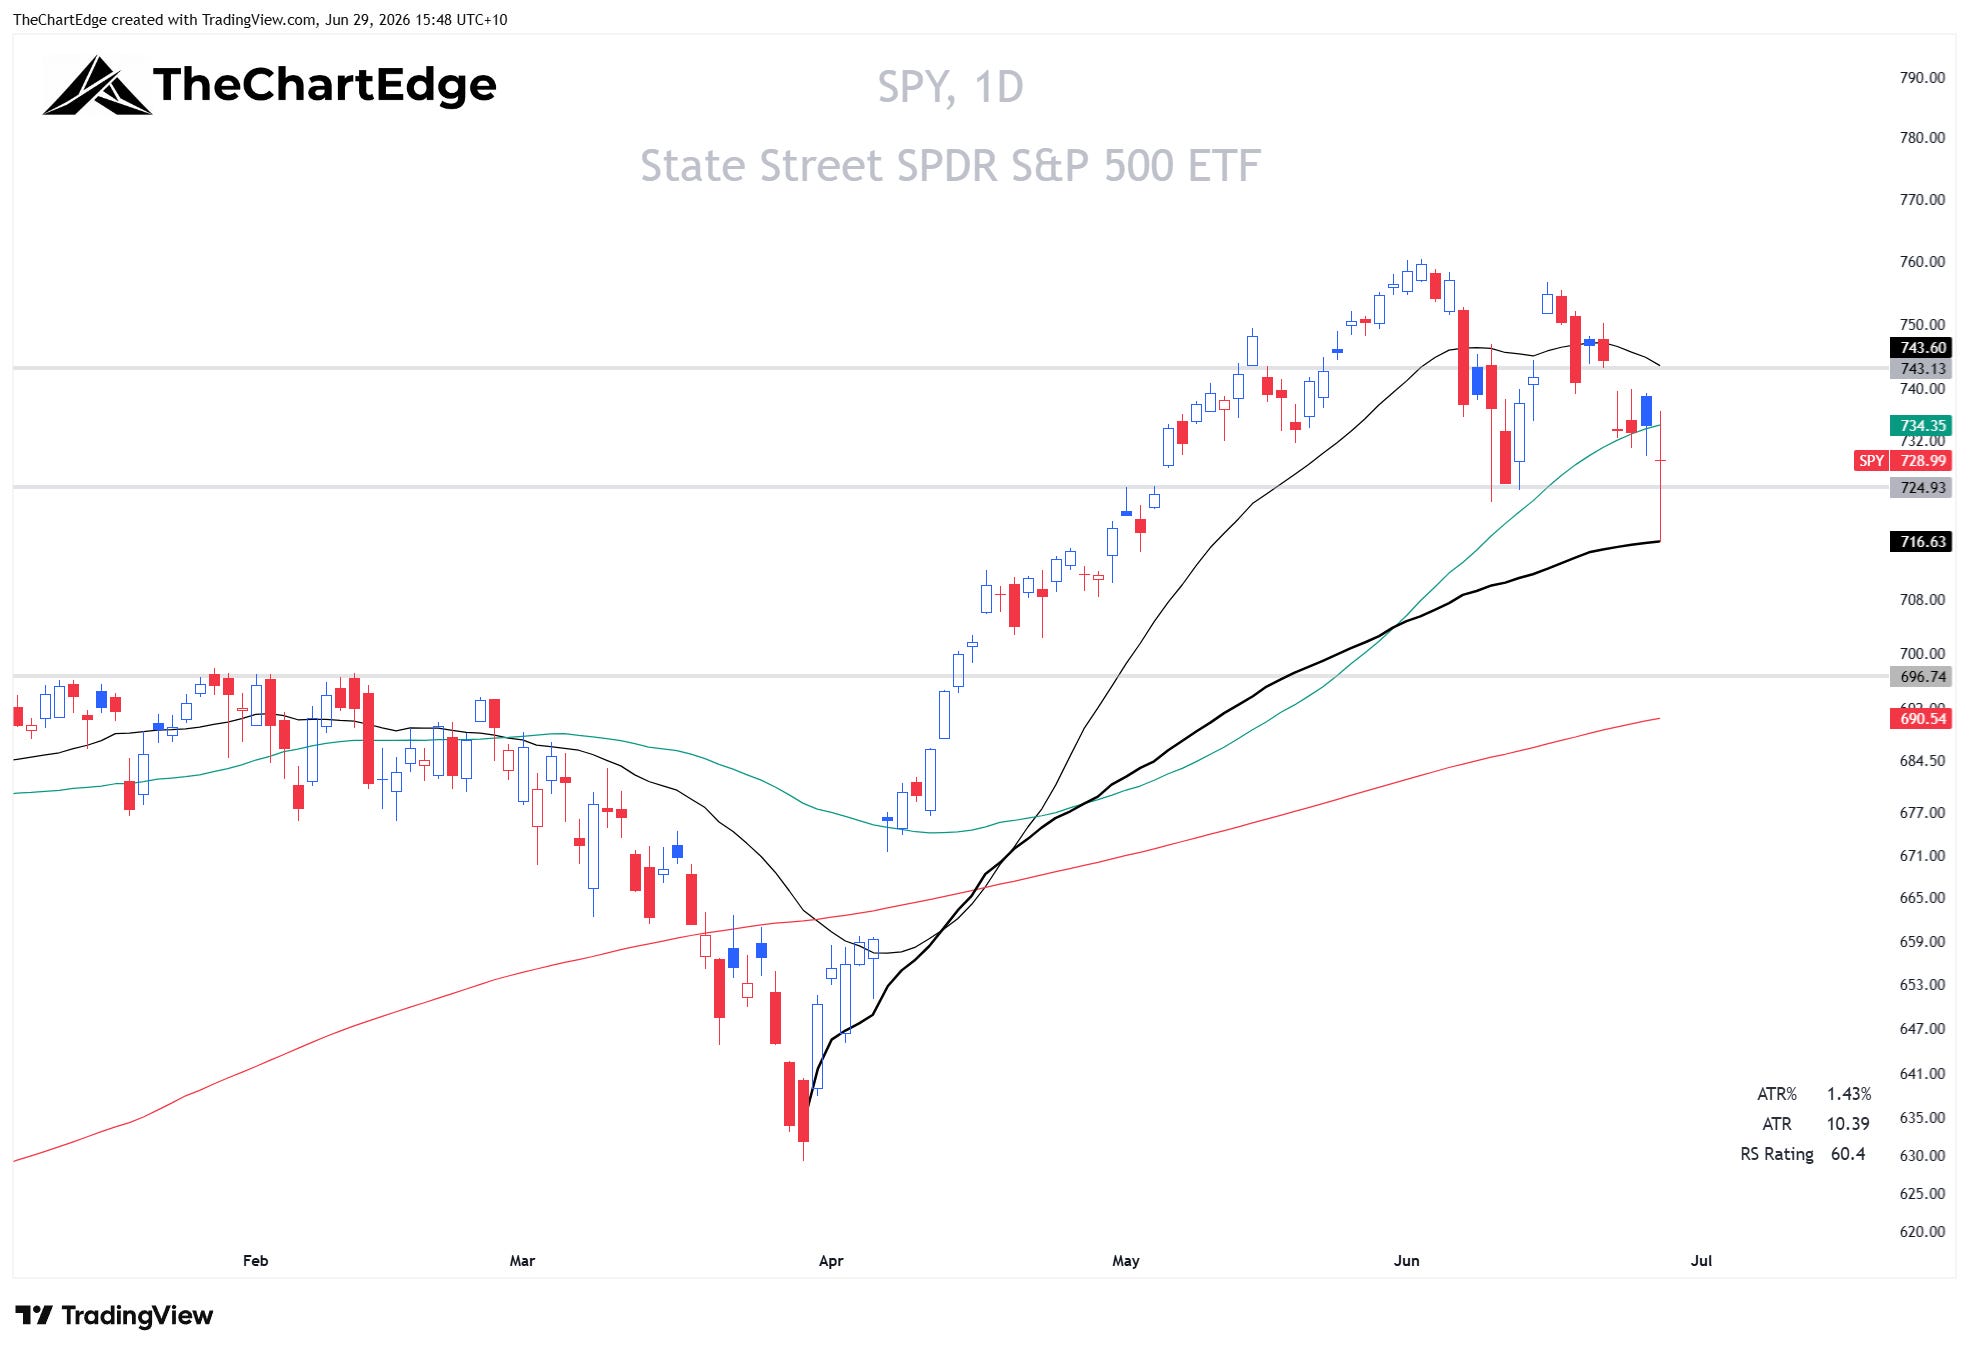
For all daily charts the black line is the 20-day SMA, the green is the 50-day, and the red is the 200-day. The thick black line is the AVWAP from the March 30 low.
After Monday’s failure and Tuesday’s gap down, the chart has a very different look compared to last weekend. Friday’s low bounced right at the AVWAP from the March 30 low. However, I want to see it regain the 20-day SMA, which sits at 743.60 as I write this, before getting bullish again.
On the other hand, if we are to have another leg down, I would be looking at the 690 to 695 zone, which is the convergence of the rising 200-day SMA and the prior highs from January and February this year, as potential support.
QQQ Chart
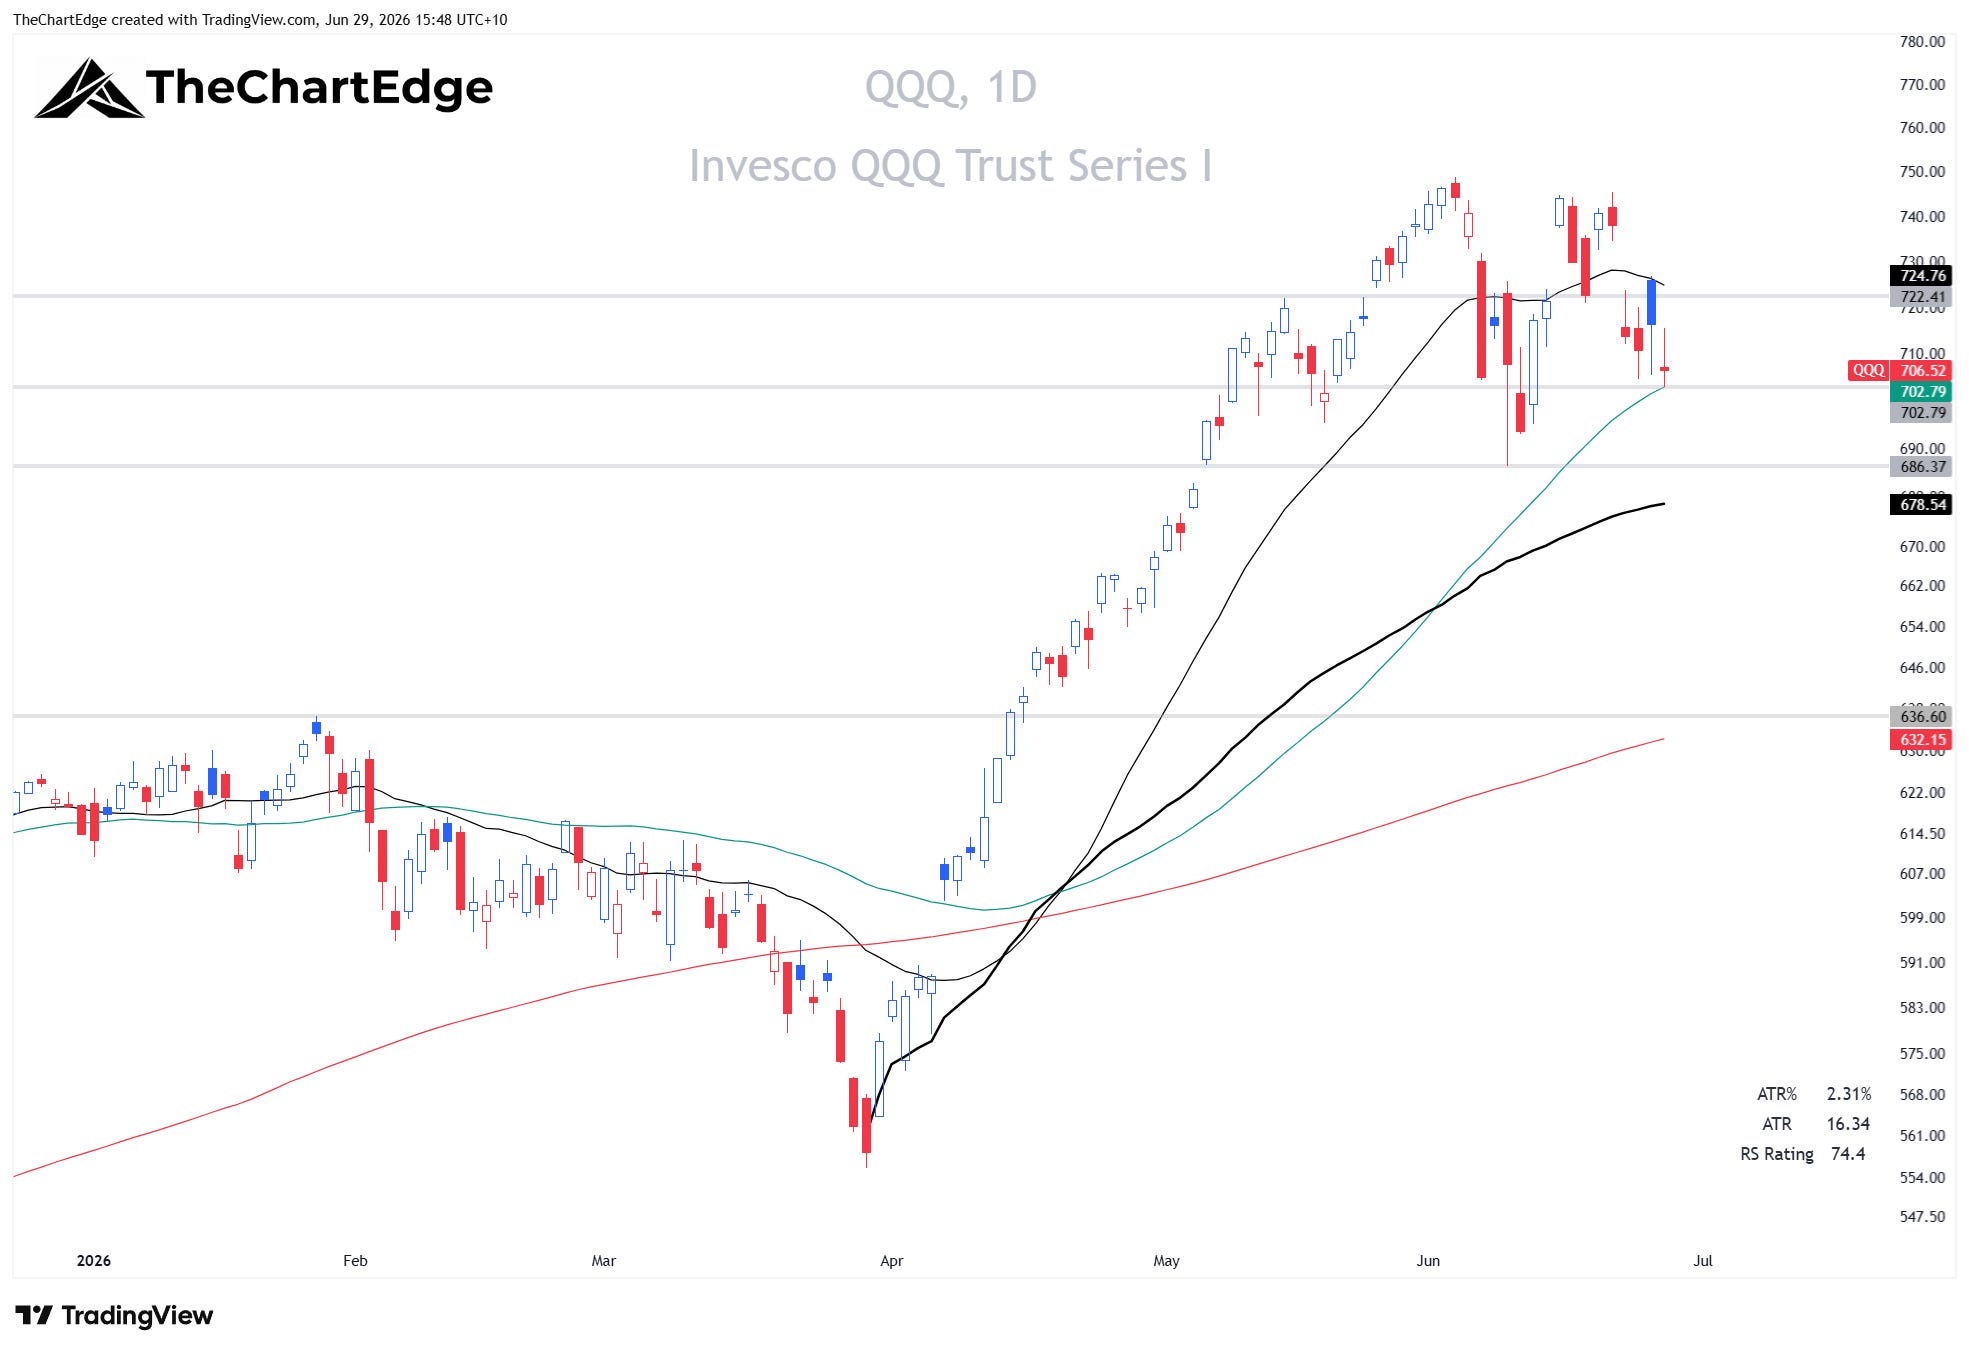
The QQQ looks stronger than the SPY. It’s still holding its 50-day SMA for now. But as with the SPY, I will be waiting for a reclaim of the 20-day SMA, which currently sits at 724.76, before getting bullish or aggressive. If we get a flush lower and undercut the June 9 low, I would be looking at the AVWAP as potential support. If it could undercut and then rally from there, that may be the reset needed before a new leg up. But if it were to continue lower, I would be looking at the 632 to 637 zone, which is the convergence of the 200-day SMA and the prior highs in October last year and January this year.
FNGS Chart
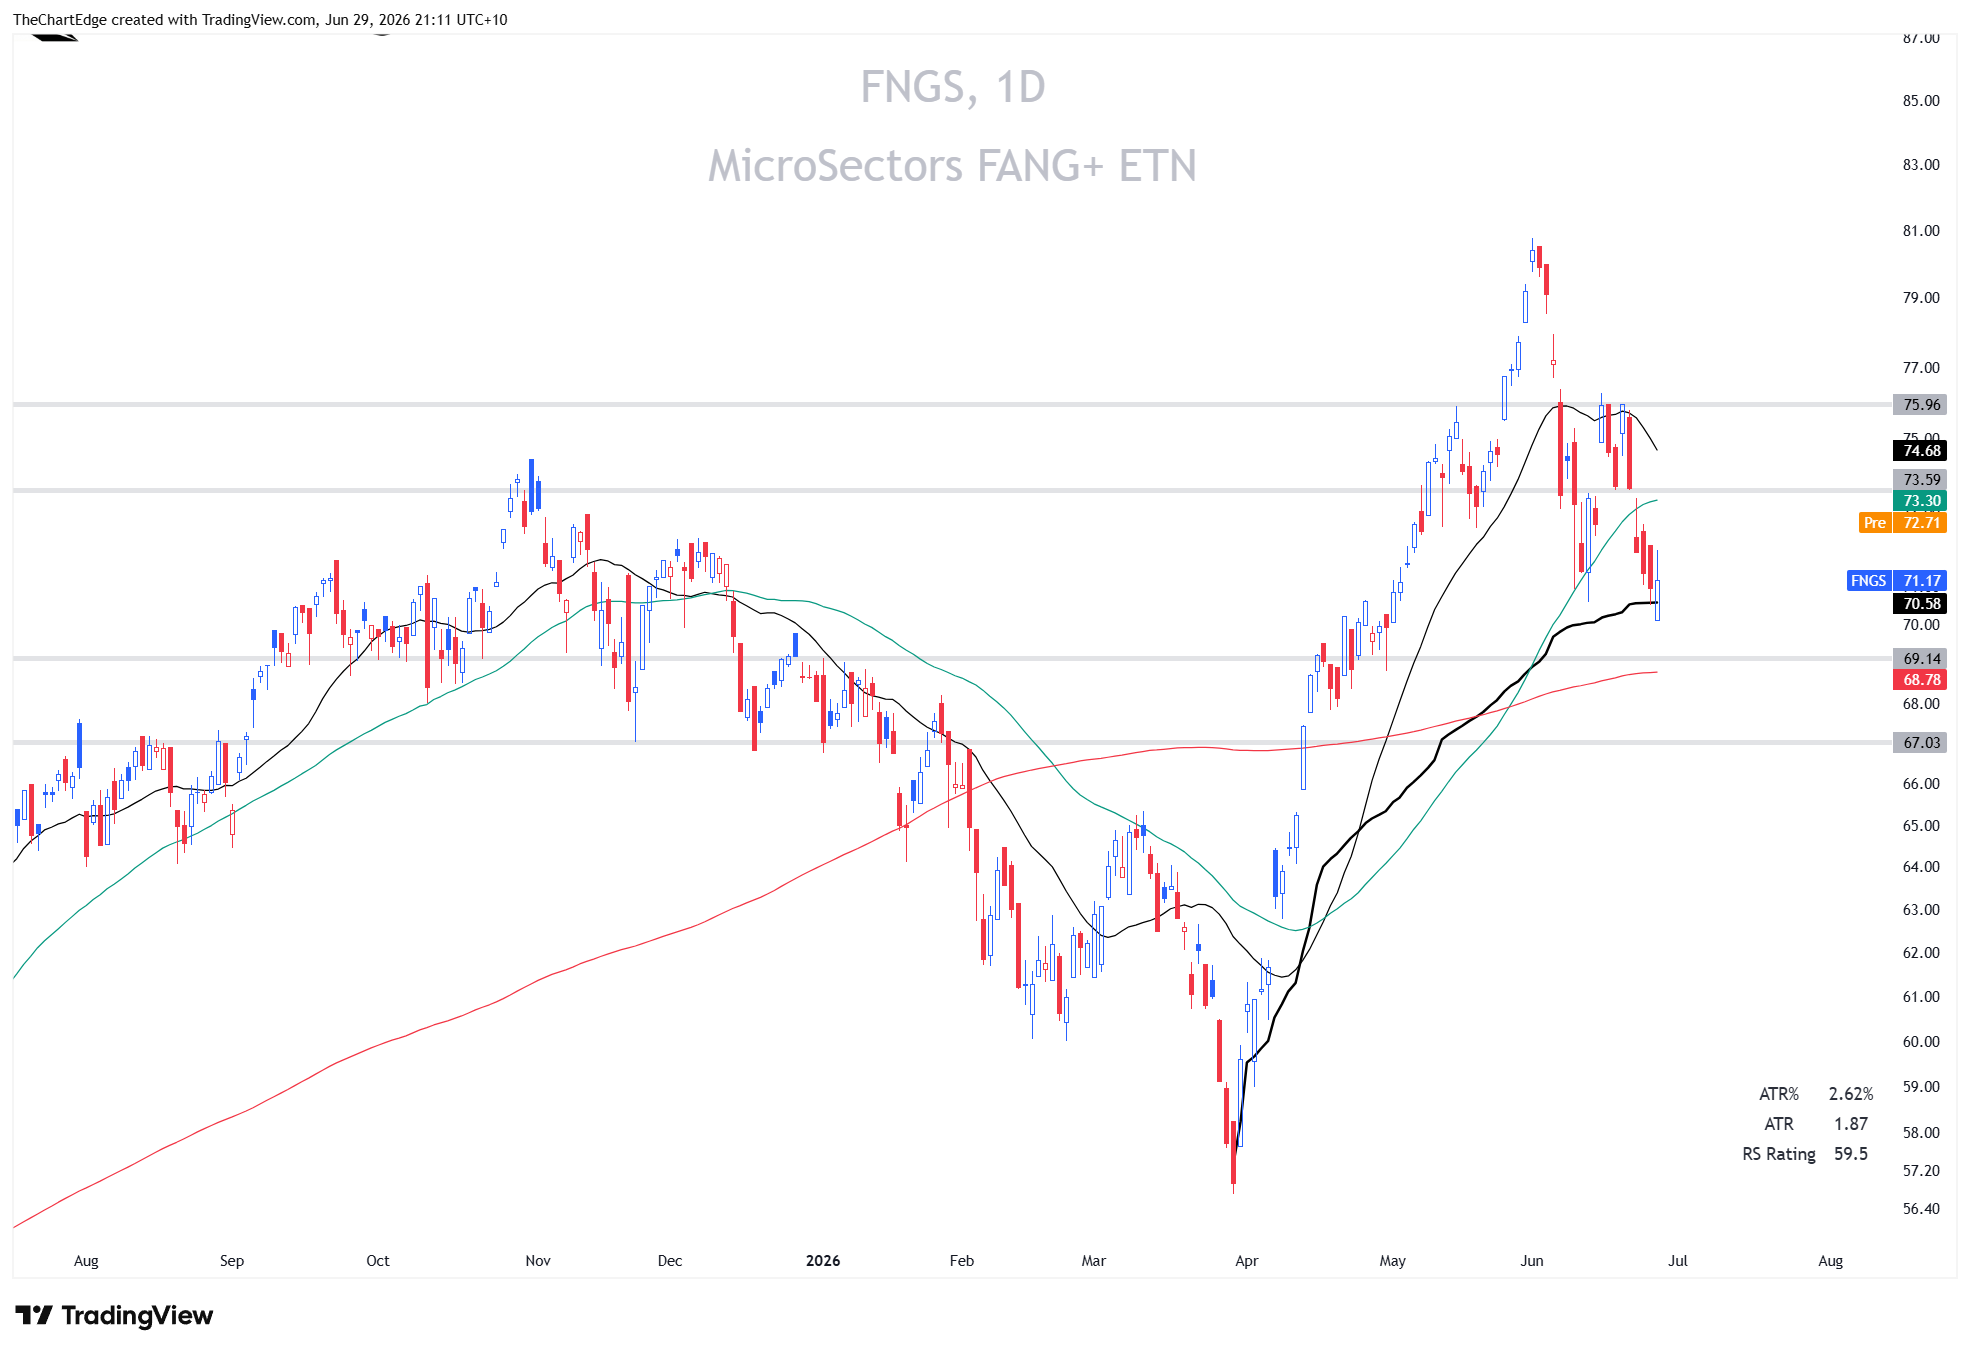
FNGS is the ugliest chart of the three. Friday’s candle undercut the AVWAP and closed positive, but it still has a lot of work to do to get back above its 50-day SMA and declining 20-day SMA. There’s potential support not far below at the 200-day SMA, which currently sits at 68.78, but if it loses that, the chances of a more substantial drawdown in the SPY and QQQ would increase significantly.
Market Temperature
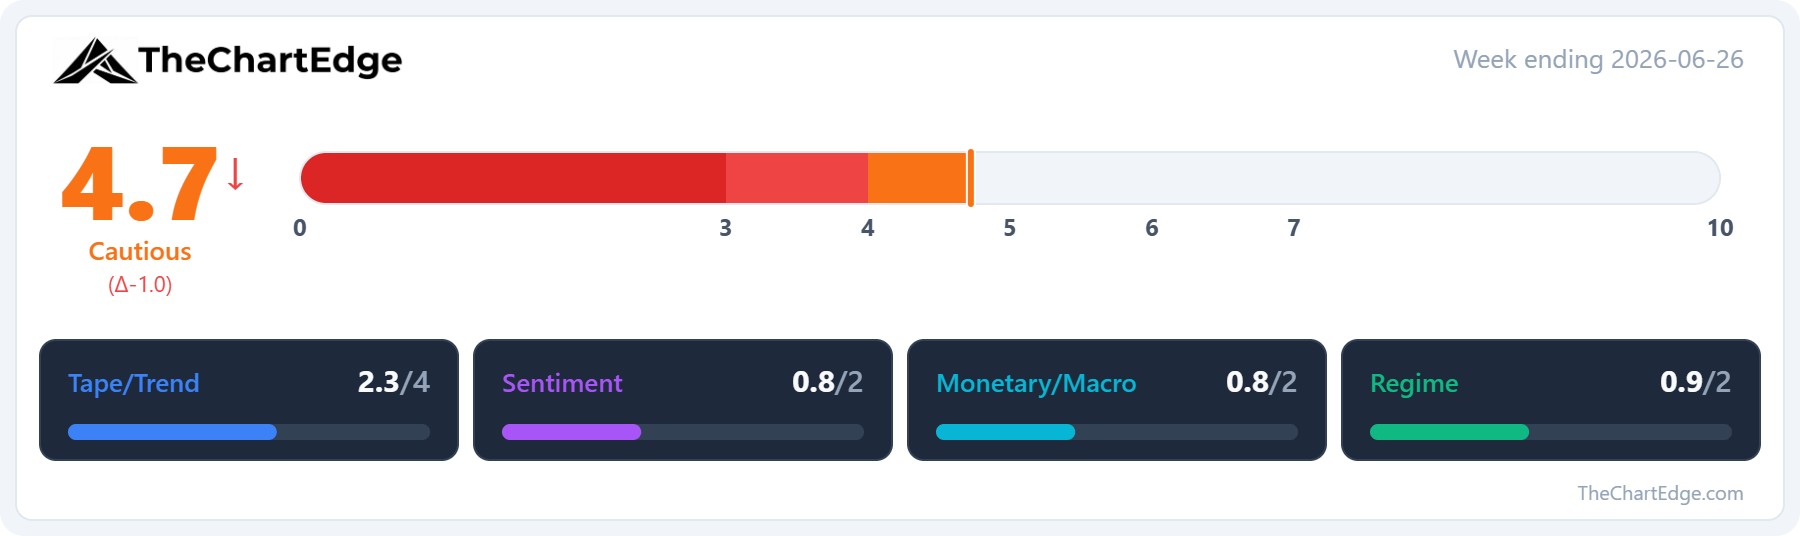
The Market Temperature fell to 4.7 from 5.7, dropping out of the Goldilocks Zone and into Cautious. That’s a full-point fall, which is very uncommon. In the ten-year backtest of the model, a one point or greater weekly drop only happened in around 7% of weekly observations.
The majority of the drop came from the Tape/Trend pillar. The S&P 500 lost its uptrend and slipped to Neutral, and the Nasdaq 100 dropped from a Strong Uptrend to an Uptrend. The S&P 500’s weekly RSI fell to 58.4 from 66.3. Breadth, though, went the other way: the share of US stocks above their 50-day moving average rose to 58.1% from 53.1%, and the 200-day count to 58.2% from 55.0%.
On the Monetary/Macro side, the dollar had another strong week and remains in a Strong Uptrend. Bond volatility ticked up slightly, with the MOVE index at 66.8, and credit spreads widened a touch, though both stayed at relatively low levels.
The Regime pillar also eased, on the back of the discretionary-to-staples ratio (XLY/XLP) turning lower; the high-beta and growth-versus-value signals were unchanged.
Sentiment was the only pillar not to drop on the week. The VIX rose to 18.4 from 16.8, which the model reads as a contrarian positive.
A word on the interpretation of a Cautious reading. A single week in Cautious is the model’s least reliable signal. In backtesting, the 4-5 band is the one zone that flipped sign out of sample, so one week here is close to a coin-flip. The reading that really mattered is sustained weakness below 4: when the temperature stayed below 4.0 for two weeks or more, a genuine drawdown has followed around nine times out of ten, while a one-week dip that recovers has almost always been noise. So caution is warranted and I will trade accordingly. However, the next few weeks will be telling.
GICS Sector Relative Strength
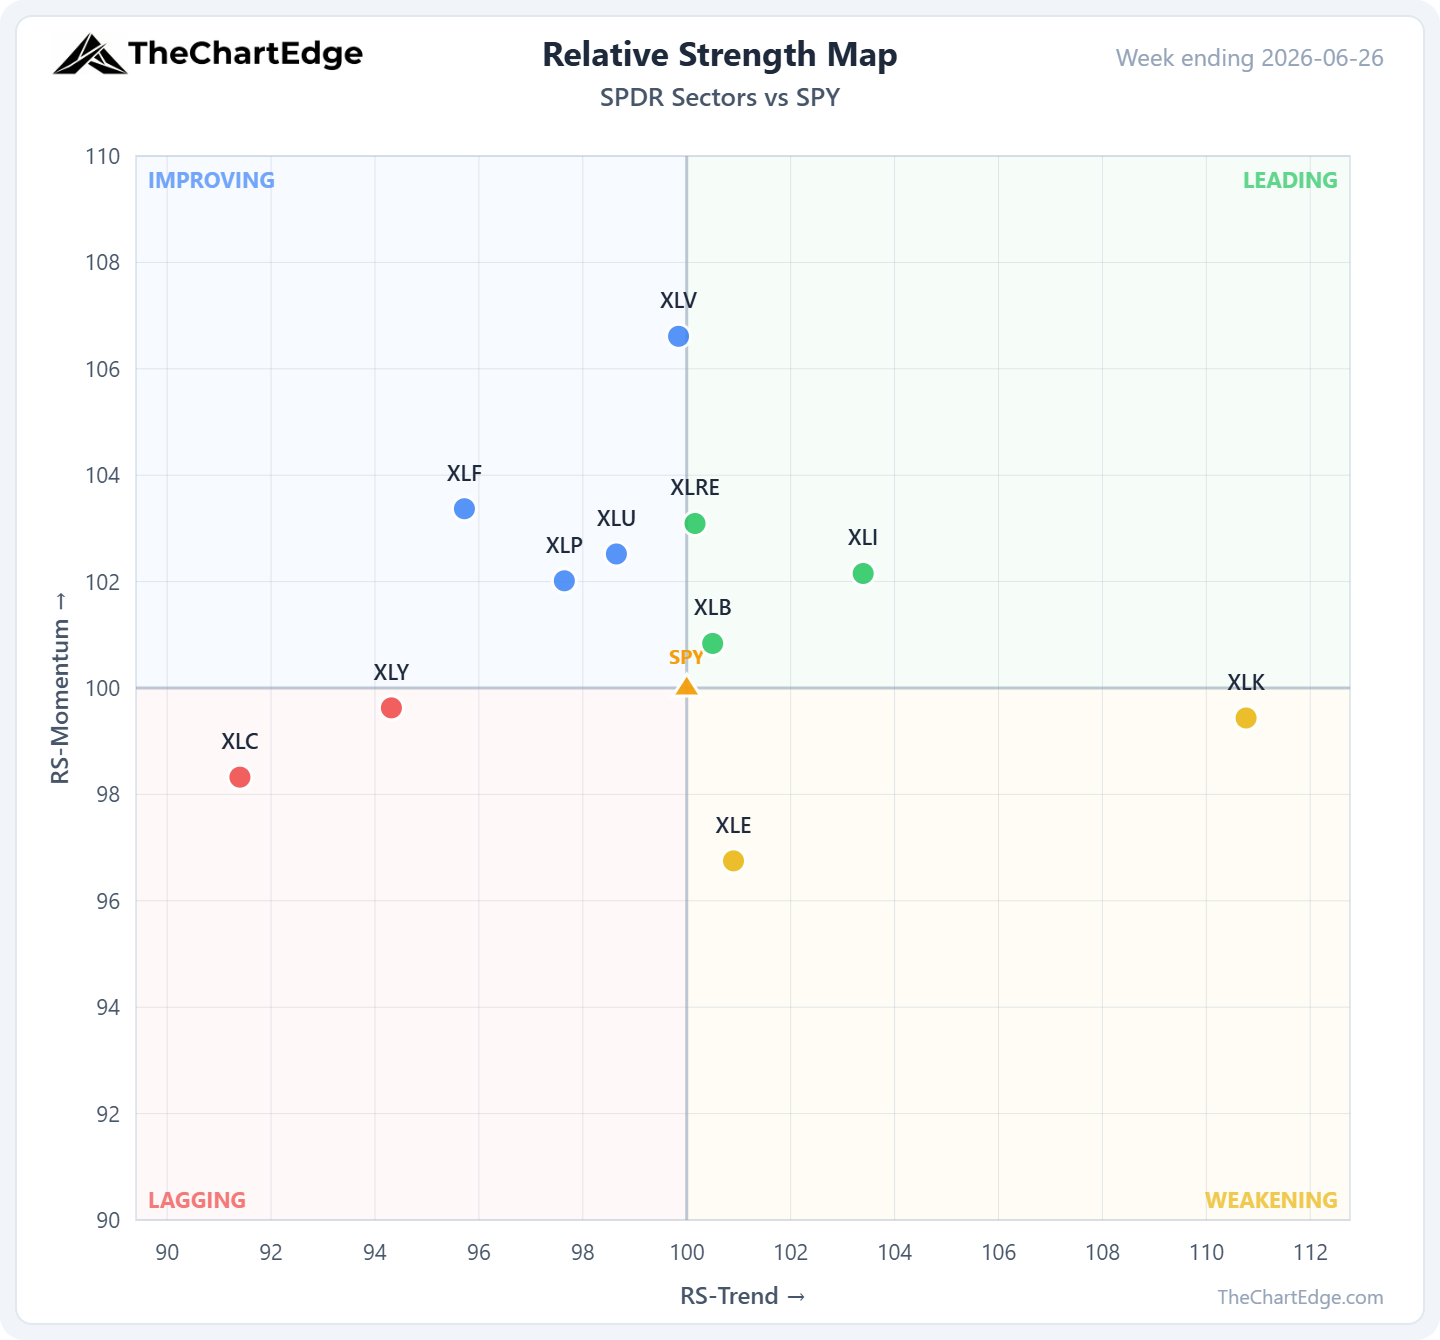
There were some very notable changes to the RS map last week. Technology (XLK) fell 5.4% and dropped out of Leading into Weakening.
Communications (XLC) fell 3.0% and Discretionary (XLY) 2.4%.
The genuine strength was in the defensives: Health Care (XLV) was the standout, up 7.3%, with Utilities (XLU) and Real Estate (XLRE) up around 3% each and Staples (XLP) up 1.7%.
One caveat in reading the map, though: with the S&P 500 down 2.4%, a sector only had to fall less than the benchmark to gain ground against it. Materials (XLB) crossed into Leading while finishing the week down, so some of the broadening is relative rather than absolute strength.
Momentum Leaderboard
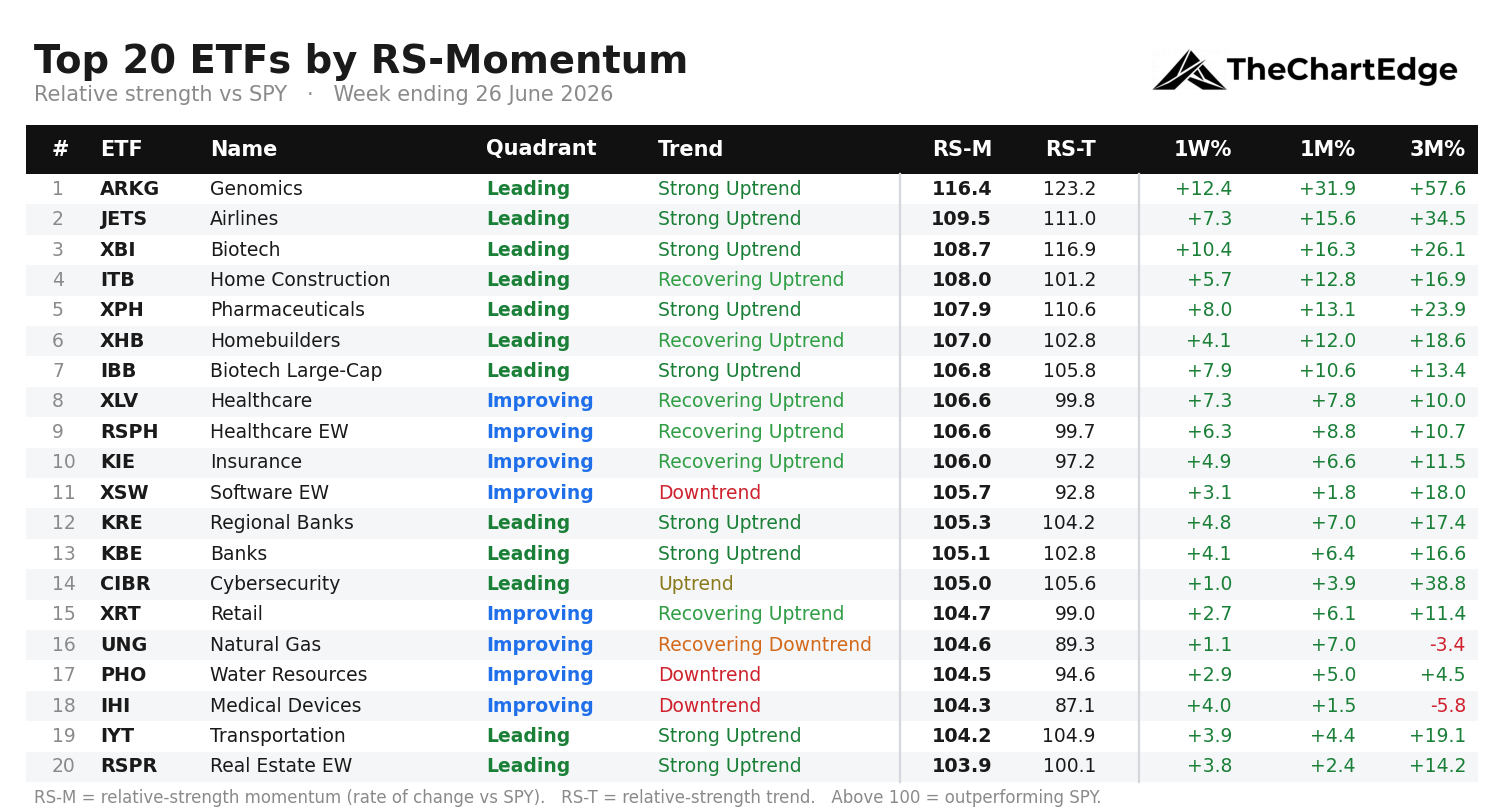
The leaderboard looks very different than it did last weekend. Thirteen of the twenty names are new, and the entire semiconductor and AI cohort that had been consistently dominating it dropped off - the only tech-related name still on the board and in an uptrend is cybersecurity.
Six of the top nine are now healthcare or biotech, led by ARK Genomics (ARKG) up over 12% and Biotech (XBI) up over 10%, with Pharmaceuticals (XPH) and large-cap biotech (IBB) close behind. Homebuilders, real estate, insurance and the regional banks are also in the top 20.
The quality of the leadership is worth noting, though. A week ago, sixteen of the top twenty names were in Strong Uptrends. Now only nine are, with a handful - software, water, medical devices, natural gas - sitting in downtrend states.
The Week Ahead
What stands out most is how much the picture changed in five days. Not just the one-point drop in the market temperature, but the price action on the charts throughout the week. Going into Monday the Nasdaq 100 looked ready to break out to new all-time highs. I was long and preparing to add more exposure during the week. However, on Monday, before reaching an all-time high, the QQQ reversed and closed lower on the day. Then there was the large gap down on Tuesday. Thursday’s gap up rejected right at the declining 20-day SMA. Friday’s close was weak and only just above the 50-day SMA. The SPY was even weaker. For these indices to recover and make new all-time highs, the mega-caps need to stop falling. Since they carry such a heavy weighting in the SPY and QQQ, even with a broadening out, I don’t think the other sectors are large enough to carry the indices to new all-time highs.
Stay open-minded and manage risk carefully.
Cheers,
Marcus Grant, CFTe
Disclaimer: The content provided in this newsletter is for informational and educational purposes only and should not be considered as financial, investment, or legal advice. The information shared is based on our research and analysis, but we are not a licensed financial advisor, nor can we guarantee its accuracy, completeness, or timeliness. Market conditions and financial instruments can change rapidly, and any opinions expressed may not be suitable for all investors. Any opinions expressed and or securities mentioned do not constitute a recommendation to buy, sell, or hold that or any other security. You should conduct your own due diligence and consult with a licensed financial advisor or other professional before making any investment decisions. Past performance is not indicative of future results, and all investments carry the risk of loss. The authors and publishers of this newsletter are not responsible for any financial decisions made based on the content provided herein. By reading and or subscribing to this newsletter, you acknowledge and agree that you are using the information at your own risk.