


Everything below is as of Friday October 16 close.
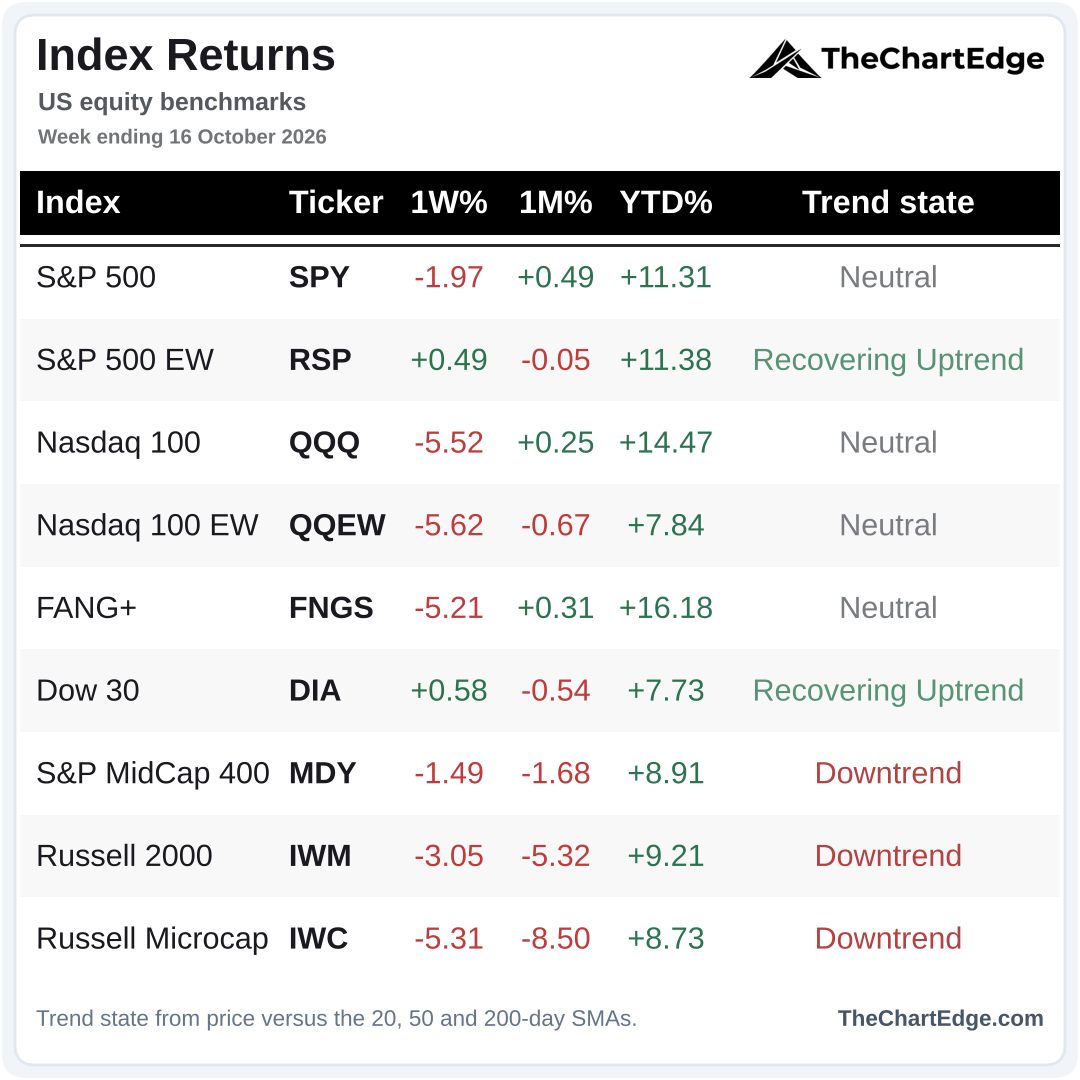
Of the major indices I track, only 2 of the 9 finished the week higher - the equal-weight S&P 500 (RSP) and the Dow (DIA). The Nasdaq 100 (QQQ), its equal-weight version (QQEW) and FANG+ (FNGS) were all down more than 5%, and small-caps (IWM), mid-caps (MDY) and micro-caps (IWC) are now all in Downtrends, below their 200-day SMAs.
S&P 500 (SPY) Chart
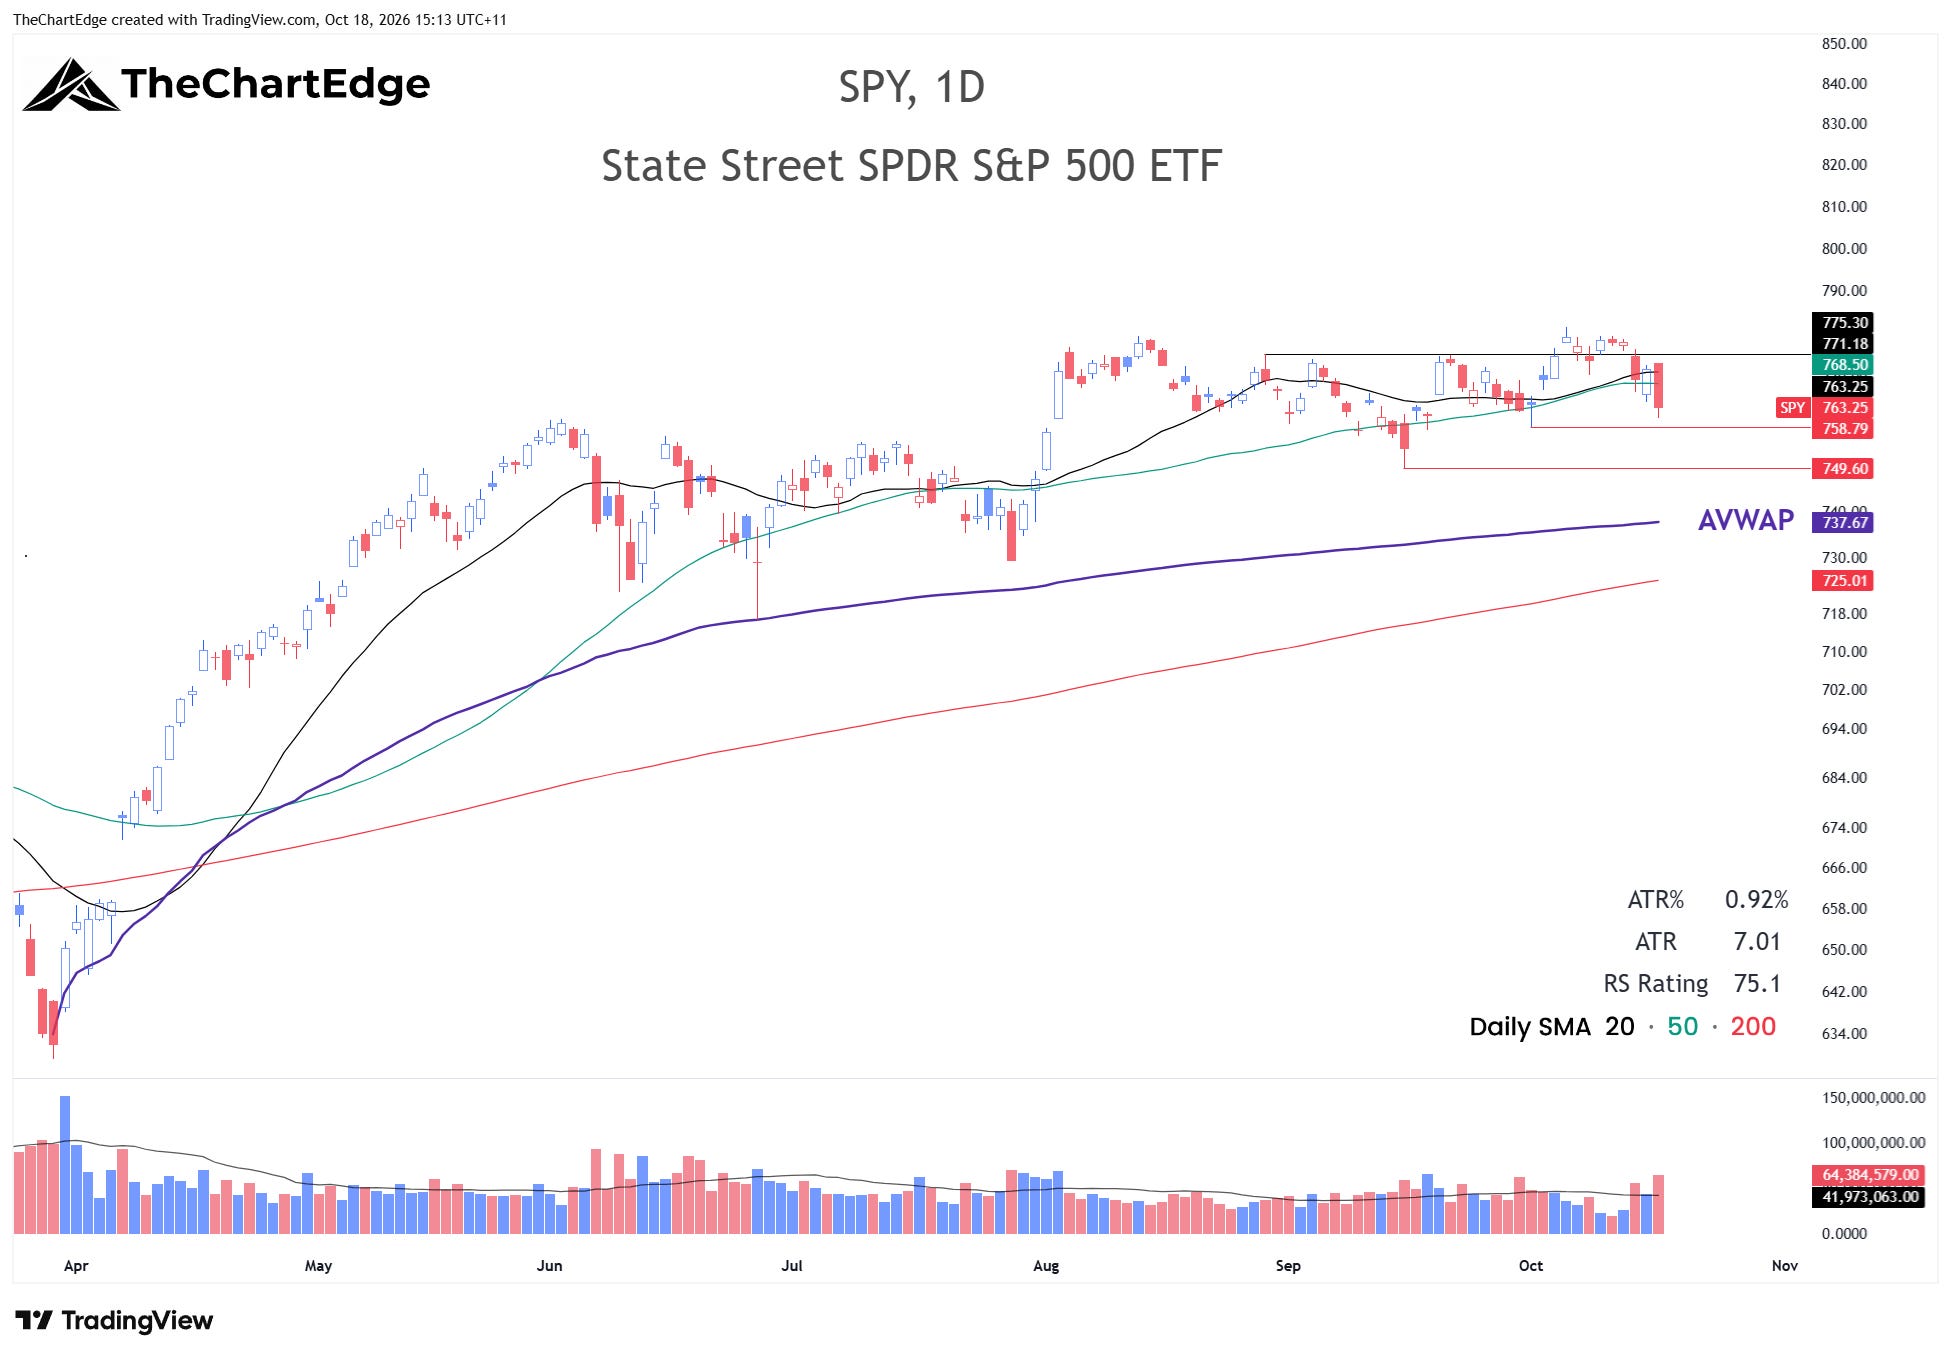
SPY closed at 763.25, dropping from a Strong Uptrend to Neutral. Last week’s breakout above 775 didn’t hold, and it closed back below both its 20 and 50-day SMAs. Despite being only 2.4% from its all-time high, after the failed breakout it looks like we are back in a sideways range at best. I’m watching the October 1 low at 758.79. A close below that could open the way for a test of the September low at 749.60.
Nasdaq 100 (QQQ) Chart
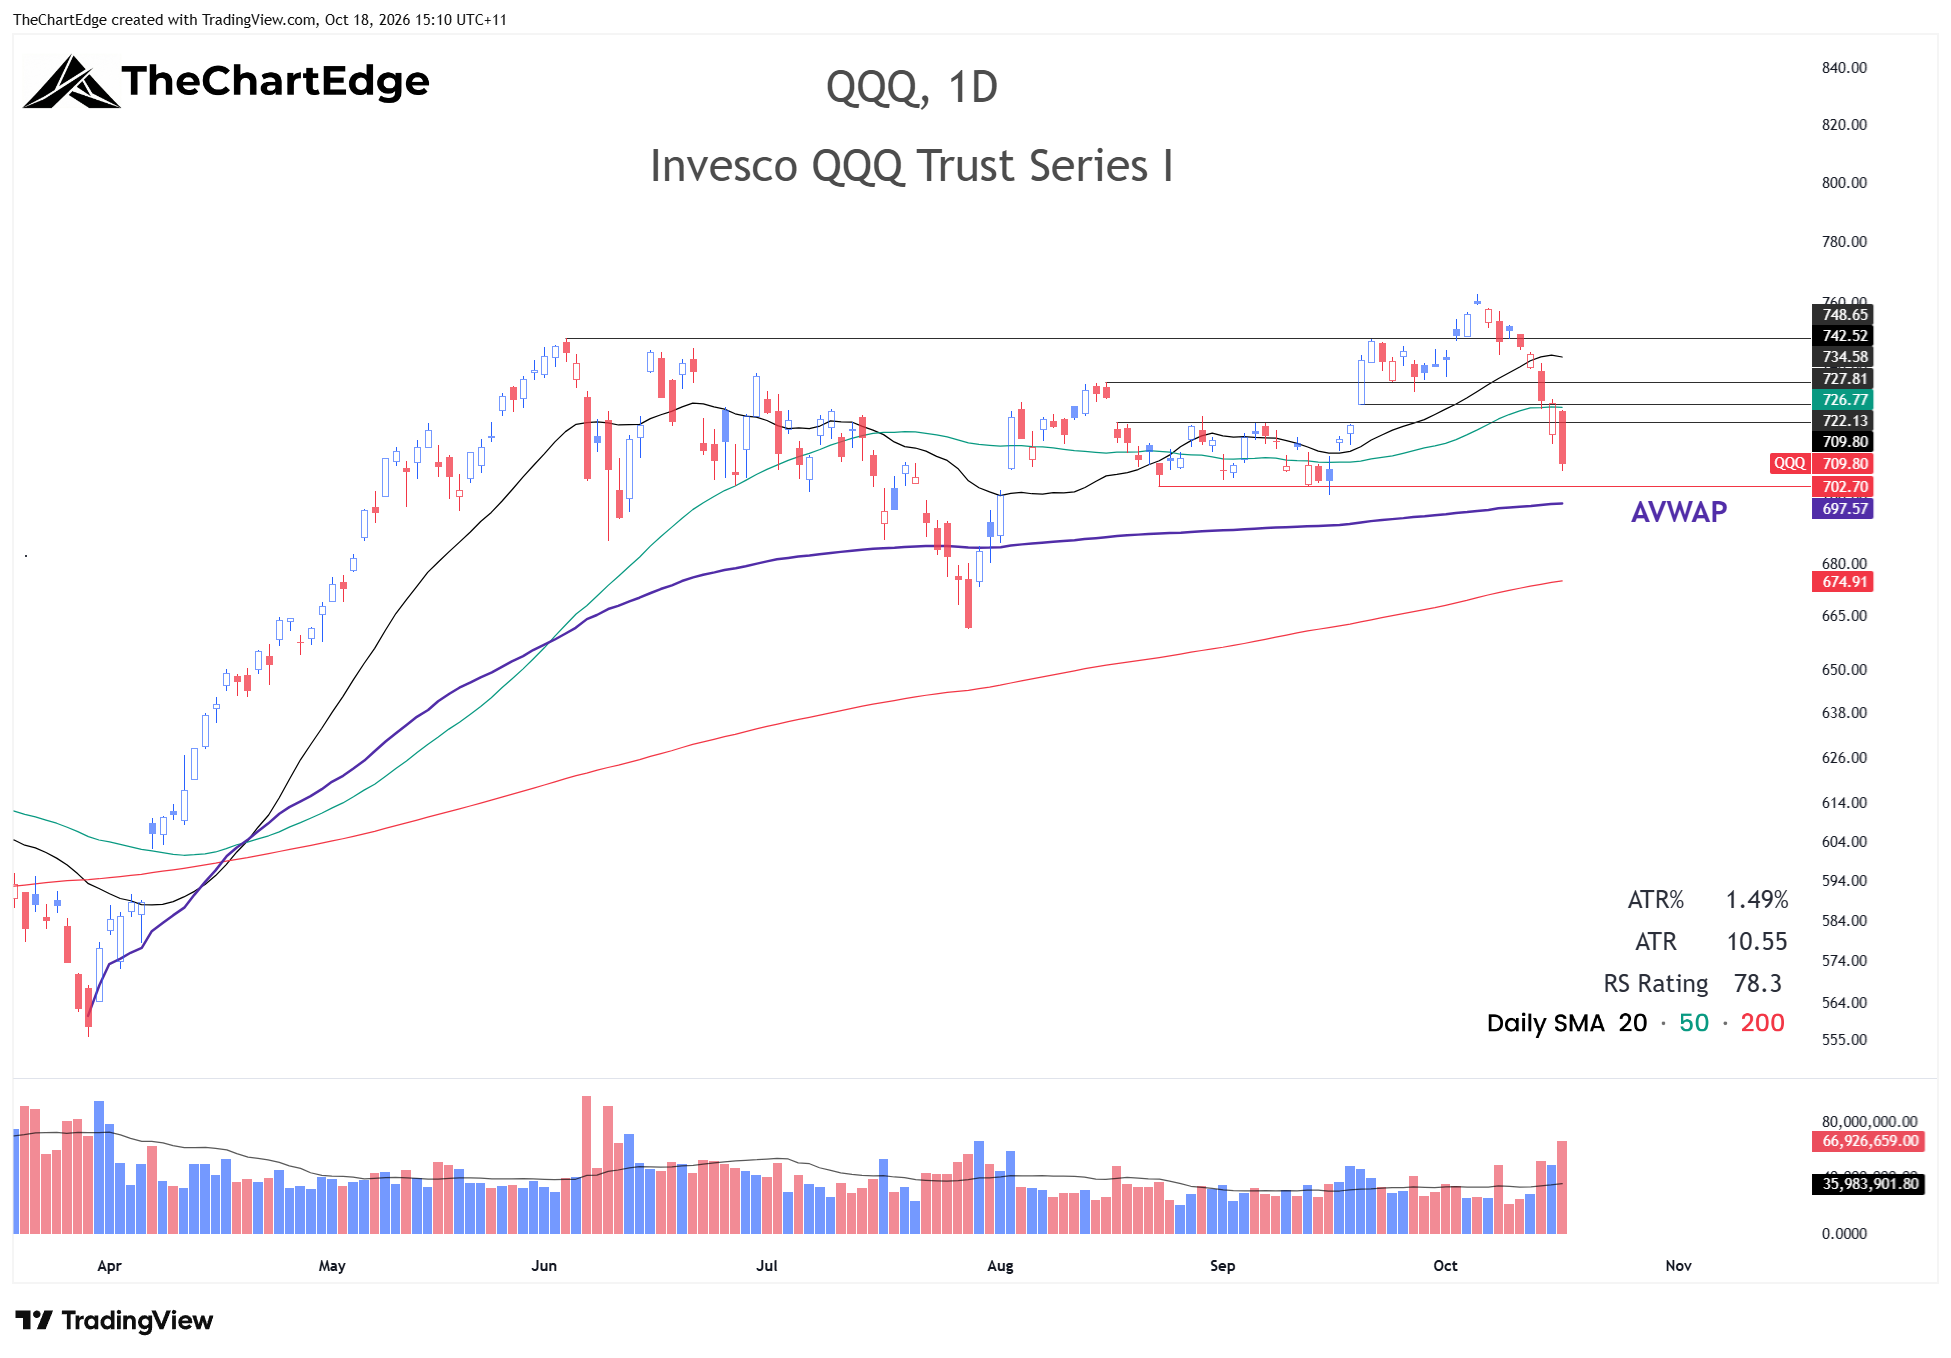
QQQ closed at 709.80, also dropping from a Strong Uptrend to Neutral. Its failed breakout led to a pretty fast and furious downside move. Thursday’s gap down and subsequent recovery looked positive, but the selling resumed on Friday, printing a big red candle. The late August to mid-September lows around 700 and the AVWAP from the March 30 low, which currently comes in around 697.6, sit not too far below. If we lose these levels, a test of the 200-day SMA, currently around 675, looks possible.
FANG+ (FNGS) Chart
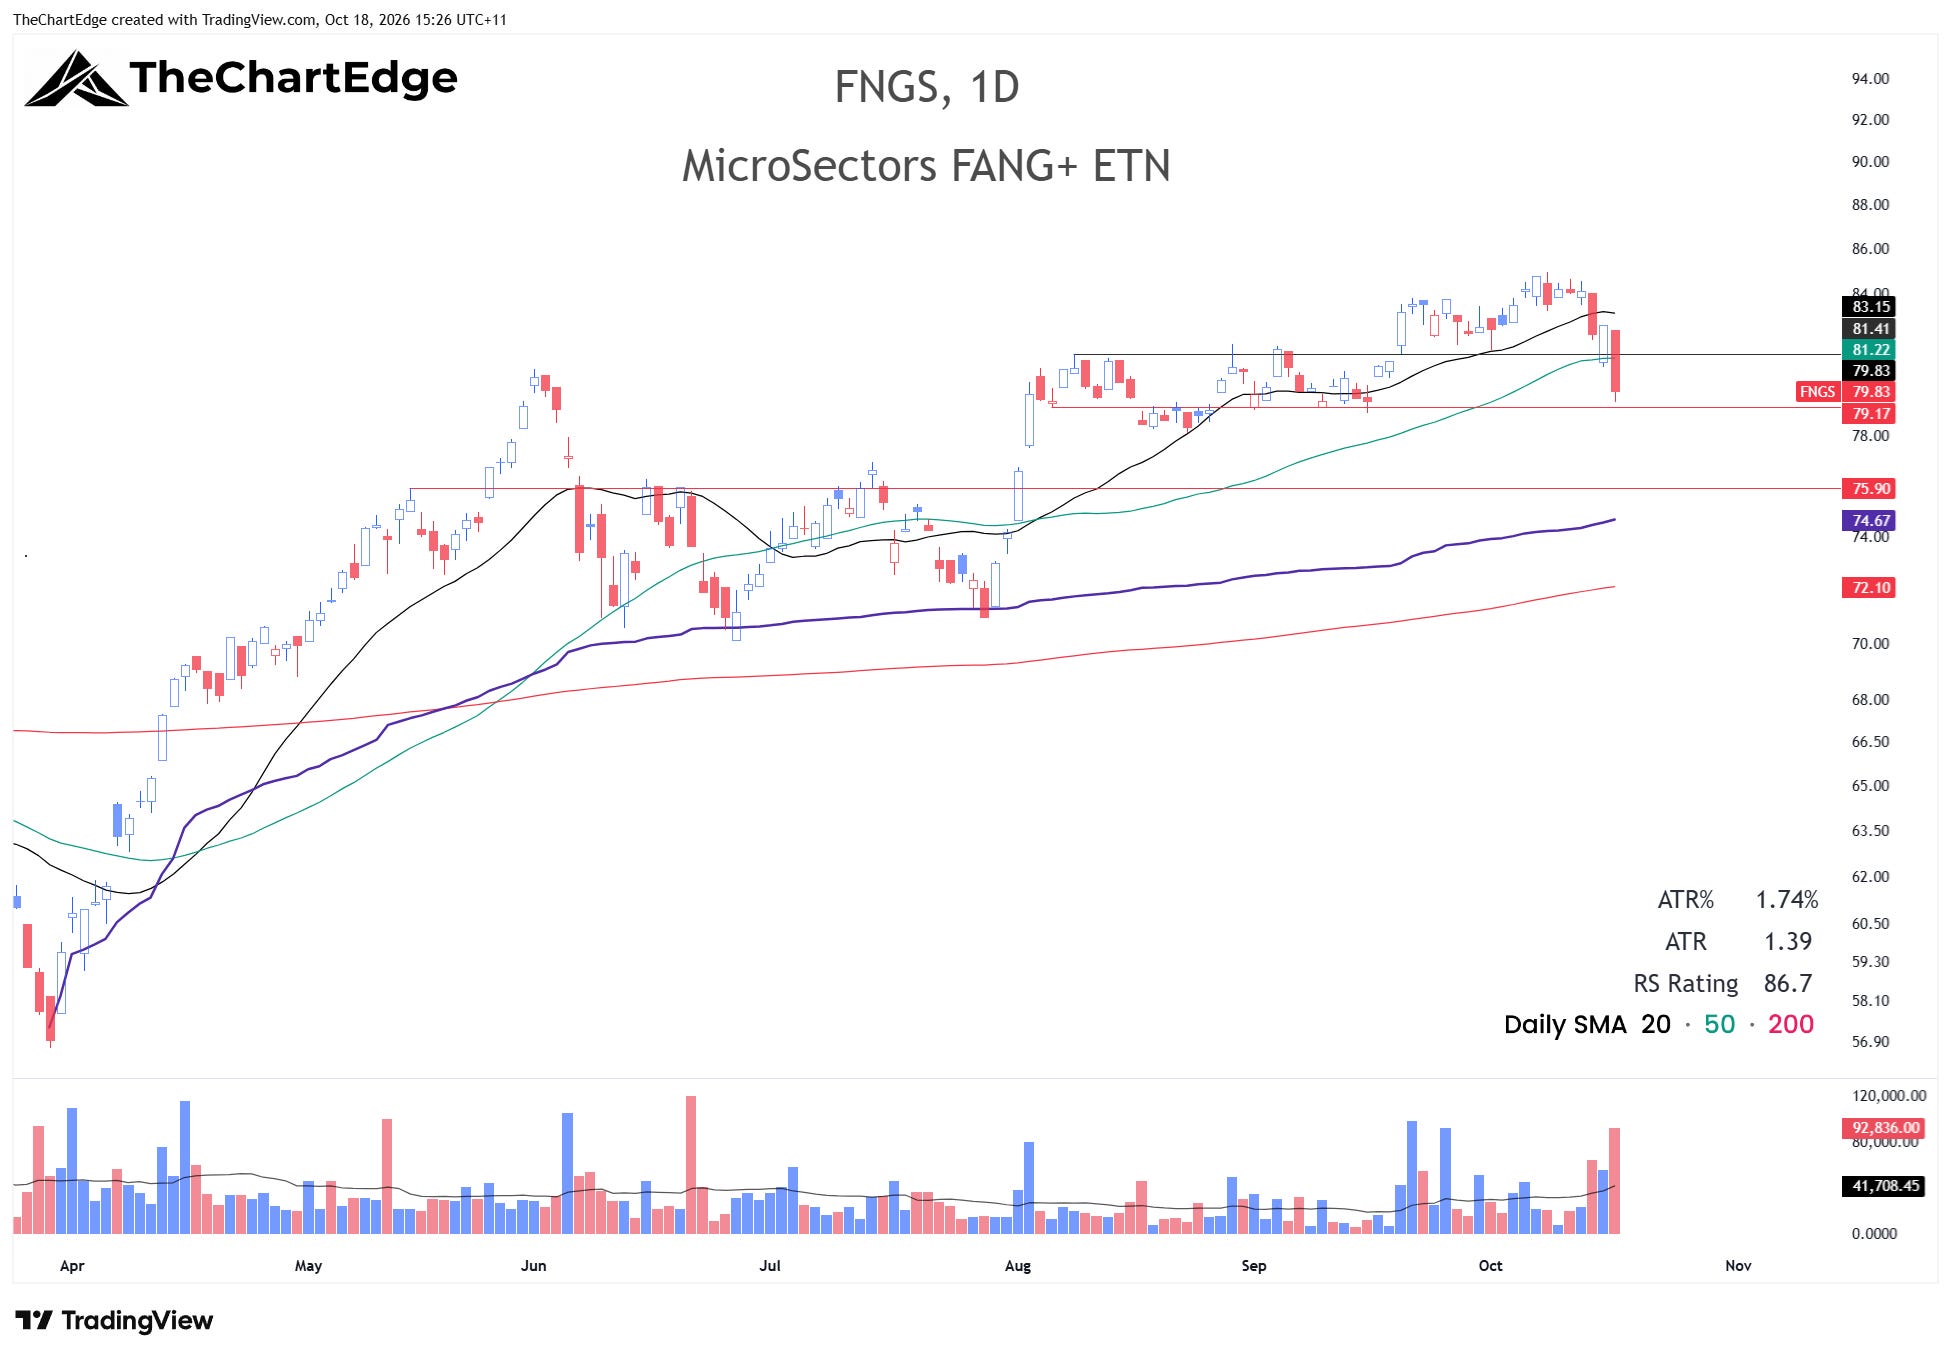
FNGS also had a bad week, closing at 79.83, below its 50-day SMA. If it can’t hold the 78.5 to 79 area, a deeper pullback to around 76 is possible.
Market Temperature
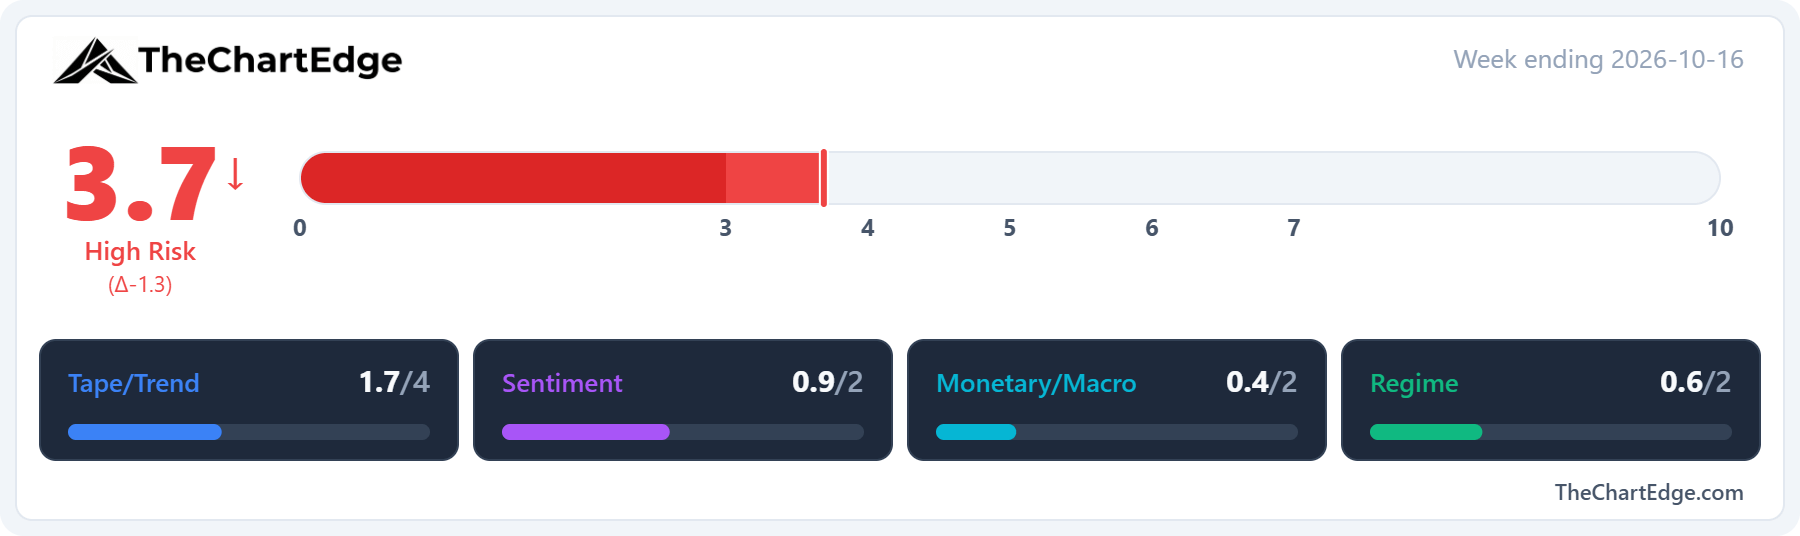
The Market Temperature came in at 3.7, down from 5.0, falling from the Goldilocks Zone straight into High Risk. It’s the first High Risk reading since the March correction.
The Tape/Trend and Regime pillars were responsible for nearly the entire decline. Most of the Tape/Trend fall came from SPY and QQQ both dropping out of Strong Uptrends, with SPY’s weekly RSI also dropping to 57.2 from 65.1. Breadth was little changed - 28.3% of US stocks finished above their 50-day moving average, from 28.9%, and the 200-day measure fell to 41.5% from 43.3%.
Within the Regime pillar, high beta (SPHB) versus low volatility (SPLV) flipped from risk-on to neutral, while value (IWD) versus growth (IWF) flipped from neutral to favouring value. The XLY/XLP ratio also fell about 5% on the week, as staples outperformed consumer discretionary.
The Sentiment pillar offset some of the fall, with the VIX rising to 20.0 from 14.8, which the model reads as a contrarian positive.
The Monetary/Macro pillar was close to flat. The US dollar eased slightly, as measured by UUP, which is now up 1.9% against its four-week comparison, from 3.4% last weekend. However, credit spreads widened and the MOVE index rose to 101.1 from 98.5. The 10 and 30-year yields dropped, closing at 5.10% and 5.44%, from 5.24% and 5.60%.
GICS Sector Relative Strength
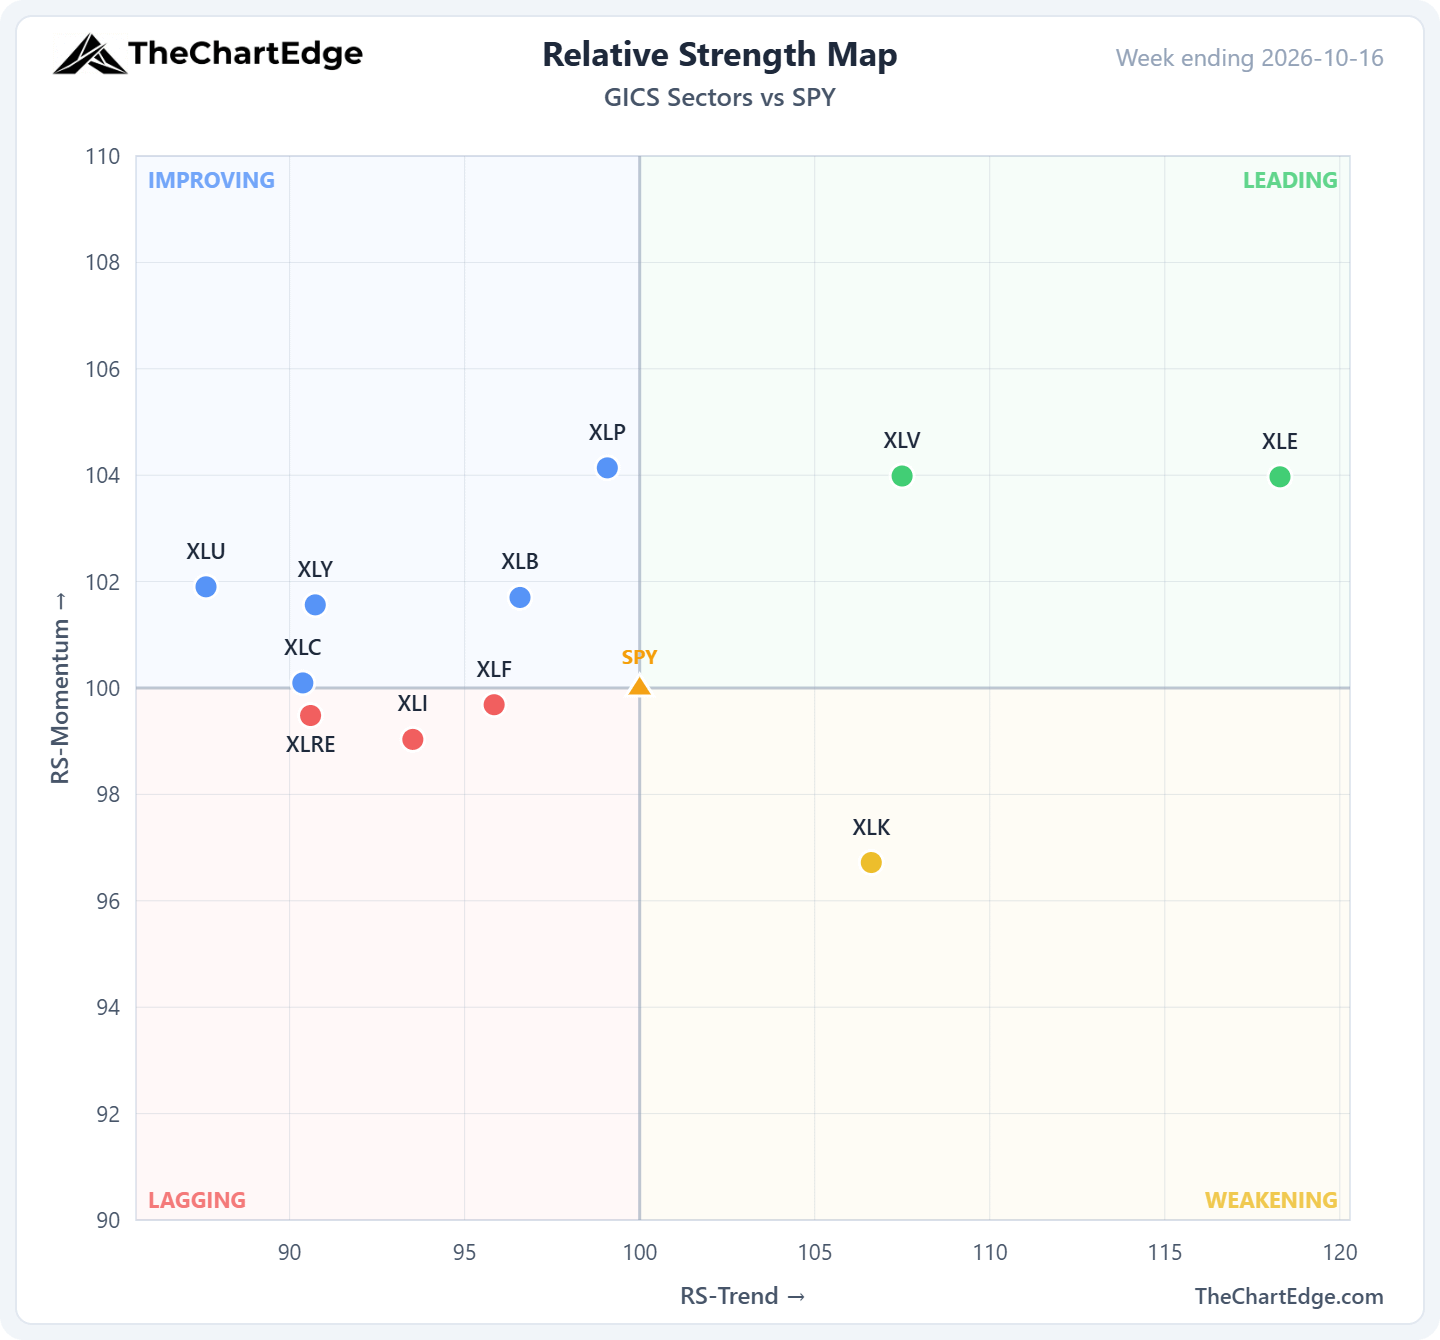
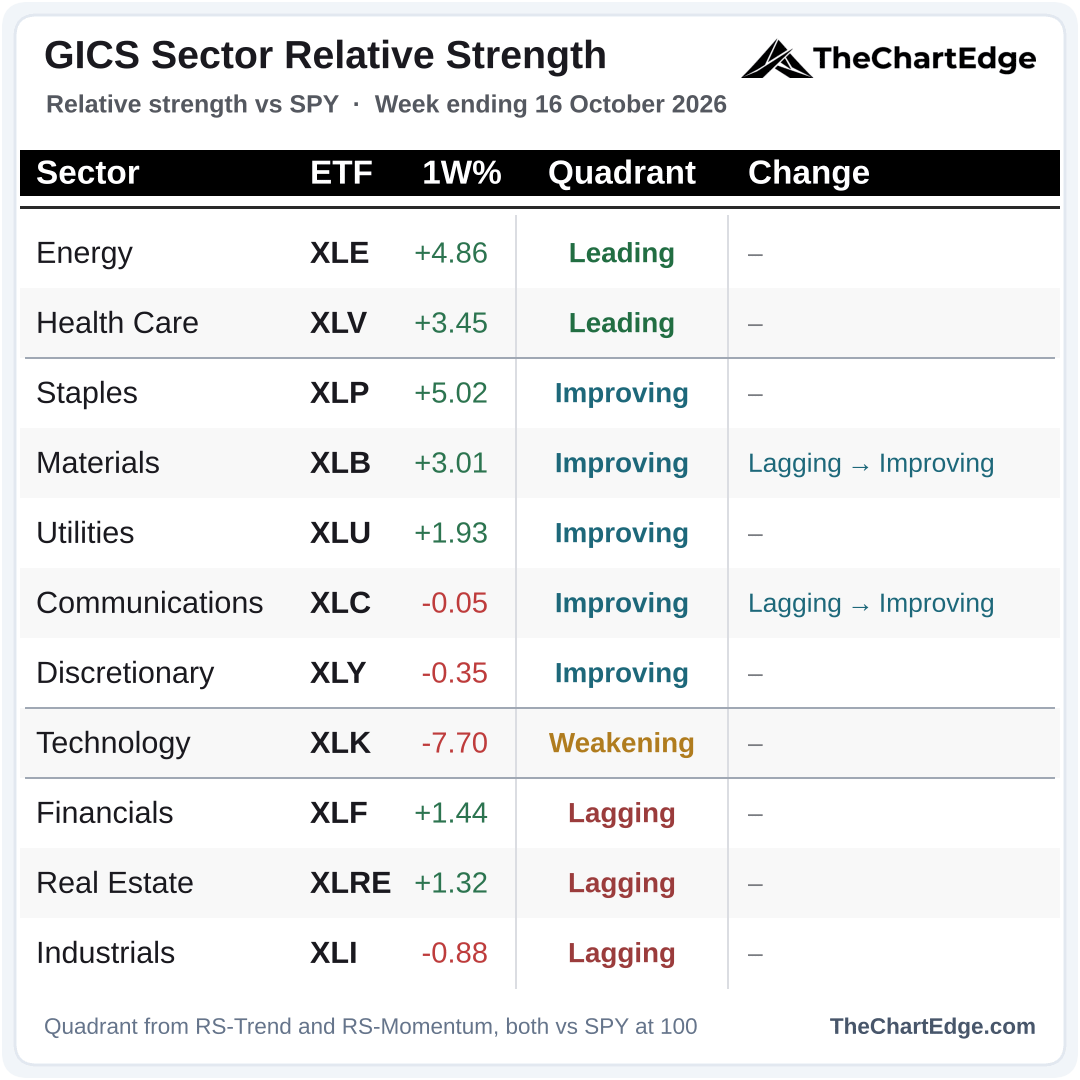
10 of the 11 sectors outperformed SPY - technology was the only one that didn’t. Staples, energy and health care led. Materials and communications both moved from Lagging into Improving. Energy and health care are the only two sectors in Leading, while technology remains in Weakening.
Momentum Leaderboard
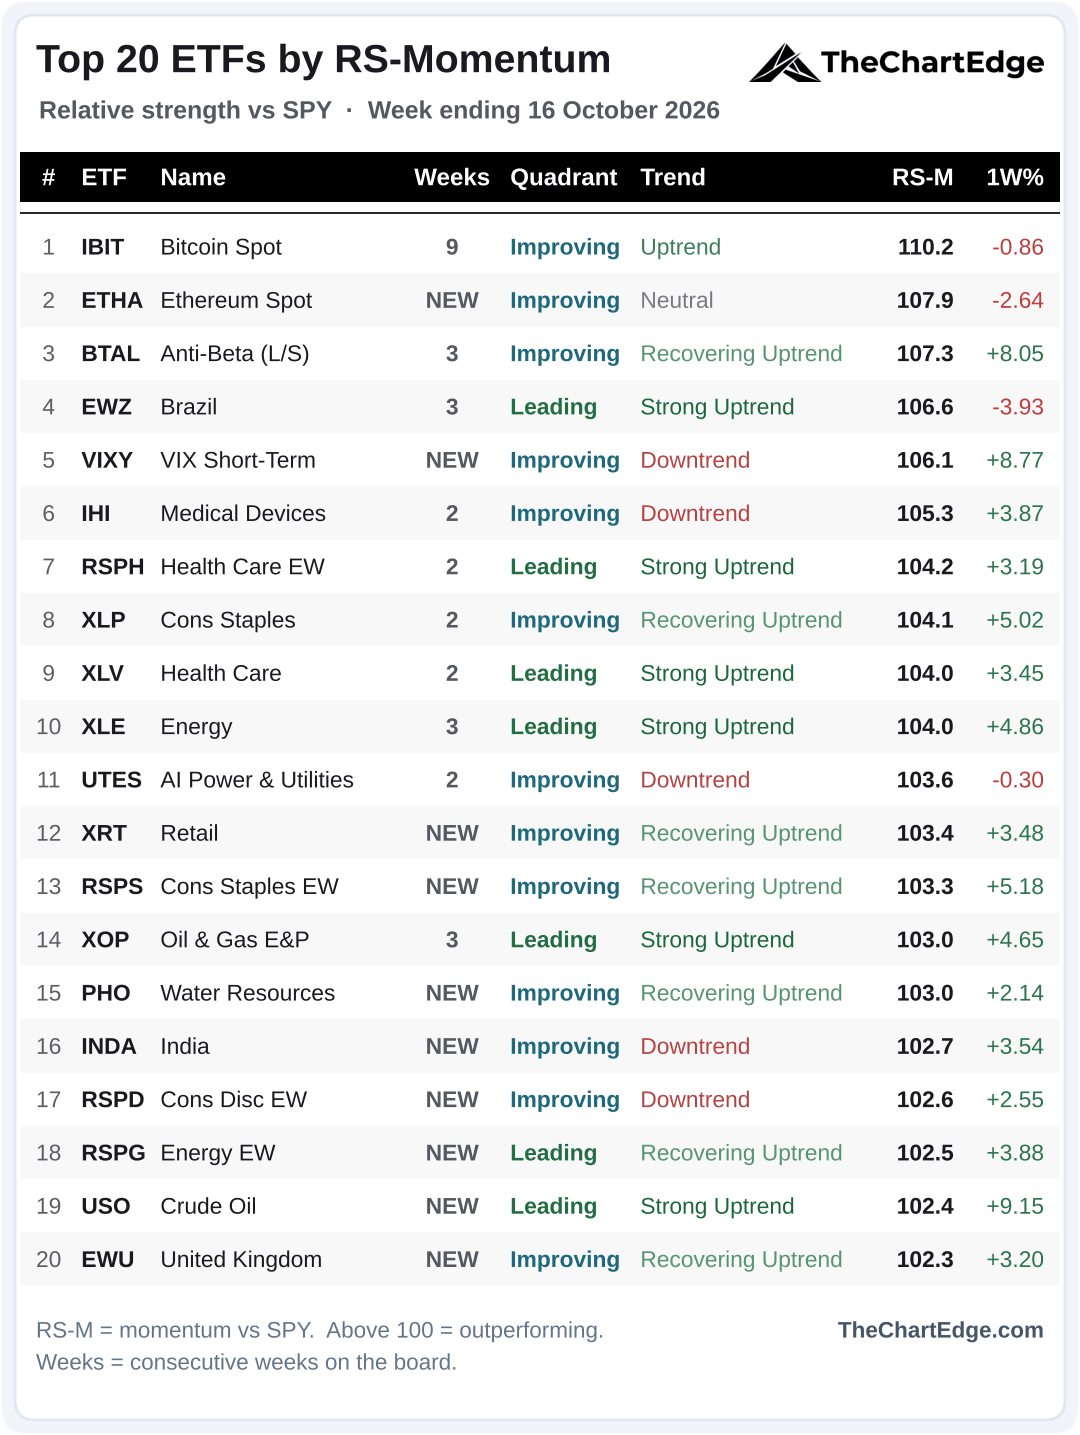
10 of the 20 are new again, and the rotation away from tech shows up clearly here with the following ETFs all falling off the board - cybersecurity (CIBR), software (IGV), equal-weight software (XSW), internet (FDN), FANG+ (FNGS) and digital infrastructure (IDGT) - along with China (KWEB and FXI), natural gas (UNG) and broad commodities (DBC).
In their place are the VIX (VIXY), equal-weight staples (RSPS), retail (XRT), water resources (PHO), equal-weight consumer discretionary (RSPD), India (INDA), the UK (EWU), crude (USO) and equal-weight energy (RSPG), and Ethereum (ETHA) is back after one week off.
The board has a risk-off look this weekend, with Anti-Beta (BTAL) at number 3 and VIXY at number 5.
Bitcoin (IBIT) takes number 1 and holds the longest streak on the board at 9. Only 6 of the 20 are in Strong Uptrends, from 10 last weekend, and 5 are in downtrend states.
Trend States Across the Universe
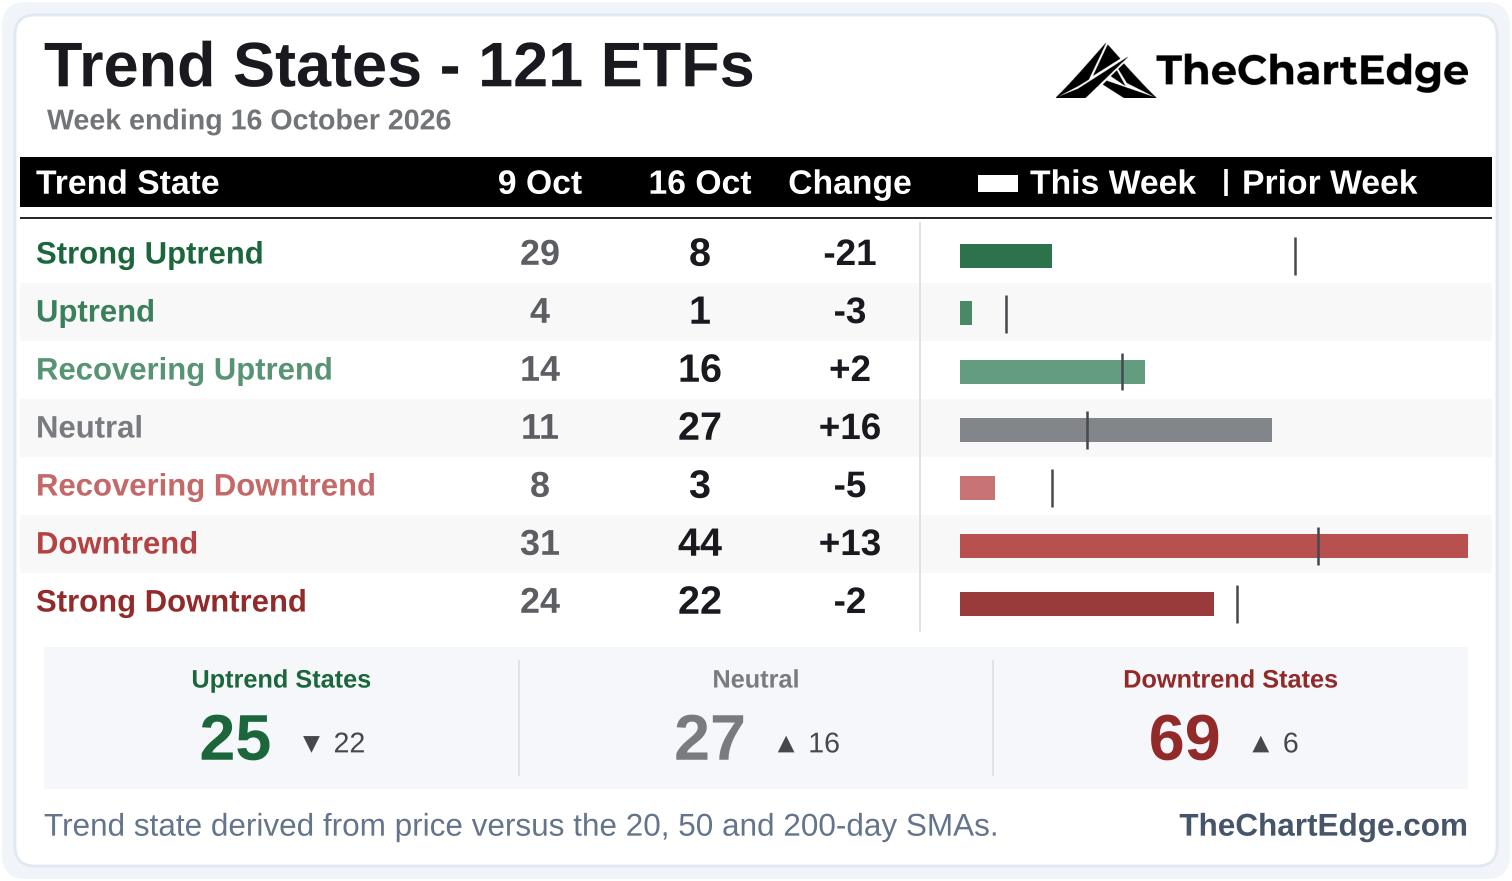
Quite a nasty turn here. Strong Uptrends fell from 29 to 8, and none of the 8 are tech - energy (XLE, XOP and USO), broad commodities (DBC), health care (XLV and RSPH), the US dollar (UUP) and Brazil (EWZ). Equal-weight semis (XSD), generative AI (CHAT) and AI innovation (BAI) went straight from Strong Uptrends to Downtrends in a single week.
The ETFs that moved up into uptrend states were mostly defensives and financials, including staples (XLP and RSPS), low volatility (SPLV), Anti-Beta (BTAL), insurance (KIE), financials (XLF and RSPF), plus retail (XRT), materials (XLB), water resources (PHO) and the UK (EWU).
Industry Breadth - Leading Stocks
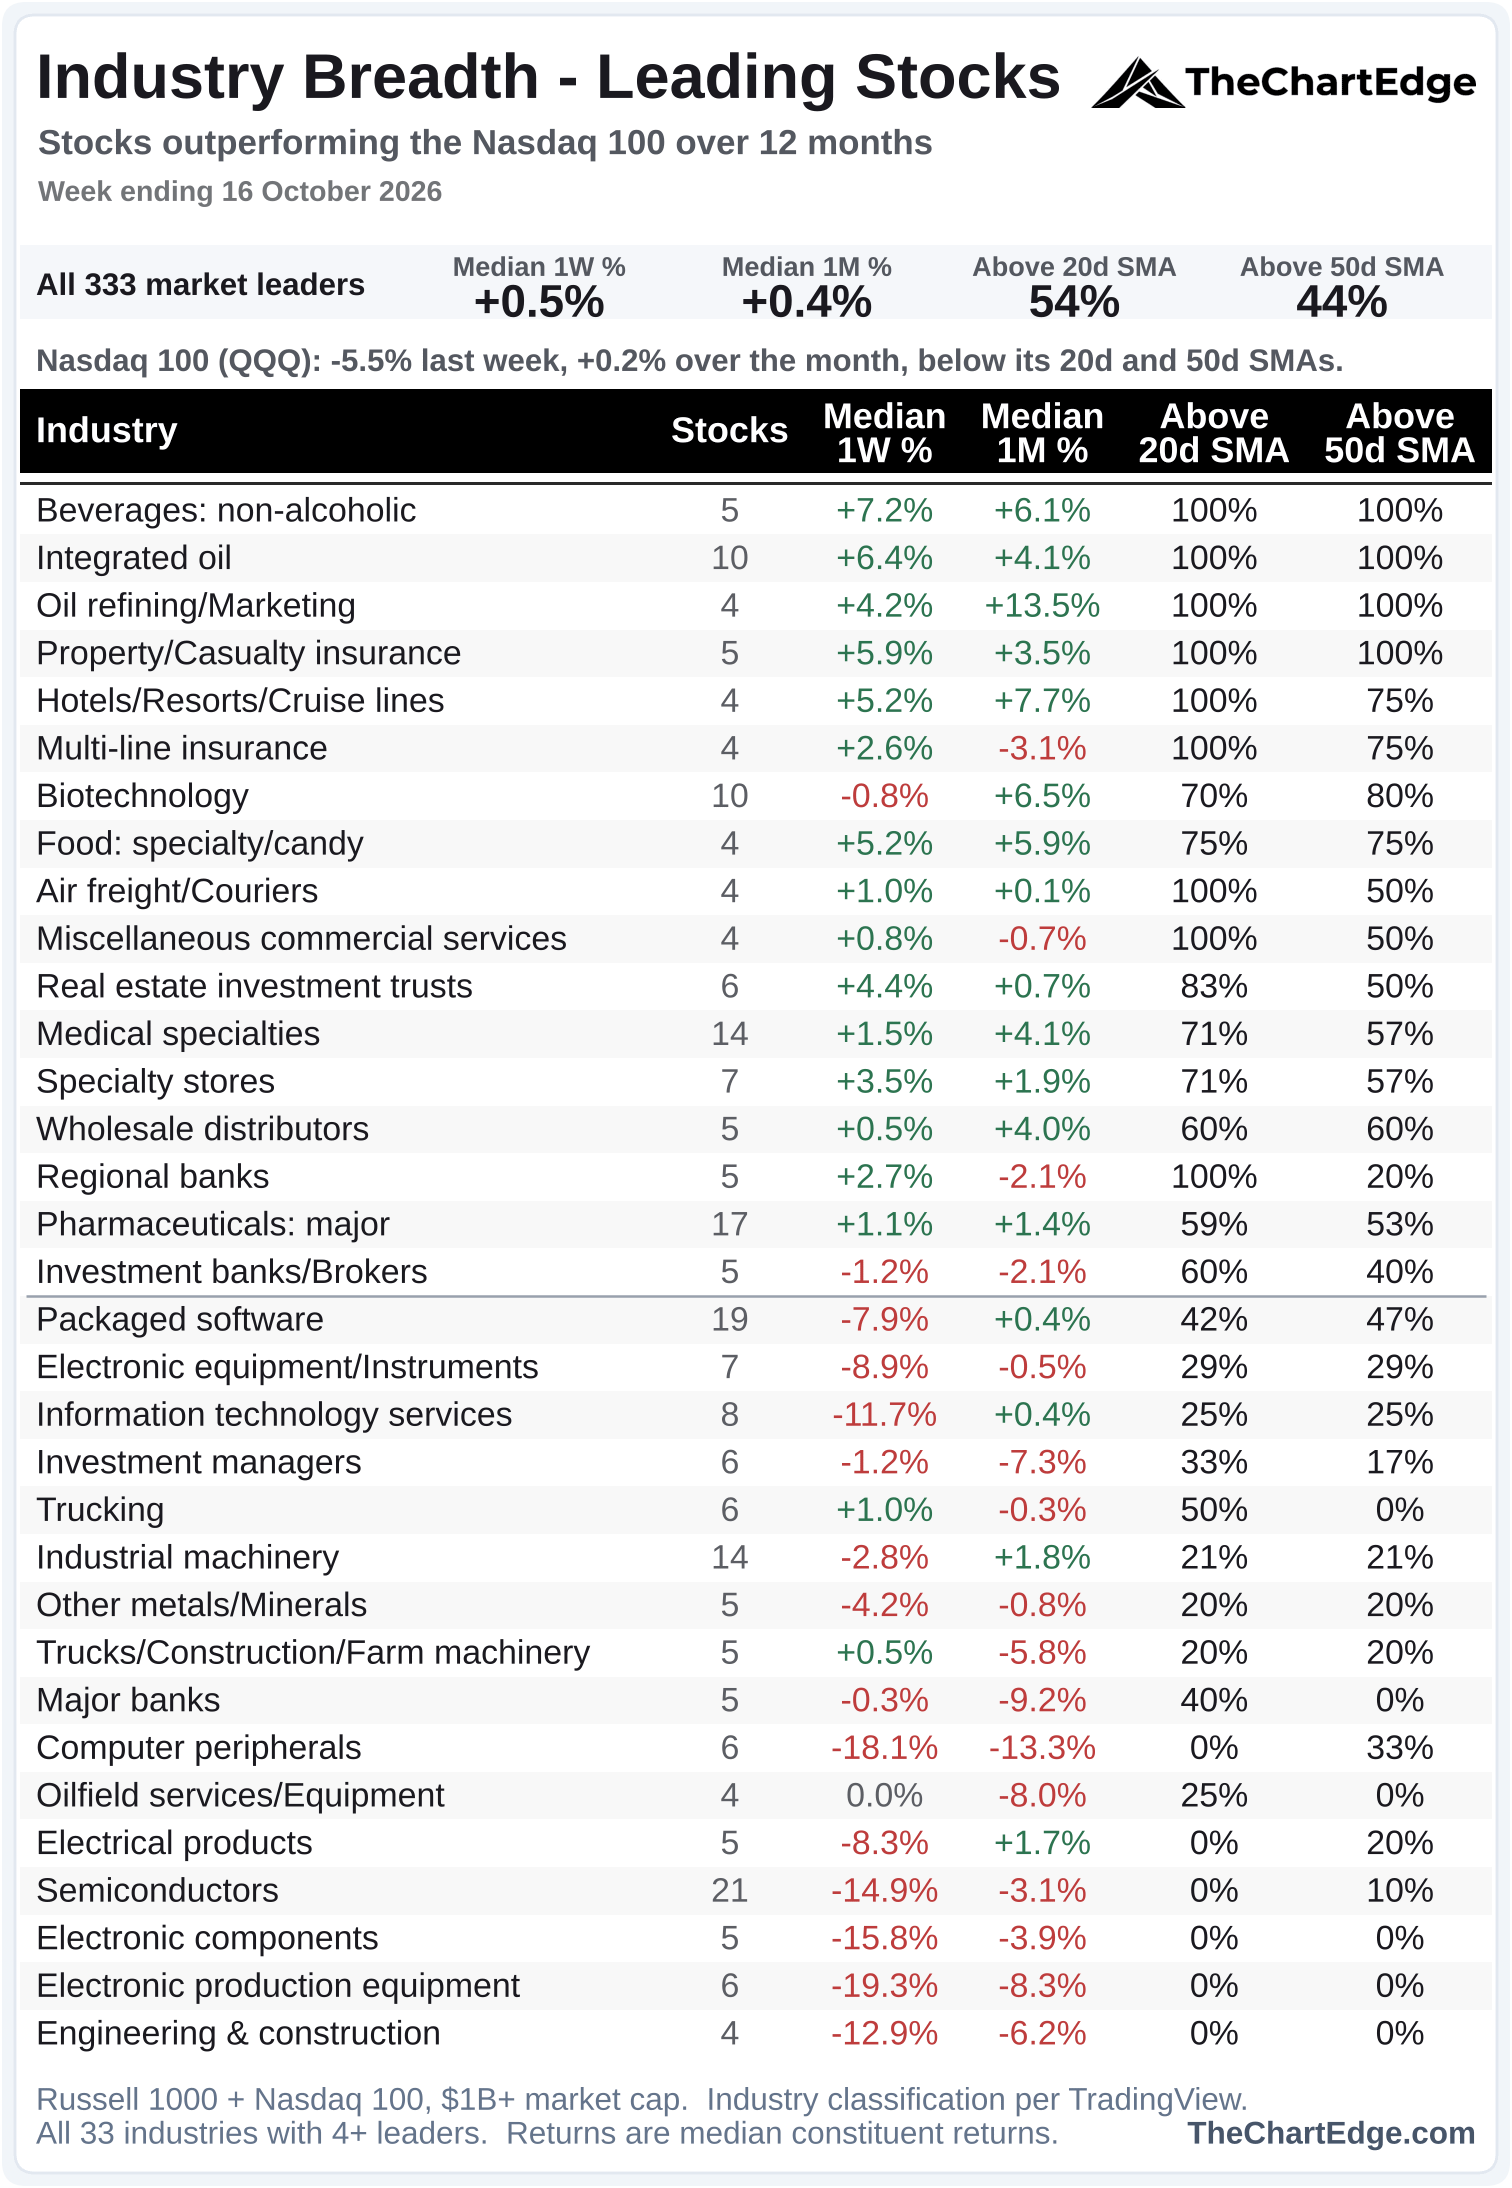
Tech also dropped down this board. Packaged software is now the first industry below the 50% line, falling from 5th to 18th, and IT services dropped from 1st to 20th. Semiconductors, electronic components, electronic production equipment and engineering & construction are the bottom 4 industries, with none of their names above the 20-day SMA.
The universe grew by 66 names as QQQ’s own 12-month return fell, and the newcomers were mostly lower-beta names - banks, insurers, staples and health care - which flattered the aggregate figures. Of the names that were in it both weeks, the share above the 20-day SMA fell to 45% from 68%.
Tech, Semis & AI Get Hit Hard
The 6 worst performers of the 121 ETFs I track last week were crypto miners (WGMI), South Korea (EWY), AI innovation (BAI), generative AI (CHAT), equal-weight semis (XSD) and AI (THNQ). Semiconductors (SMH), cybersecurity (CIBR), digital infrastructure (IDGT) and quantum & AI (QTUM) were 9th to 12th.
Semiconductors (SMH) Chart
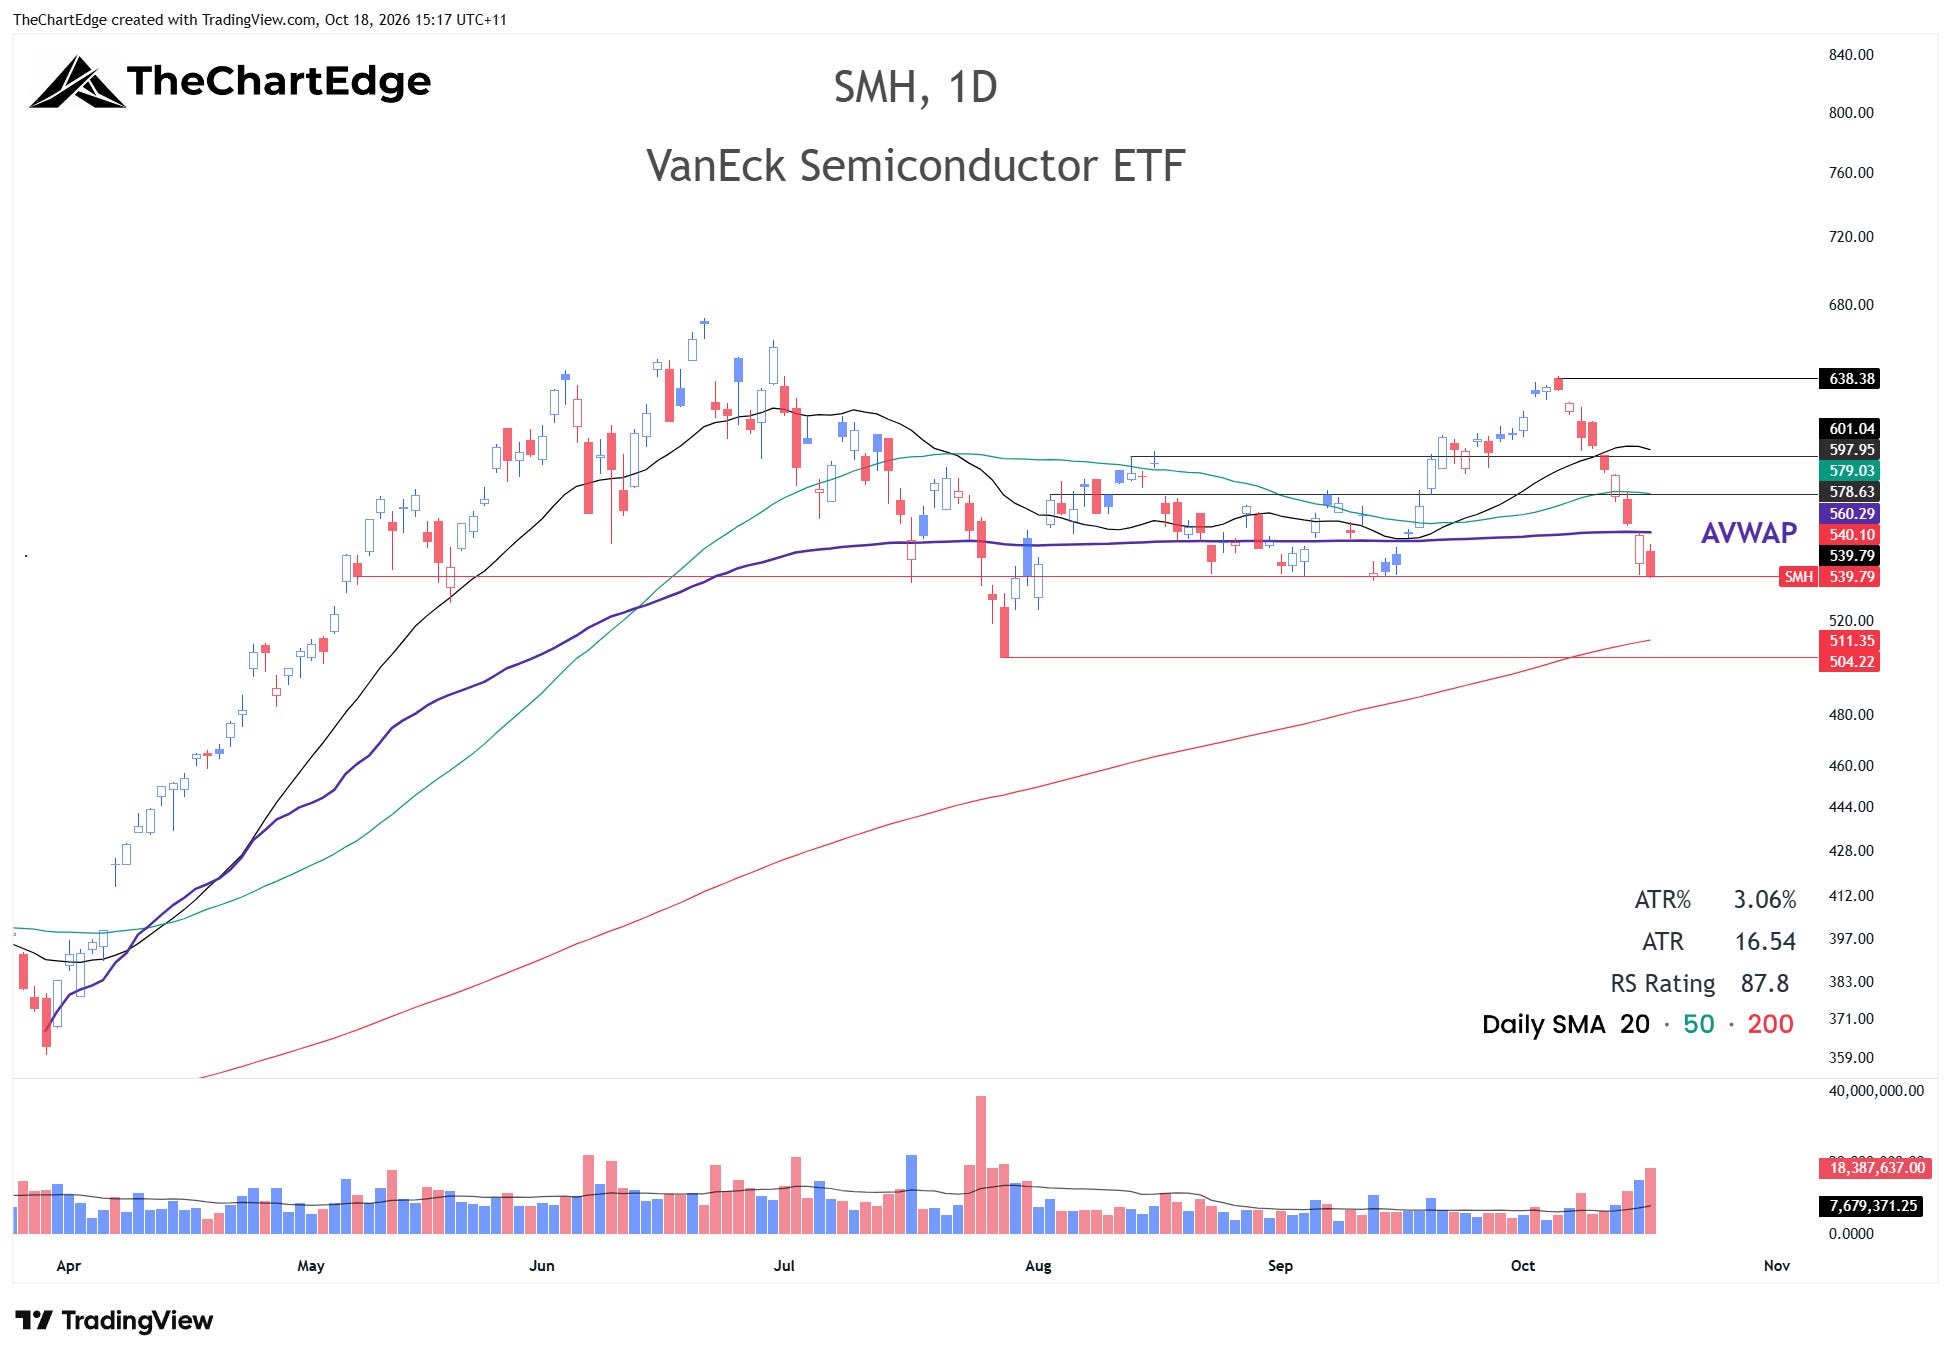
Last weekend I said a close below 598 would be a red flag for SMH, but I wasn’t expecting such an extreme move. It closed the week at 539.79, down 10.5%. If it can’t hold the 540 area, which acted as support multiple times between late August and mid-September, a test of the 200-day SMA around 511, and maybe the July 29 low around 504, looks likely.
Software (IGV) Chart
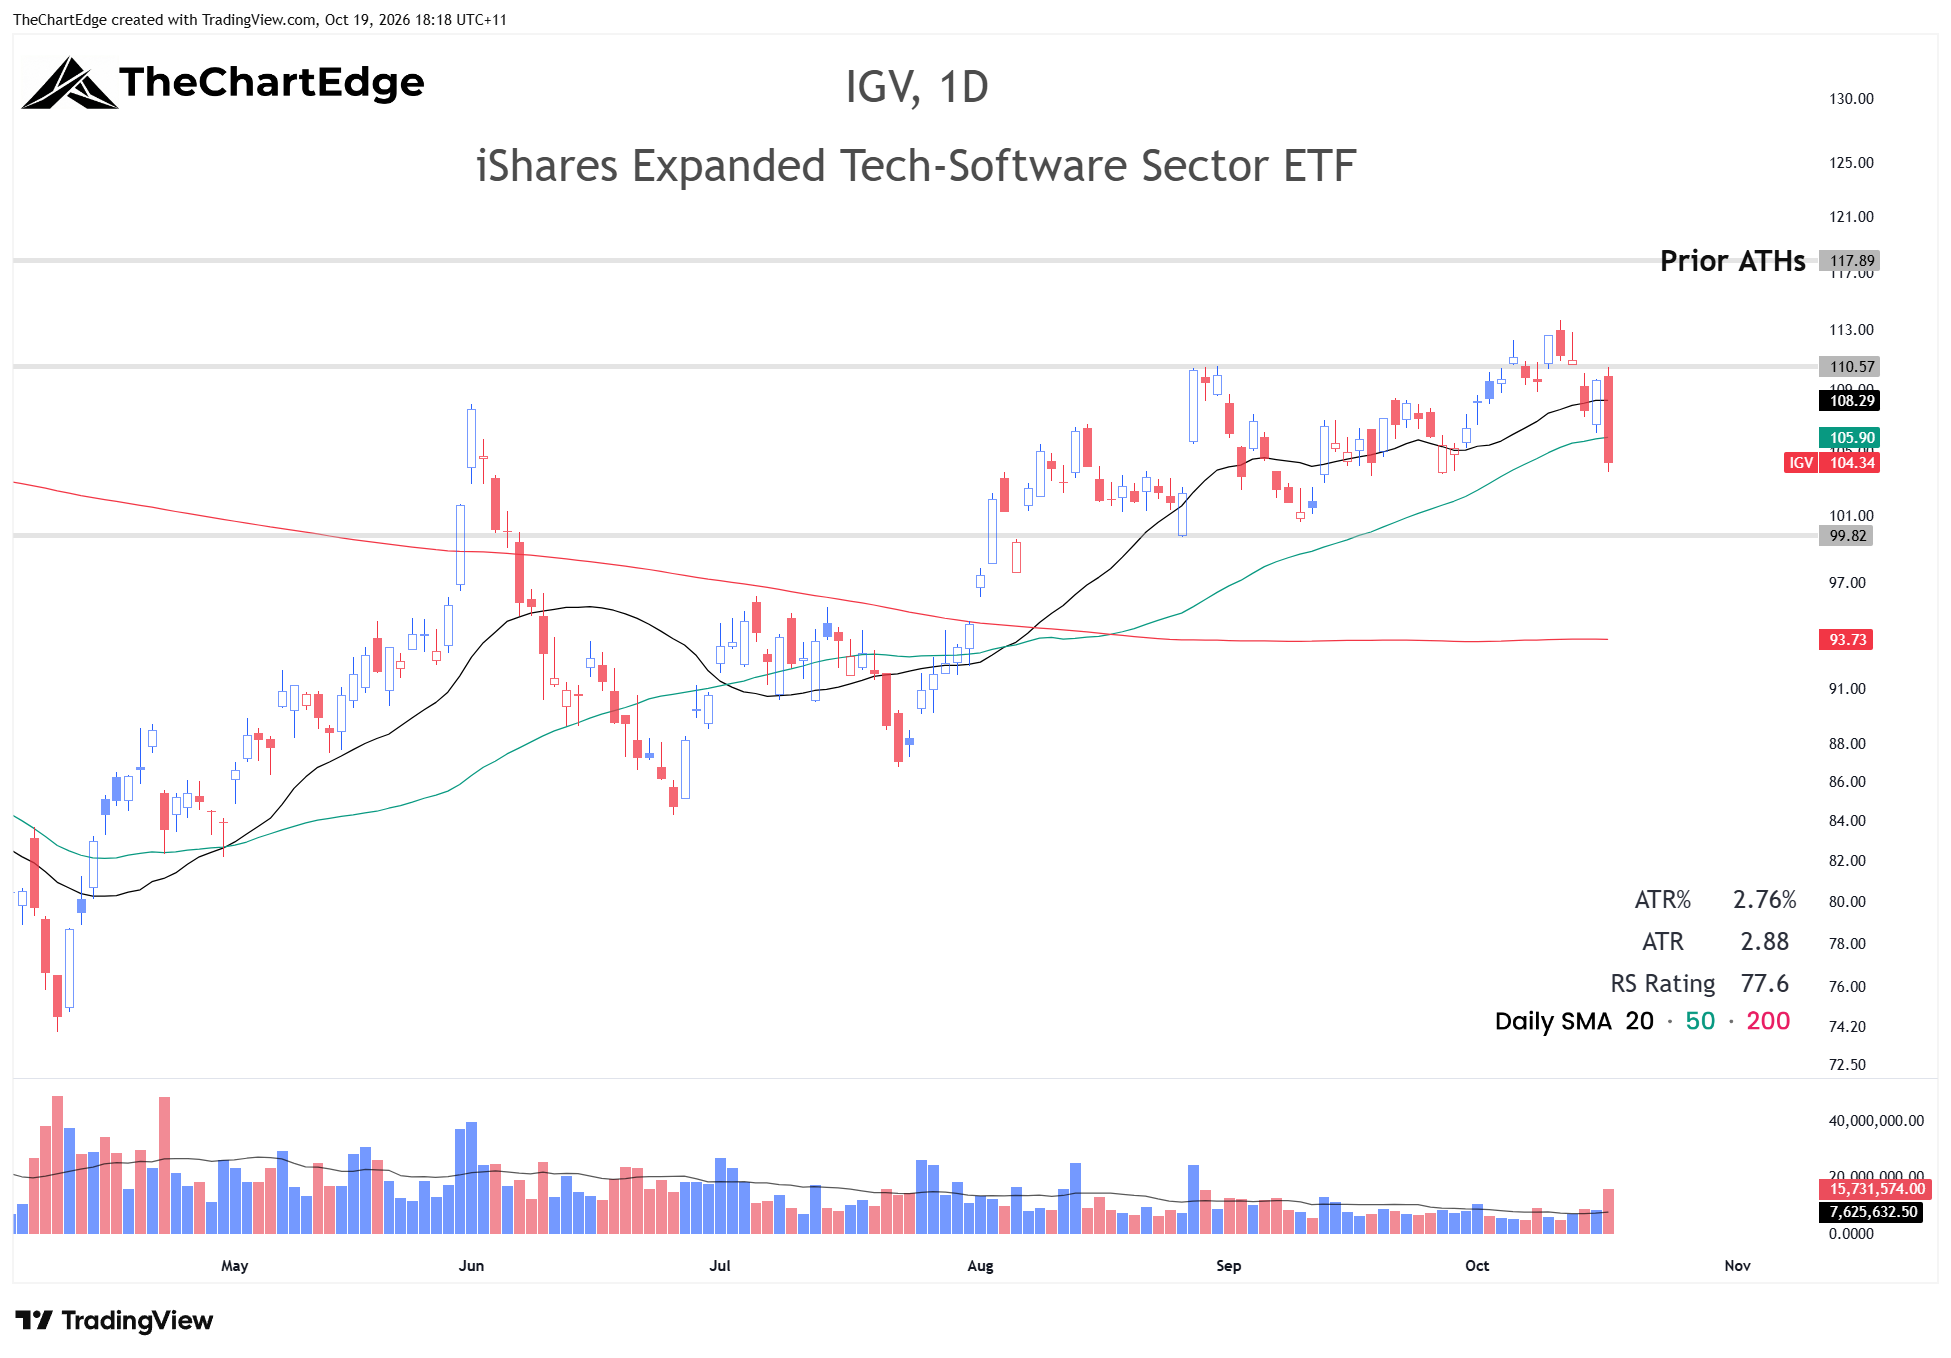
Last weekend IGV closed above resistance around 110.50 and looked like it might make a run at its 2025 all-time high just under 118. Instead, it fell 7.4% and closed at 104.34, after a huge bearish engulfing candle on Friday.
Generative AI (CHAT) Chart
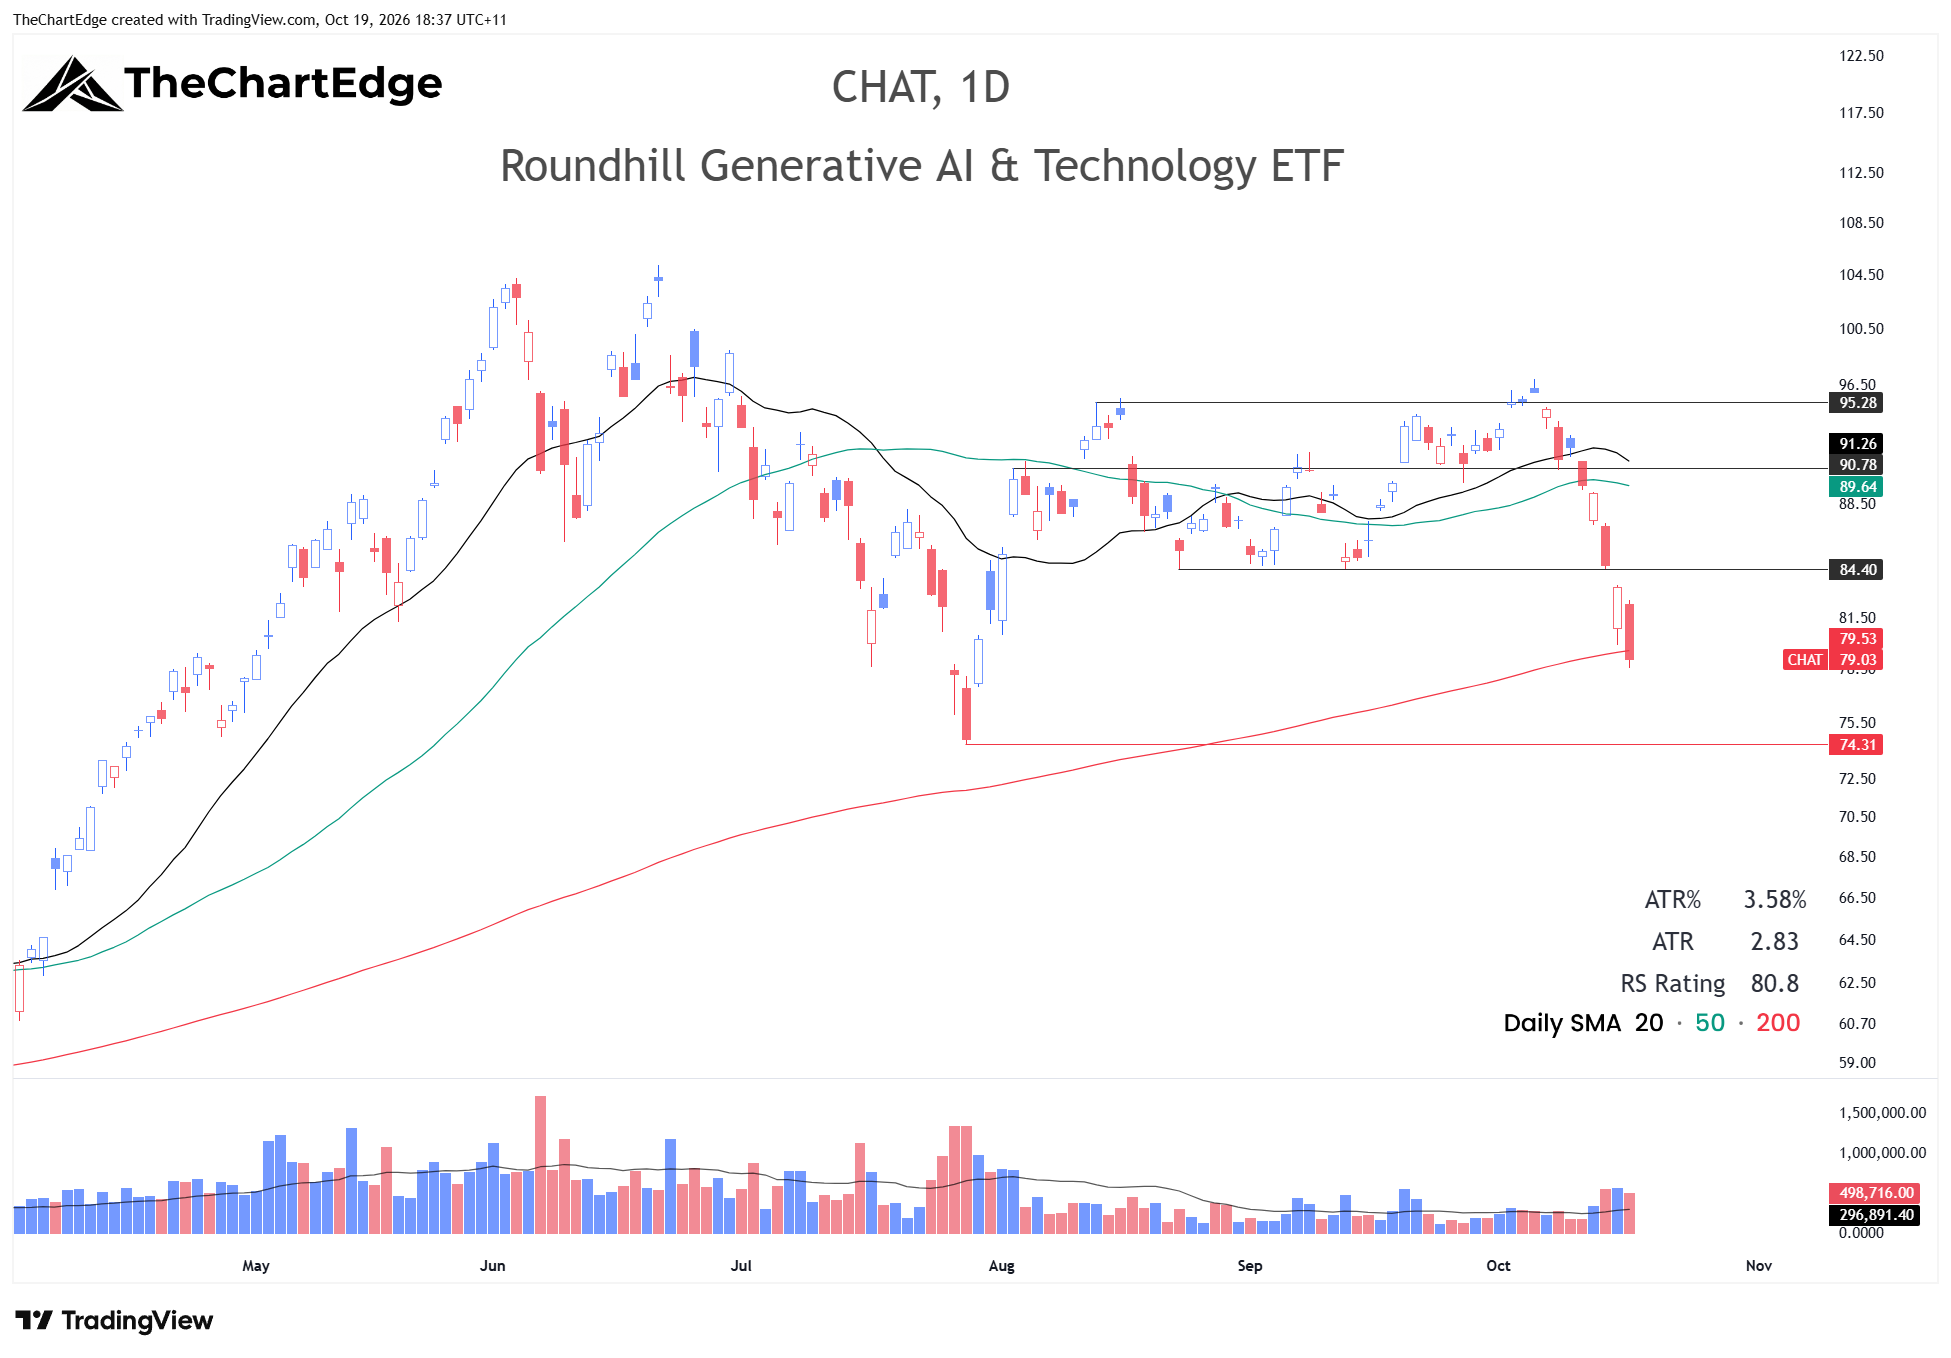
CHAT fell 14.3% to close at 79.03, just below its 200-day SMA. It was down every day last week.
Crypto
Bitcoin outperformed Ethereum again last week and looks much better on the chart.
Spot Bitcoin Chart
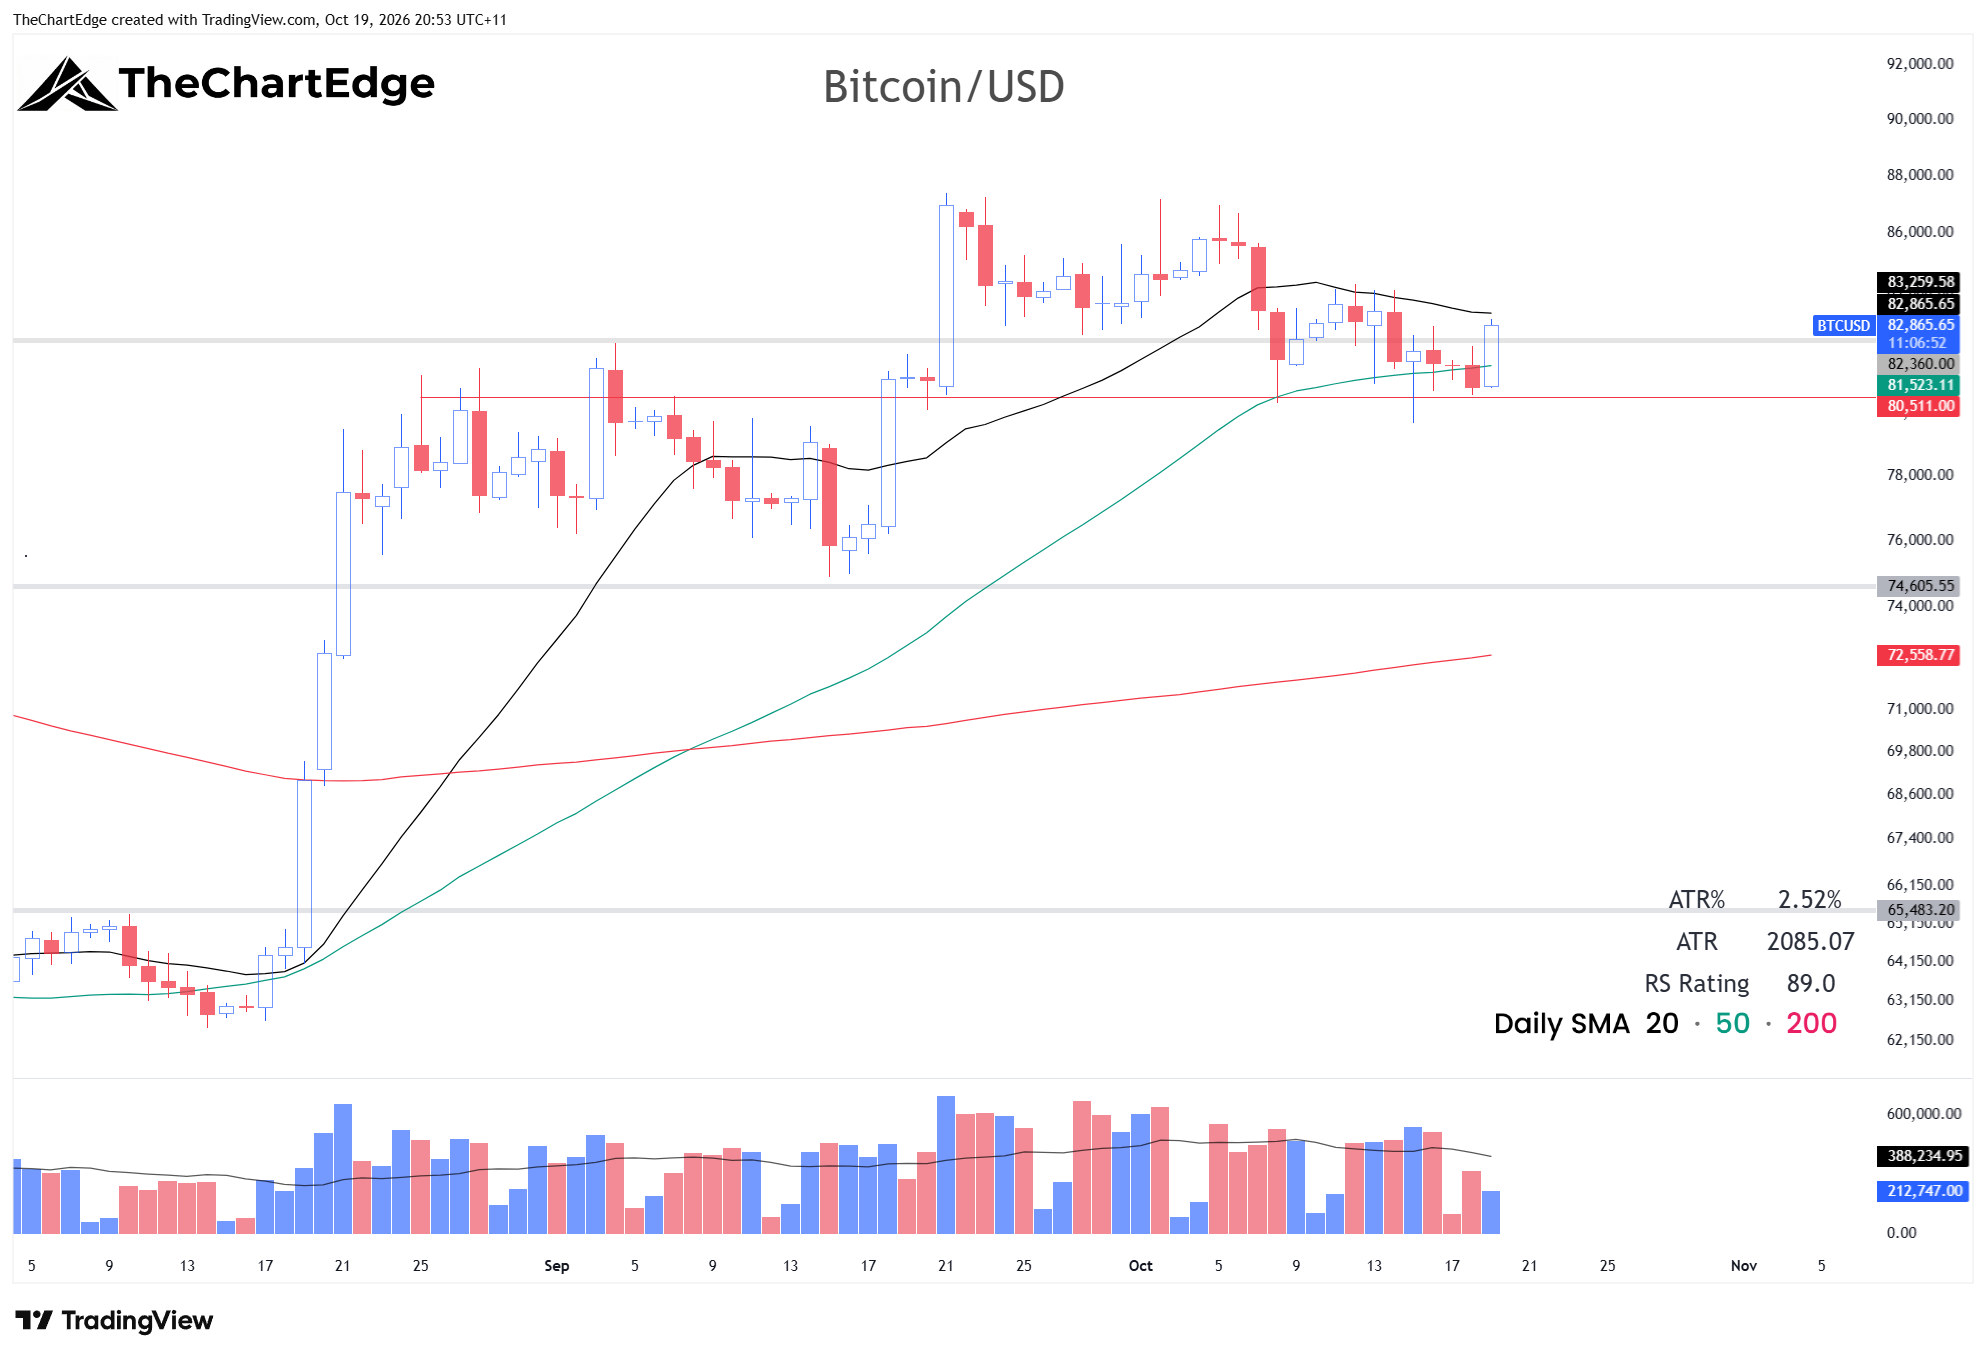
Bitcoin got turned away at its 20-day SMA last week, but managed to hold around its 50-day. It’s up so far today, trading around 82,865 on Monday evening Melbourne time.
Spot Ethereum Chart
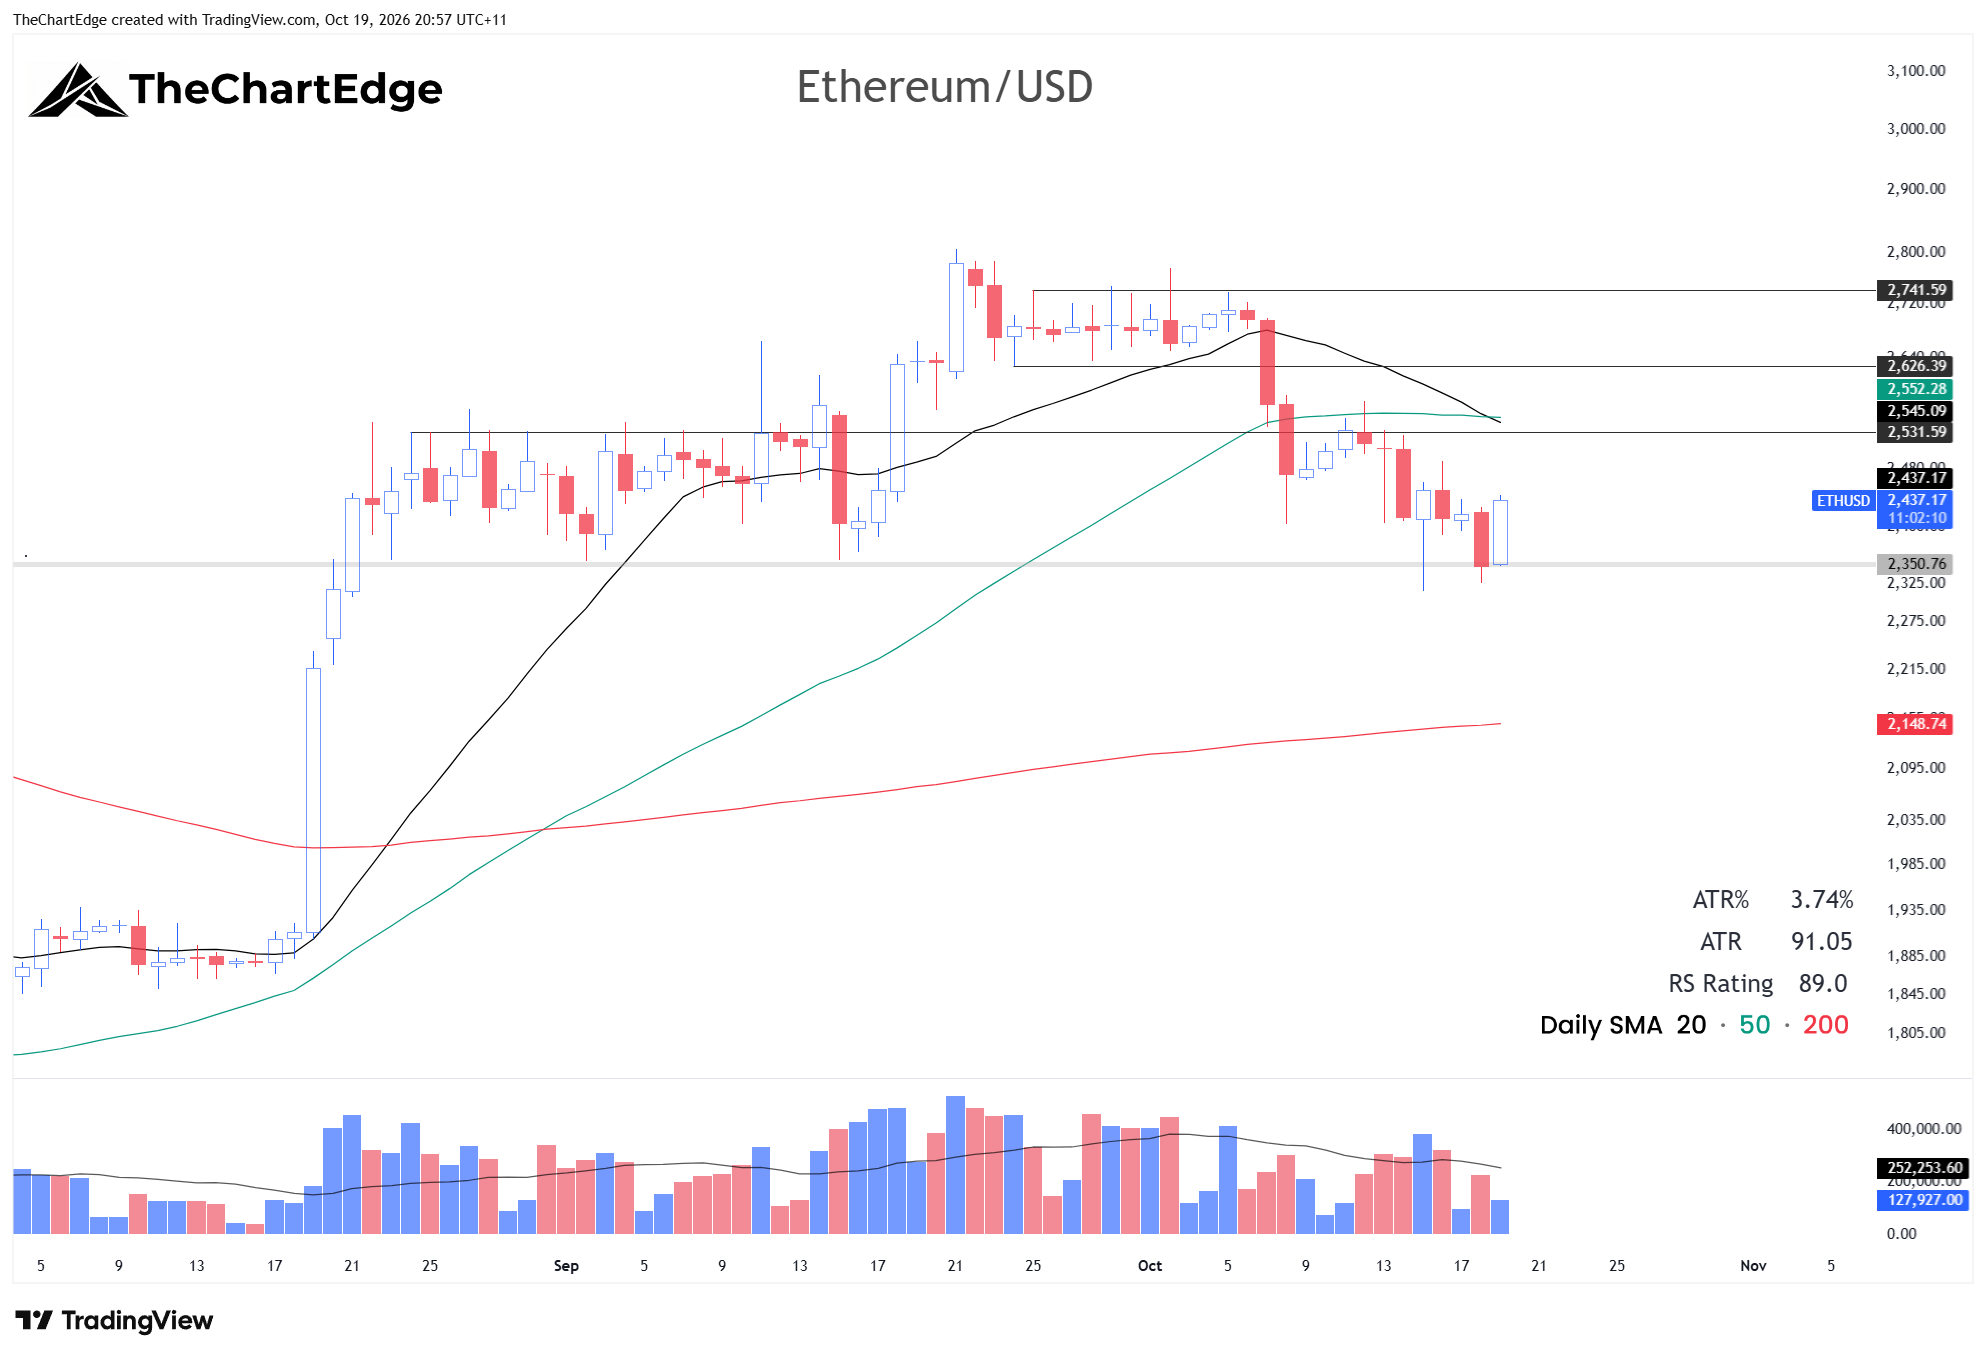
Ethereum was already below its 50-day at the start of last week and couldn’t reclaim it on Monday. It pulled back from there, briefly undercutting 2350, but has reclaimed that level and is up so far today. It’s currently trading around 2430, but is still a fair way below its declining 20-day, which is just below its 50-day SMA.
Trades & Follow-Ups
I was stopped out of all 4 of my positions last week. Semtech (SMTC) stopped me out for a relatively small loss on Monday’s open, and Snowflake (SNOW) the same day at breakeven. Moderna (MRNA) followed on Tuesday, also at breakeven. Cloud computing (FCLD), which I had been holding since early September, gapped down through my stop and took me out on Thursday.
My swing trading style has not suited the environment over the last few months, and I have been stopped out repeatedly. However, I have kept my drawdown to a minimum by keeping my positions small, trying not to overtrade and always honouring my stops.
Semtech (SMTC) Chart
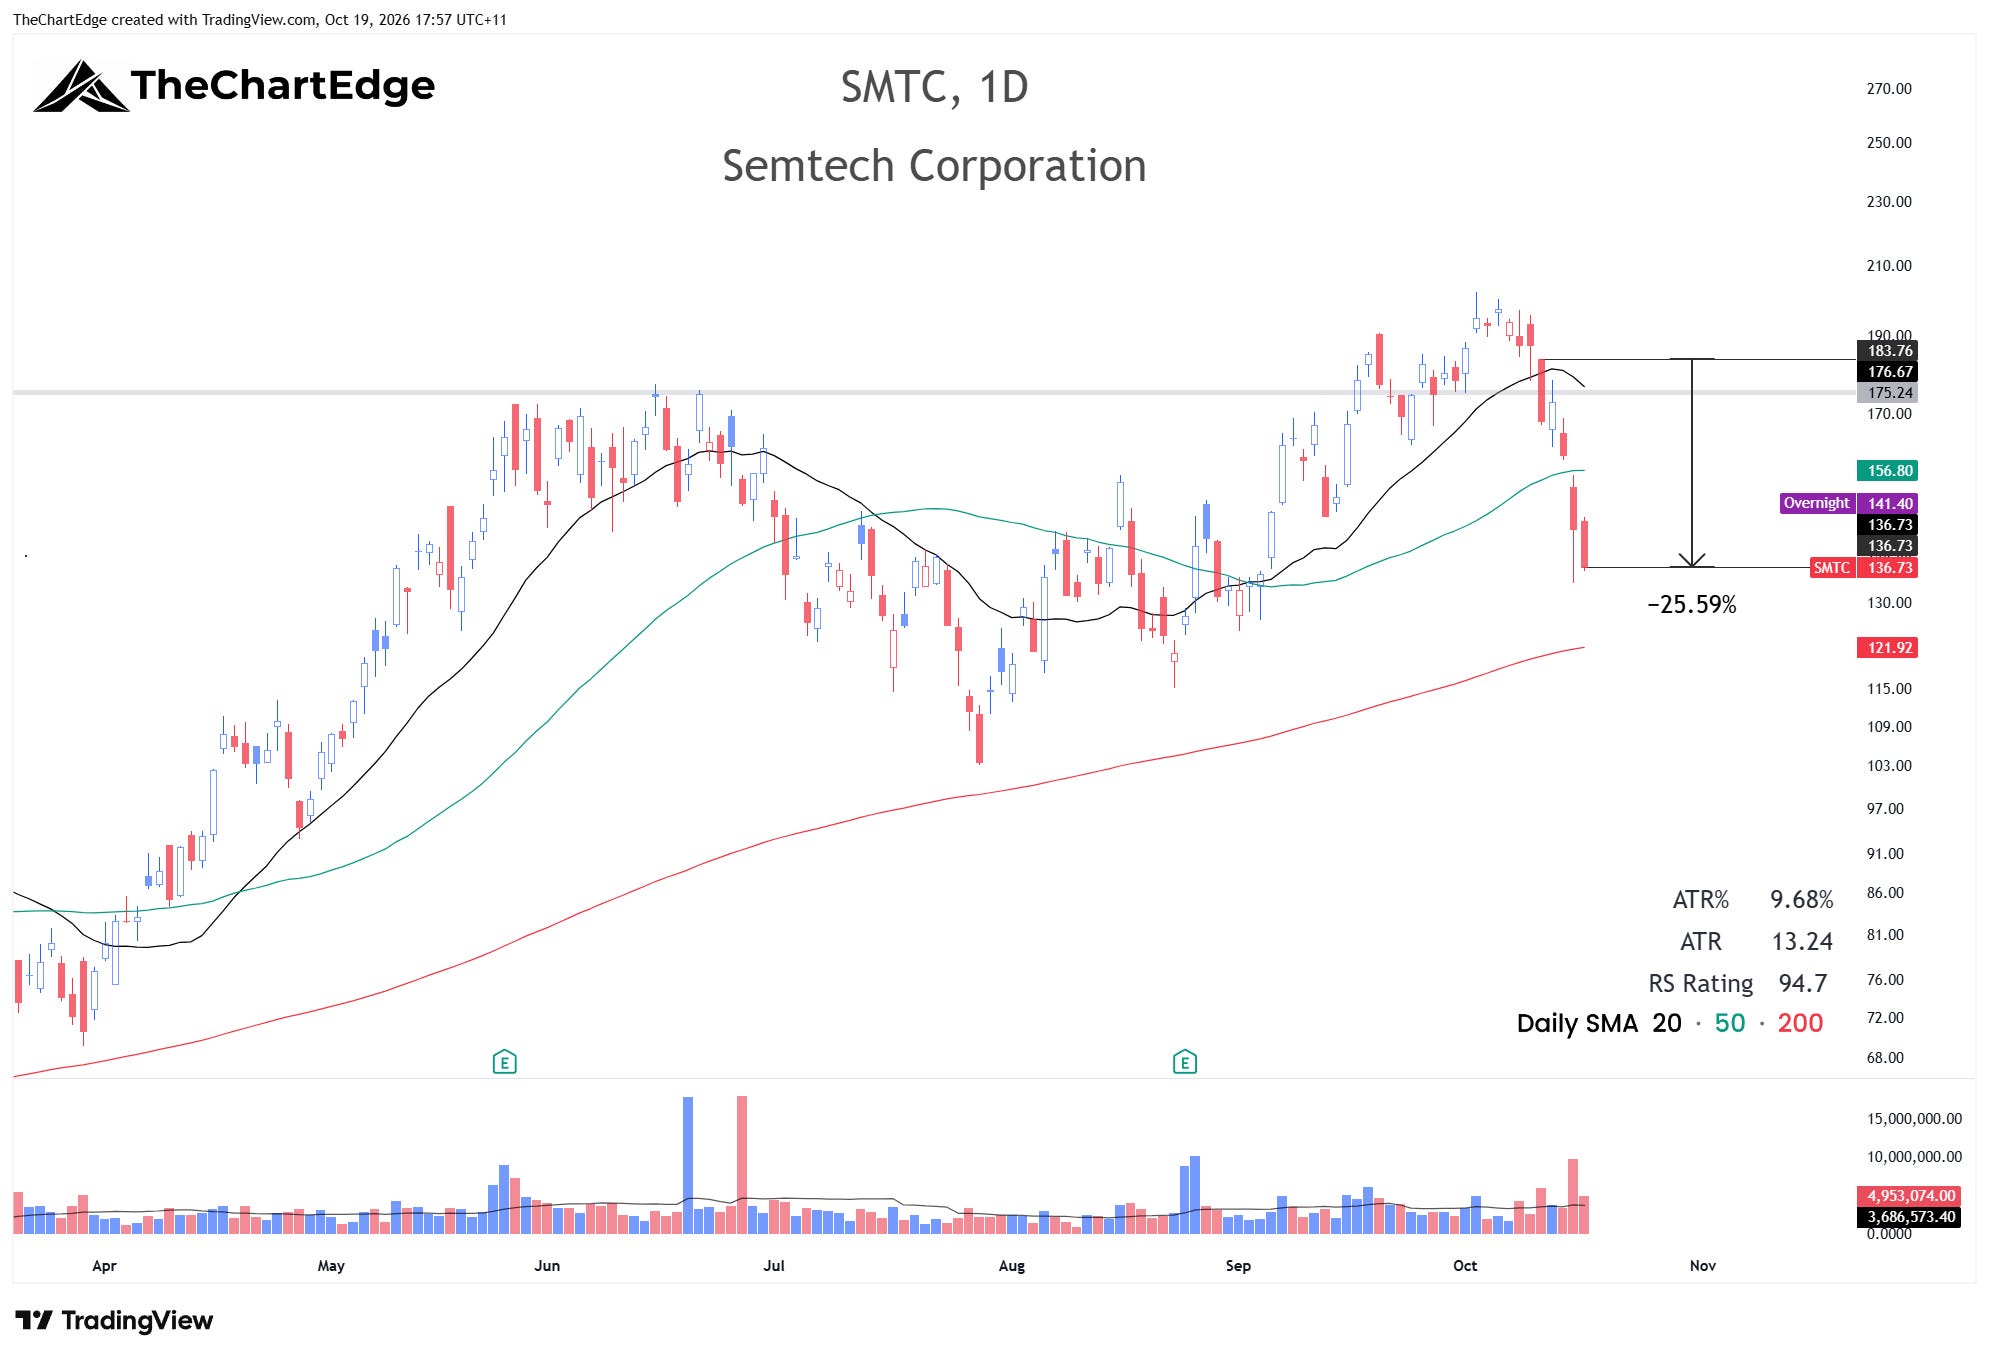
SMTC is a great reminder as to why you should always have a stop and honour it when swing trading. It looked great two weeks ago, above its June high and not far from its all-time high. After gapping down on Monday and stopping me out, it proceeded to fall a further 25% in 5 trading days - quite the move.
The Week Ahead
The Market Temperature is now in the High Risk Zone. I am completely flat and plan to just wait and watch this week. Even if we get an oversold bounce, I’m going to be patient looking for new swing trades. A lot of charts look broken after last week and will probably need time to repair, and that’s assuming there isn’t another leg down. Earnings also heat up this week - of particular interest to me are SpaceX (SPCX) on Tuesday, Tesla (TSLA), Meta (META) and Lam Research (LRCX) on Wednesday, and Bloom Energy (BE), MaxLinear (MXL) and Western Digital (WDC) on Thursday, all after the close.
Stay open-minded and manage risk carefully.
Cheers,
Marcus Grant, CFTe
Disclaimer: The content provided in this newsletter is for informational and educational purposes only and should not be considered as financial, investment, or legal advice. It is general information only and does not take into account your objectives, financial situation or needs. The information shared is based on our research and analysis, but we are not a licensed financial advisor, nor can we guarantee its accuracy, completeness, or timeliness. Market conditions and financial instruments can change rapidly, and any opinions expressed may not be suitable for all investors. Any opinions expressed and/or securities mentioned do not constitute a recommendation to buy, sell, or hold that or any other security. You should conduct your own due diligence and consult with a licensed financial advisor or other professional before making any investment decisions. Past performance is not indicative of future results, and all investments carry the risk of loss. The authors and publishers of this newsletter are not responsible for any financial decisions made based on the content provided herein. By reading and/or subscribing to this newsletter, you acknowledge and agree that you are using the information at your own risk.