

Market Temperature at 6.9 - One Tick From Surge
Breadth is surging, growth is waking up, and the AI complex is running hard.

Last week was a big week across the board. The S&P 500 (SPY) gained a little over 4.5%, the Nasdaq 100 (QQQ) surged just over 6%, and FANG+ (FNGS) led the way with a little over 7% move. Small caps weren’t left behind either - the Russell 2000 (IWM) was up a little over 5.5%. This was a broad, participation-driven rally, and the underlying data confirms it.
Let’s get into it.
The Market Temperature, which I introduced in detail in this post (link here) hit 6.9 out of 10 - firmly in the Strong zone (measured on Friday April 17th close) . That’s up from 6.2 last week and the highest reading since early December, before the correction. Every pillar except Sentiment improved.
At 6.9, we’re knocking on the door of the Surge zone (7+). To put that in context - Surge is rare. In my 10-year backtest, the temperature only spent about 7% of weeks there, and it was almost entirely concentrated in the 2020 COVID recovery, when the market was bouncing hard off a 30%+ crash with VIX still elevated. What we’ve just come through was a much shallower pullback - about 8-9% peak to trough. Getting this close to Surge off a relatively shallow correction is interesting, but I’d want to see at least a week or two actually in Surge territory (and see the SMAs align bullishly with the 20 SMA>50 SMA) before reading it as the all-clear.
So what’s behind the 6.9?
The Tape pillar is the strongest contributor. Participation is confirming the price move, and that matters a lot. Around 69% of US stocks are now trading above their 50-day moving average, up sharply from recent lows, and the weekly RSI on SPY has swung from 45.9 to 63.0 in just two weeks.
On the Monetary side, financial conditions are supportive. Bond market volatility (the MOVE Index) is low. Credit stress is easing. The US dollar is flat to weak.
The Regime pillar had the biggest week-over-week jump. Consumer Discretionary is decisively outperforming Consumer Staples. High-beta stocks continue to lead low-volatility stocks. And the Growth vs Value ratio flipped from a strong Value signal to neutral - removing what had been a significant headwind. In the model it was the single largest indicator swing of the week.
The one area that didn’t improve was Sentiment. The VIX at 17.48 is now below the model’s neutral zone, which shifts the Sentiment score slightly negative. Nothing alarming, but worth noting as the only pillar that moved in the wrong direction last week.
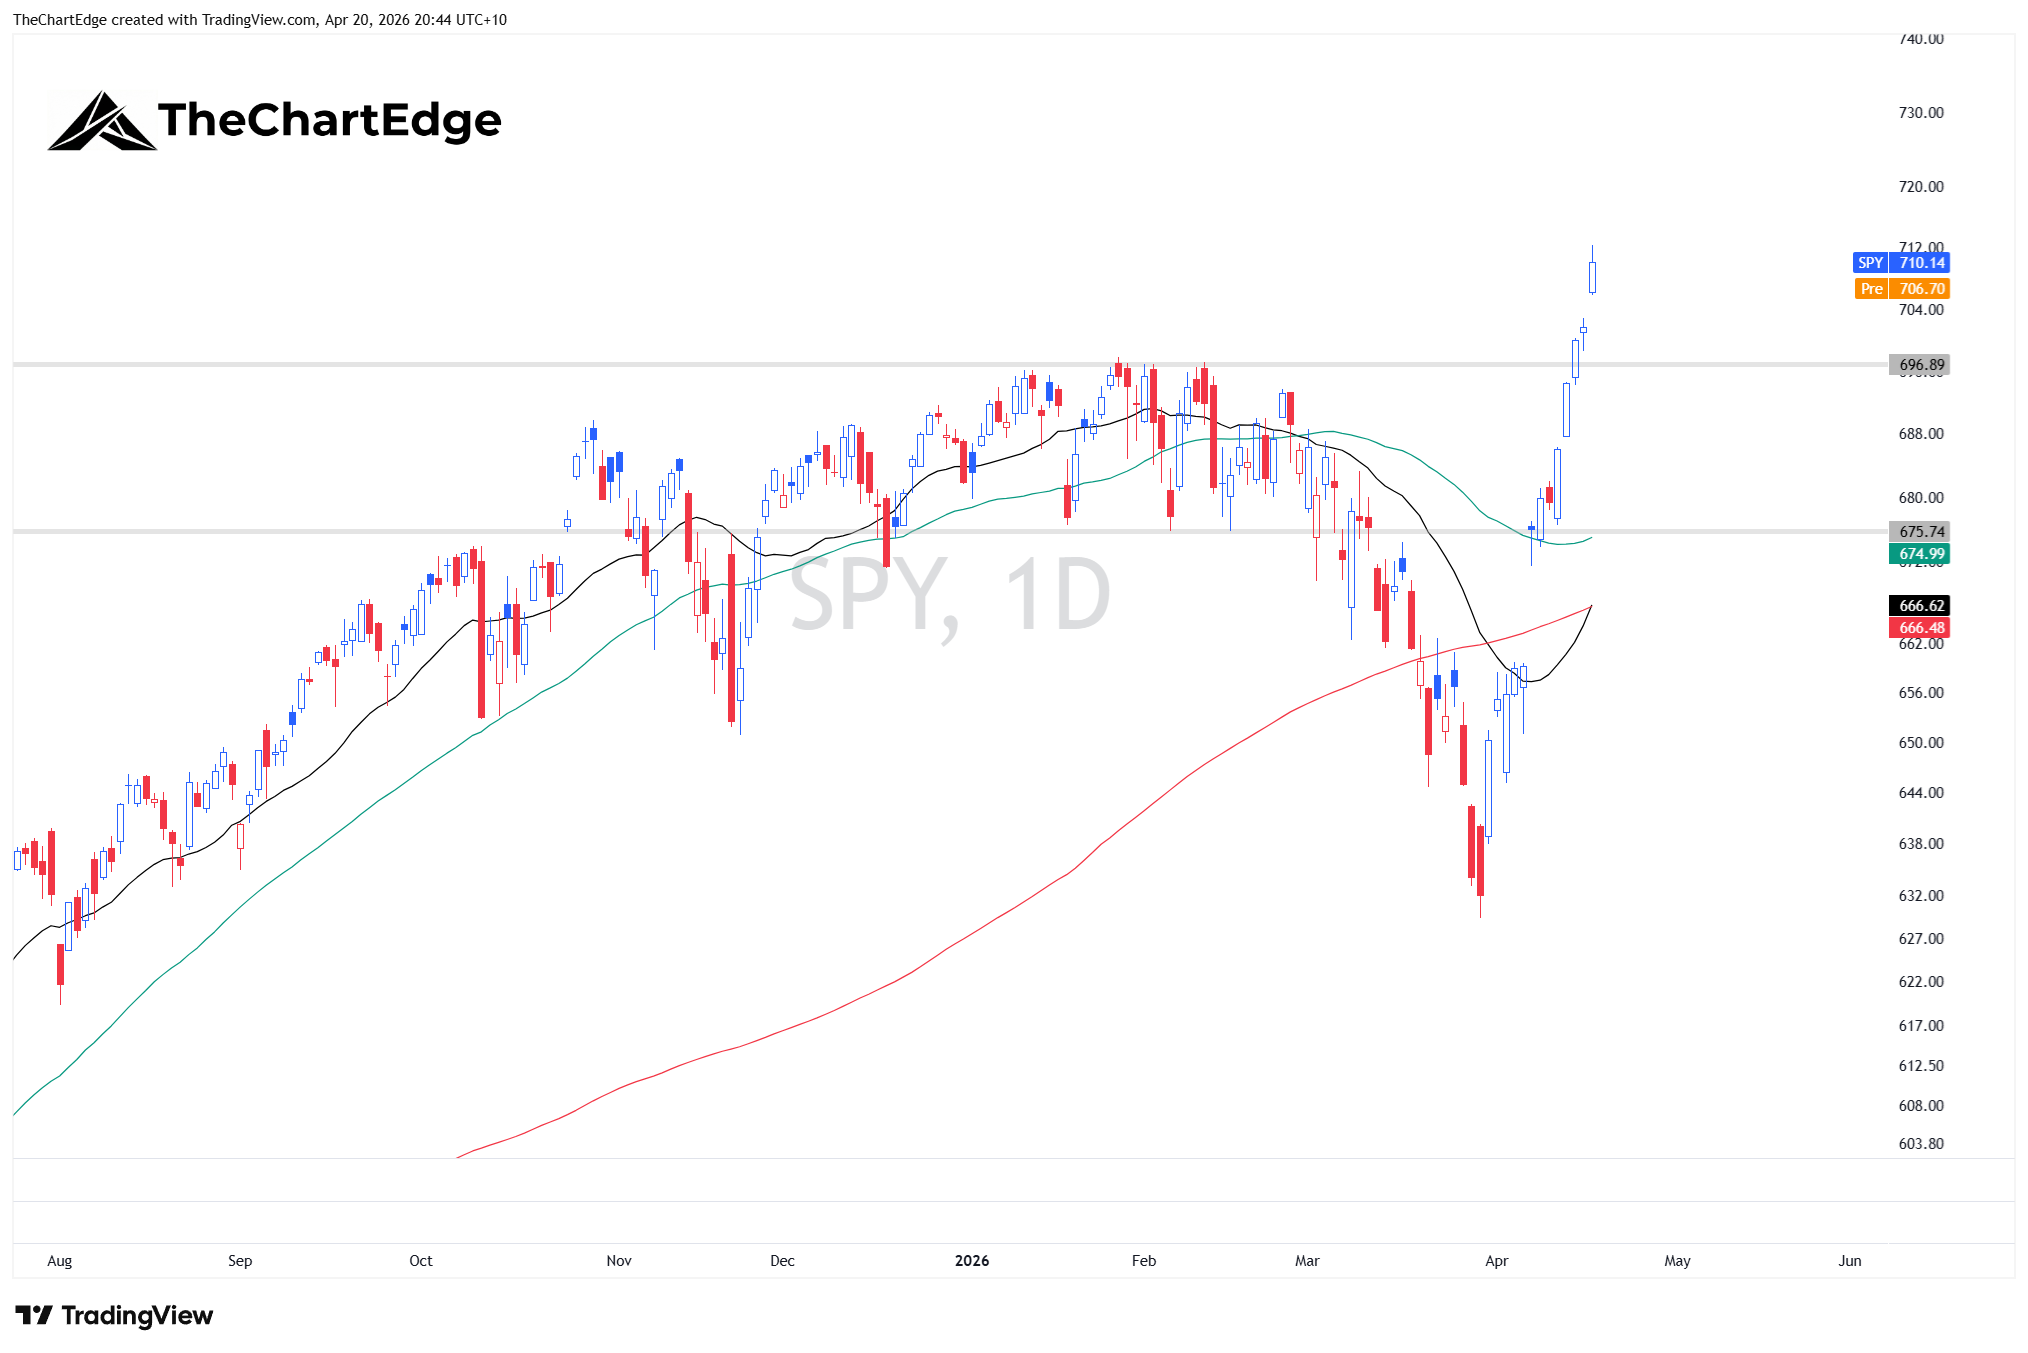
The six US indices we track are all in what I’d call a Recovering Uptrend - price is above all key moving averages, but the moving averages themselves haven’t sorted into the proper bullish sequence yet. The 20-day was dragged down by the recent correction and needs a bit more time to cross above the 50-day. If price holds around these levels, we could see that happen within a week or two.
Here’s a chart of the SPY. The black line is the 20-day SMA, the green is the 50-day SMA, and the red is the 200-day SMA.
Now let’s talk about where the money is flowing.
I track 121 ETFs against the S&P 500, measuring their trend and momentum relative to SPY. Each ETF sits in one of four quadrants: Leading (outperforming and accelerating), Weakening (outperforming but losing steam), Improving (underperforming but turning around), or Lagging (underperforming and getting worse).
At the GICS sector level, only Technology is in the Leading quadrant. Three sectors are Weakening - Energy, Materials, and Industrials. Consumer Discretionary and Real Estate are Improving. Five sectors are Lagging - Comms Services, Utilities, Financials, Consumer Staples, and Healthcare.
The AI and semiconductor complex is the dominant leadership theme right now. Eight of the top fifteen ETFs in our 121-ETF universe are AI or semiconductor-related, all outperforming SPY and accelerating.
SMH and XSD (the equal-weight semiconductor ETF) are both in the Leading quadrant, along with digital infrastructure names like IDGT and DTCR. The equal-weight semis are outperforming the cap-weighted version, which suggests broad-based strength across the sector rather than just the heavyweights carrying the index.
SMH Chart
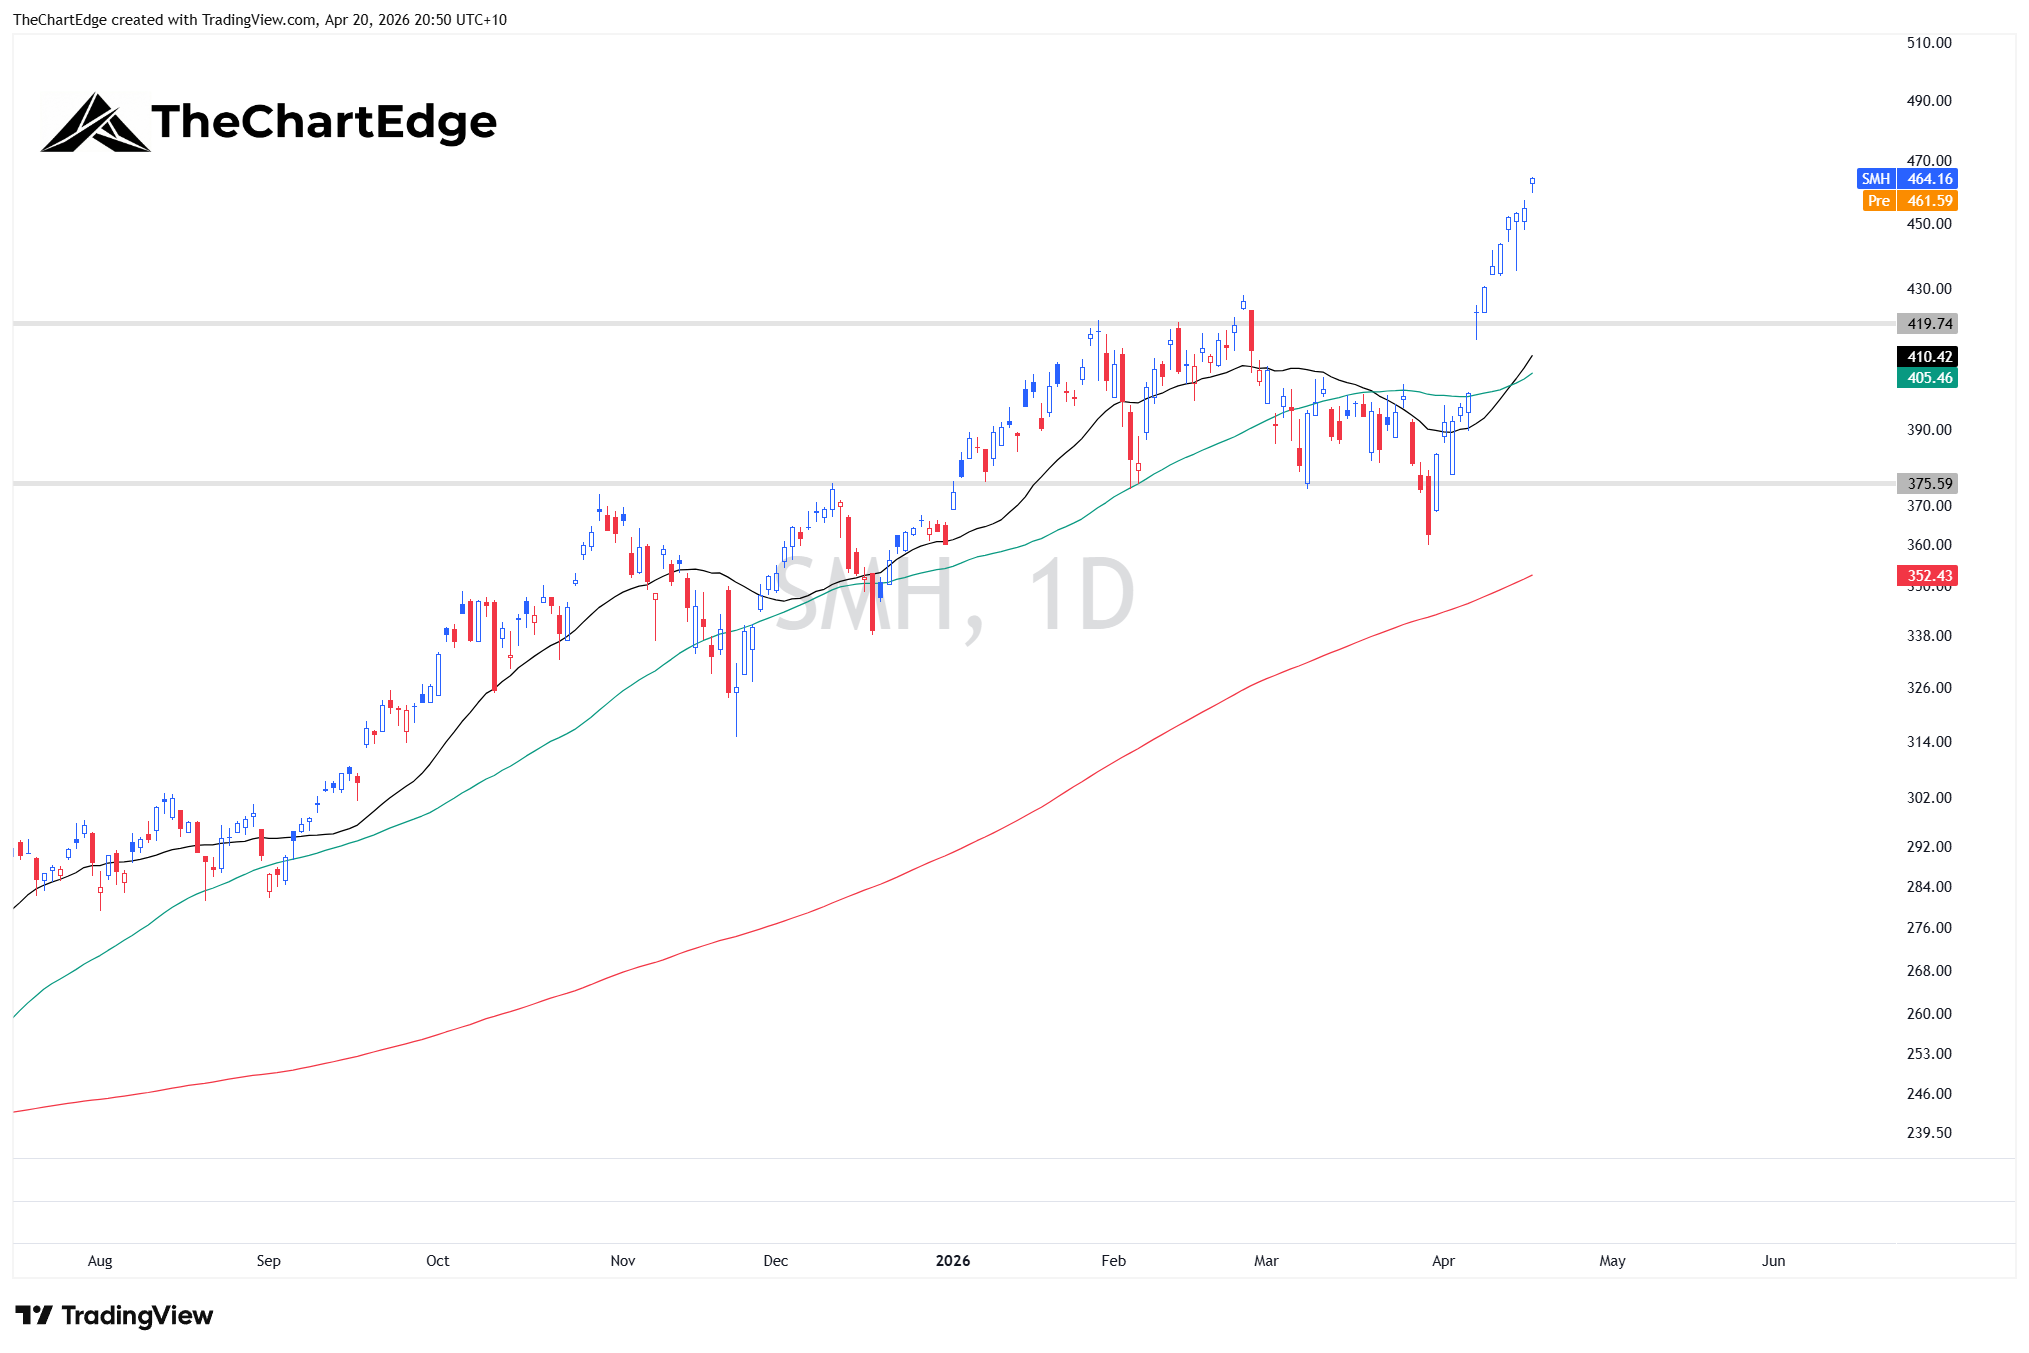
The black line is the 20-day SMA, the green is the 50-day SMA, and the red is the 200-day SMA.
XSD Chart
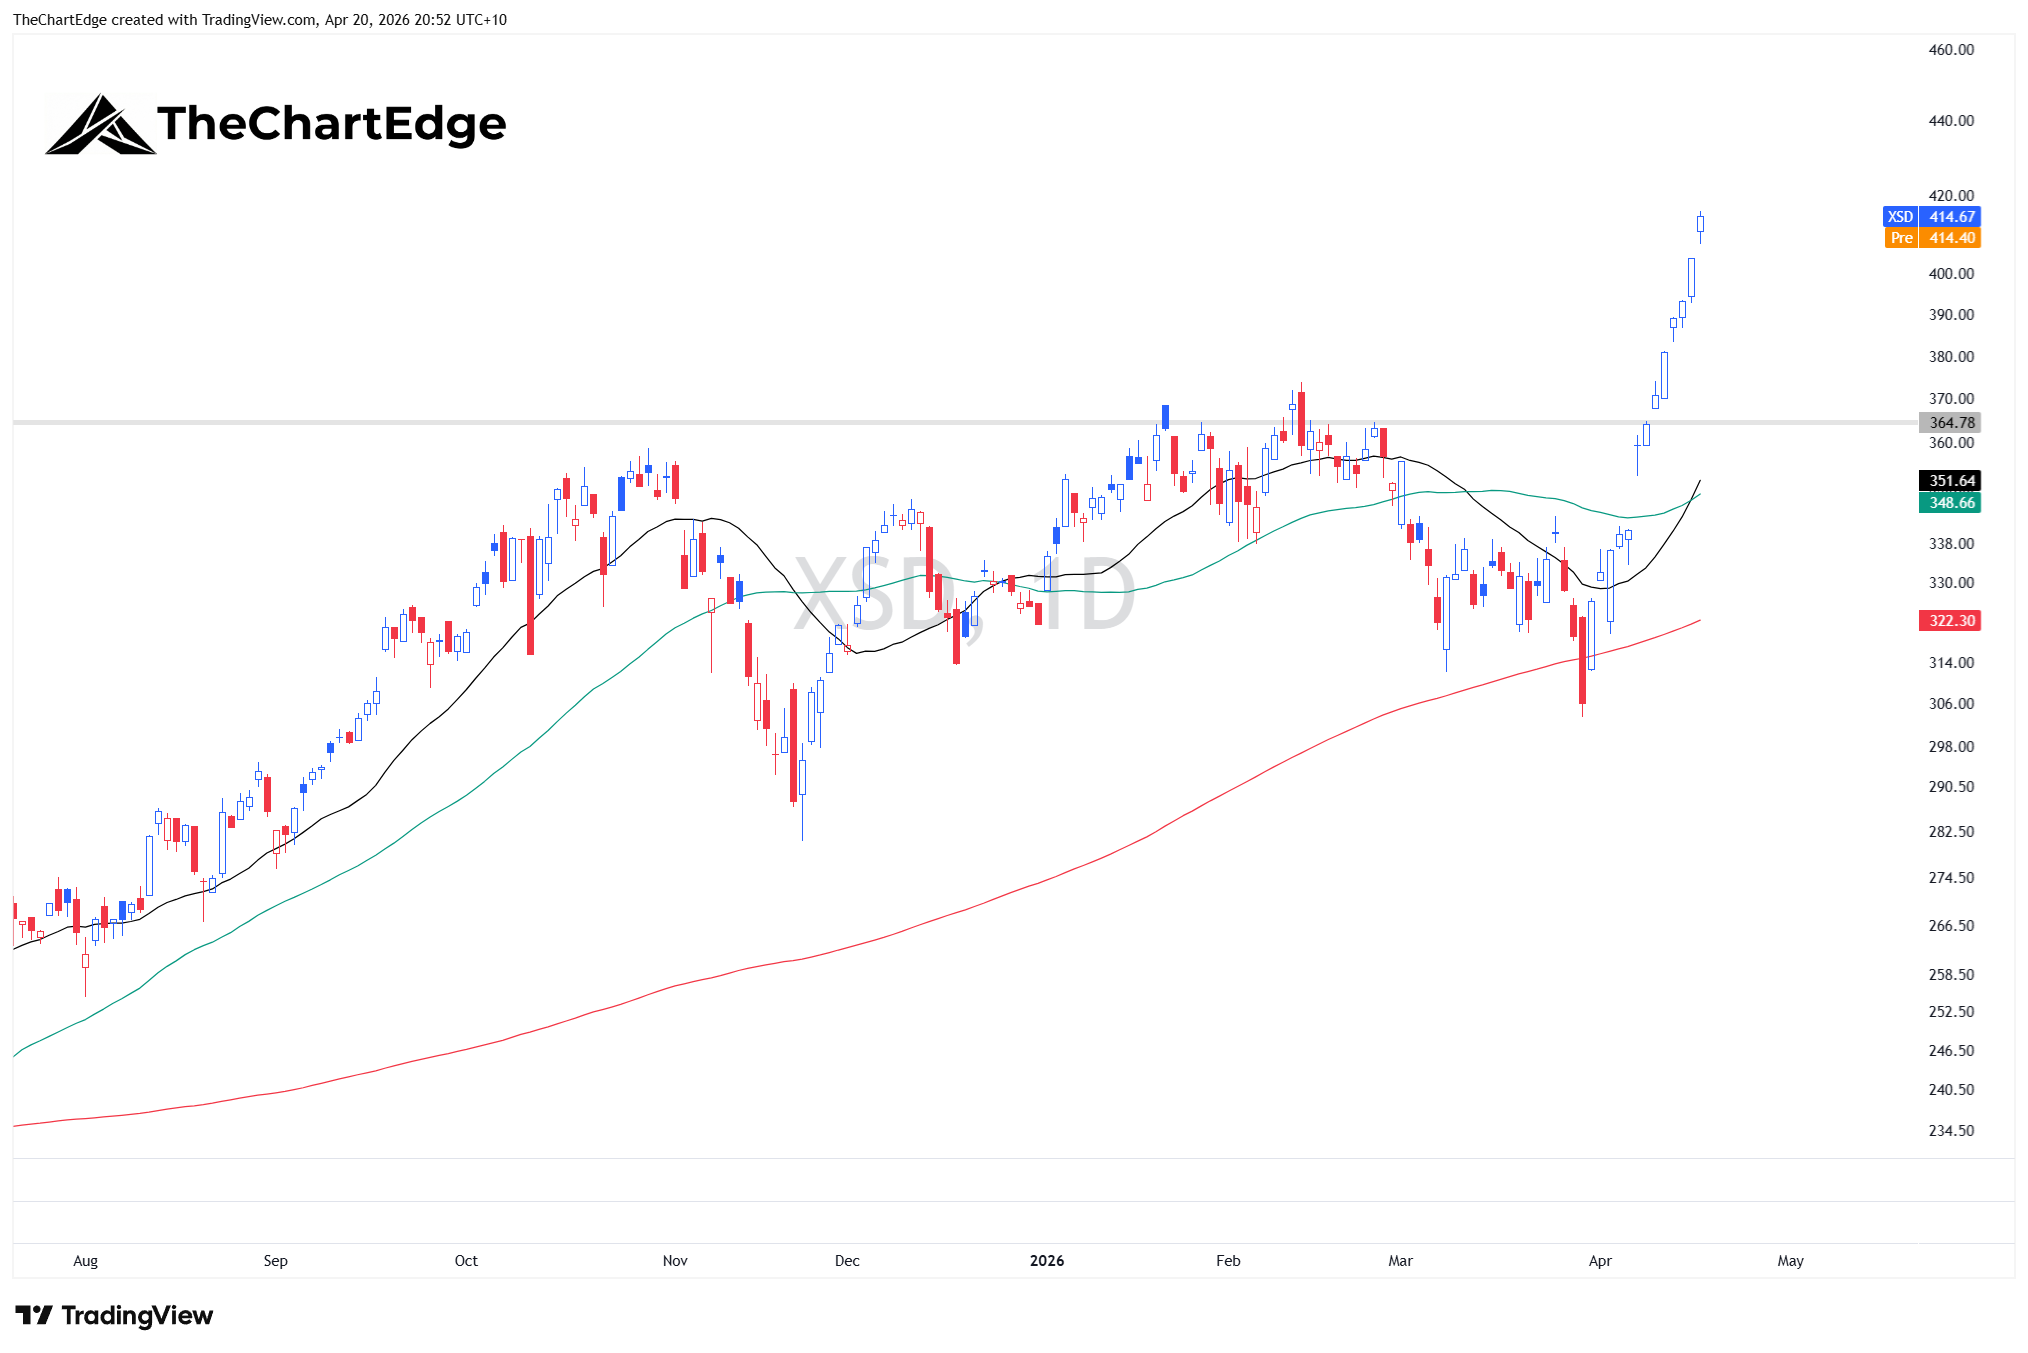
The black line is the 20-day SMA, the green is the 50-day SMA, and the red is the 200-day SMA.
Pretty much everything in the AI stack is participating - semiconductors, data centres, AI infrastructure, generative AI ETFs. The one exception is the software layer, which is still lagging (more on that below).
Most leading names are extended after the recent big move. But AI names are where the strongest momentum in the market lives, and these are the names I want on my shopping list for pullbacks into the SMAs, or if they base out and the moving averages catch up. I will post an AI deep-dive with specific names later this week.
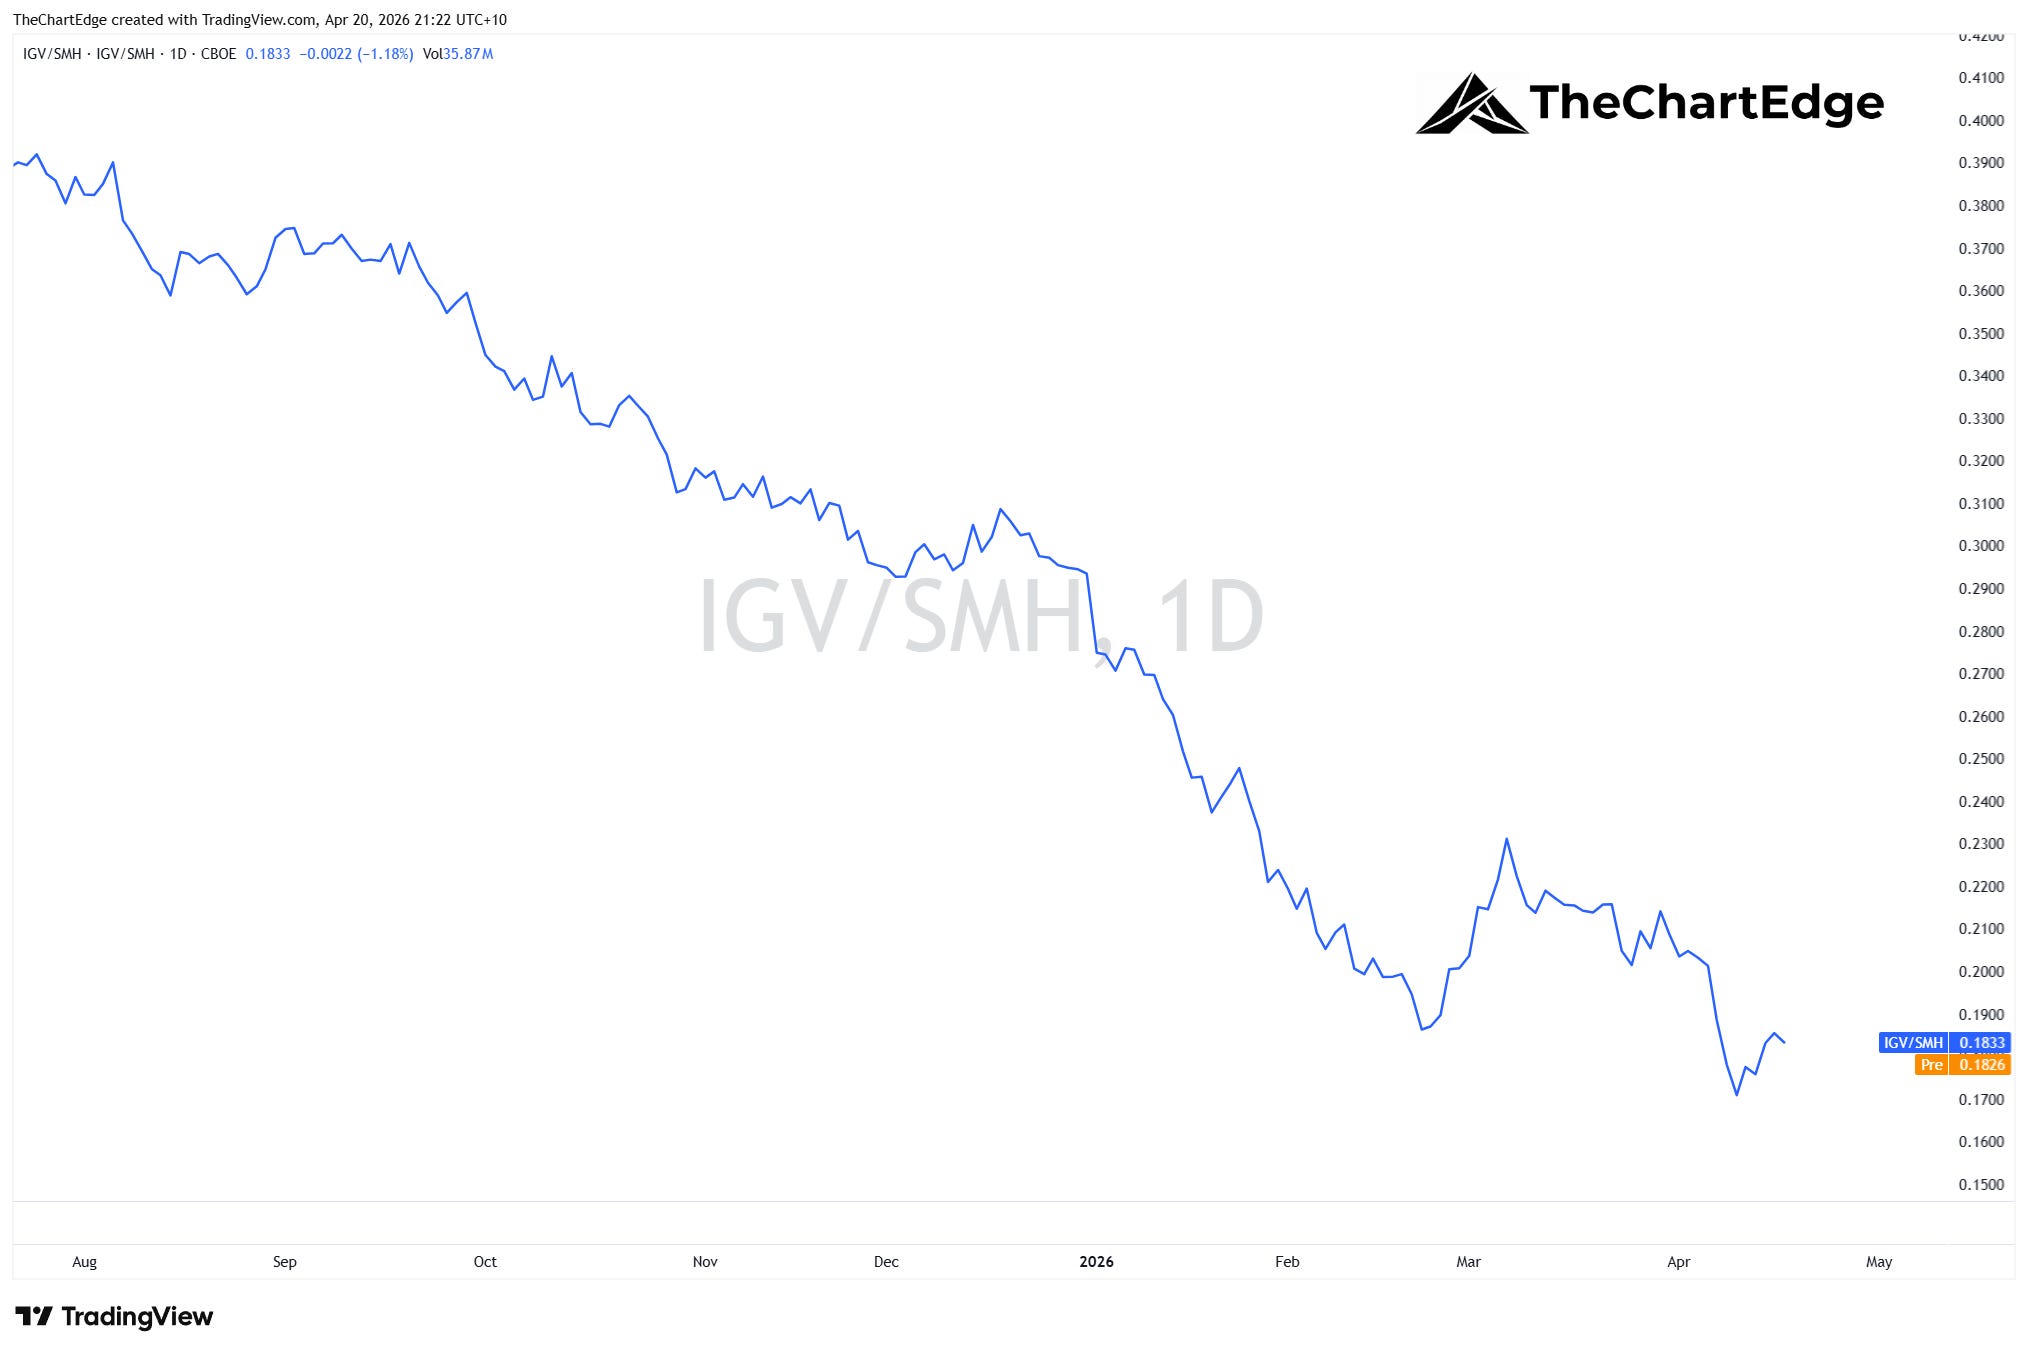
IGV (the Software ETF) gained 13.94% and has just crossed into the Improving quadrant - but only barely. The gap between hardware and software in relative strength terms remains extreme - around 40 points. If I plot IGV relative to SMH, it’s still in a clear downtrend and has barely moved on this bounce. One week doesn’t change a trend. This is one to watch for confirmation over the coming weeks, not to act on prematurely. Lets see.
IGV/SMH Ratio Chart
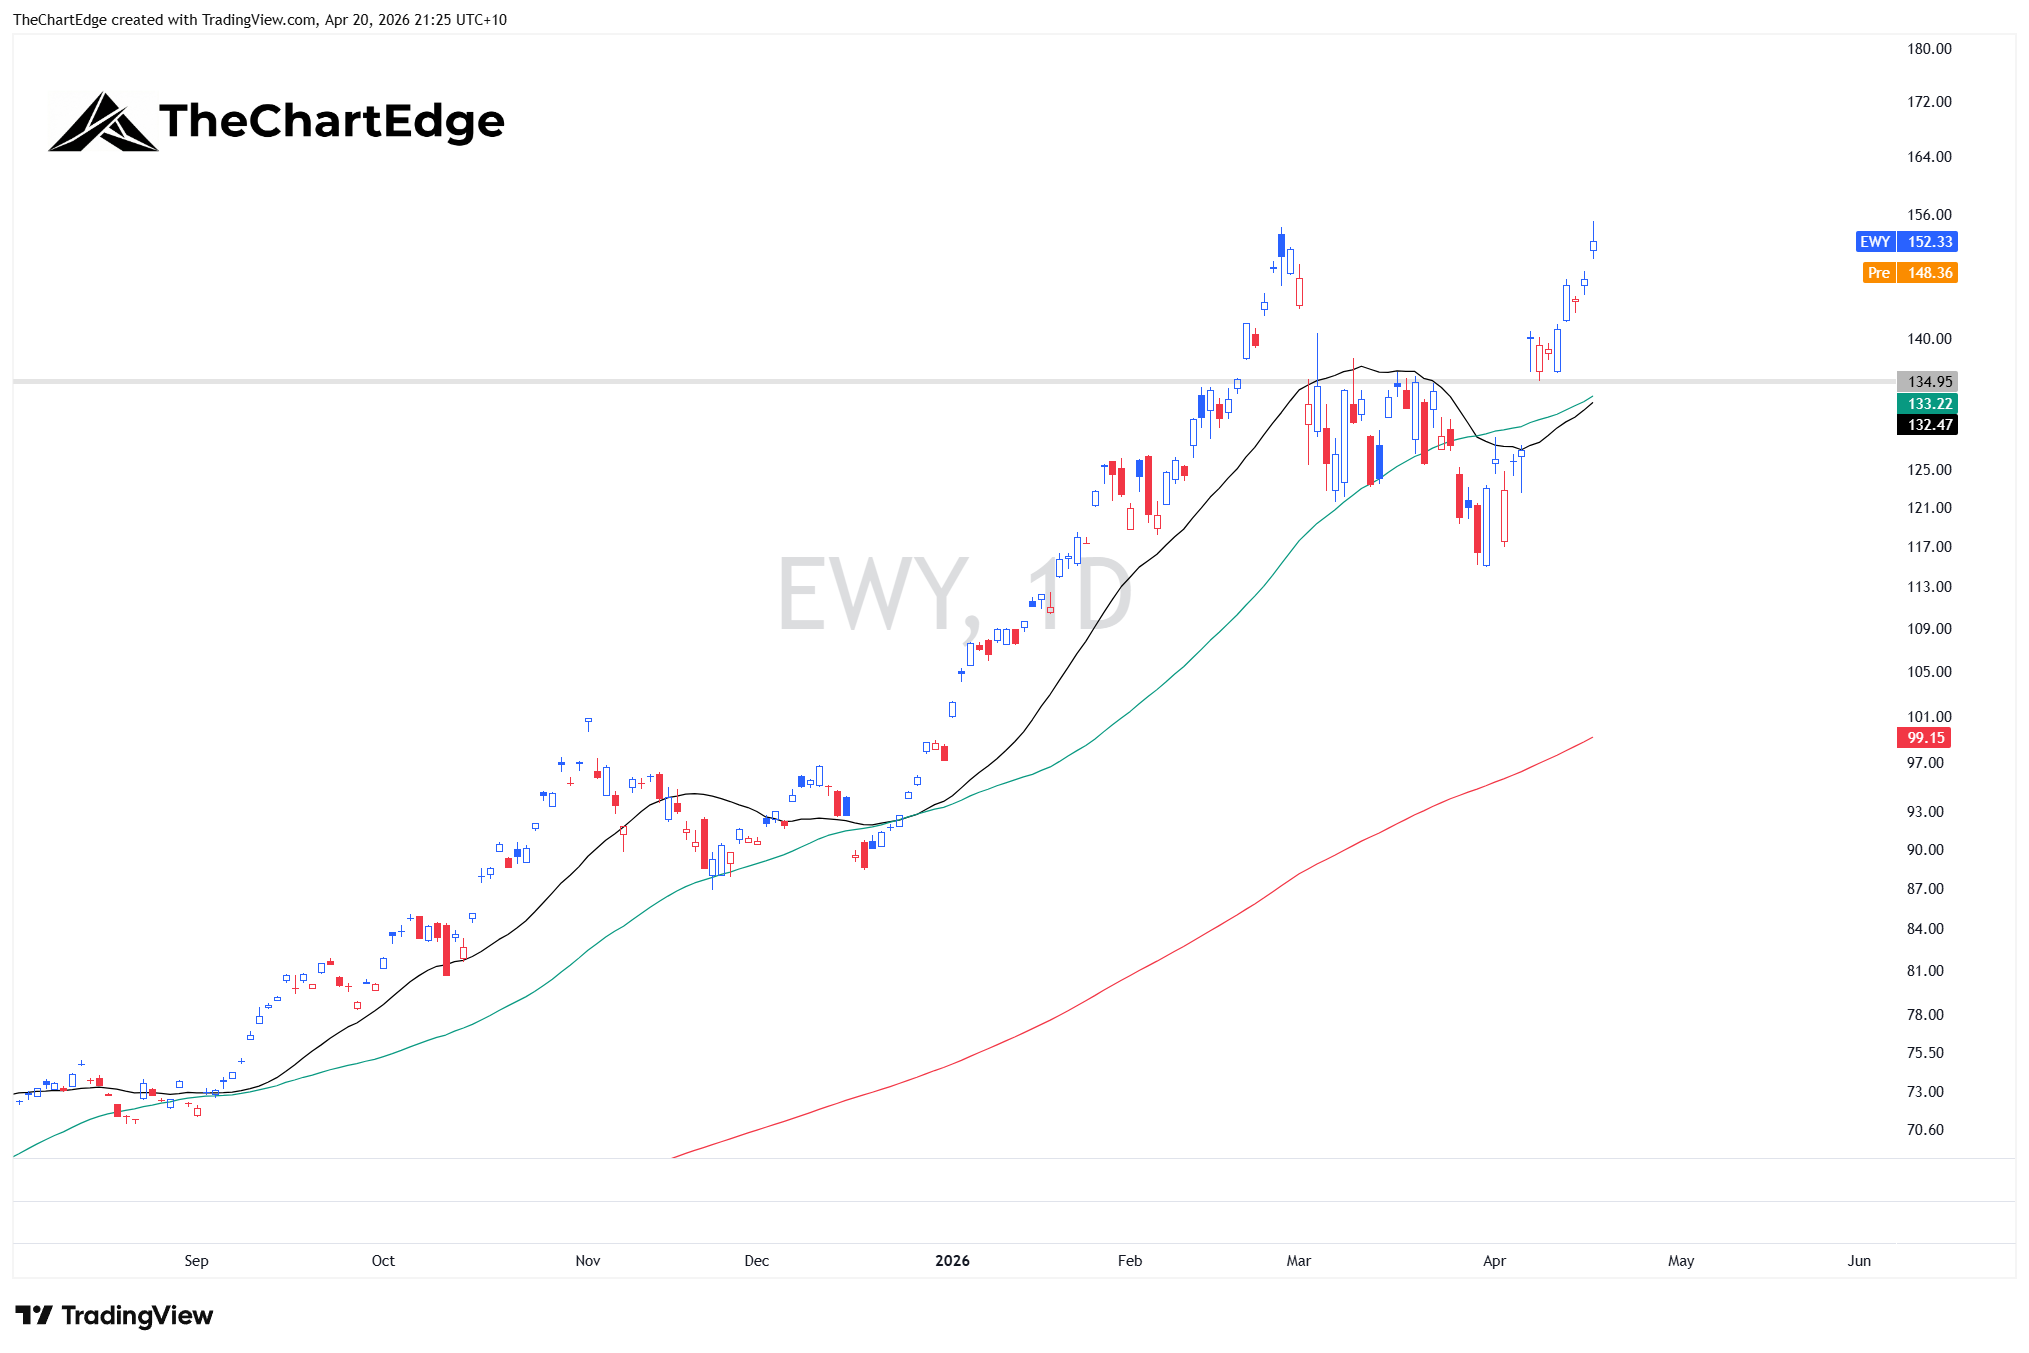
South Korea (EWY) deserves a mention. It has the highest relative strength trend reading in the entire 121-ETF universe. That’s not entirely surprising given its heavy semiconductor exposure (Samsung, SK Hynix), but it’s worth noting as an alternative way to play the global chip cycle.
EWY Chart
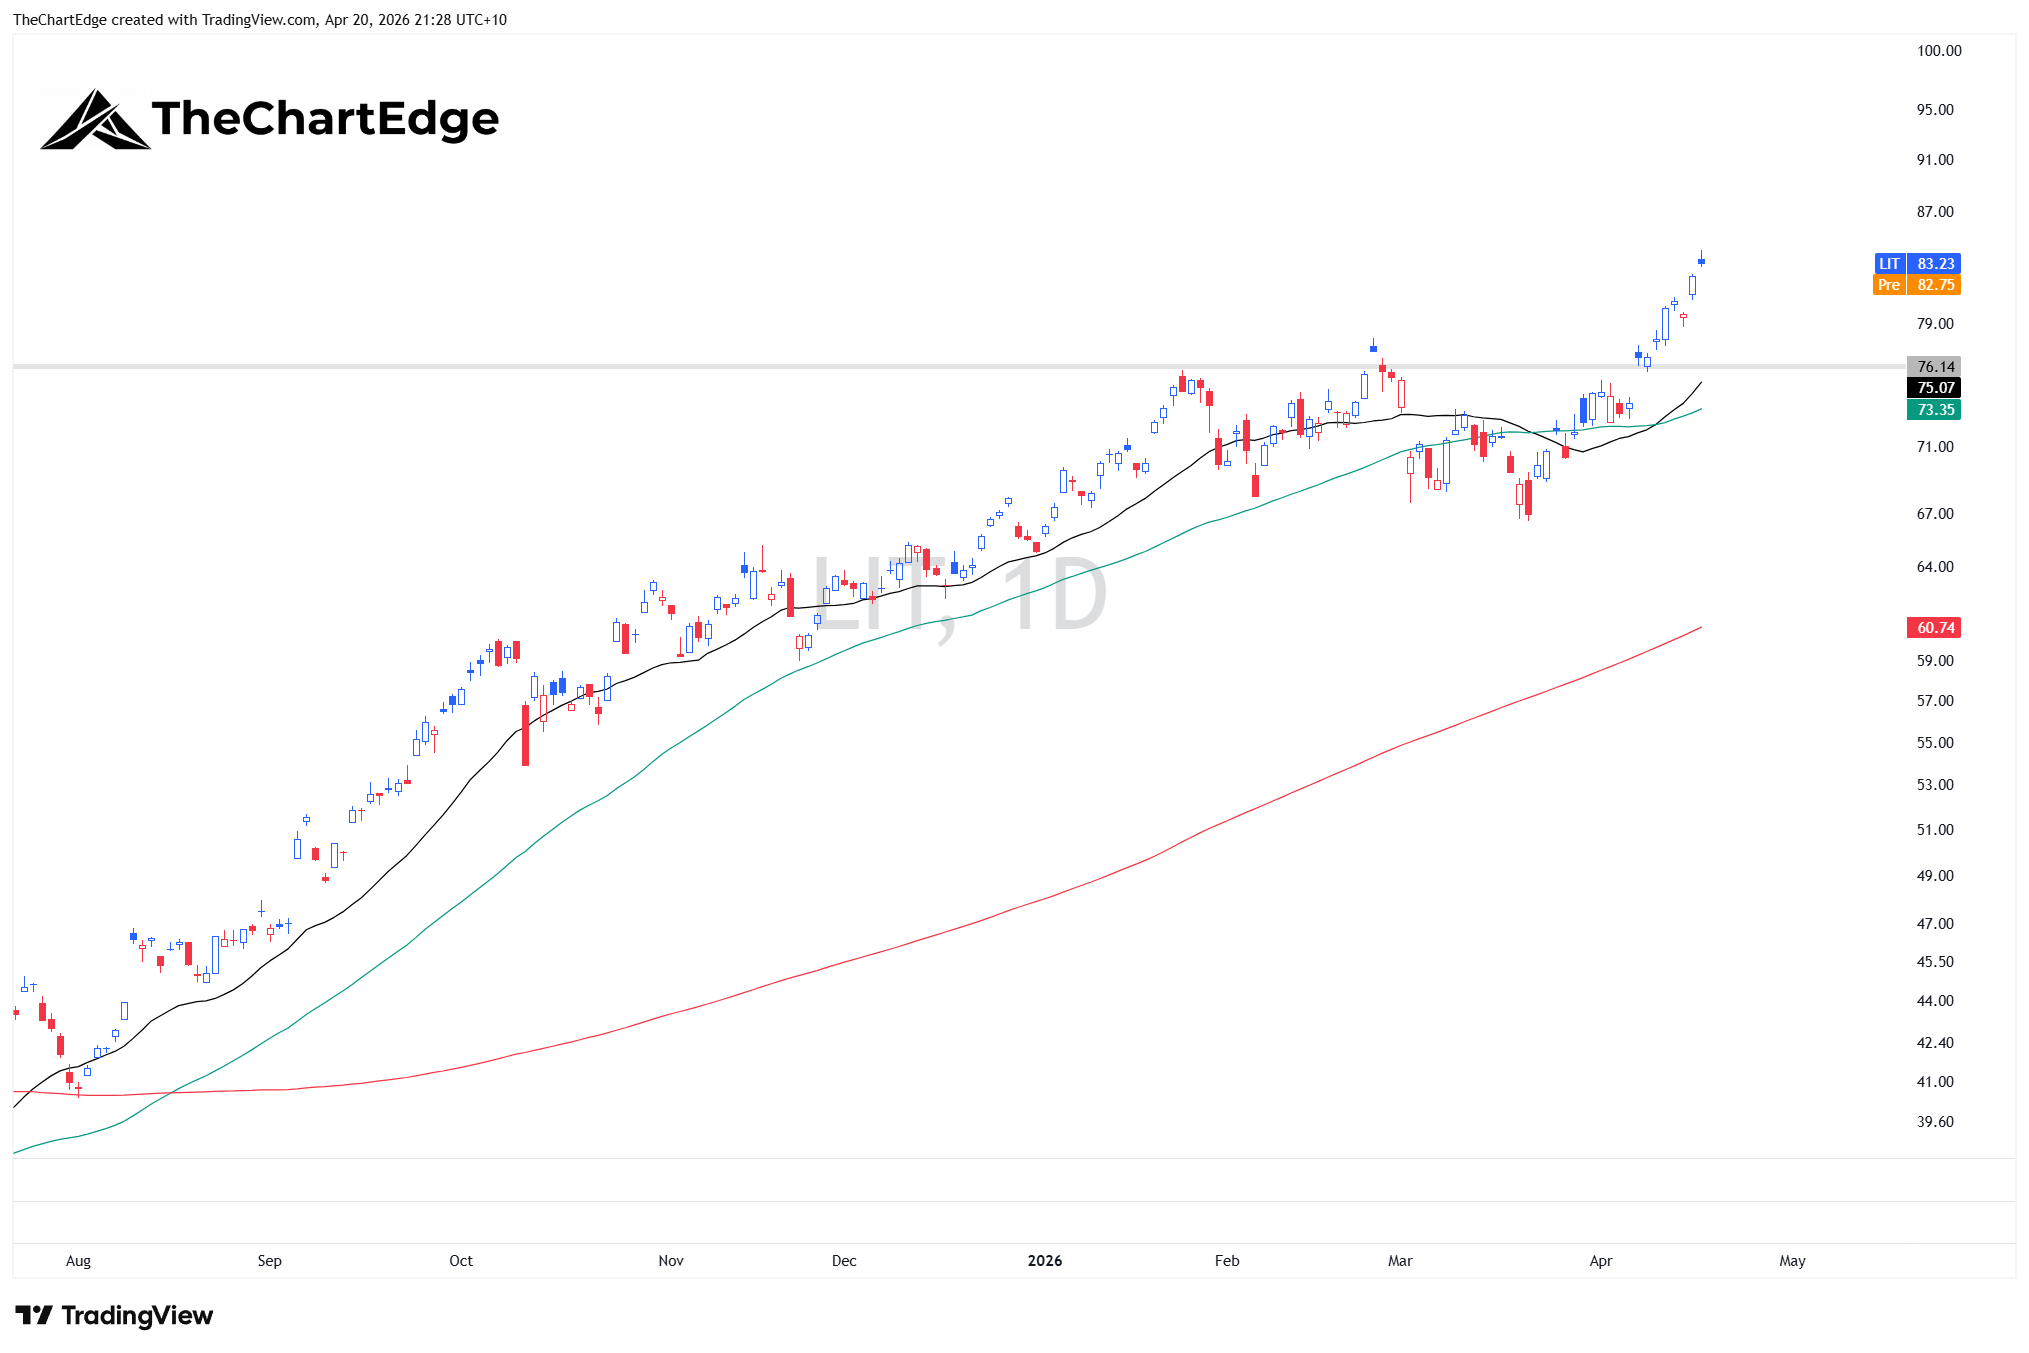
In the mining and metals space, there’s a clear split. Lithium (LIT), rare earths (REMX), and uranium (URA) are all in the Leading quadrant. Gold miners (GDX), silver miners (SIL), copper (COPX), and broad metals (XME) are all Weakening - still outperforming on a longer-term trend basis, but the momentum is fading. The precious metals have had a massive run and look like they’re taking a breather. The lithium and rare earth names are being driven by a different set of factors altogether.
LIT Chart
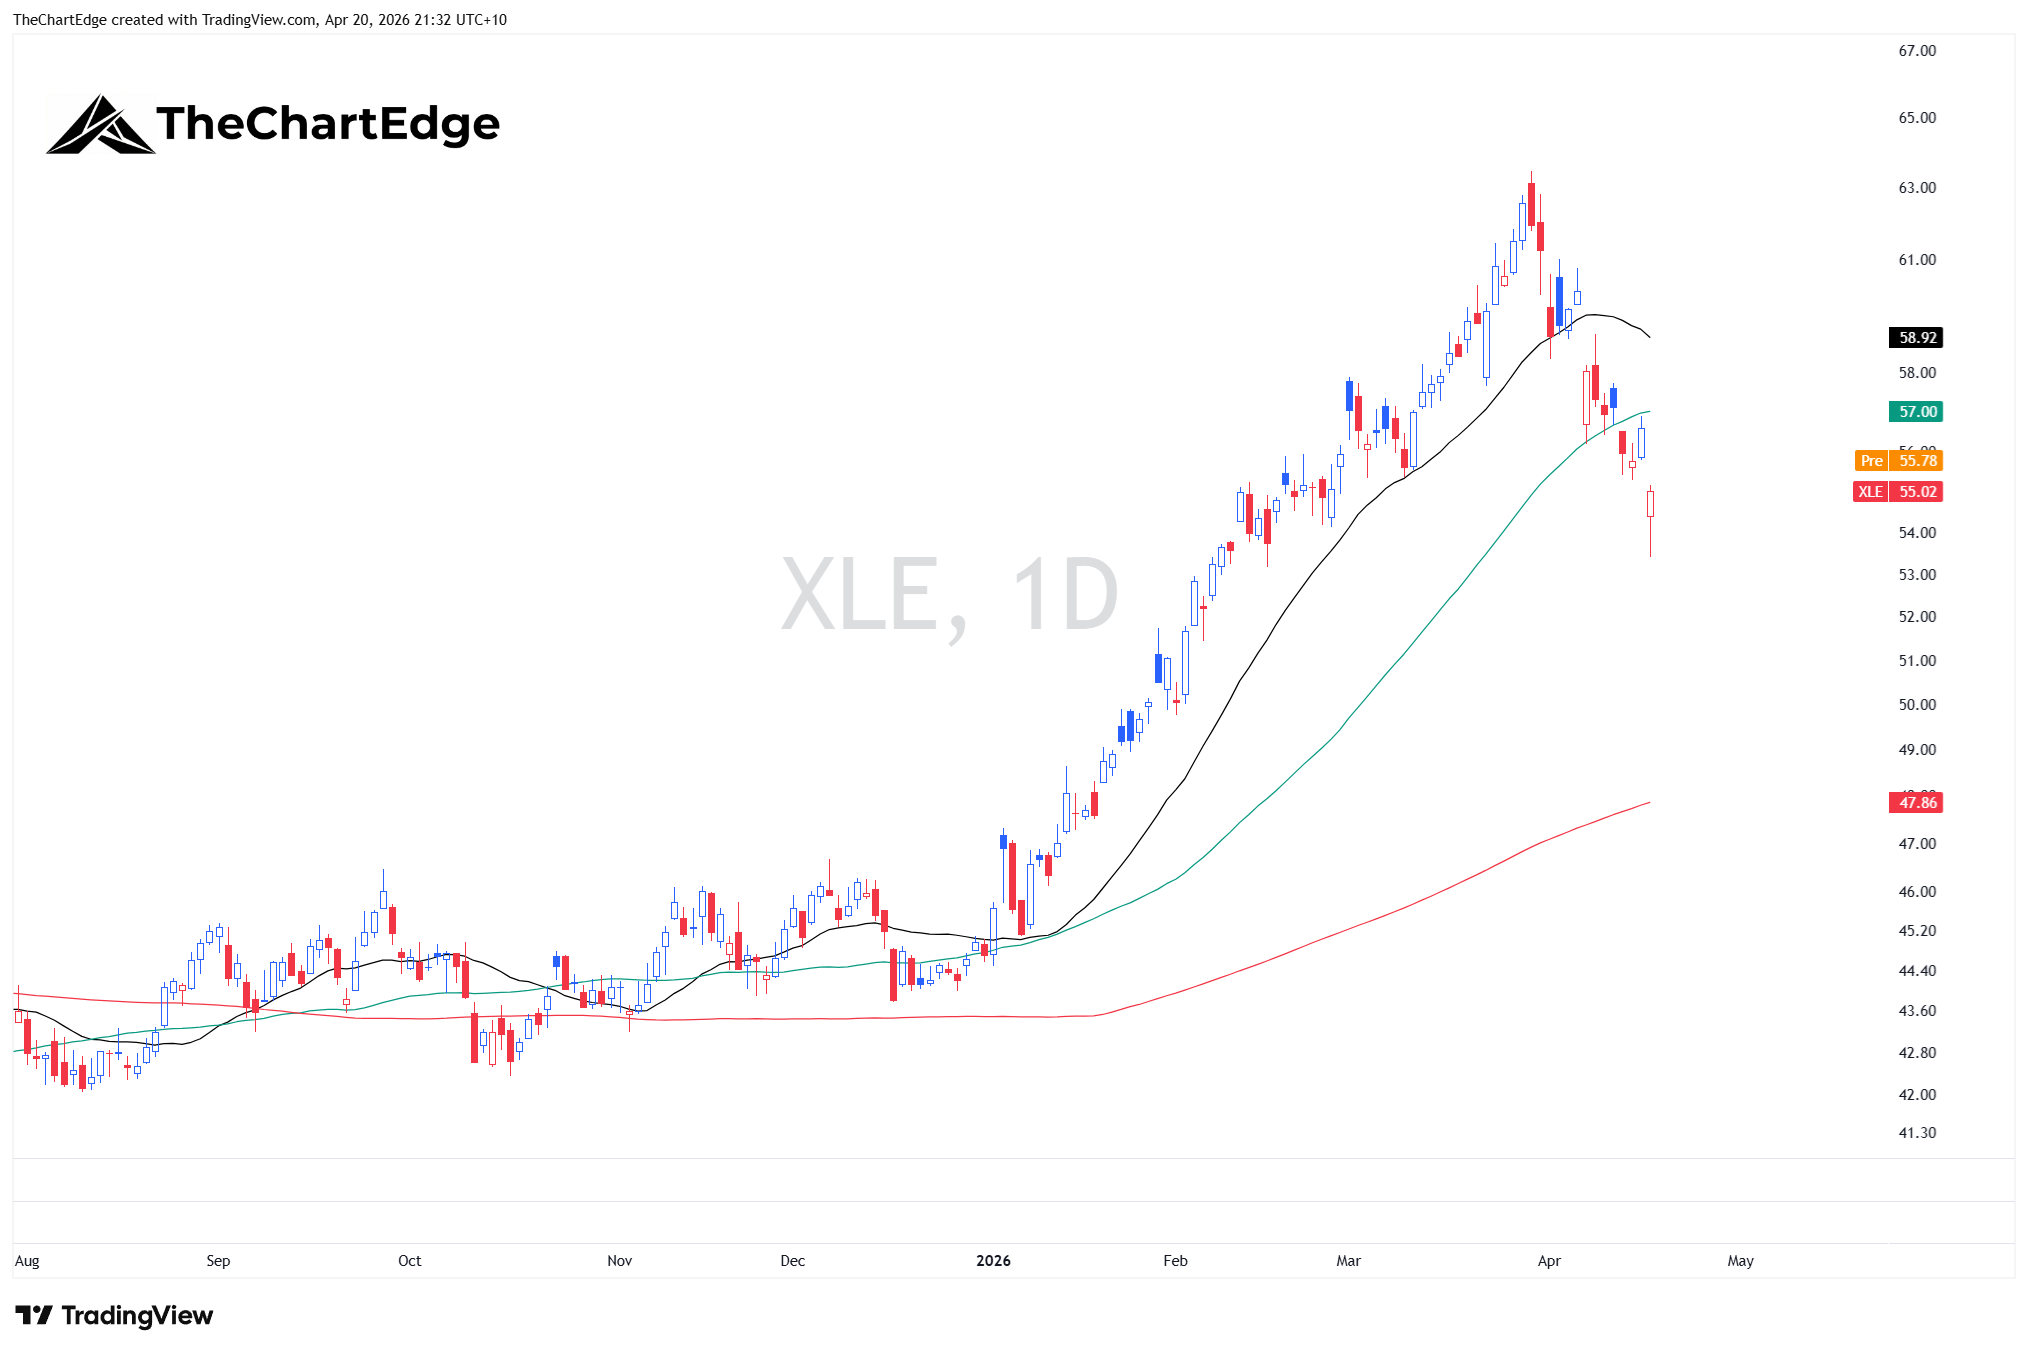
Energy is where the rotation is clearly moving away from. XLE was down 3.37% in a week where SPY gained over 4.5%. XOP dropped 5.21% and USO fell 7.03%. The momentum picture across the energy complex has weakened sharply. The longer-term trend is still positive, but the gap between energy and the rest of the market widened significantly last week.
Worth noting - oil futures are higher today on Strait of Hormuz headlines. This is a fast-moving situation and could change the energy picture quickly. That’s the kind of thing that makes you stay open minded rather than getting married to a view.
XLE Chart
WGMI (the crypto miners ETF) is in the Leading quadrant, but when I drill into the 23 components, the strength is really coming from the names that have pivoted their data centre capacity toward AI compute workloads - HUT (Hut 8) and WULF (TeraWulf) in particular. HUT is the strongest component in the Leading quadrant, and WULF has one of the highest relative strength trend readings in the entire ETF at +76% year to date. Meanwhile the traditional crypto miners - RIOT, MARA, CLSK, HIVE - are mostly Improving or Lagging. So WGMI’s leadership seems as much an AI infrastructure story as it is a crypto story at this point.
On the speculative side, there were some eye-catching moves. ARKK gained 14.35%, ARKG was up 15.4%, and the IPO ETF gained 10.48%. QTUM (the quantum computing and AI ETF) was up 9.6%. These are right on the edge of the Leading quadrant and could cross over with another strong week - a very different situation from software, which only just scraped into Improving from much further back.
One more thing that I think is important context. The “avoid” list is paper-thin. Only three ETFs meet the strict criteria for deep laggards. That in itself is valuable information. In a weak or transitional market, you’d expect to see twenty or thirty ETFs in the danger zone. Narrow weakness is consistent with a strong temperature reading.
I’ll be sharing this rotation and temperature analysis each week going forward. The goal is to give you a clear, data-driven read on what the market environment looks like and where the strongest themes are.
As always, I am open to all possibilities. Stay open minded and manage risk tightly.
Hope everyone has a great week!
Cheers,
Marcus Grant, CFTe
Disclaimer: The content provided in this newsletter is for informational and educational purposes only and should not be considered as financial, investment, or legal advice. The information shared is based on our research and analysis, but we are not a licensed financial advisor, nor can we guarantee its accuracy, completeness, or timeliness. Market conditions and financial instruments can change rapidly, and any opinions expressed may not be suitable for all investors. Any opinions expressed and or securities mentioned do not constitute a recommendation to buy, sell, or hold that or any other security. You should conduct your own due diligence and consult with a licensed financial advisor or other professional before making any investment decisions. Past performance is not indicative of future results, and all investments carry the risk of loss. The authors and publishers of this newsletter are not responsible for any financial decisions made based on the content provided herein. By reading and or subscribing to this newsletter, you acknowledge and agree that you are using the information at your own risk.