

Market Temperature at 6.4 - Risk Appetite is Rising
All-time highs in all major US indices, as bond volatility compresses

After a holiday-shortened week - US markets were closed Monday for Memorial Day - every major index closed at a weekly all-time high (week ending May 29). The S&P 500 (SPY) gained 1.45%, the Nasdaq 100 (QQQ) 2.89%, the Dow (DIA) 0.92%, the S&P MidCap 400 (MDY) 1.49%, the Russell 2000 (IWM) 1.86%, the Microcap (IWC) 2.33%, the S&P 500 Equal Weight (RSP) 1.09%, the Nasdaq 100 Equal Weight (QQEW) 3.71%, and FANG+ (FNGS) 6.24%.
FNGS Chart
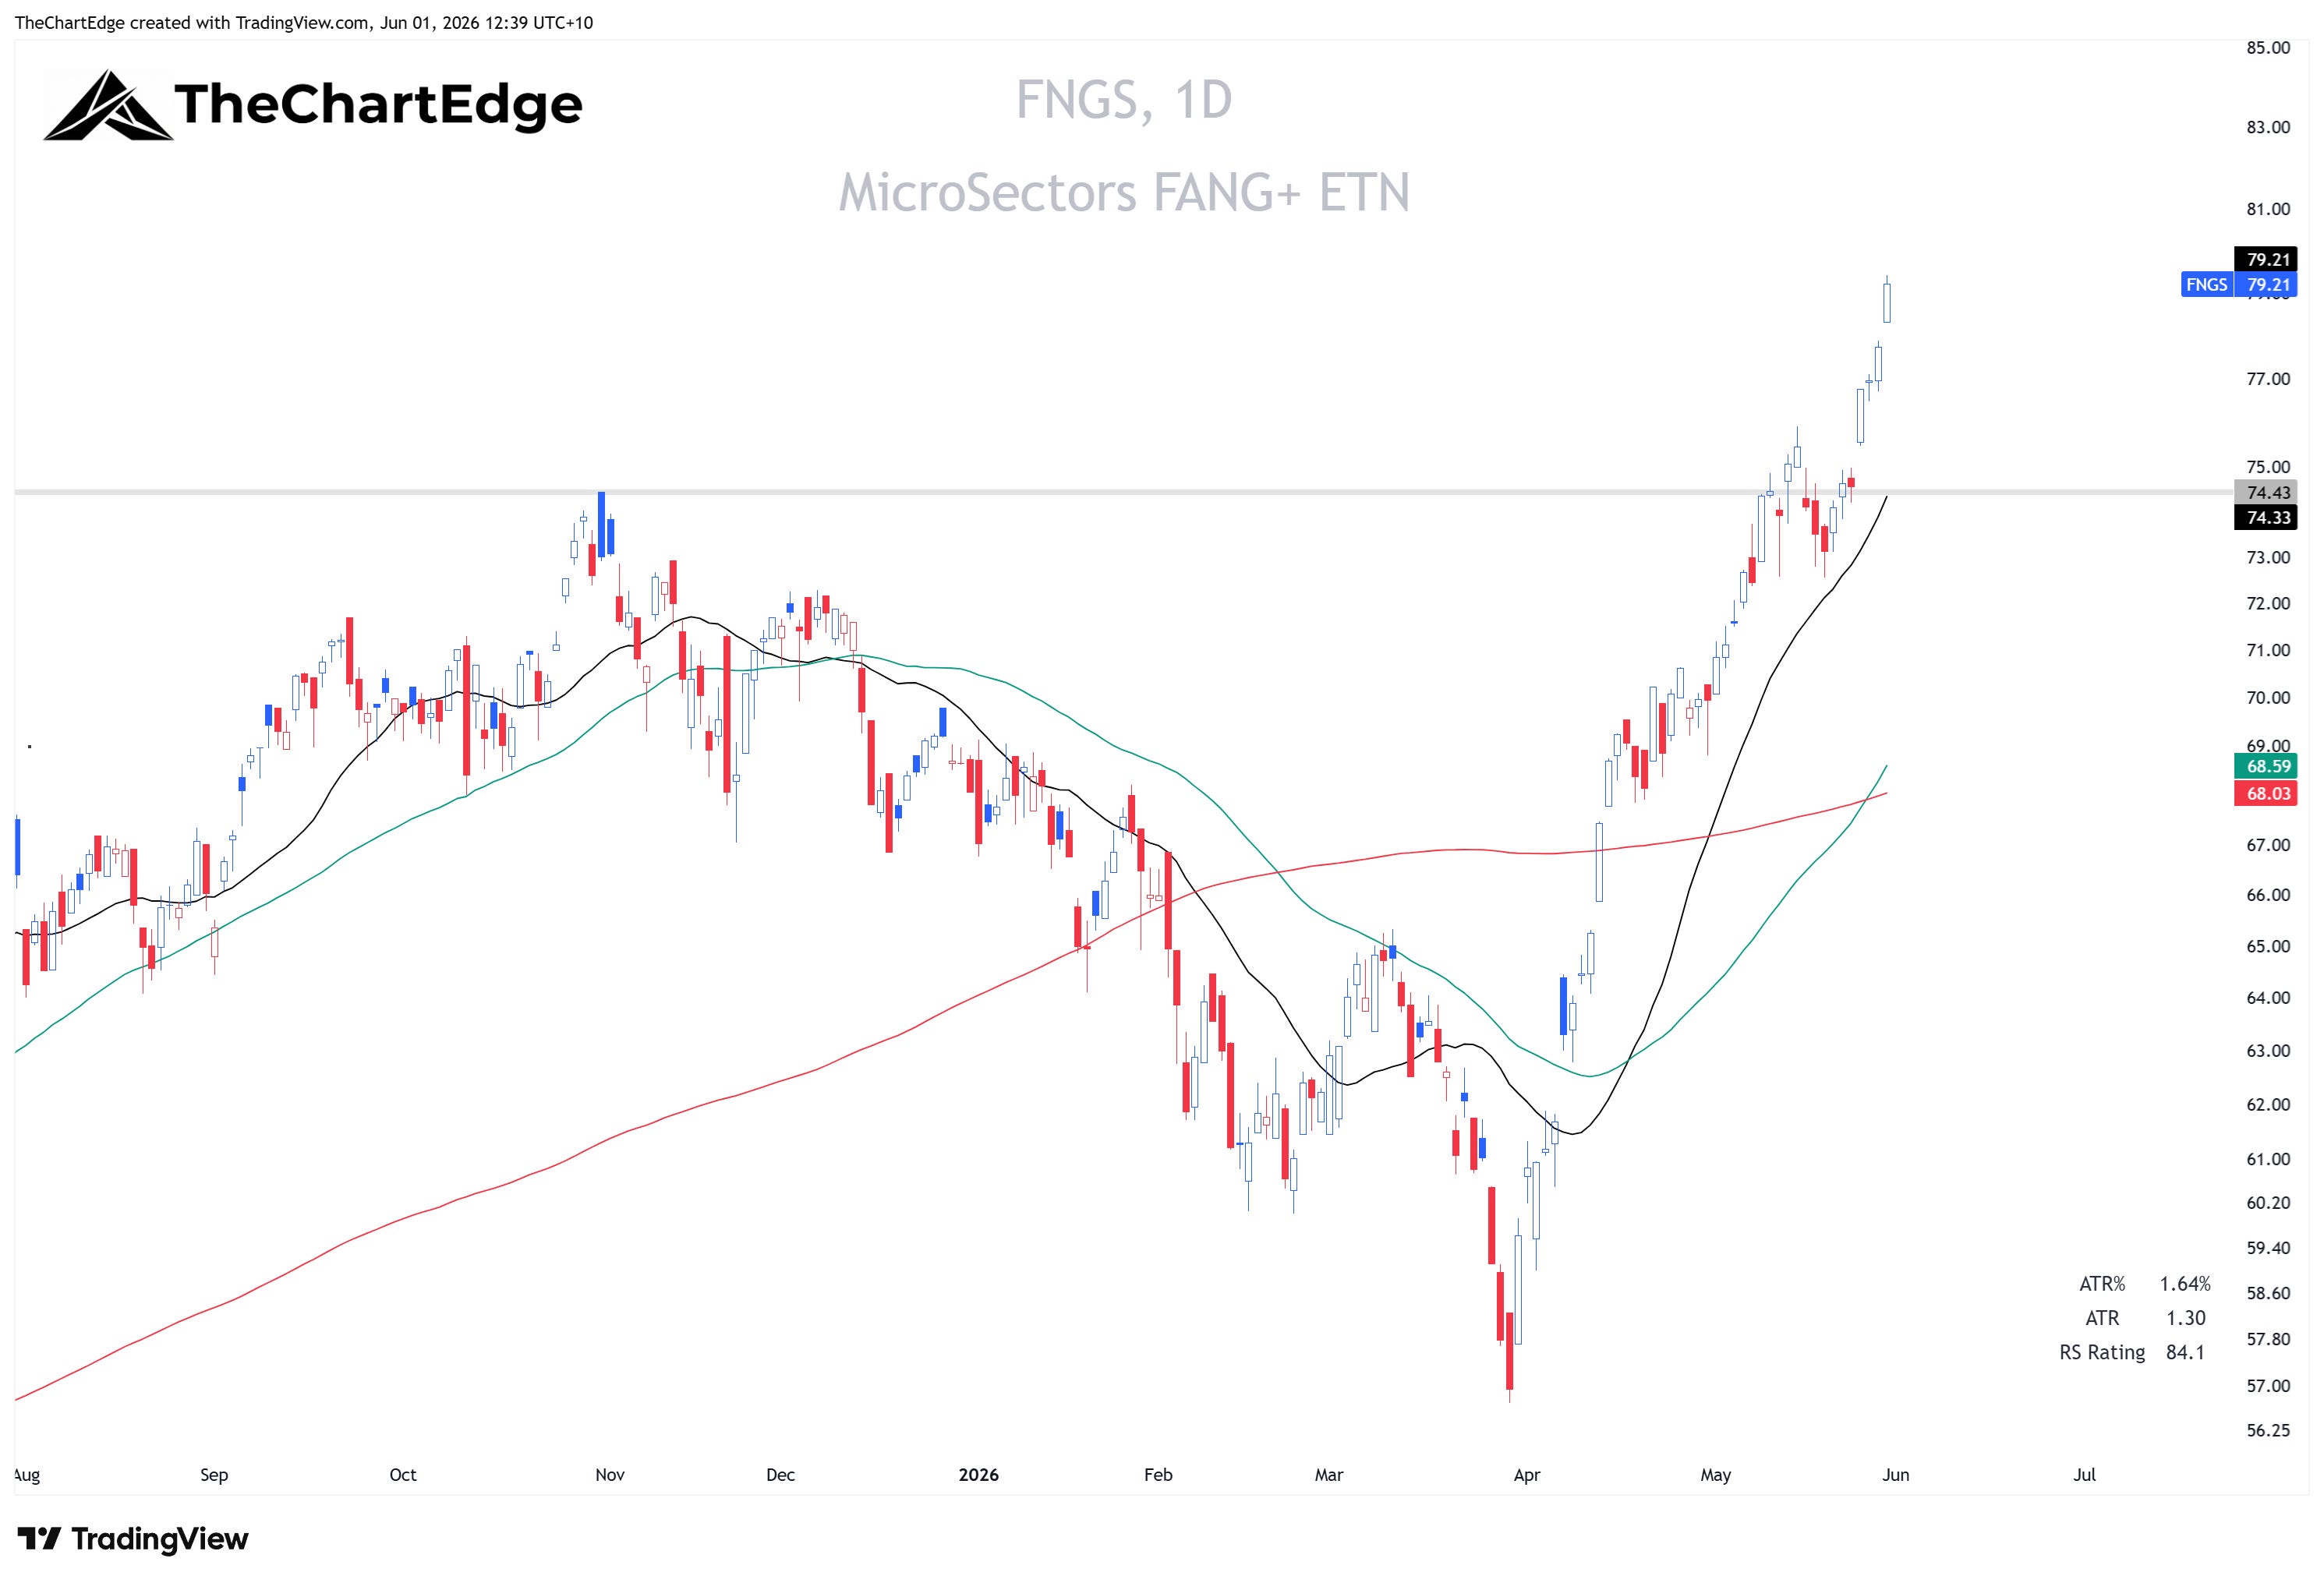
For all daily charts the black line is the 20-day SMA, the green is the 50-day SMA, and the red is the 200-day SMA.
FNGS had a very strong week, breaking out to a weekly closing all-time high. But NVDA actually fell 1.95% last week and sits in Lagging. The FANG+ breakout was carried by Micron (+29.29%) and Broadcom (+7.88%), with Microsoft (+7.57%) and Palantir (+14.36%) also up significantly, but both remain below their 200SMAs.
Market Temperature
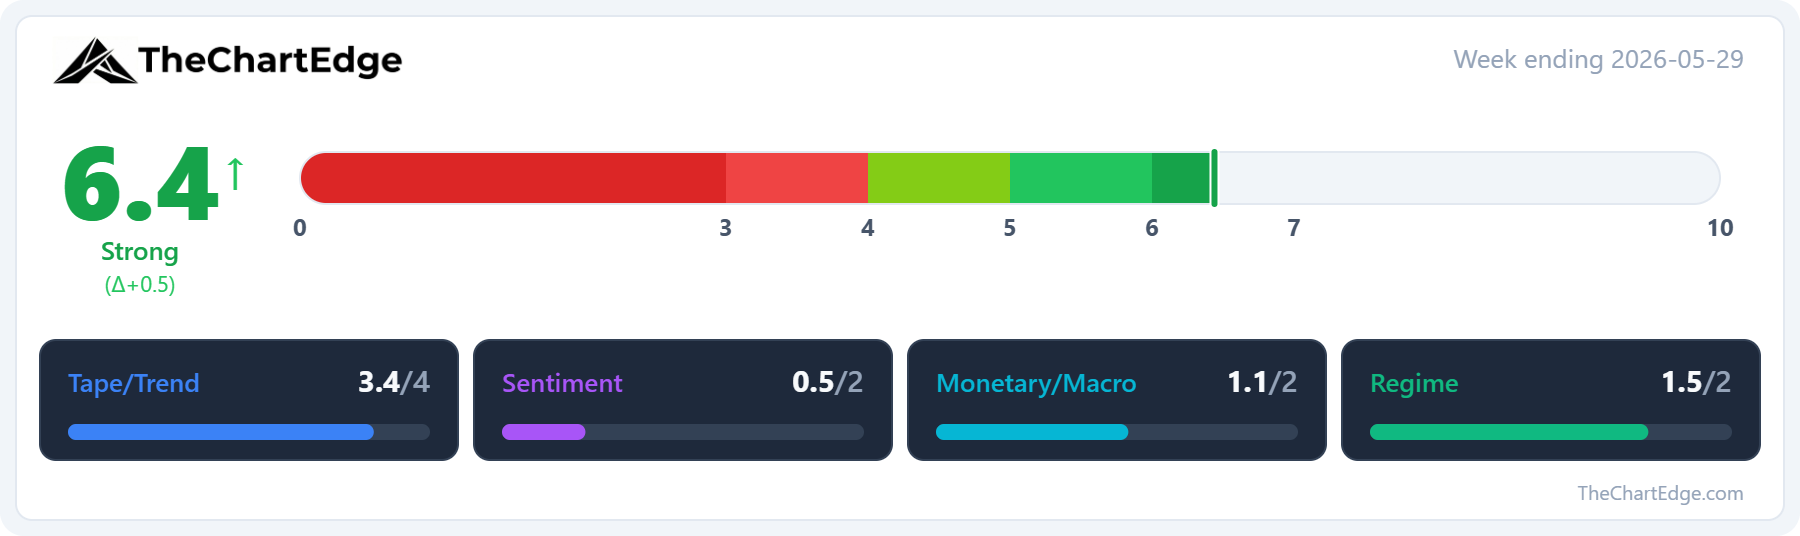
The Market Temperature rose to 6.4 from 5.9, moving out of the Goldilocks Zone into Strong.
Three of four pillars improved. The Tape/Trend was the main driver - breadth firmed off the mid-May low and weekly RSI on the S&P pushed to 72.97. One nuance: the breadth scores look strong because the model has a two-week lookback period, showing a recovery off the May 15 low, not a big jump last week. Week-on-week, the percentage of US stocks above their 50-day average only ticked from 57.18 to 58.88.
Monetary/Macro also improved. In last week’s note I said this pillar had the most room to run if bond volatility compressed and the dollar eased. The MOVE index fell from 78.43 to 70.22, and TLT rose (interest rate fell). The dollar (UUP) also fell slightly.
Regime firmed too, with discretionary outperforming staples and high beta continuing to outperform low vol.
The one drag was Sentiment. The VIX fell to 15.32, which the model reads as a contrarian signal.
SPDR Sector Relative Strength
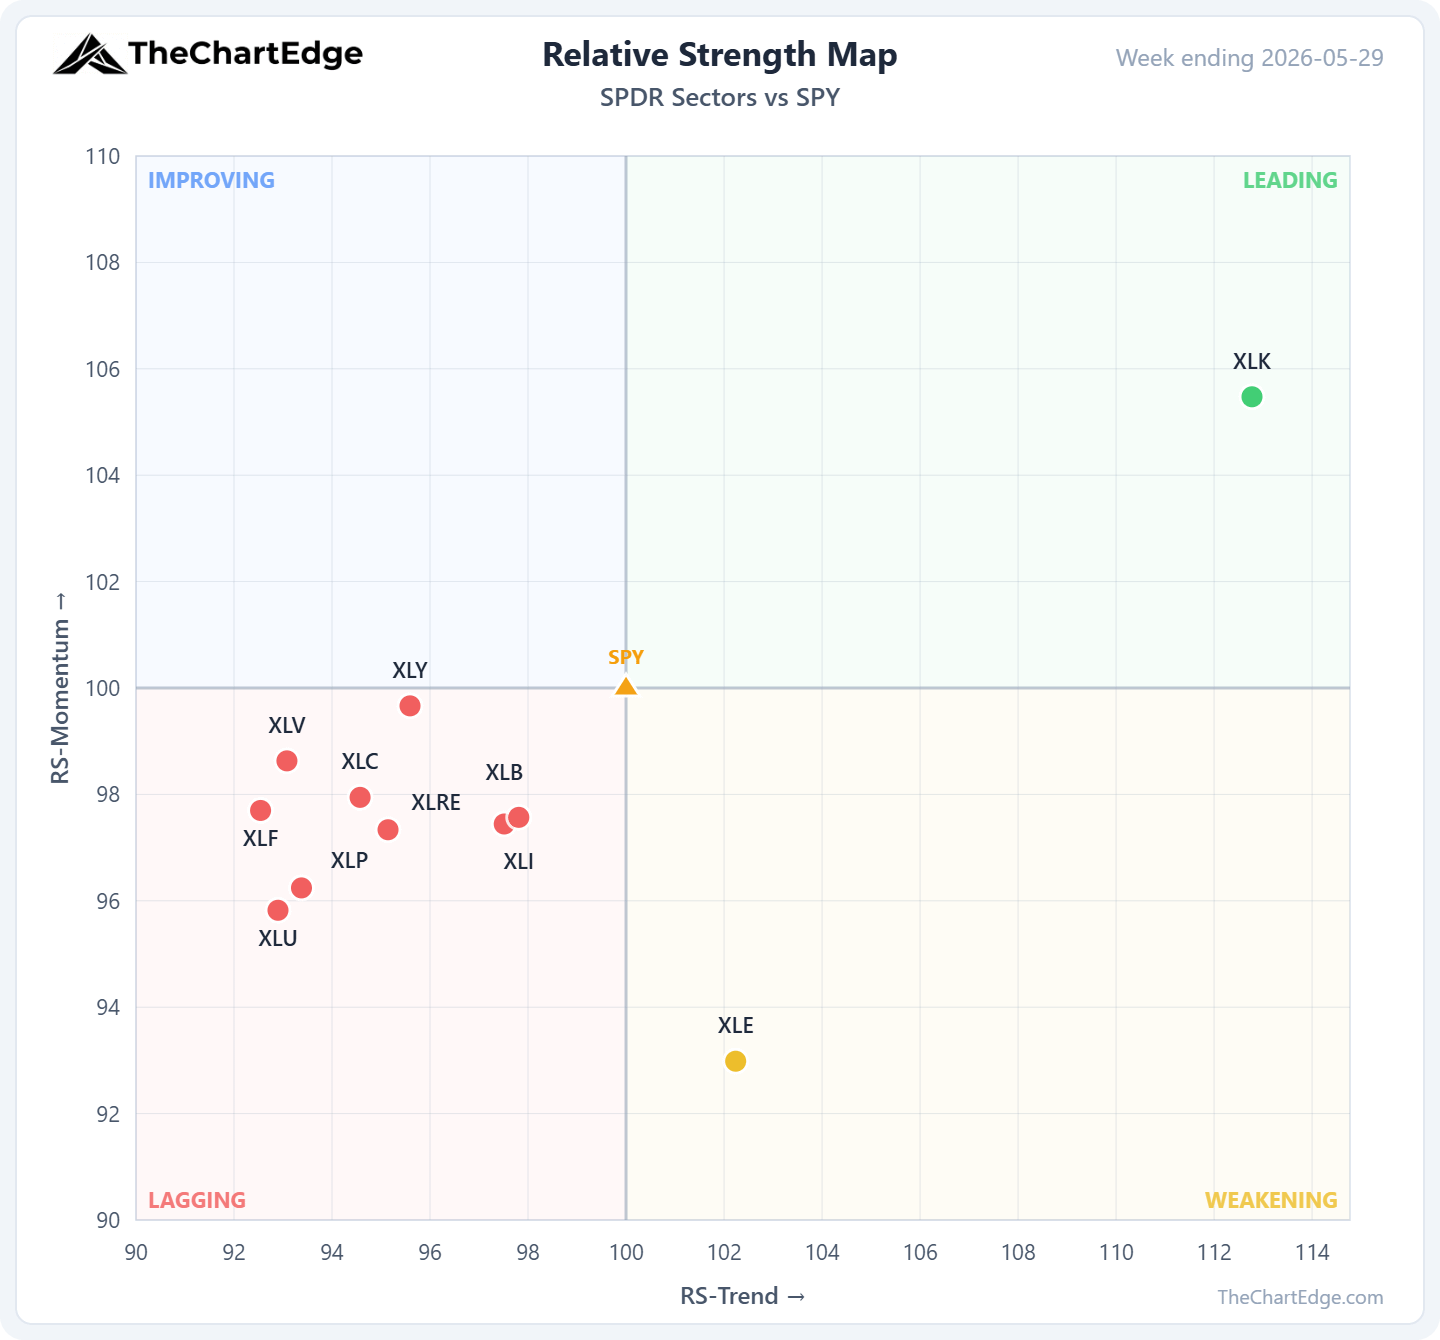
Technology (XLK) is the only GICS sector in the Leading quadrant. It gained 5.89% on the week, is up around 20% over the past month and 31.17% year-to-date. Every other sector is in Lagging, except Energy (XLE) which is in Weakening.
Two weeks ago, the three best-performing GICS sectors on the week were XLU (Utilities), XLV (Healthcare), and XLRE (Real Estate). Last week the defensive sectors underperformed: Consumer staples (XLP) fell 2.23%, utilities (XLU) -2.05%, real estate (XLRE) -1.28%, healthcare (XLV) -0.28%.
Risk Appetite is Rising
This broader risk-on tone also showed up in the factor ETFs. High beta (SPHB) gained 5.68% and closed at a new weekly all-time high. Low volatility (SPLV) fell 2.54%, and BTAL, which is long low-beta and short high-beta, dropped 5.33%, closing at a weekly all-time low.
ARK Innovation (ARKK) jumped 7.26% and crossed back into Leading. The fund is still 49% below its 2021 highs and is not something I would buy, but it’s an interesting gauge of risk sentiment. ARK Genomics (ARKG) was up 12.94% on the week. But it is also still in a massive drawdown, around 70% off its 2021 highs.
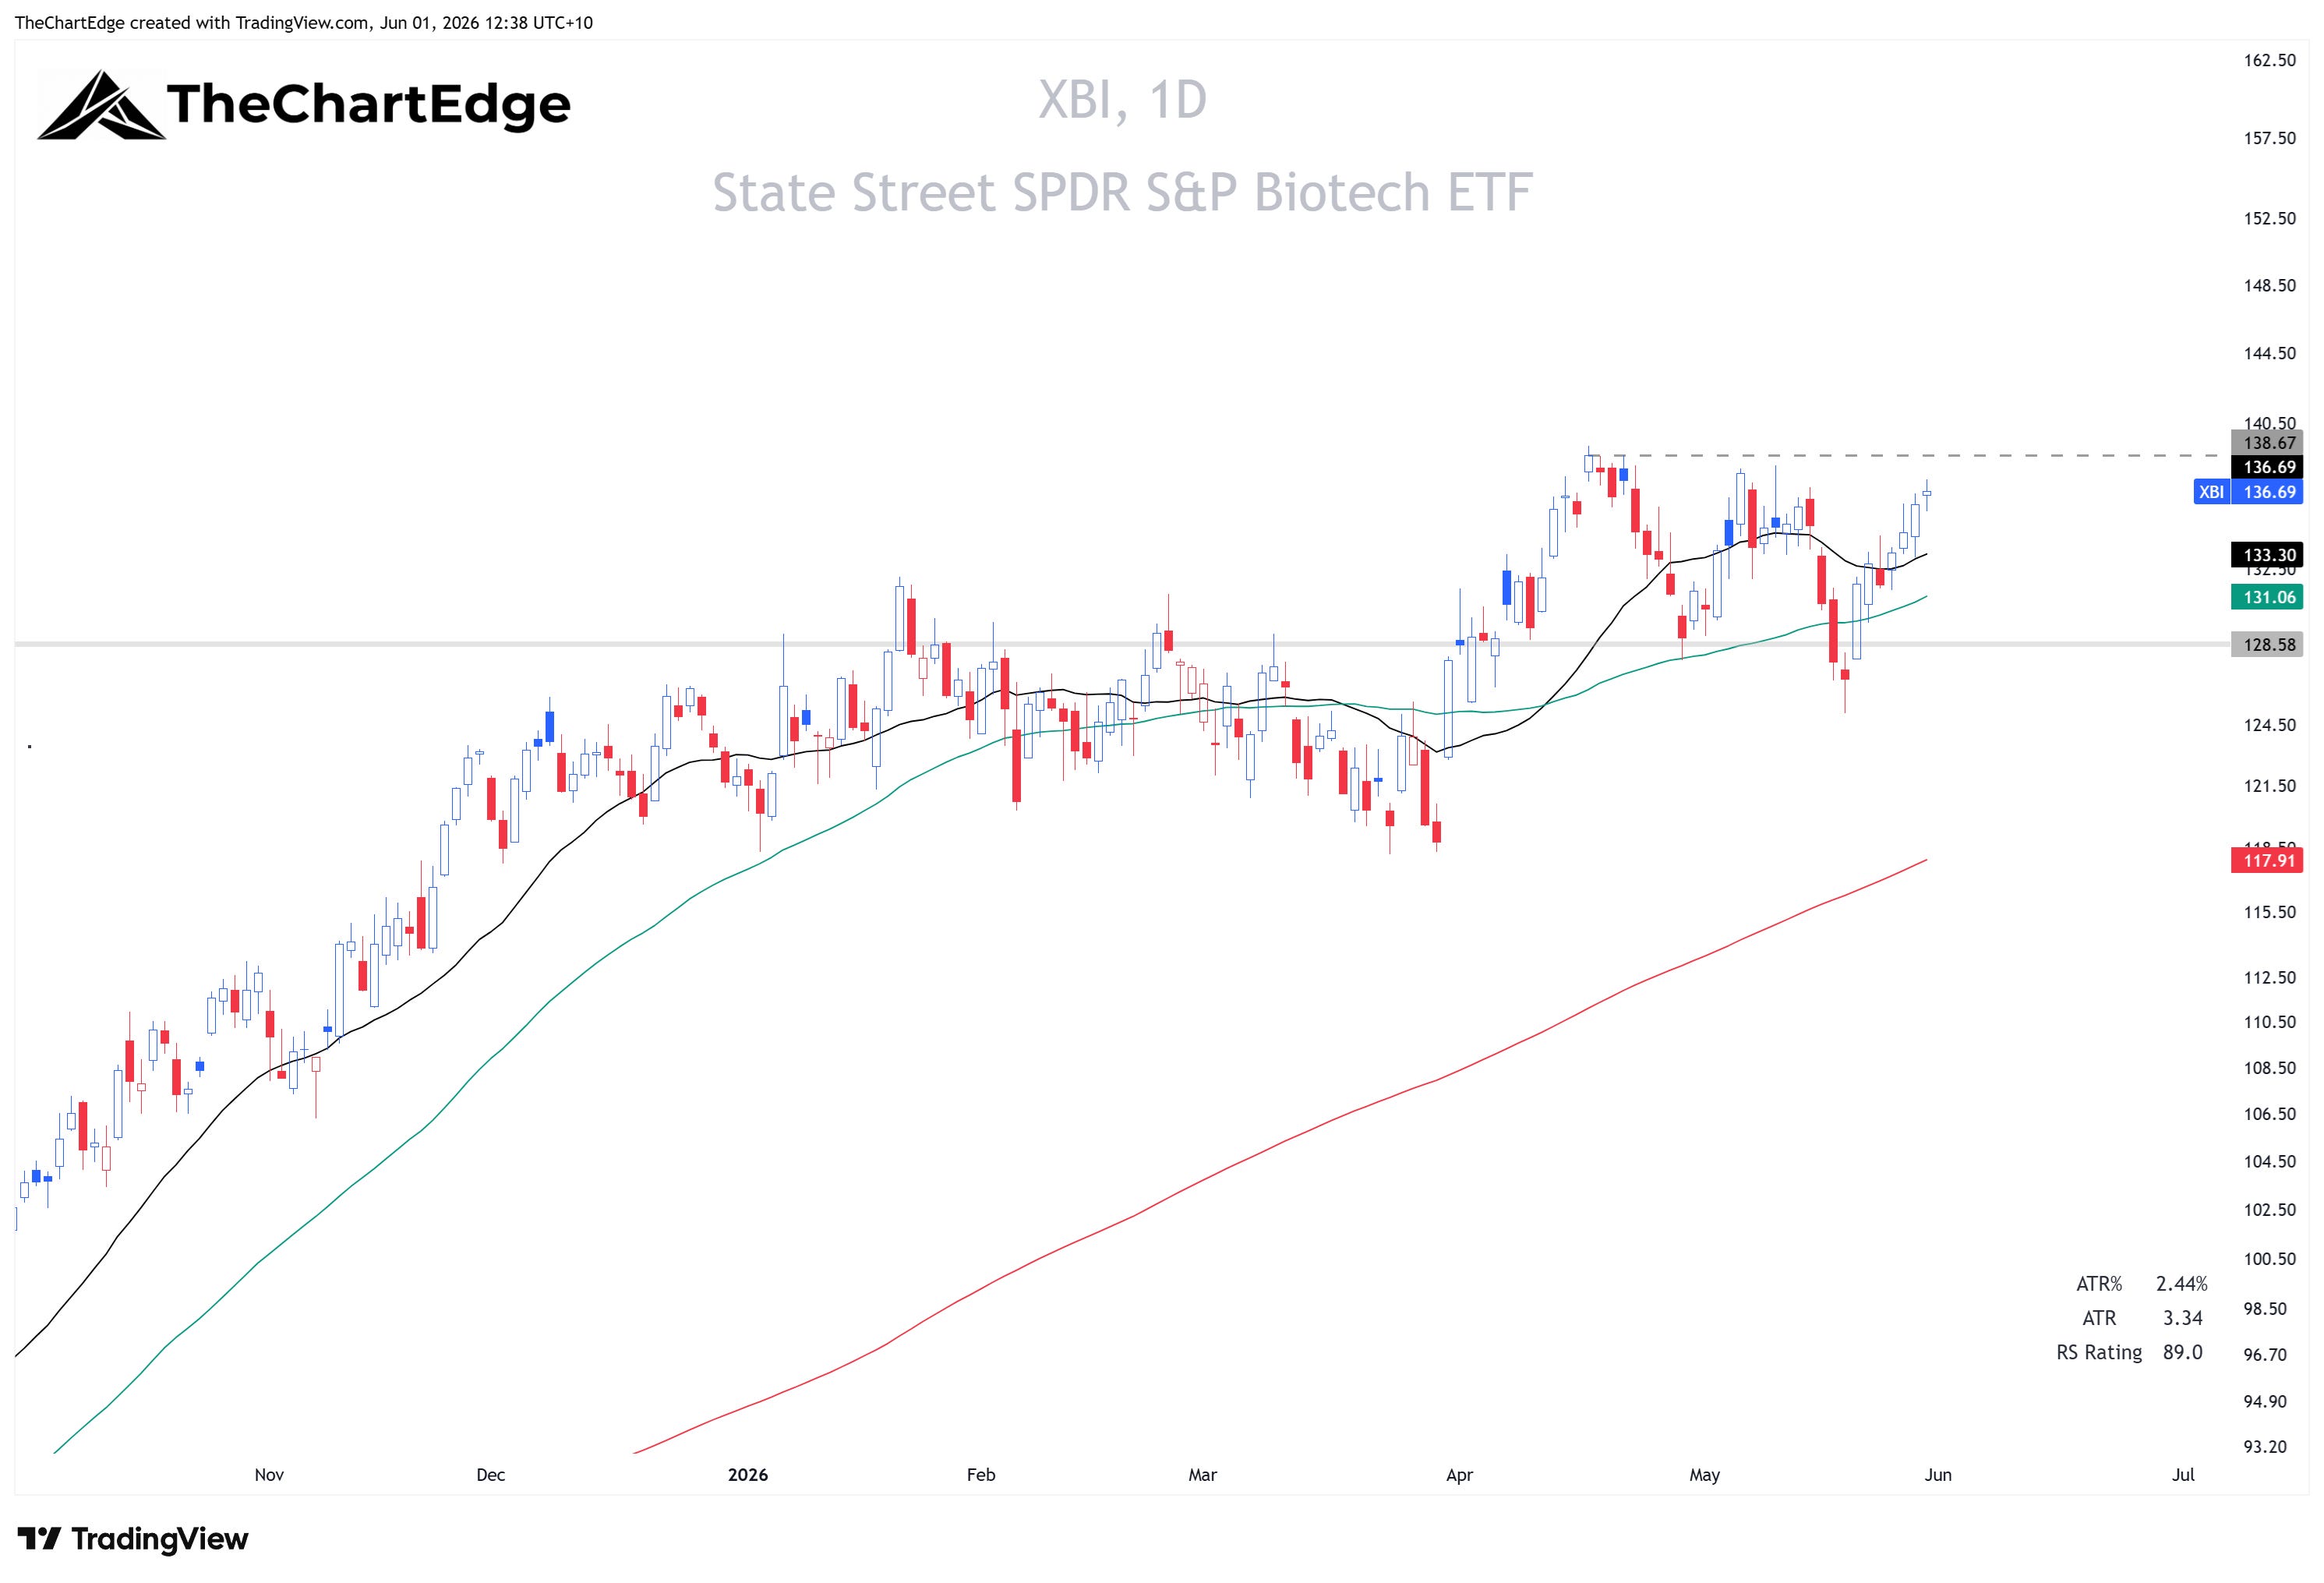
XBI is the vehicle I am looking at to play biotech. A break above recent highs around $139 could open the way to a run at the 2021 all-time highs around $174. It is in a Strong Uptrend, sitting less than 2% below its 52-week high and only about 1 x ATR above its 20-day, with RSI at 58.6. It is in the Weakening quadrant, but is sitting right on the border of Leading, with a momentum reading just under 100.
XBI Chart
Software Reclaims its 200-Day
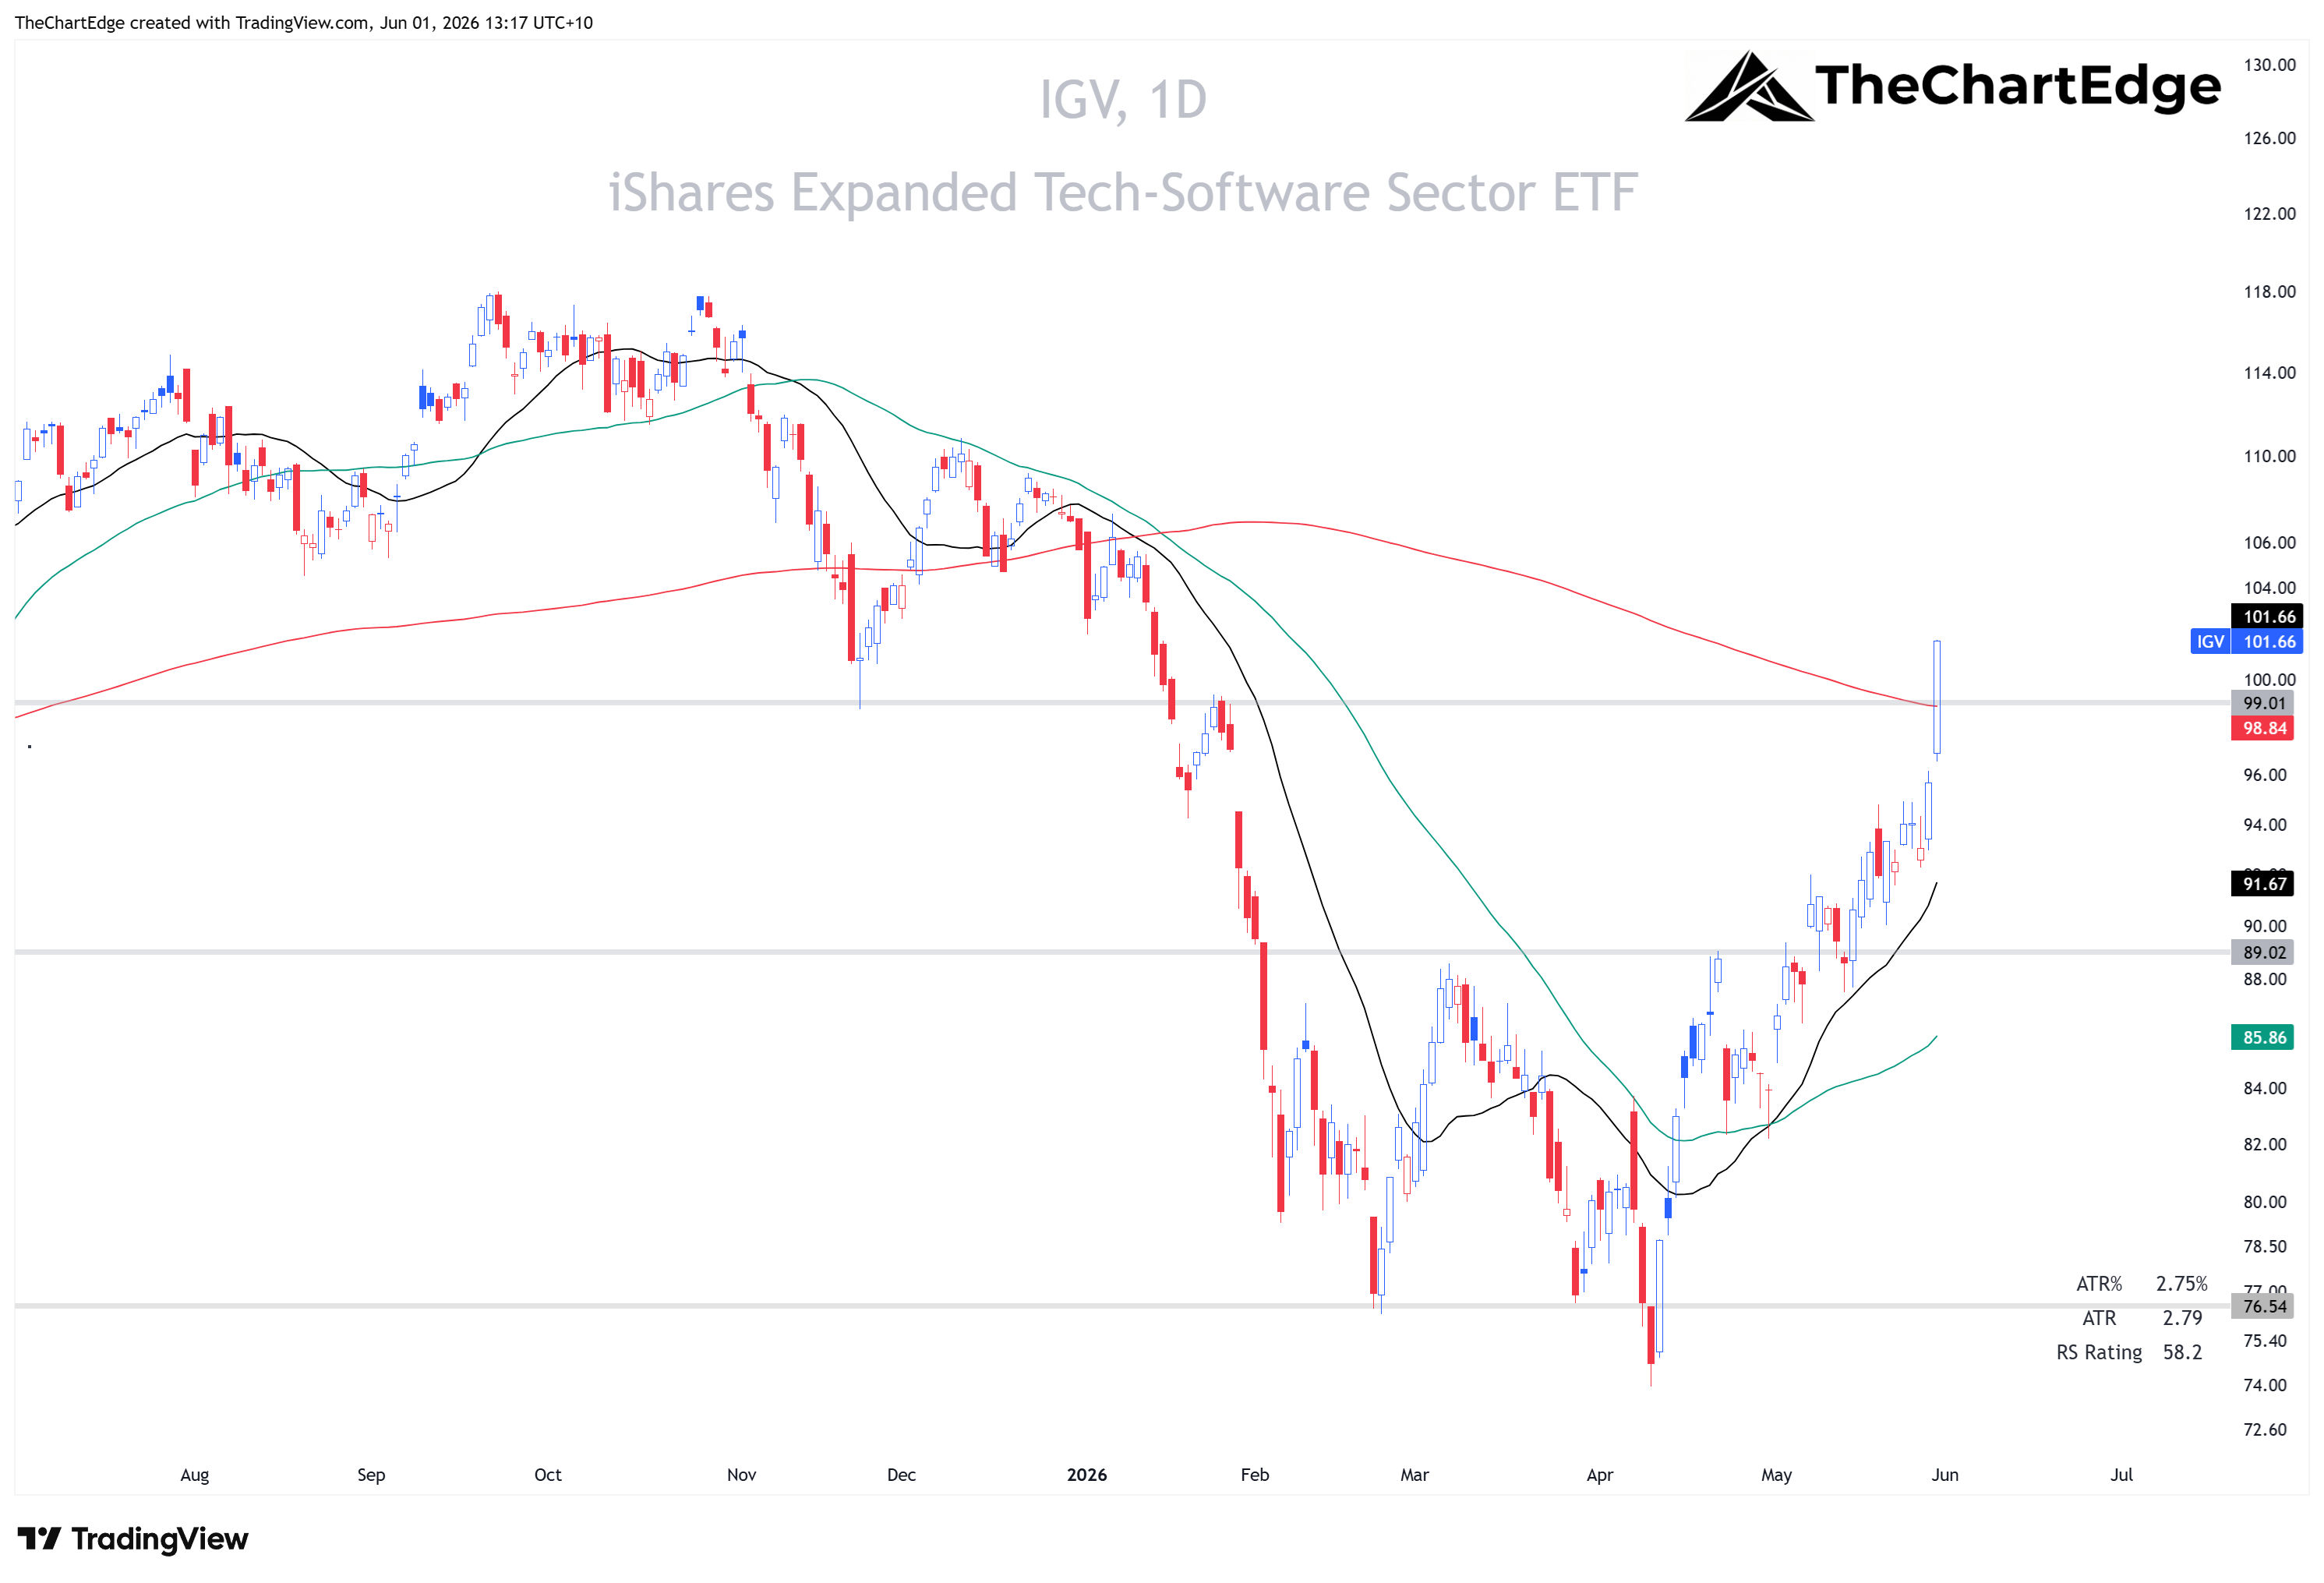
IGV gained 8.14% last week and around 20% over the past month and has closed back above its 200-day moving average for the first time since the January break. It is 13.84% off its all-time highs, with a daily RSI now at 76.1.
The leadership underneath is still mainly in cybersecurity, the crypto miners, and potential AI beneficiaries like AppLovin (APP) and Oracle (ORCL). Most of the large enterprise SAAS names are bouncing but remain “broken” under their 200SMAs.
IGV Chart
Energy - Oil Down, Gas and Clean Energy Up
Crude oil (USO) was down again last week, falling 8.39%, oil services (OIH) -5.79%, energy (XLE) -5.38%, E&P (XOP) -4.63%. All of them are still in Weakening.
Interestingly natural gas went the other way, albeit from very depressed levels. UNG gained 9.05% and was the single biggest momentum riser in our entire universe last week, crossing from Lagging into Improving.
Clean energy remains strong. Solar (TAN) gained 12.10% and Clean Energy (PBW) 5.39%, both holding in Leading.
Bonds and Rates
In last week’s note I flagged TLT’s prior low of 82.77 as a level to watch - a break below it would have been a warning. Instead, bond ETFs across the whole Treasury curve were green (rates down) for the week. TLT was up 1.28%, IEF +0.82% and IEI +0.51%.
The MOVE index, which measures expected volatility in Treasuries, fell from 78.43 to 70.22. If rate volatility had continued to rise, it would have been a possible red flag for equities.
Thoughts for the week ahead
Things look very healthy right now - every major US market index at new highs, risk appetite rising, breadth holding up, and bonds steadying as rate volatility comes down. A cautionary note is the VIX at 15.32, which is low, but not historically extreme. But after nine consecutive up weeks for the SPY, which is still quite extended from its 50SMA, a pullback shouldn’t come as a surprise when it happens.
In My Weekly Focus List piece last week, I outlined 10 stocks I was watching, 8 with specific entries and stops. 4 triggered last week: HUT, CIEN, KLAC and MKSI. I will update that in a new post today or tomorrow, detailing any changes and a few potential new entries. I am not taking large new positions here, though, and am being patient.
Stay open-minded and manage risk carefully.
Cheers,
Marcus Grant, CFTe
Disclaimer: The content provided in this newsletter is for informational and educational purposes only and should not be considered as financial, investment, or legal advice. The information shared is based on our research and analysis, but we are not a licensed financial advisor, nor can we guarantee its accuracy, completeness, or timeliness. Market conditions and financial instruments can change rapidly, and any opinions expressed may not be suitable for all investors. Any opinions expressed and or securities mentioned do not constitute a recommendation to buy, sell, or hold that or any other security. You should conduct your own due diligence and consult with a licensed financial advisor or other professional before making any investment decisions. Past performance is not indicative of future results, and all investments carry the risk of loss. The authors and publishers of this newsletter are not responsible for any financial decisions made based on the content provided herein. By reading and or subscribing to this newsletter, you acknowledge and agree that you are using the information at your own risk.