


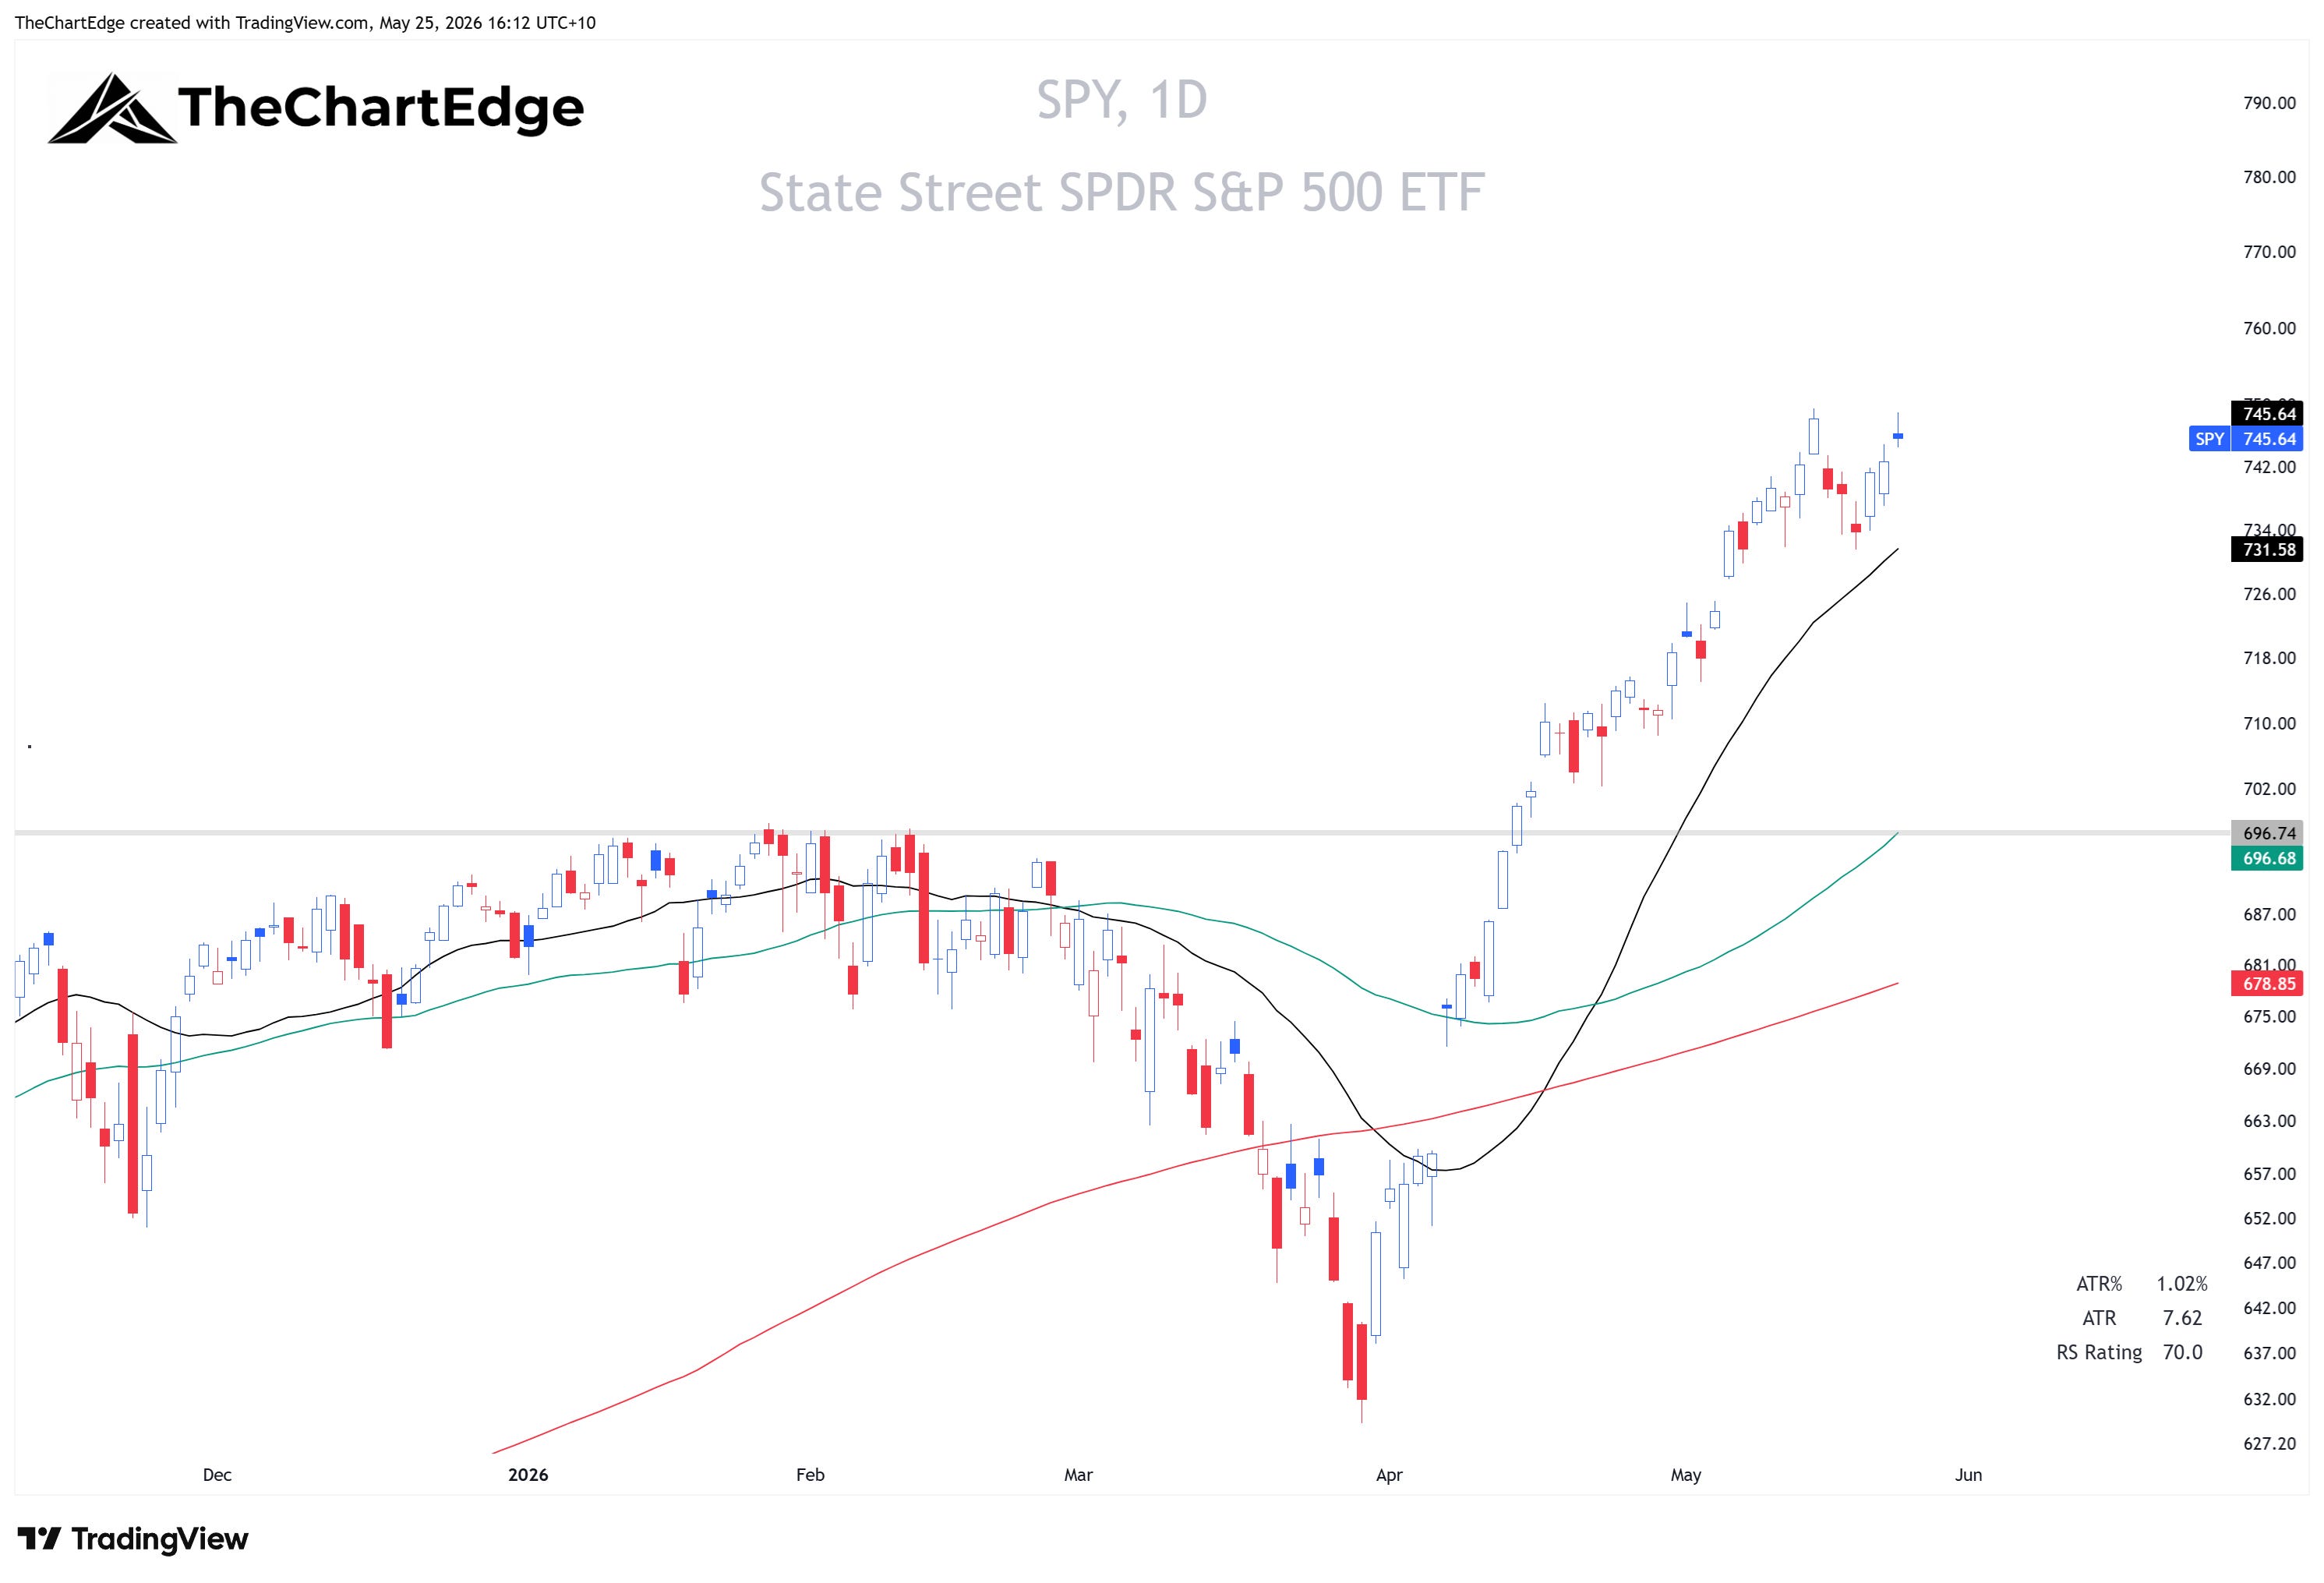
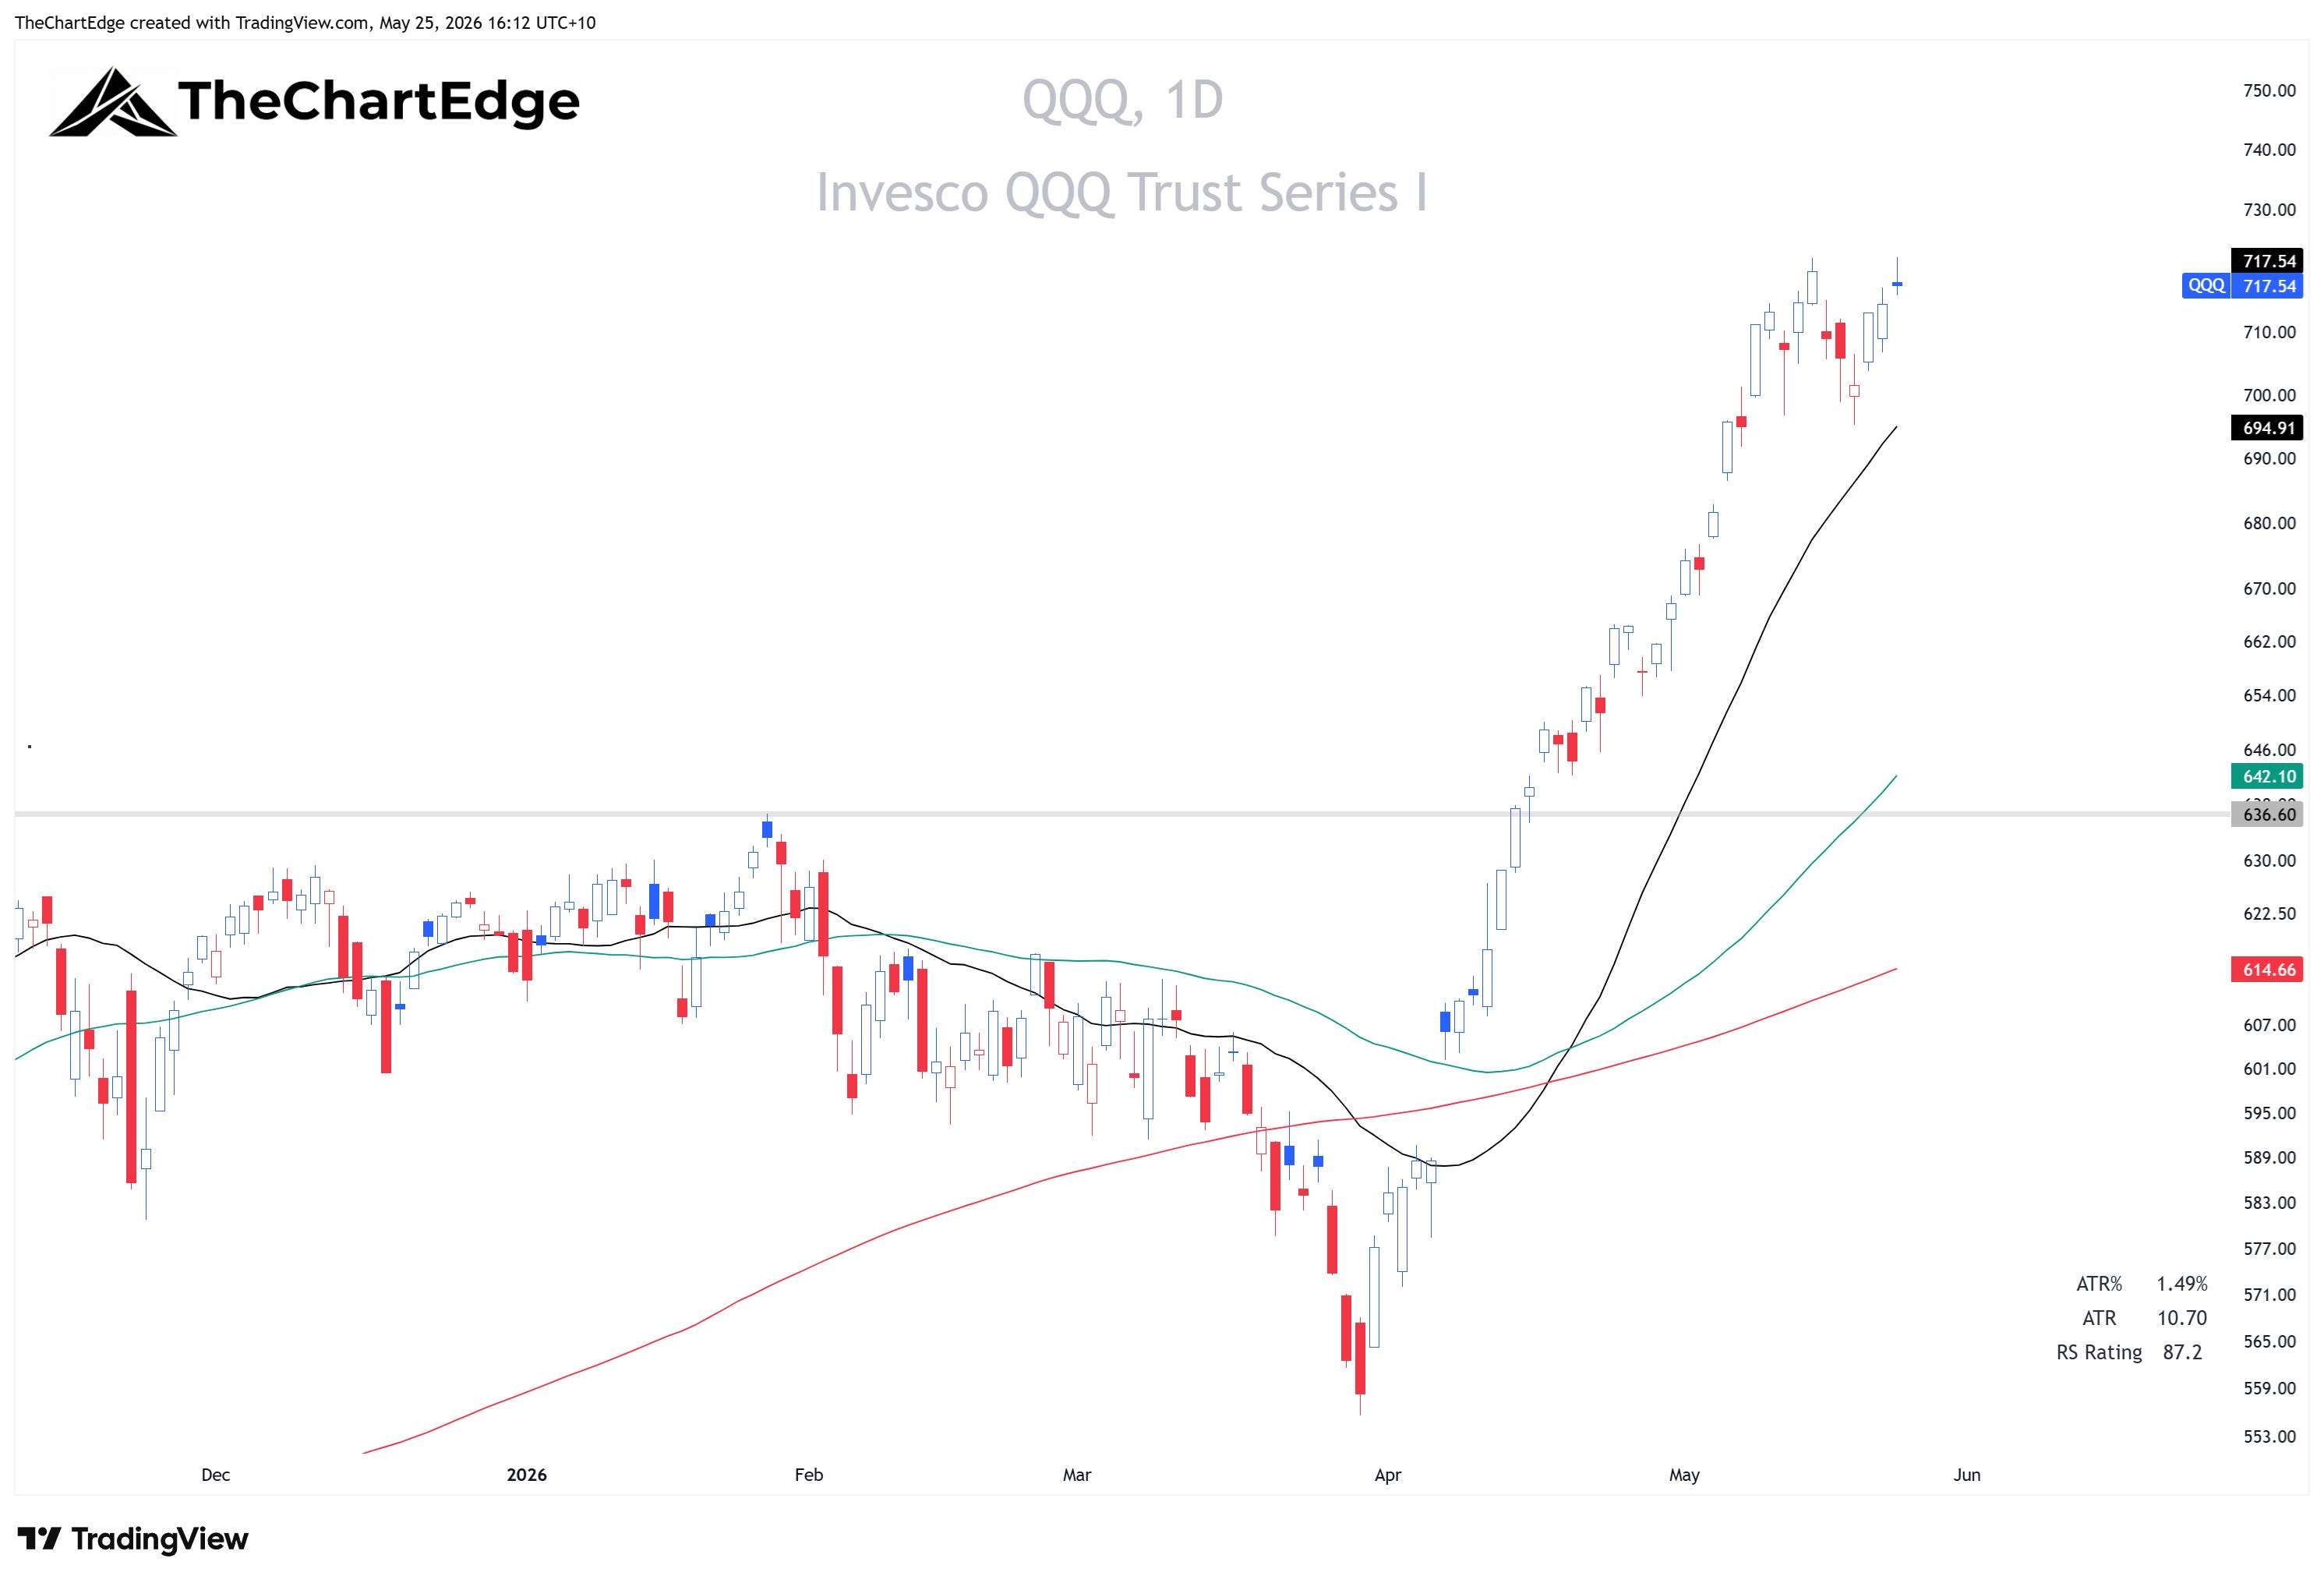
The S&P 500 (SPY) gained 0.88% last week (May 22). The Nasdaq 100 (QQQ) rose 1.21%. But the bigger story was underneath - the Russell 2000 (IWM) gained 2.71%, the S&P MidCap 400 (MDY) added 1.72%, and the equal-weight S&P 500 (RSP) was up 2.49%. The Dow (DIA) rose 2.17%. Small caps, mid-caps, and equal weight all outperformed the cap-weighted large-cap indices.
Two weeks ago (May 15), only 21 of 121 ETFs were positive. Last week, 98 were positive.
SPY Chart
QQQ Chart
Market Temperature
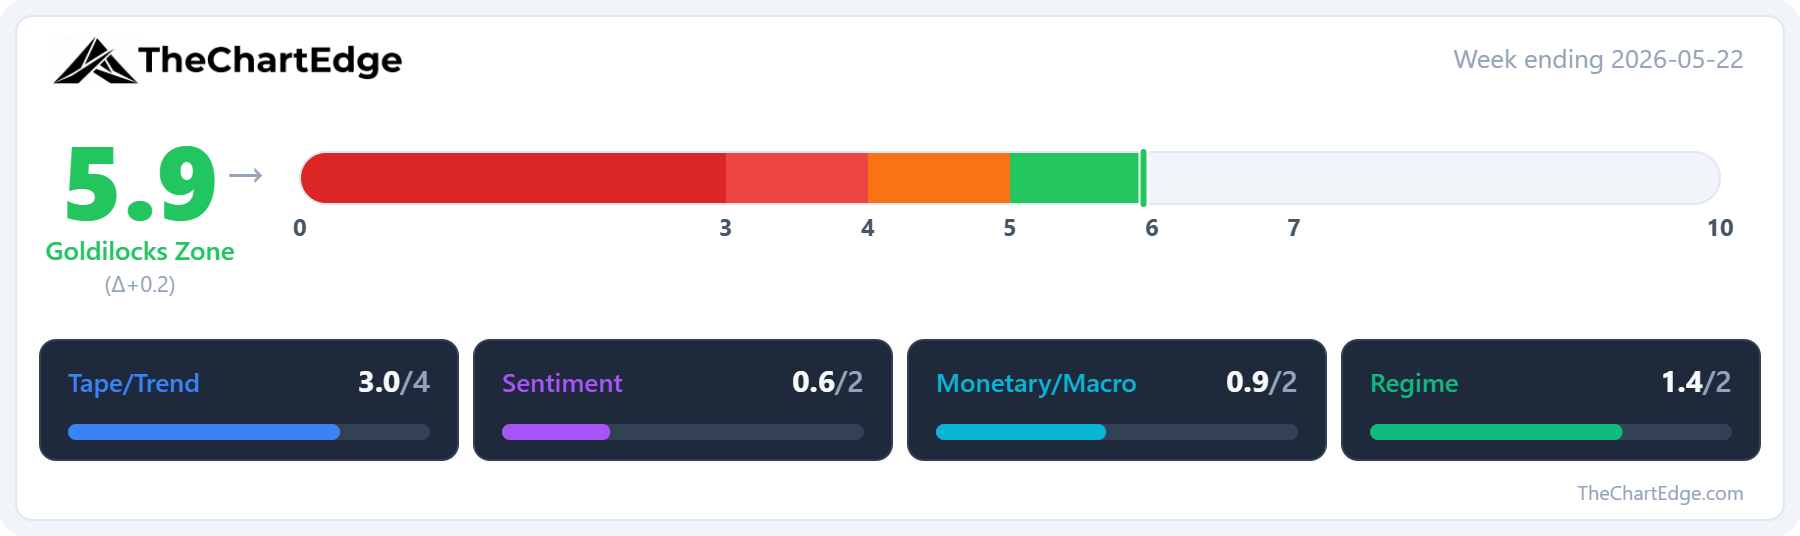
The Market Temperature ticked up to 5.9 from 5.7, remaining in the Goldilocks Zone.
Breadth recovered - MMFI (% of US stocks above their 50-day moving average) climbed from 49.74 to 57.18, and MMTH (% above 200-day) improved from 50.44 to 53.60.
The VIX dropped from 18.43 to 16.70.
Why only +0.2 despite a broad rally? Three of four pillars improved, but Sentiment was a drag - the VIX dropped to 16.70, which the model scores as a contrarian signal. The Monetary pillar improved marginally but still has the most room to run if bond volatility compresses and the dollar eases. The MOVE Index barely budged (79.87 to 78.43), the US dollar (UUP) stayed flat at 27.77, and credit spreads improved marginally, but remain at low levels and are not indicating any signs of stress currently. TLT bounced 1.22% last week after falling 2.81% the prior week, closing strongly after probing new lows during the week - I will be watching last week’s low of 82.77. A break below that would be a potential warning sign.
SPDR Sector Relative Strength
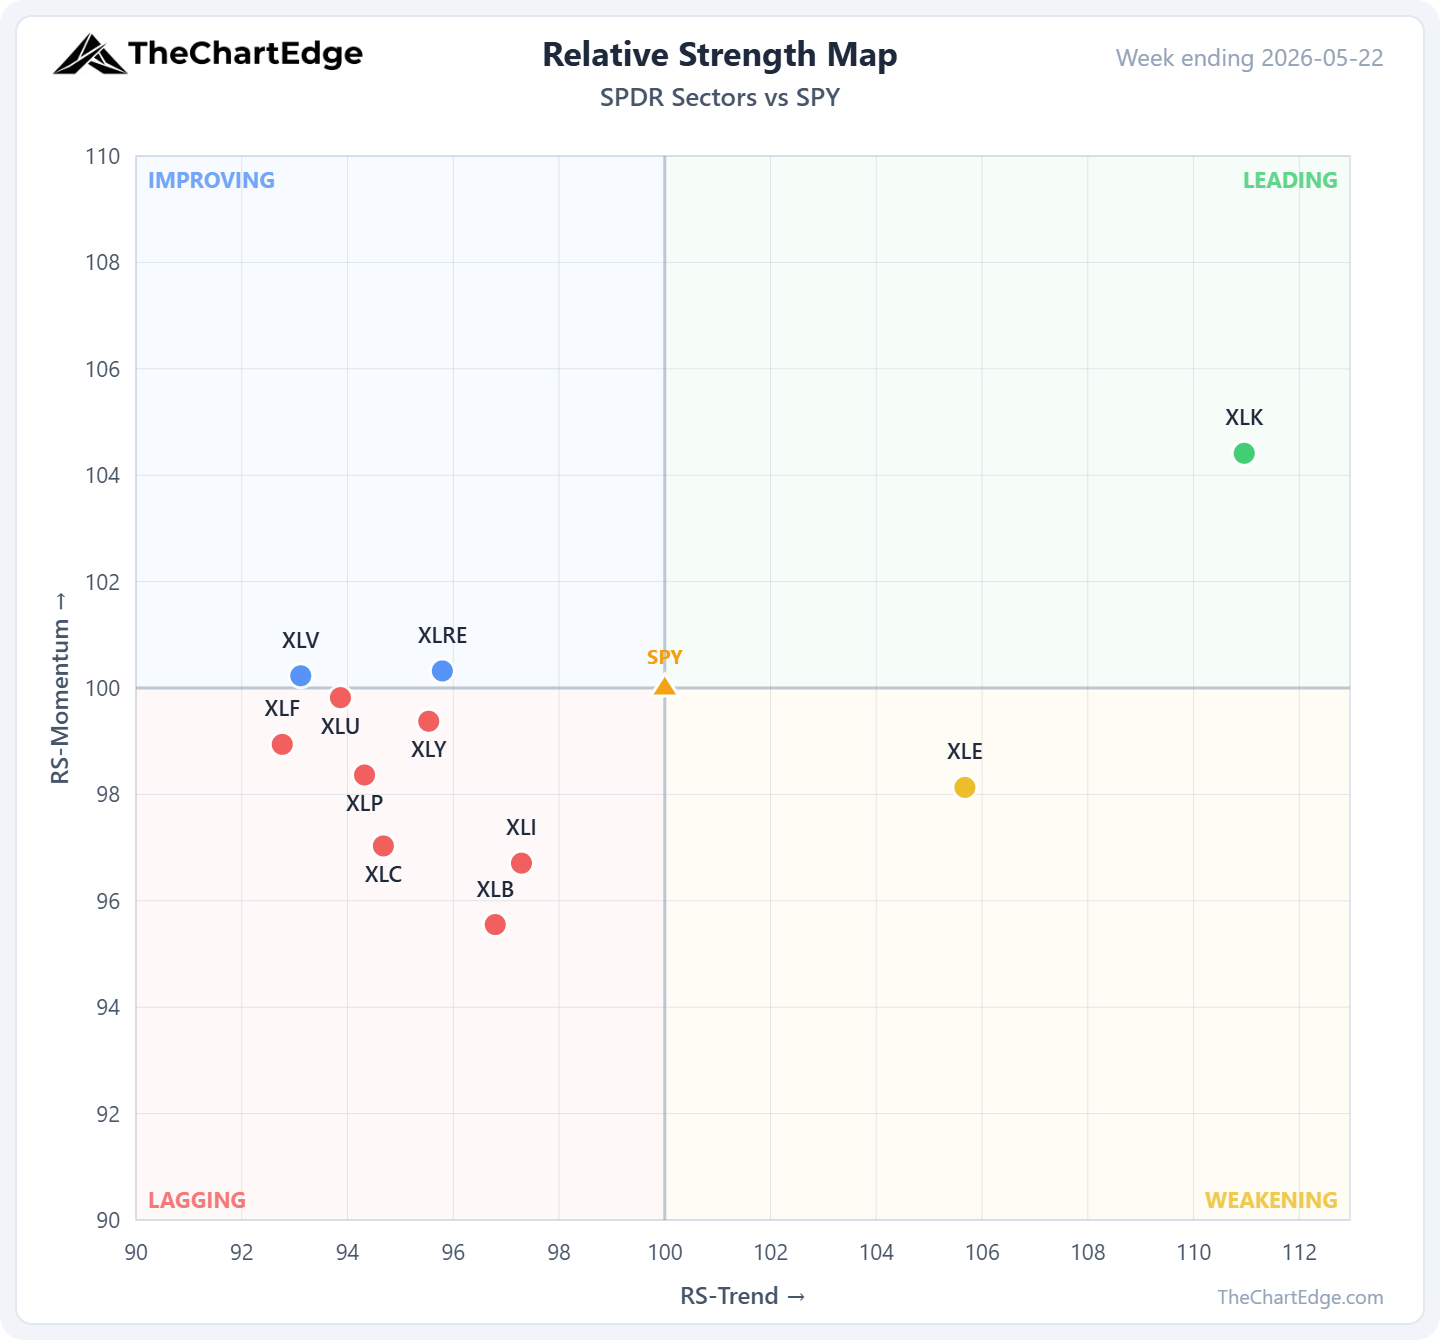
XLK (Technology) is the only GICS sector in Leading. Interestingly, the three best-performing GICS sectors on the week were all more defensive - XLU (Utilities, +3.37%), XLV (Healthcare, +3.30%), and XLRE (Real Estate, +3.08%). XLV and XLRE both moved from Lagging to Improving, and XLU is right on the boundary.
Broadening Participation
Across our 121-ETF universe, eight names moved from Lagging to Improving - utilities (RSPU, UTES), real estate (RSPR, XLRE), healthcare (XLV), Germany (EWG), airlines (JETS), and software (XSW).
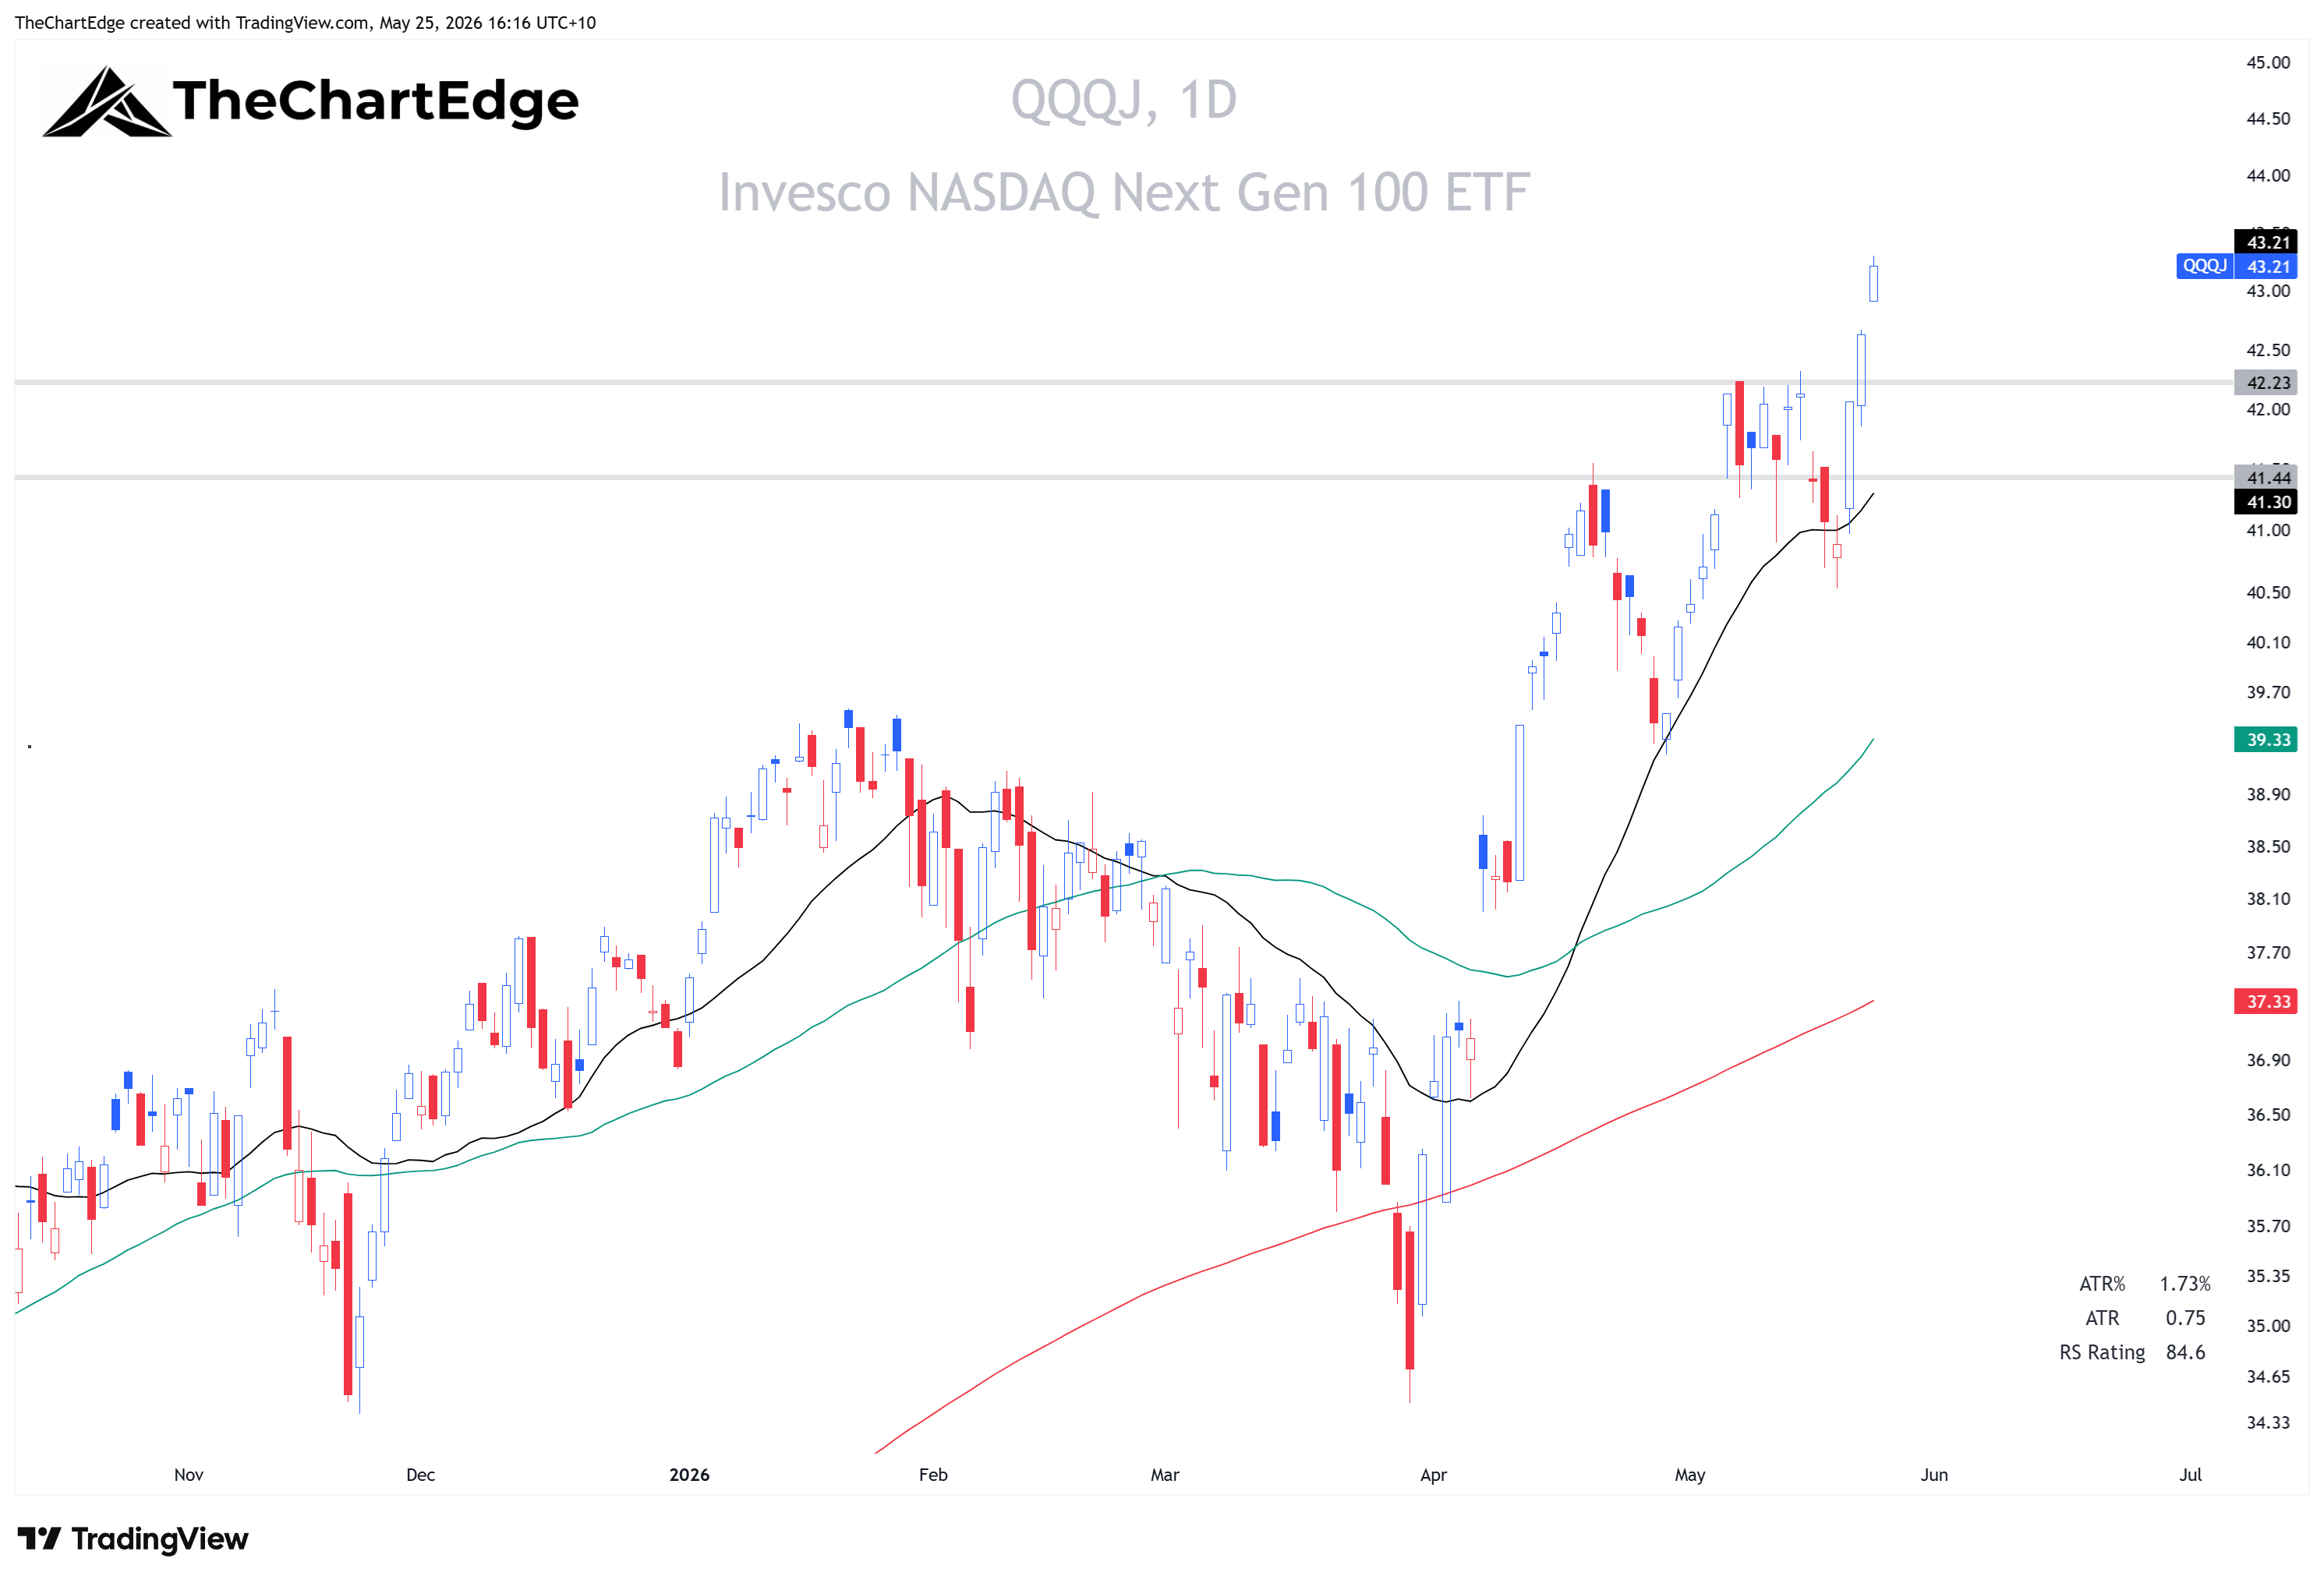
23 ETFs in our ETF universe are now within 1% of their all-time highs. And it’s not all tech - it includes RSP (S&P 500 Equal Weight), IWD (Russell 1000 Value), DIA (Dow 30), IWM (Russell 2000), and QQQJ (Nasdaq Next 100) alongside the usual AI and semiconductor names. QQQJ - which contains the next tier of non-financial NASDAQ names below QQQ - gained 4.37% vs QQQ’s 1.21%.
Semiconductors, Software, Cyber, and Speculative Tech
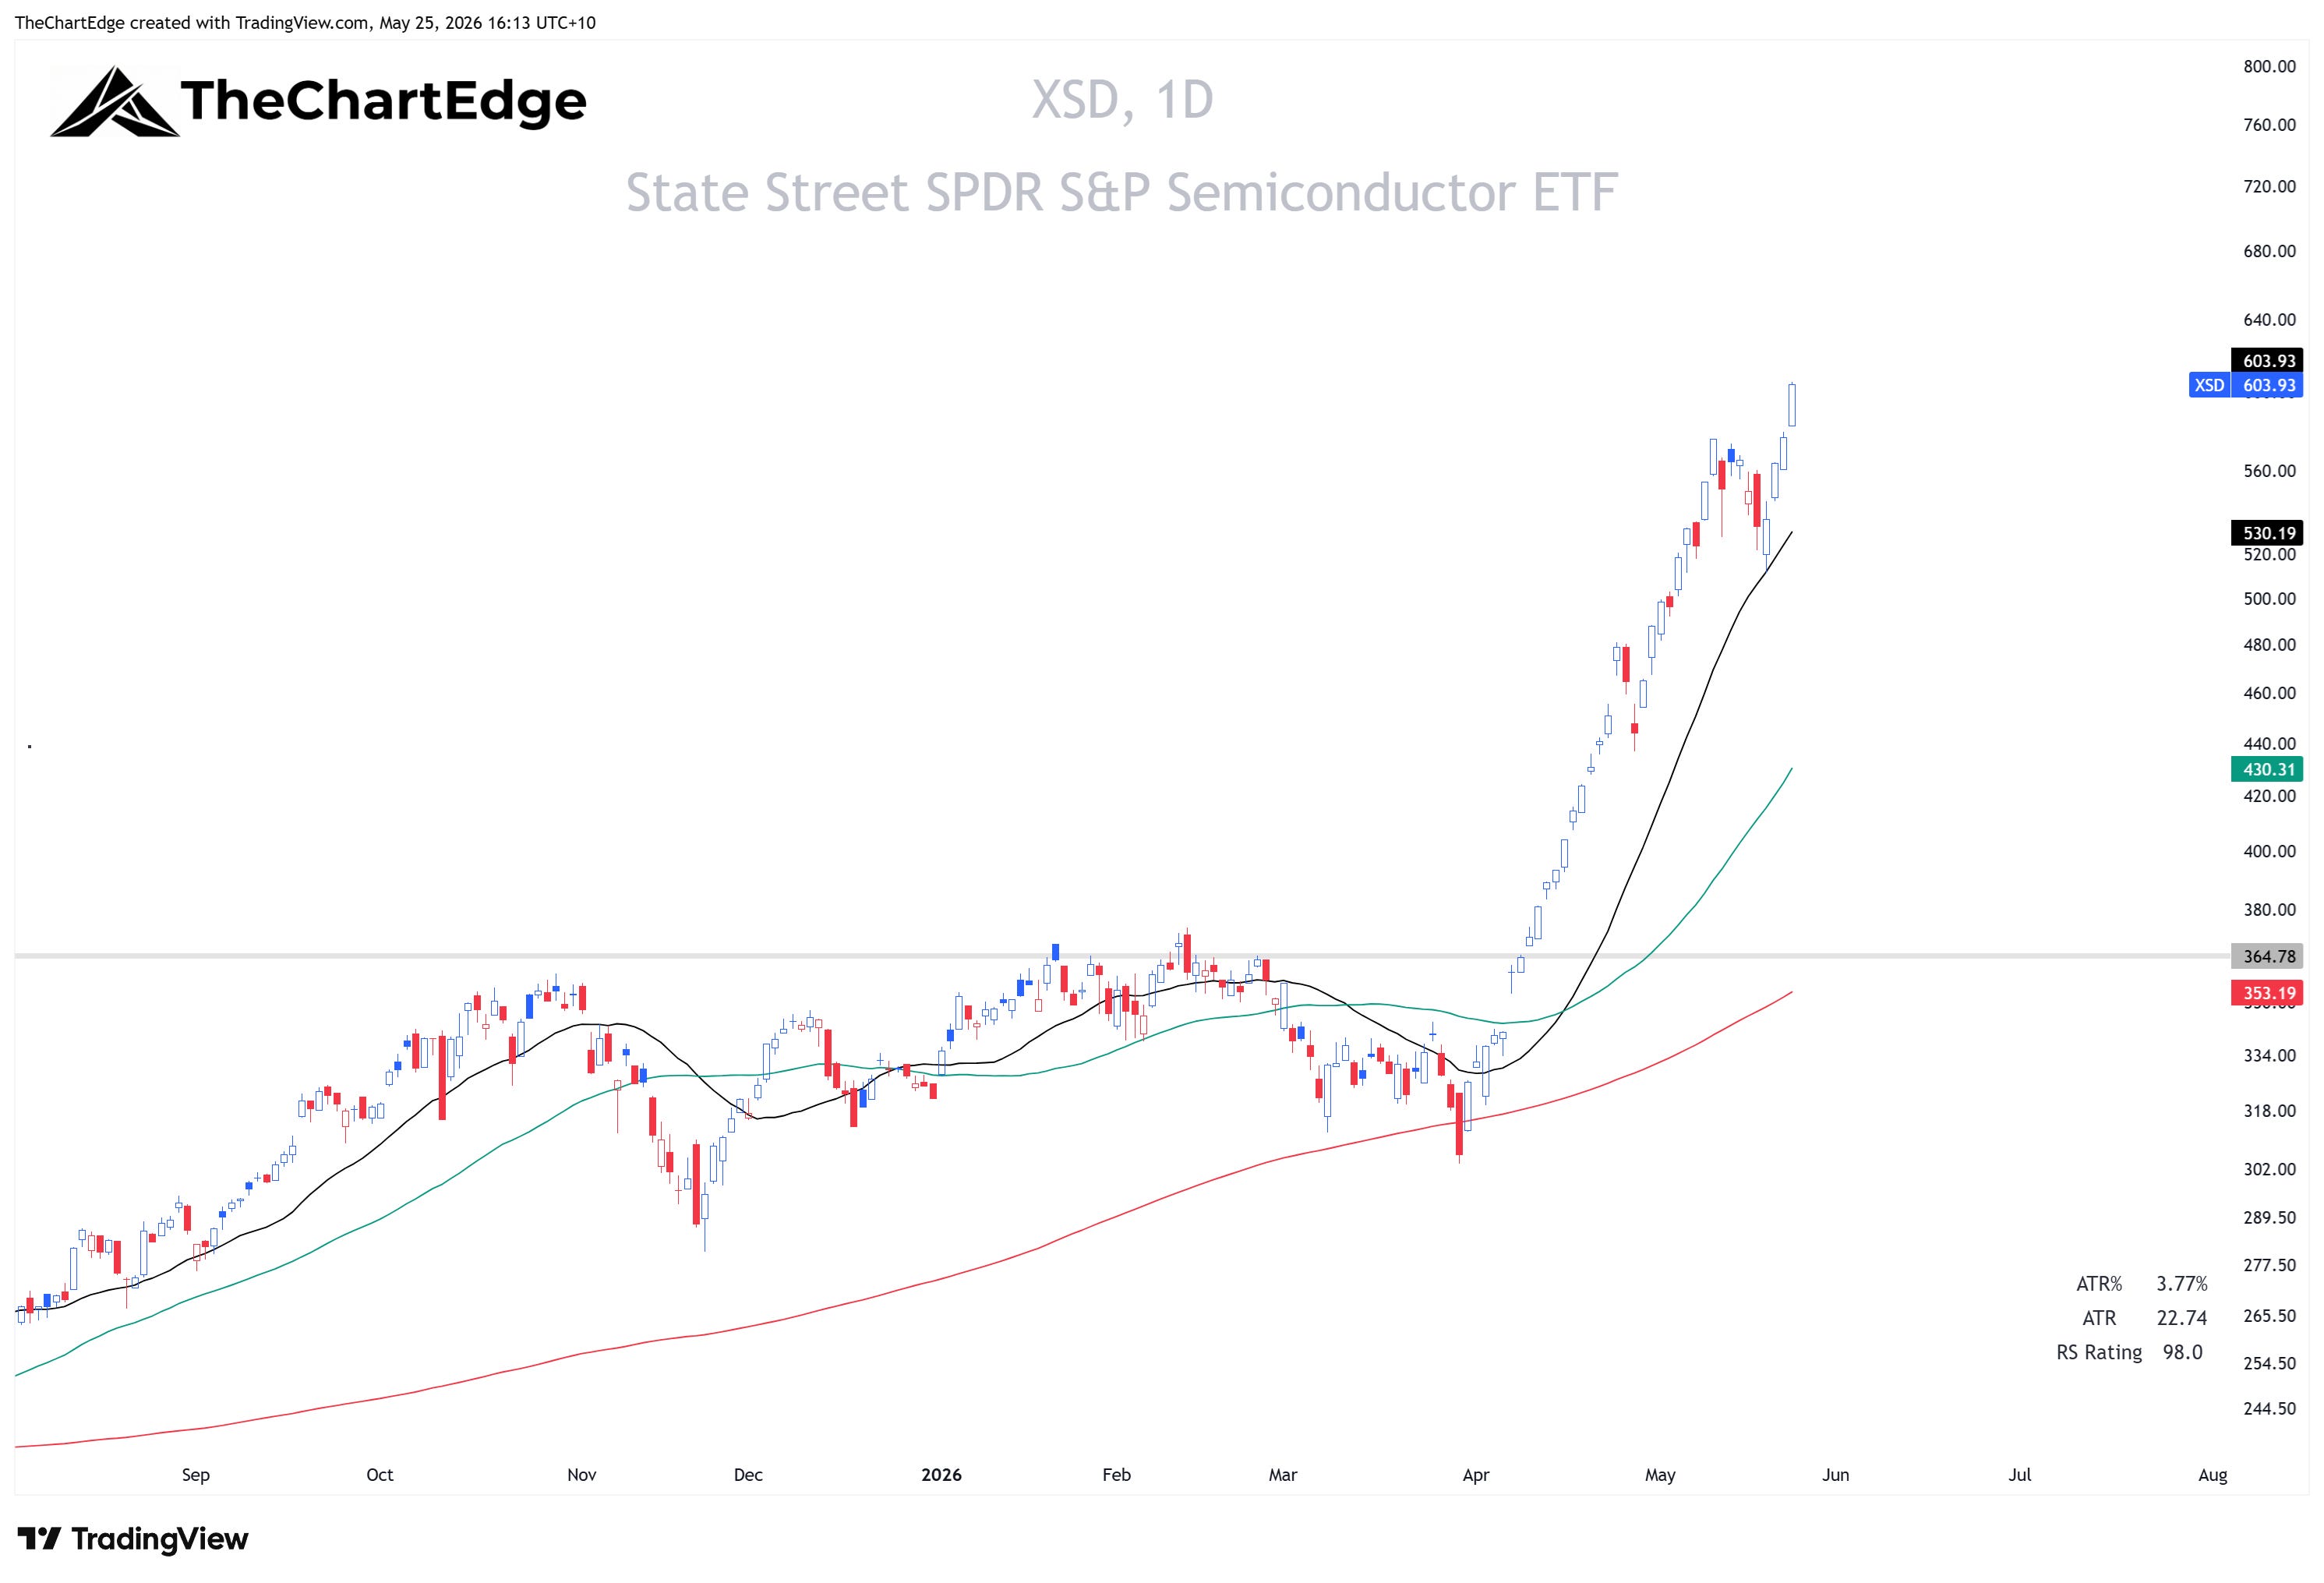
XSD (Equal-Weight Semiconductors) gained 9.89% last week finishing the week at a new all-time closing high. RS-Momentum hit 113.62 - the highest reading in our universe. The leadership is mid/small-cap semis: NVTS +37%, ALAB +32%, CRDO +27%, LSCC +19% on the week. SMH (Market Cap weighted Semiconductors) was up 3.59%.
XSD Chart
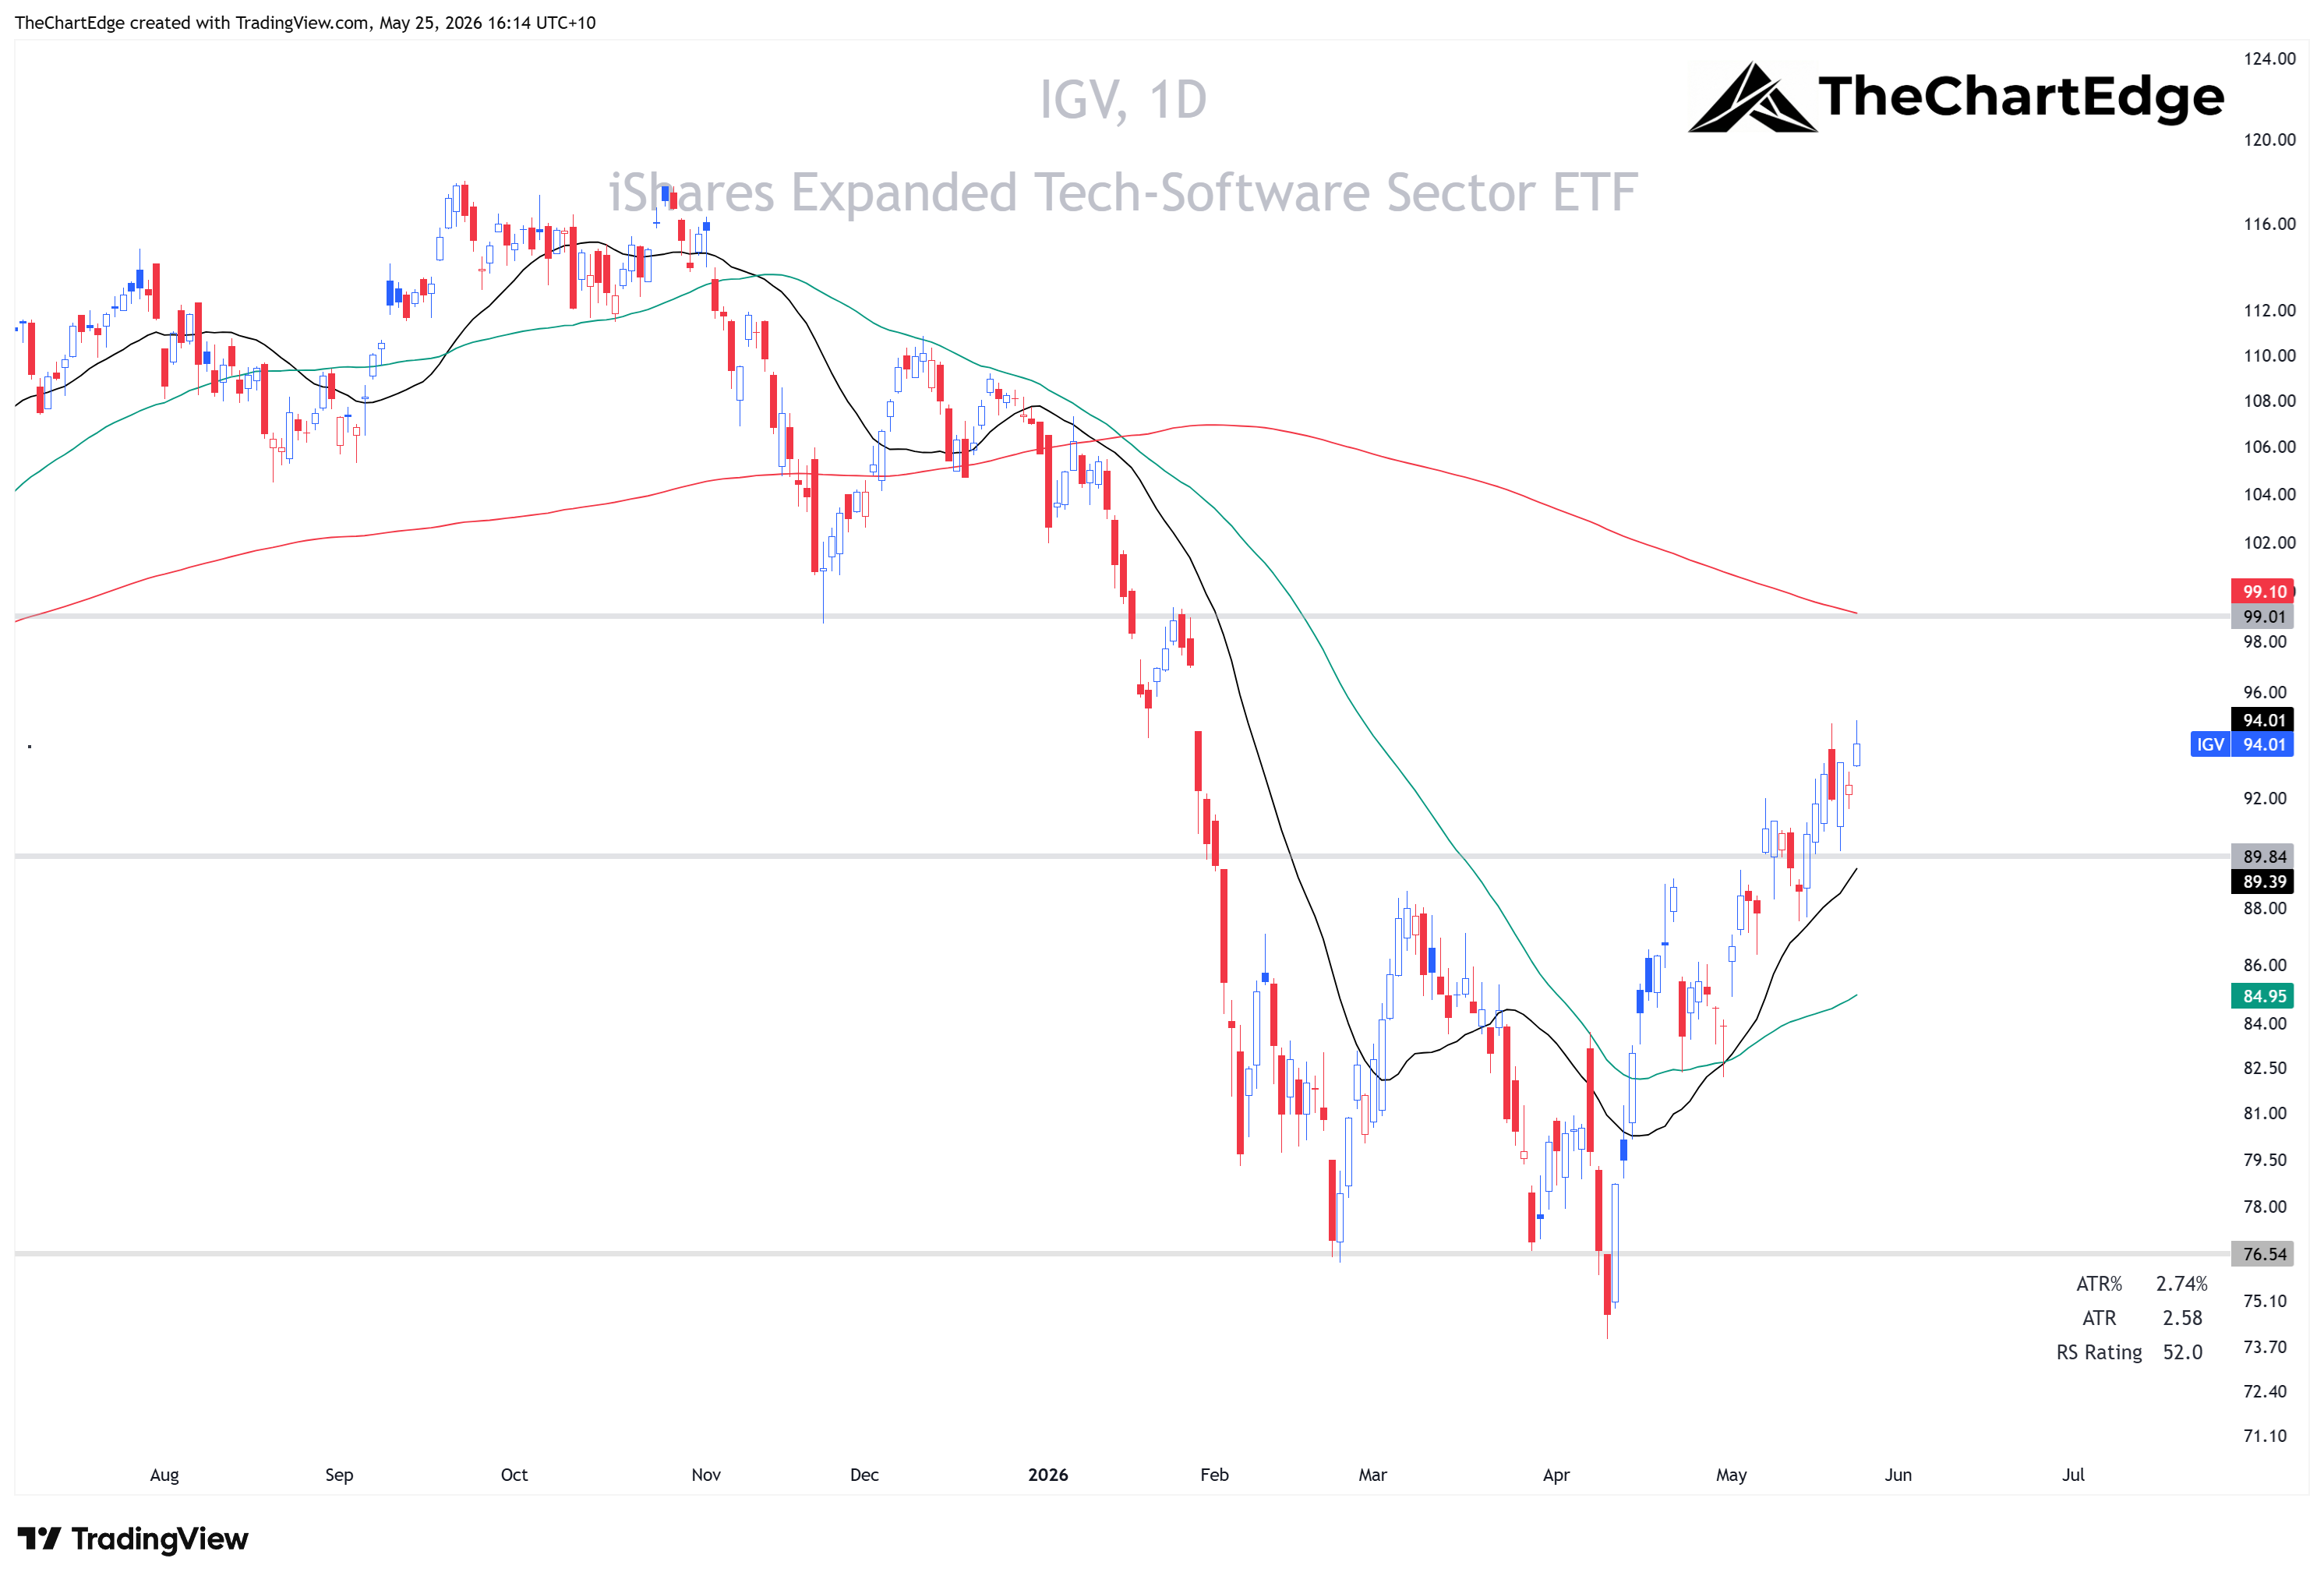
IGV (Software) is in the Improving quadrant, but a drill-down into its components tells a more nuanced story. Of the 21 Leading names in the software universe, seven are cybersecurity and three are crypto miners. The large enterprise software names - CRM, ADBE, NOW, WDAY, HUBS - are almost all Lagging with YTDs ranging from -30% to -49%. INTU lost 18.59% just last week. The “software rally” is really a cyber and AI infrastructure story wearing a software label.
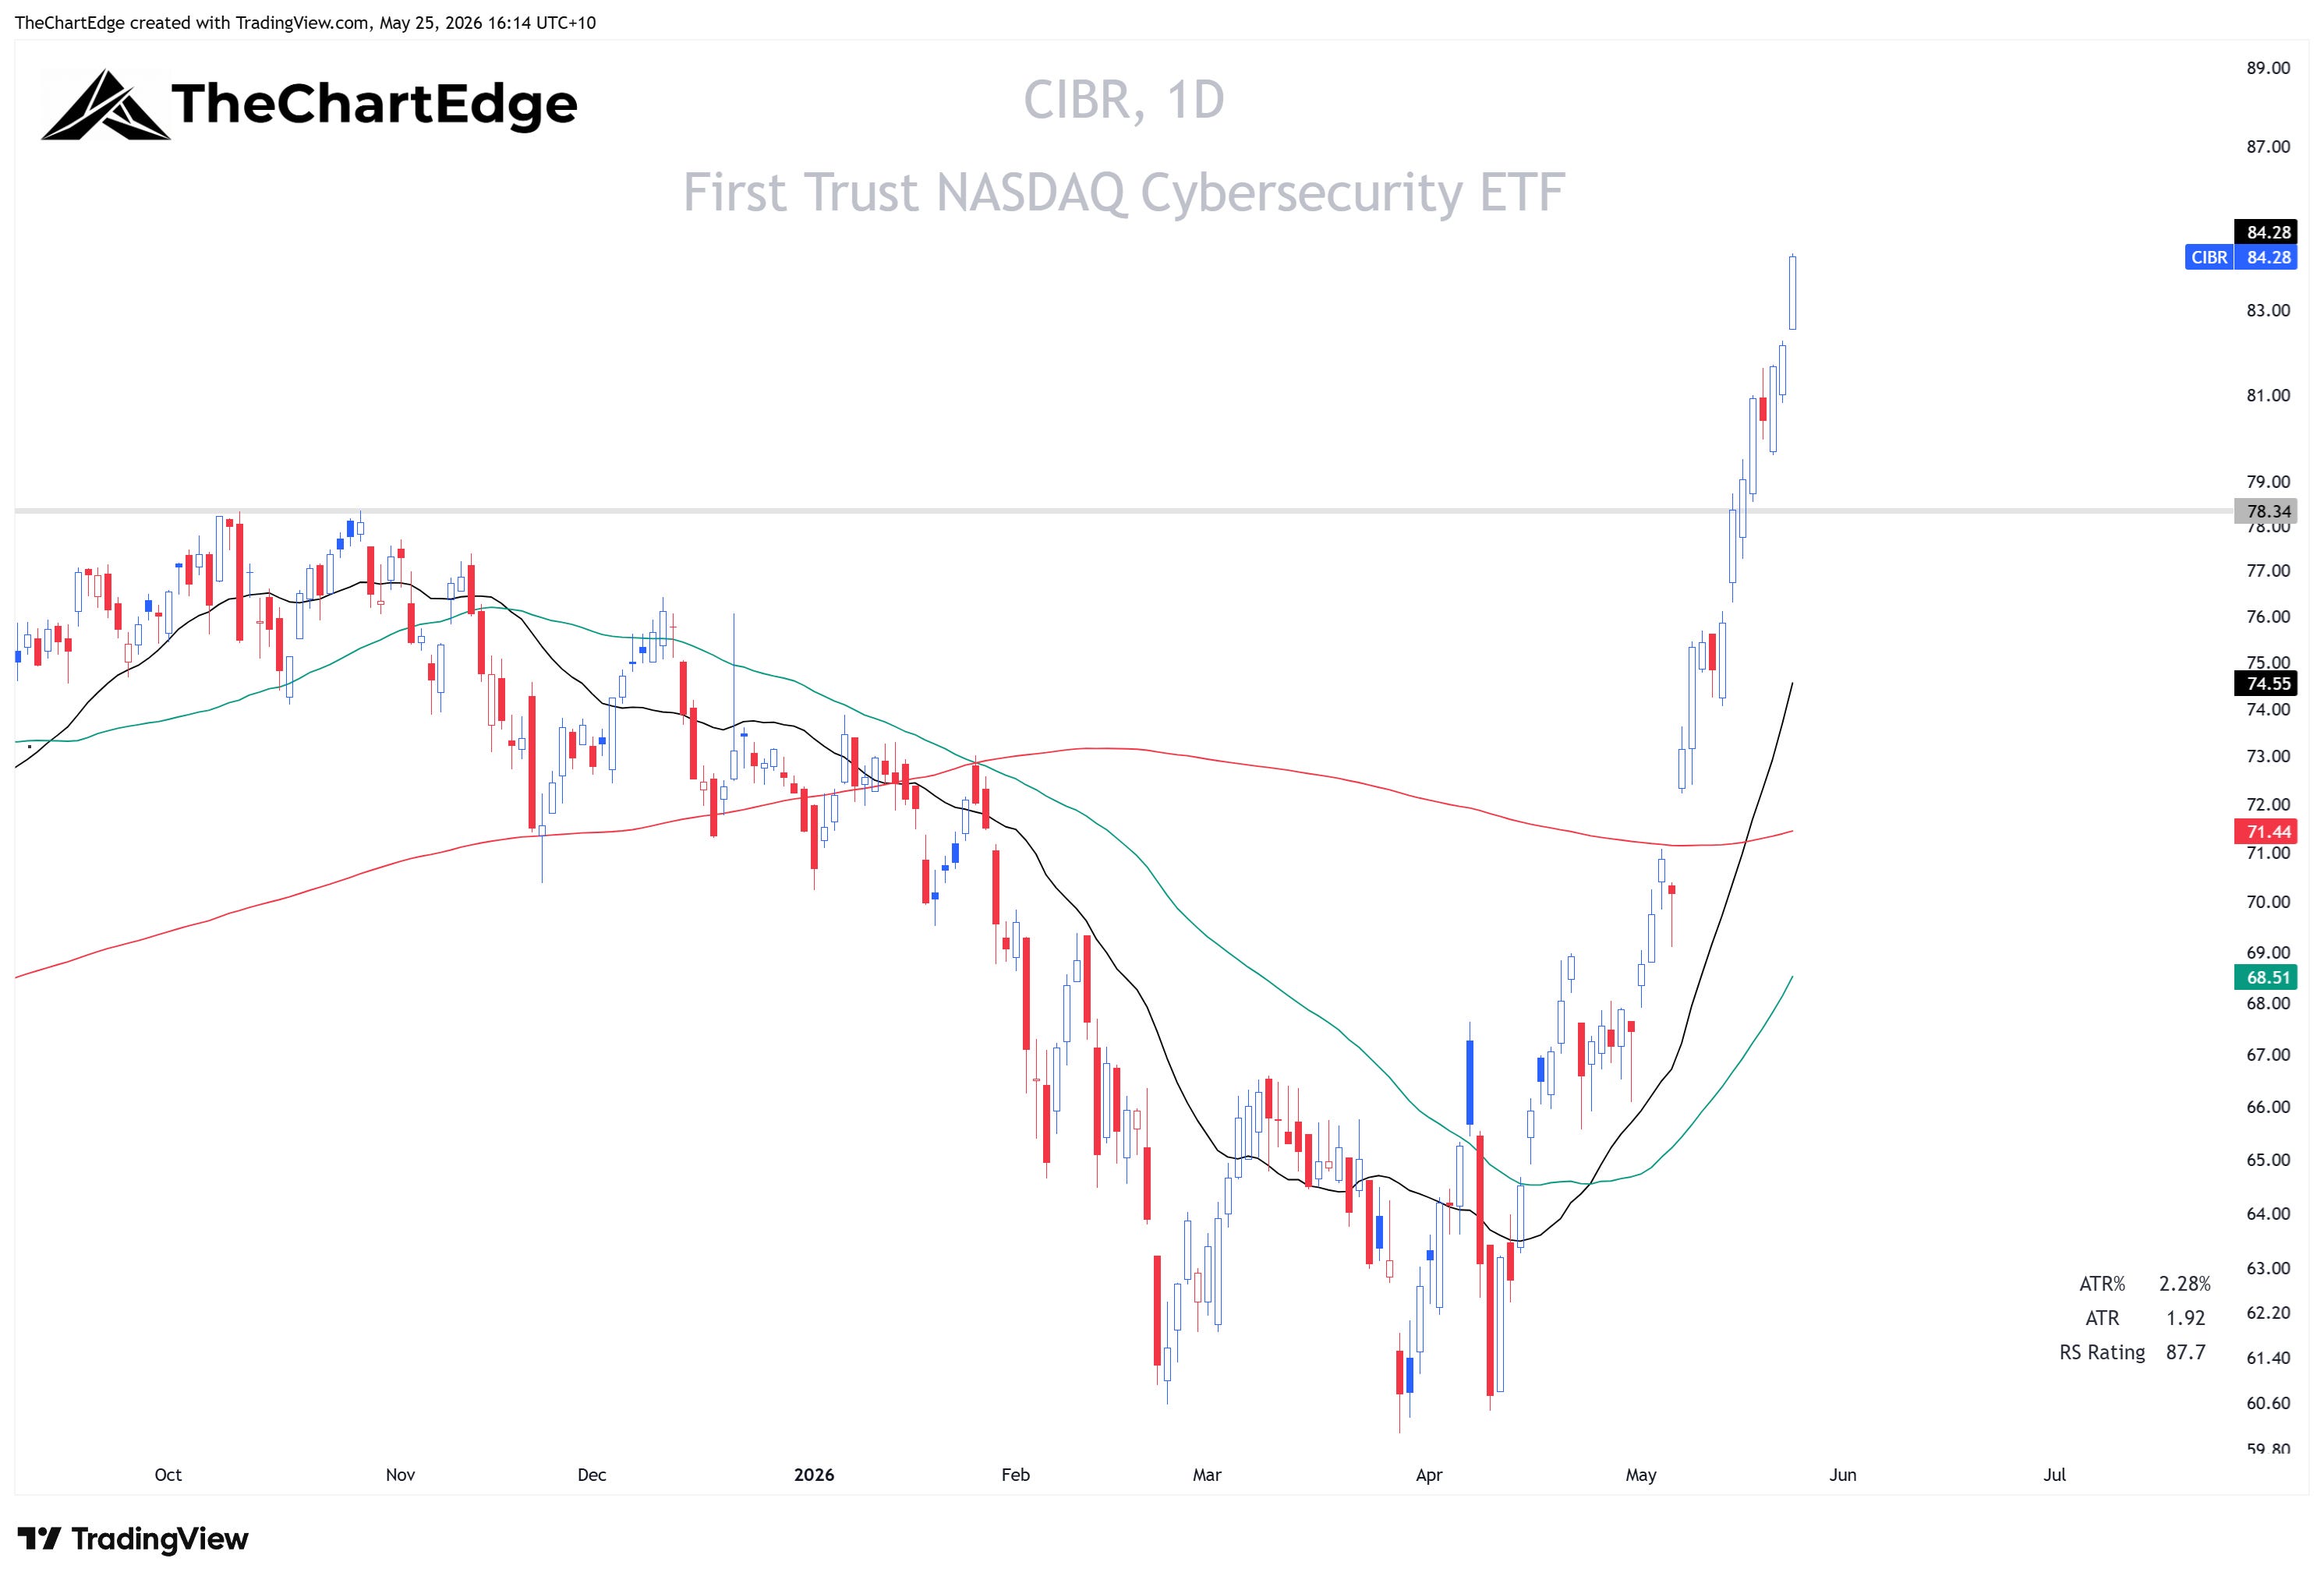
CIBR (Cybersecurity) continued its run, gaining 6.62% and closing at a weekly all-time high. 17 names are Leading or Improving. The Improving quadrant has 10 names, almost all with double-digit weekly gains (TENB +18.43%, ZS +13.24%, QLYS +13.72%, OKTA +11.44%, S +10.97%).
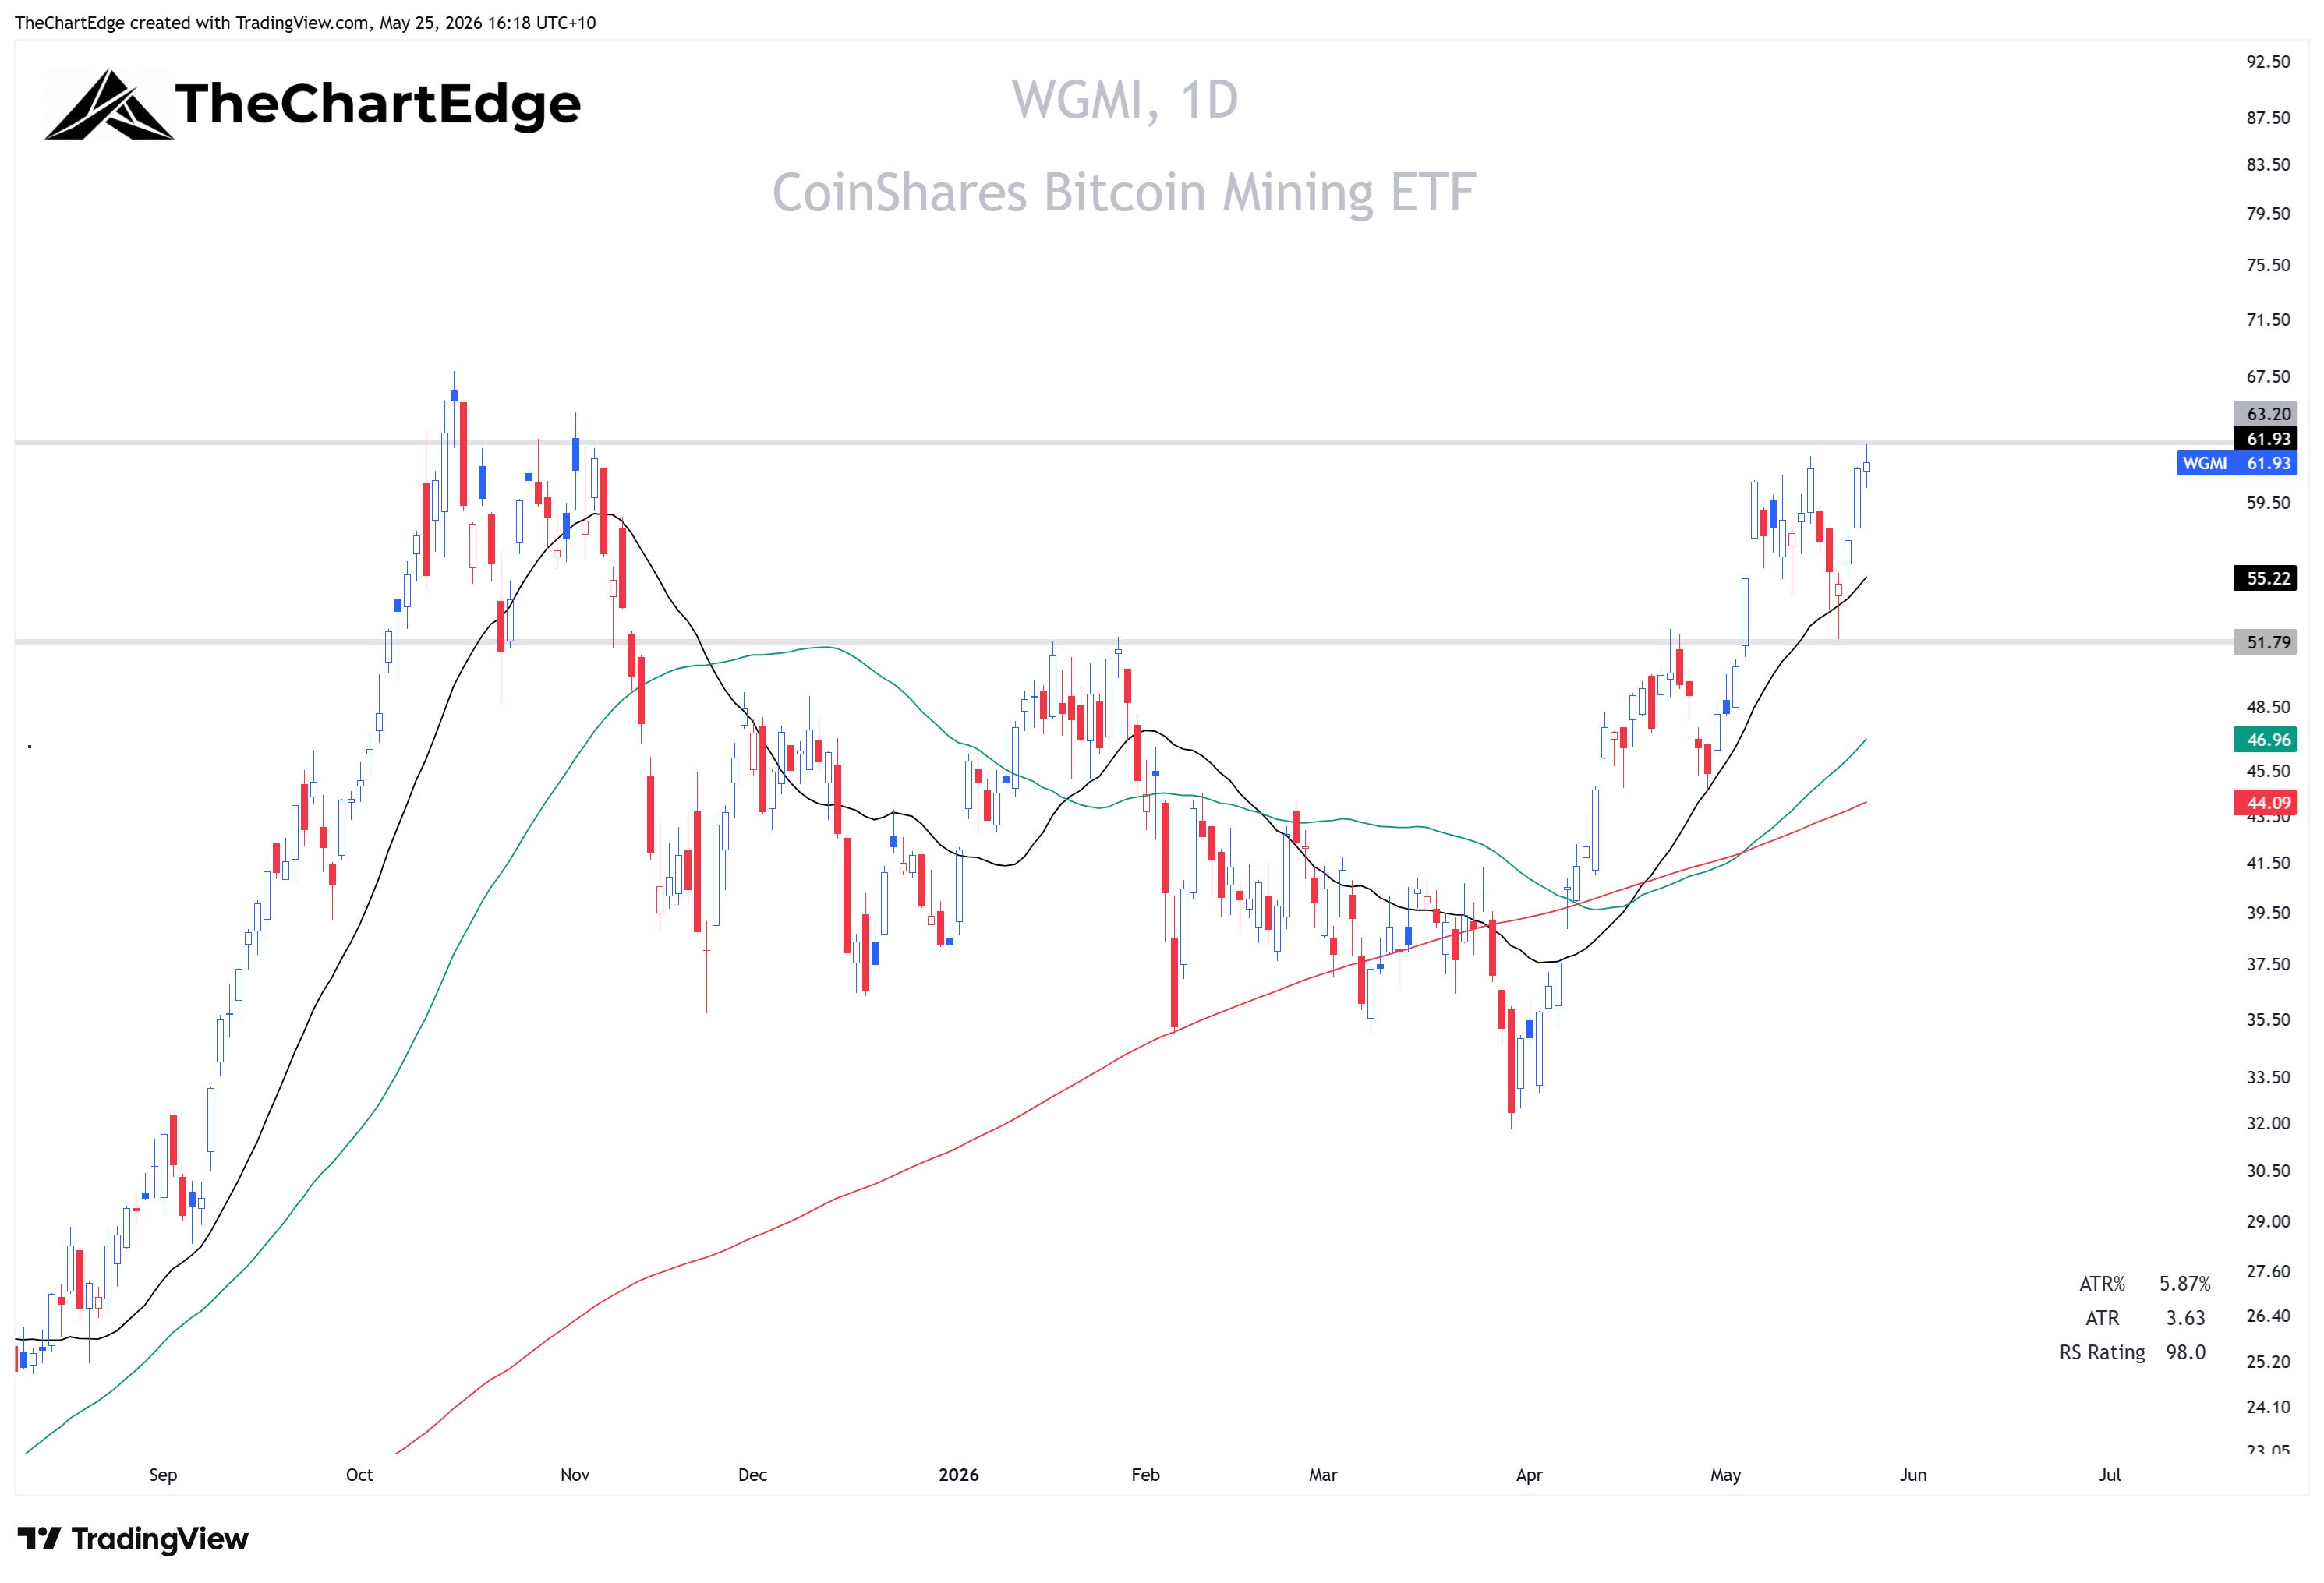
WGMI (Crypto Miners) was up 8.25% with RS-Momentum accelerating to 108.46. This is increasingly an AI compute story as miners pivot infrastructure toward providing compute for AI - WGMI decoupled entirely from IBIT (Bitcoin, -4.15%) and ETHA (Ethereum, -7.10%) last week.
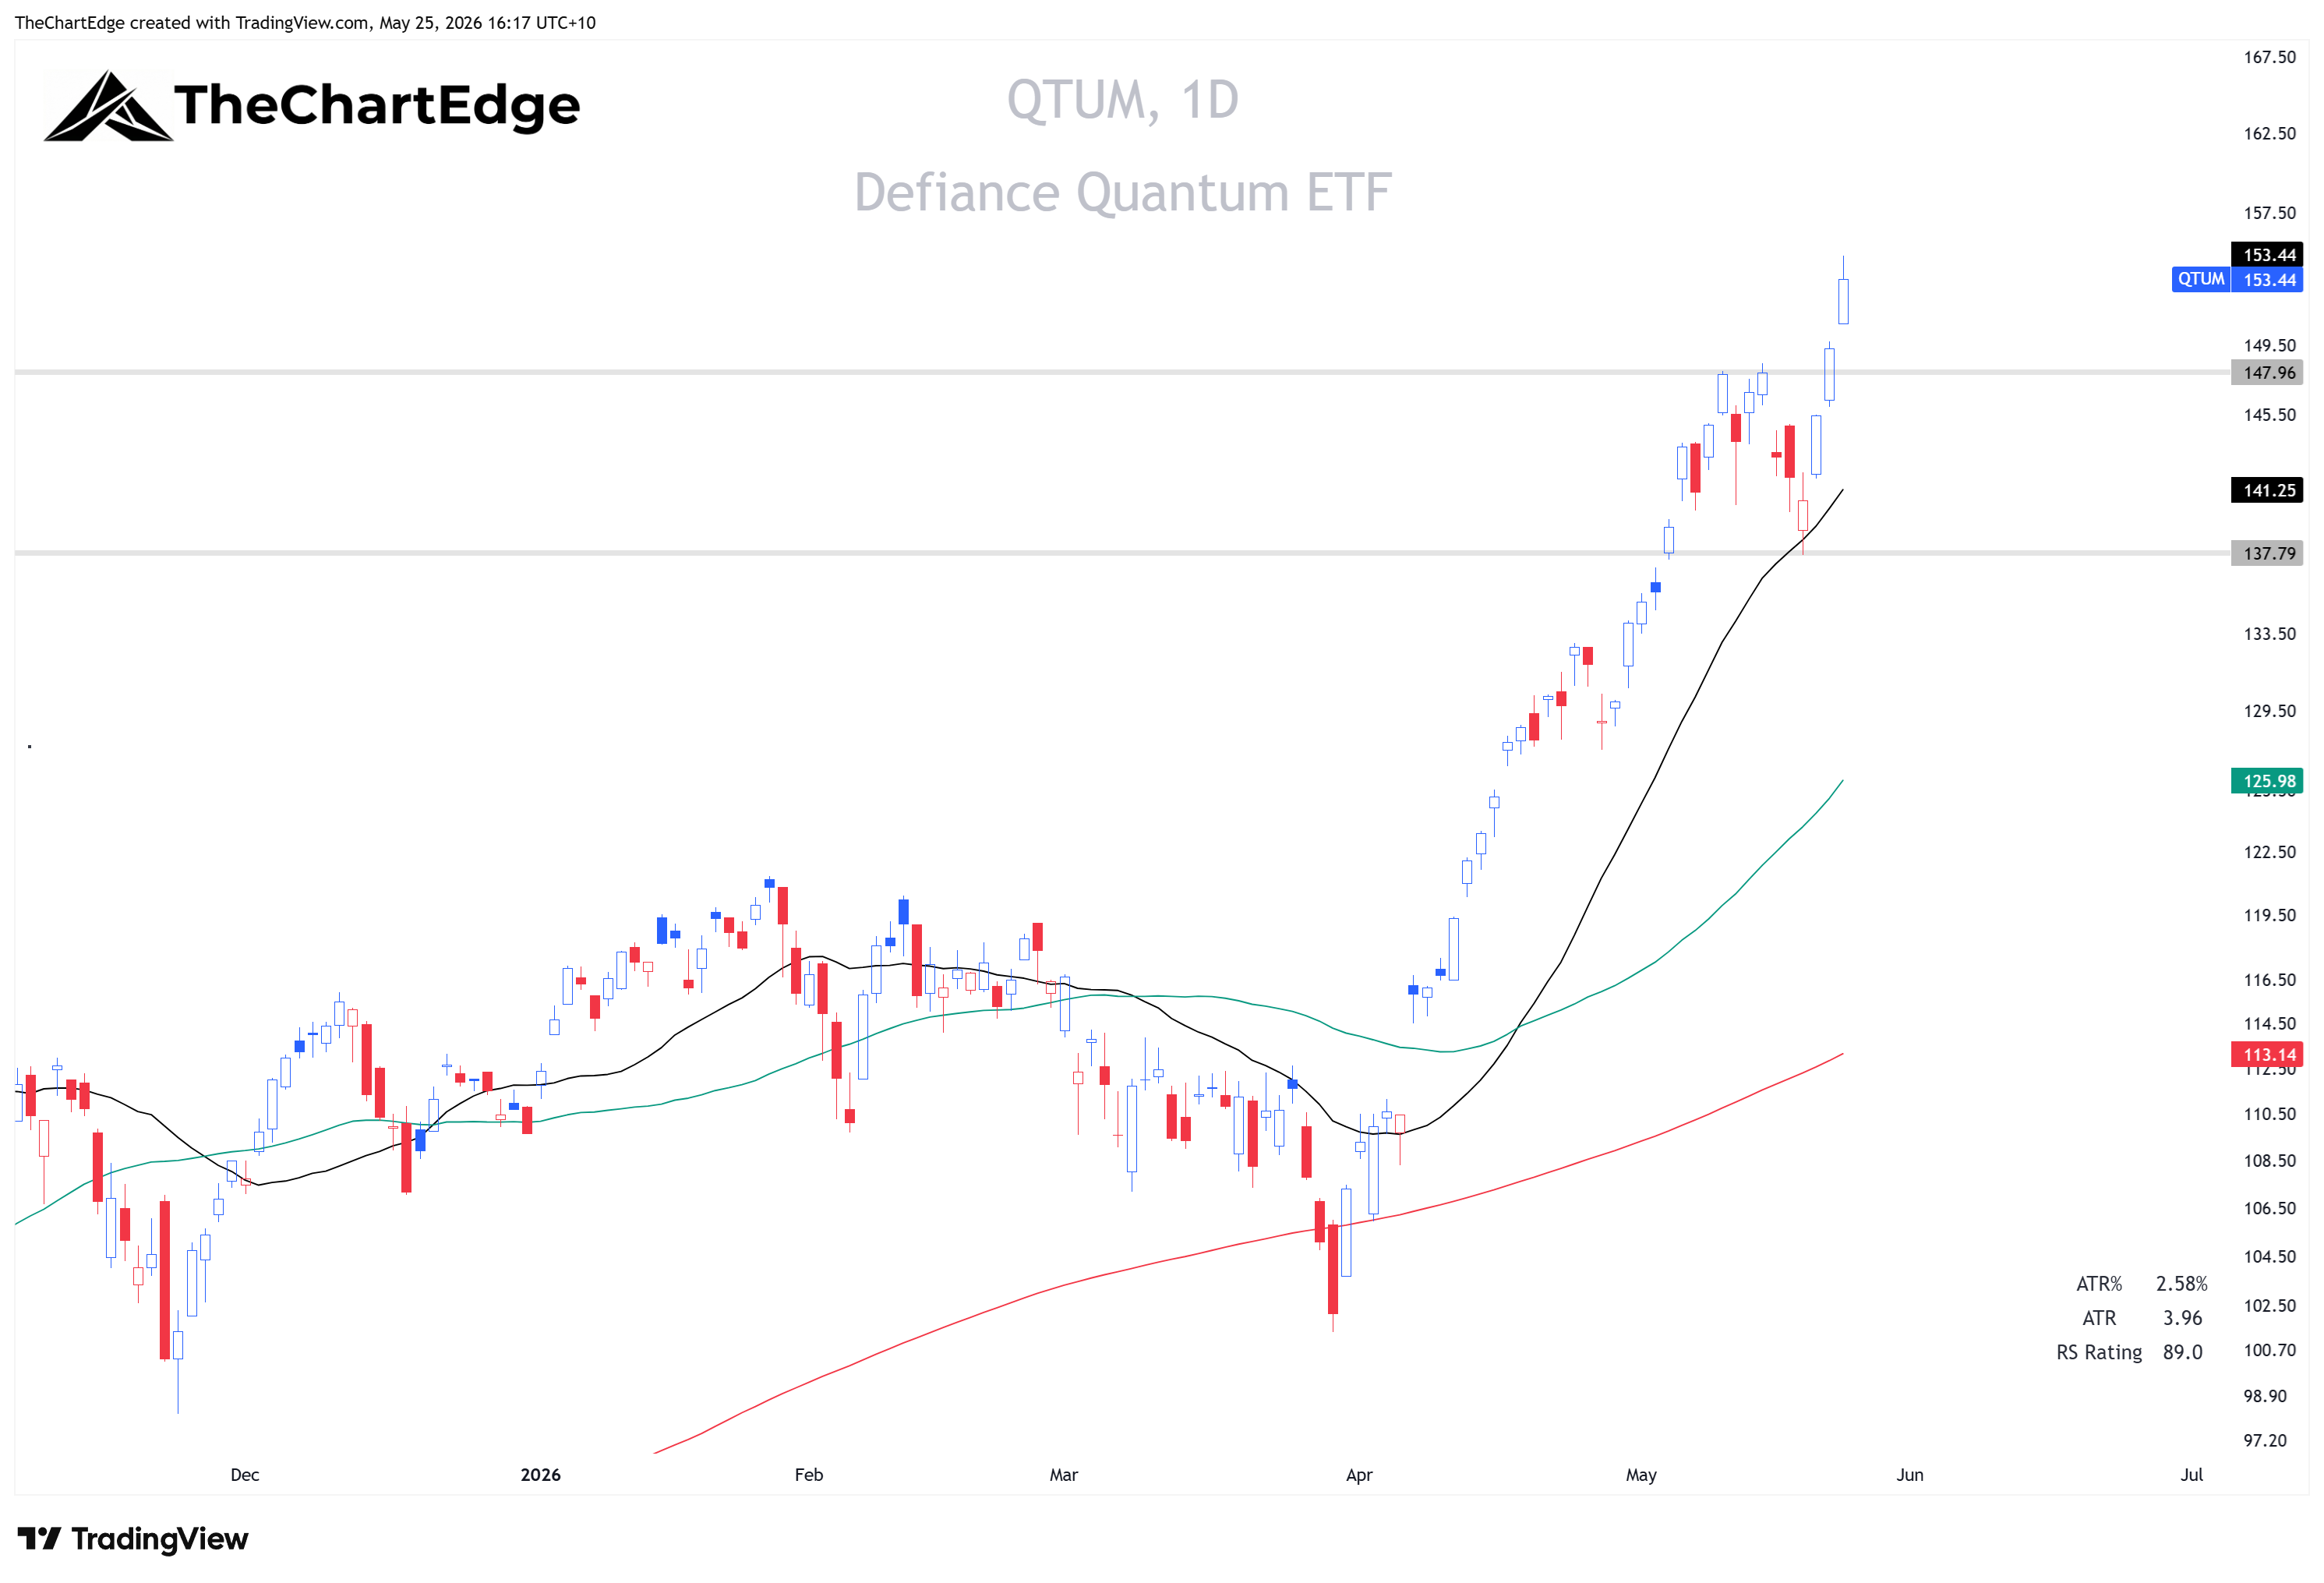
QTUM (Quantum & AI) rose 7.24%, entering the Leading quadrant. The quantum pure-plays had a massive week - RGTI +48%, QBTS +44%, IONQ +22% are all Leading, while ARQQ +31%, BTQ +29%, and QUBT +17% are all Improving. That said, QTUM is still heavily semiconductor-weighted, and the broader semi rally is doing a lot of the heavy lifting underneath.
Energy - Fossil Fuel Momentum Pauses, Clean Energy Holds
Six energy and oil names dropped from Leading to Weakening in a single week: USO (Crude Oil), XLE (Energy), RSPG (Energy EW), XOP (Oil & Gas E&P), OIH (Oil Services), and DBC (Broad Commodities) - reversing the move from the prior week.
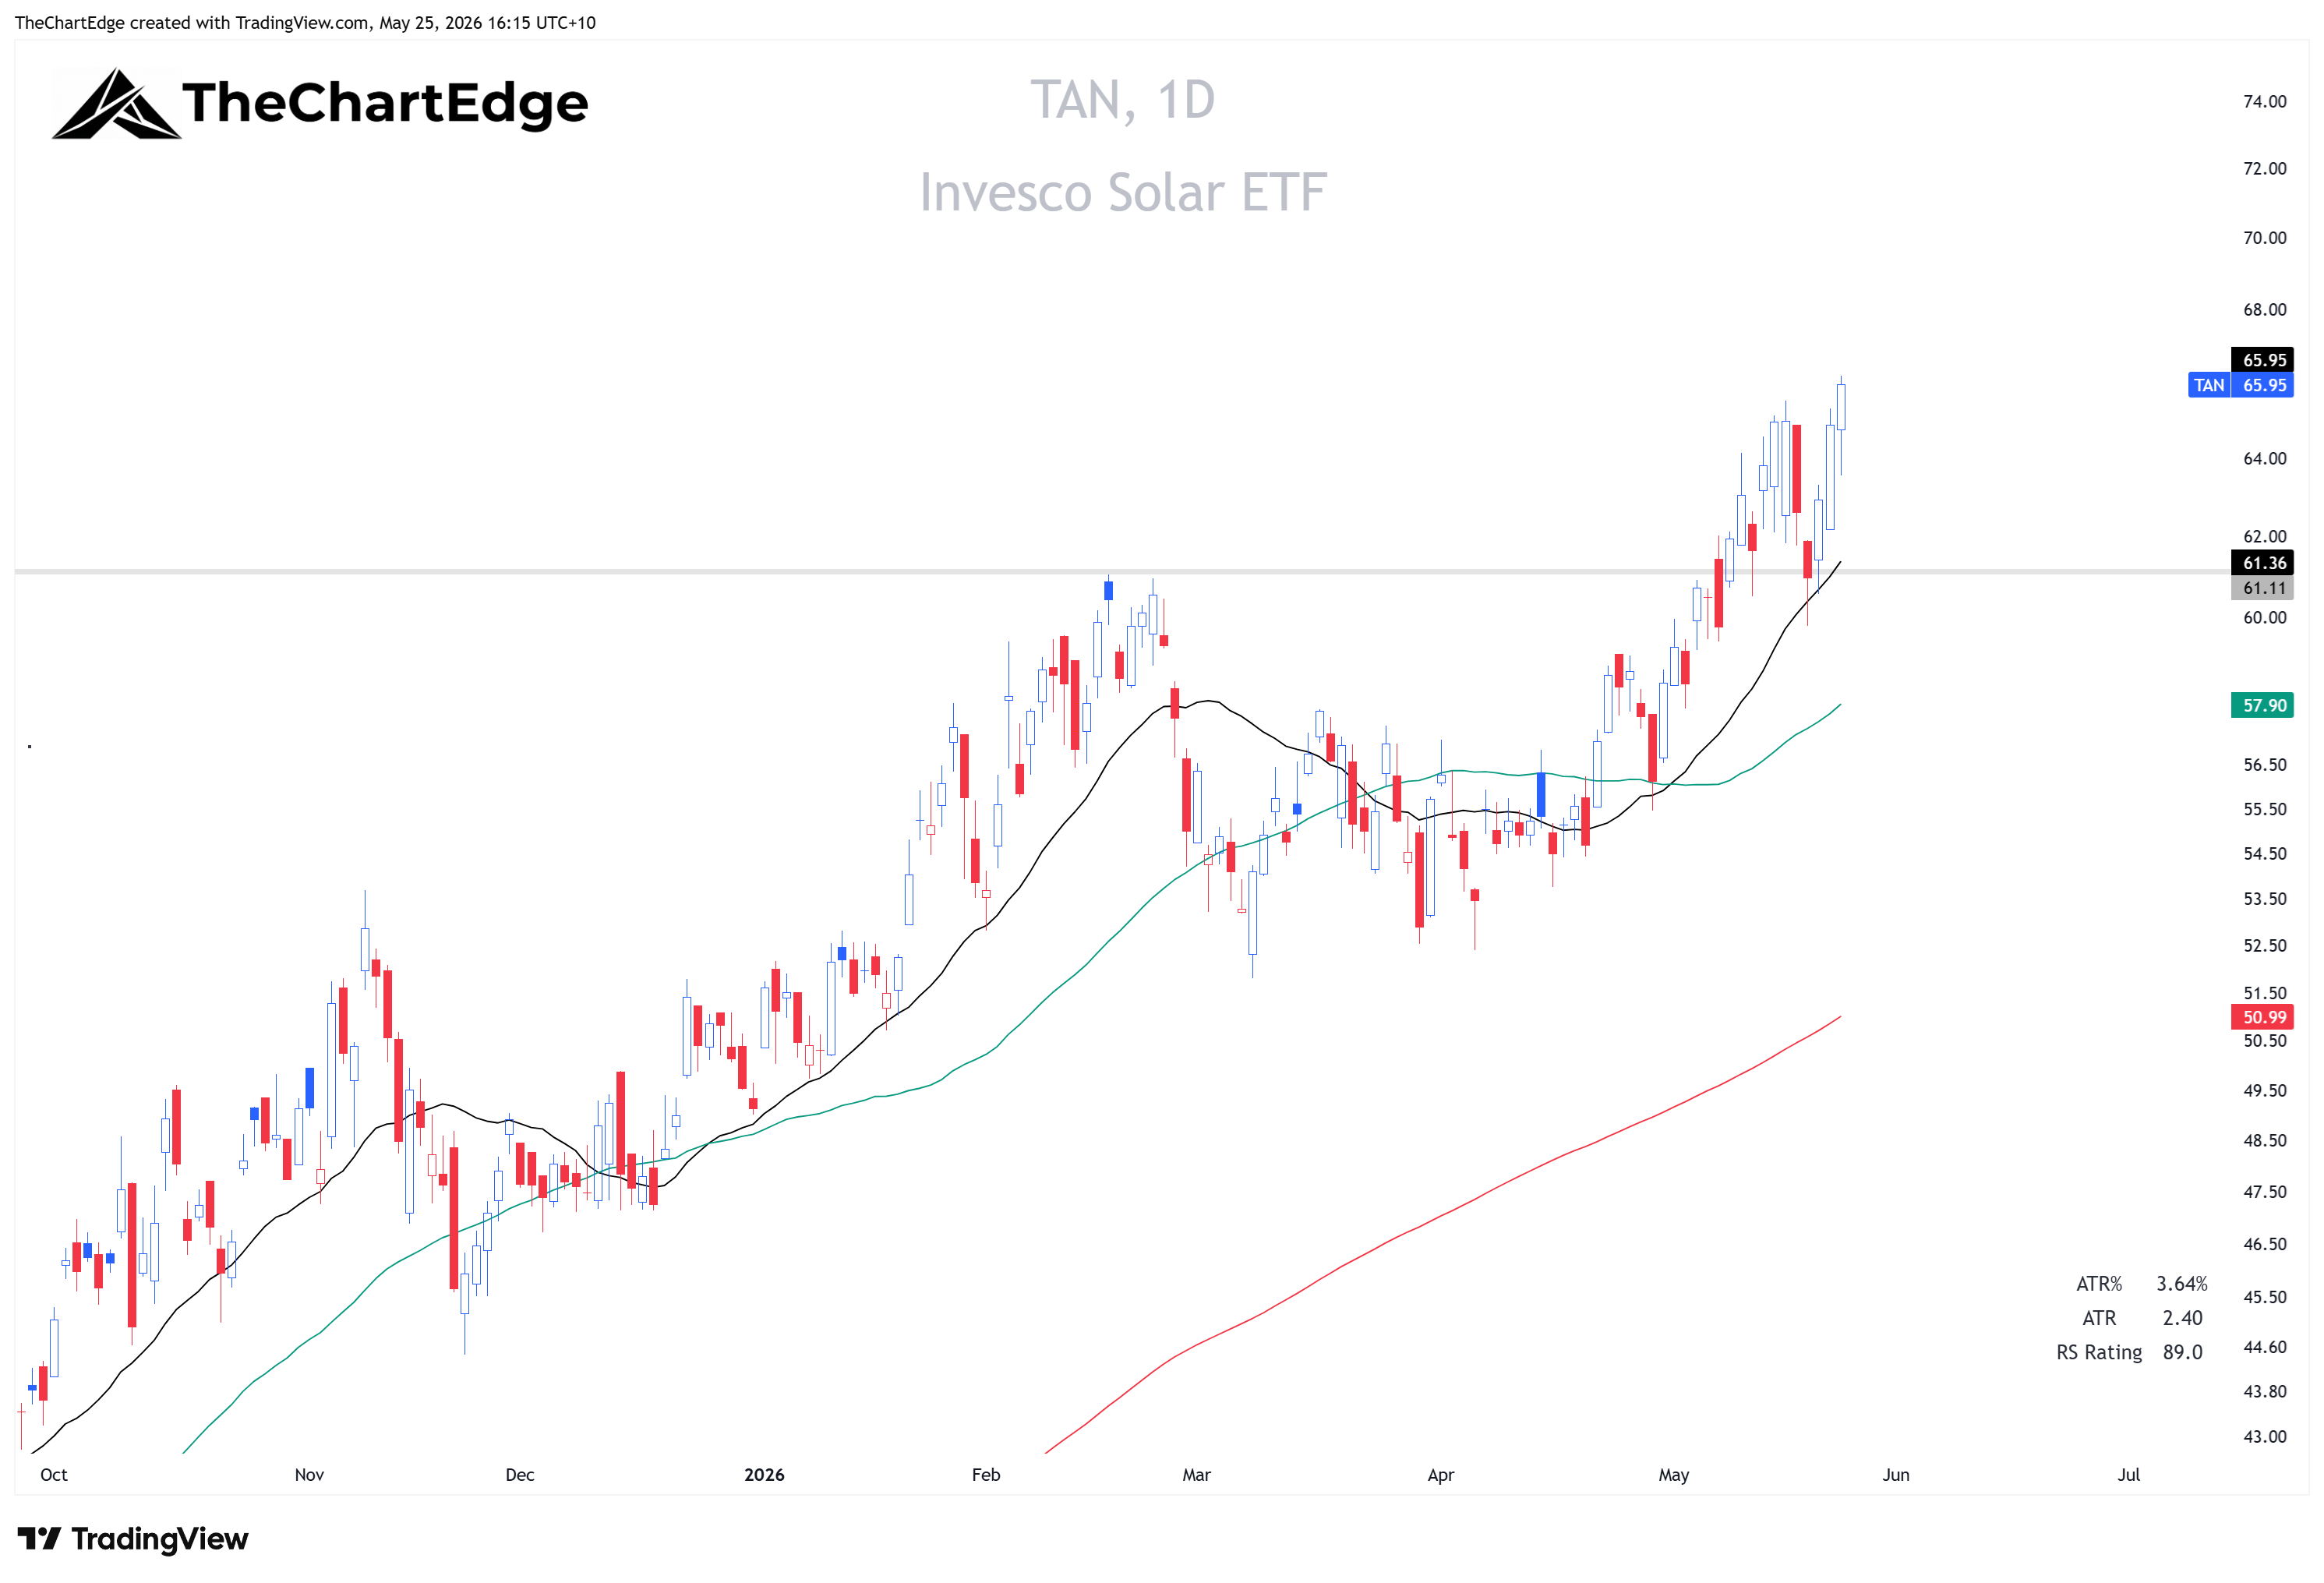
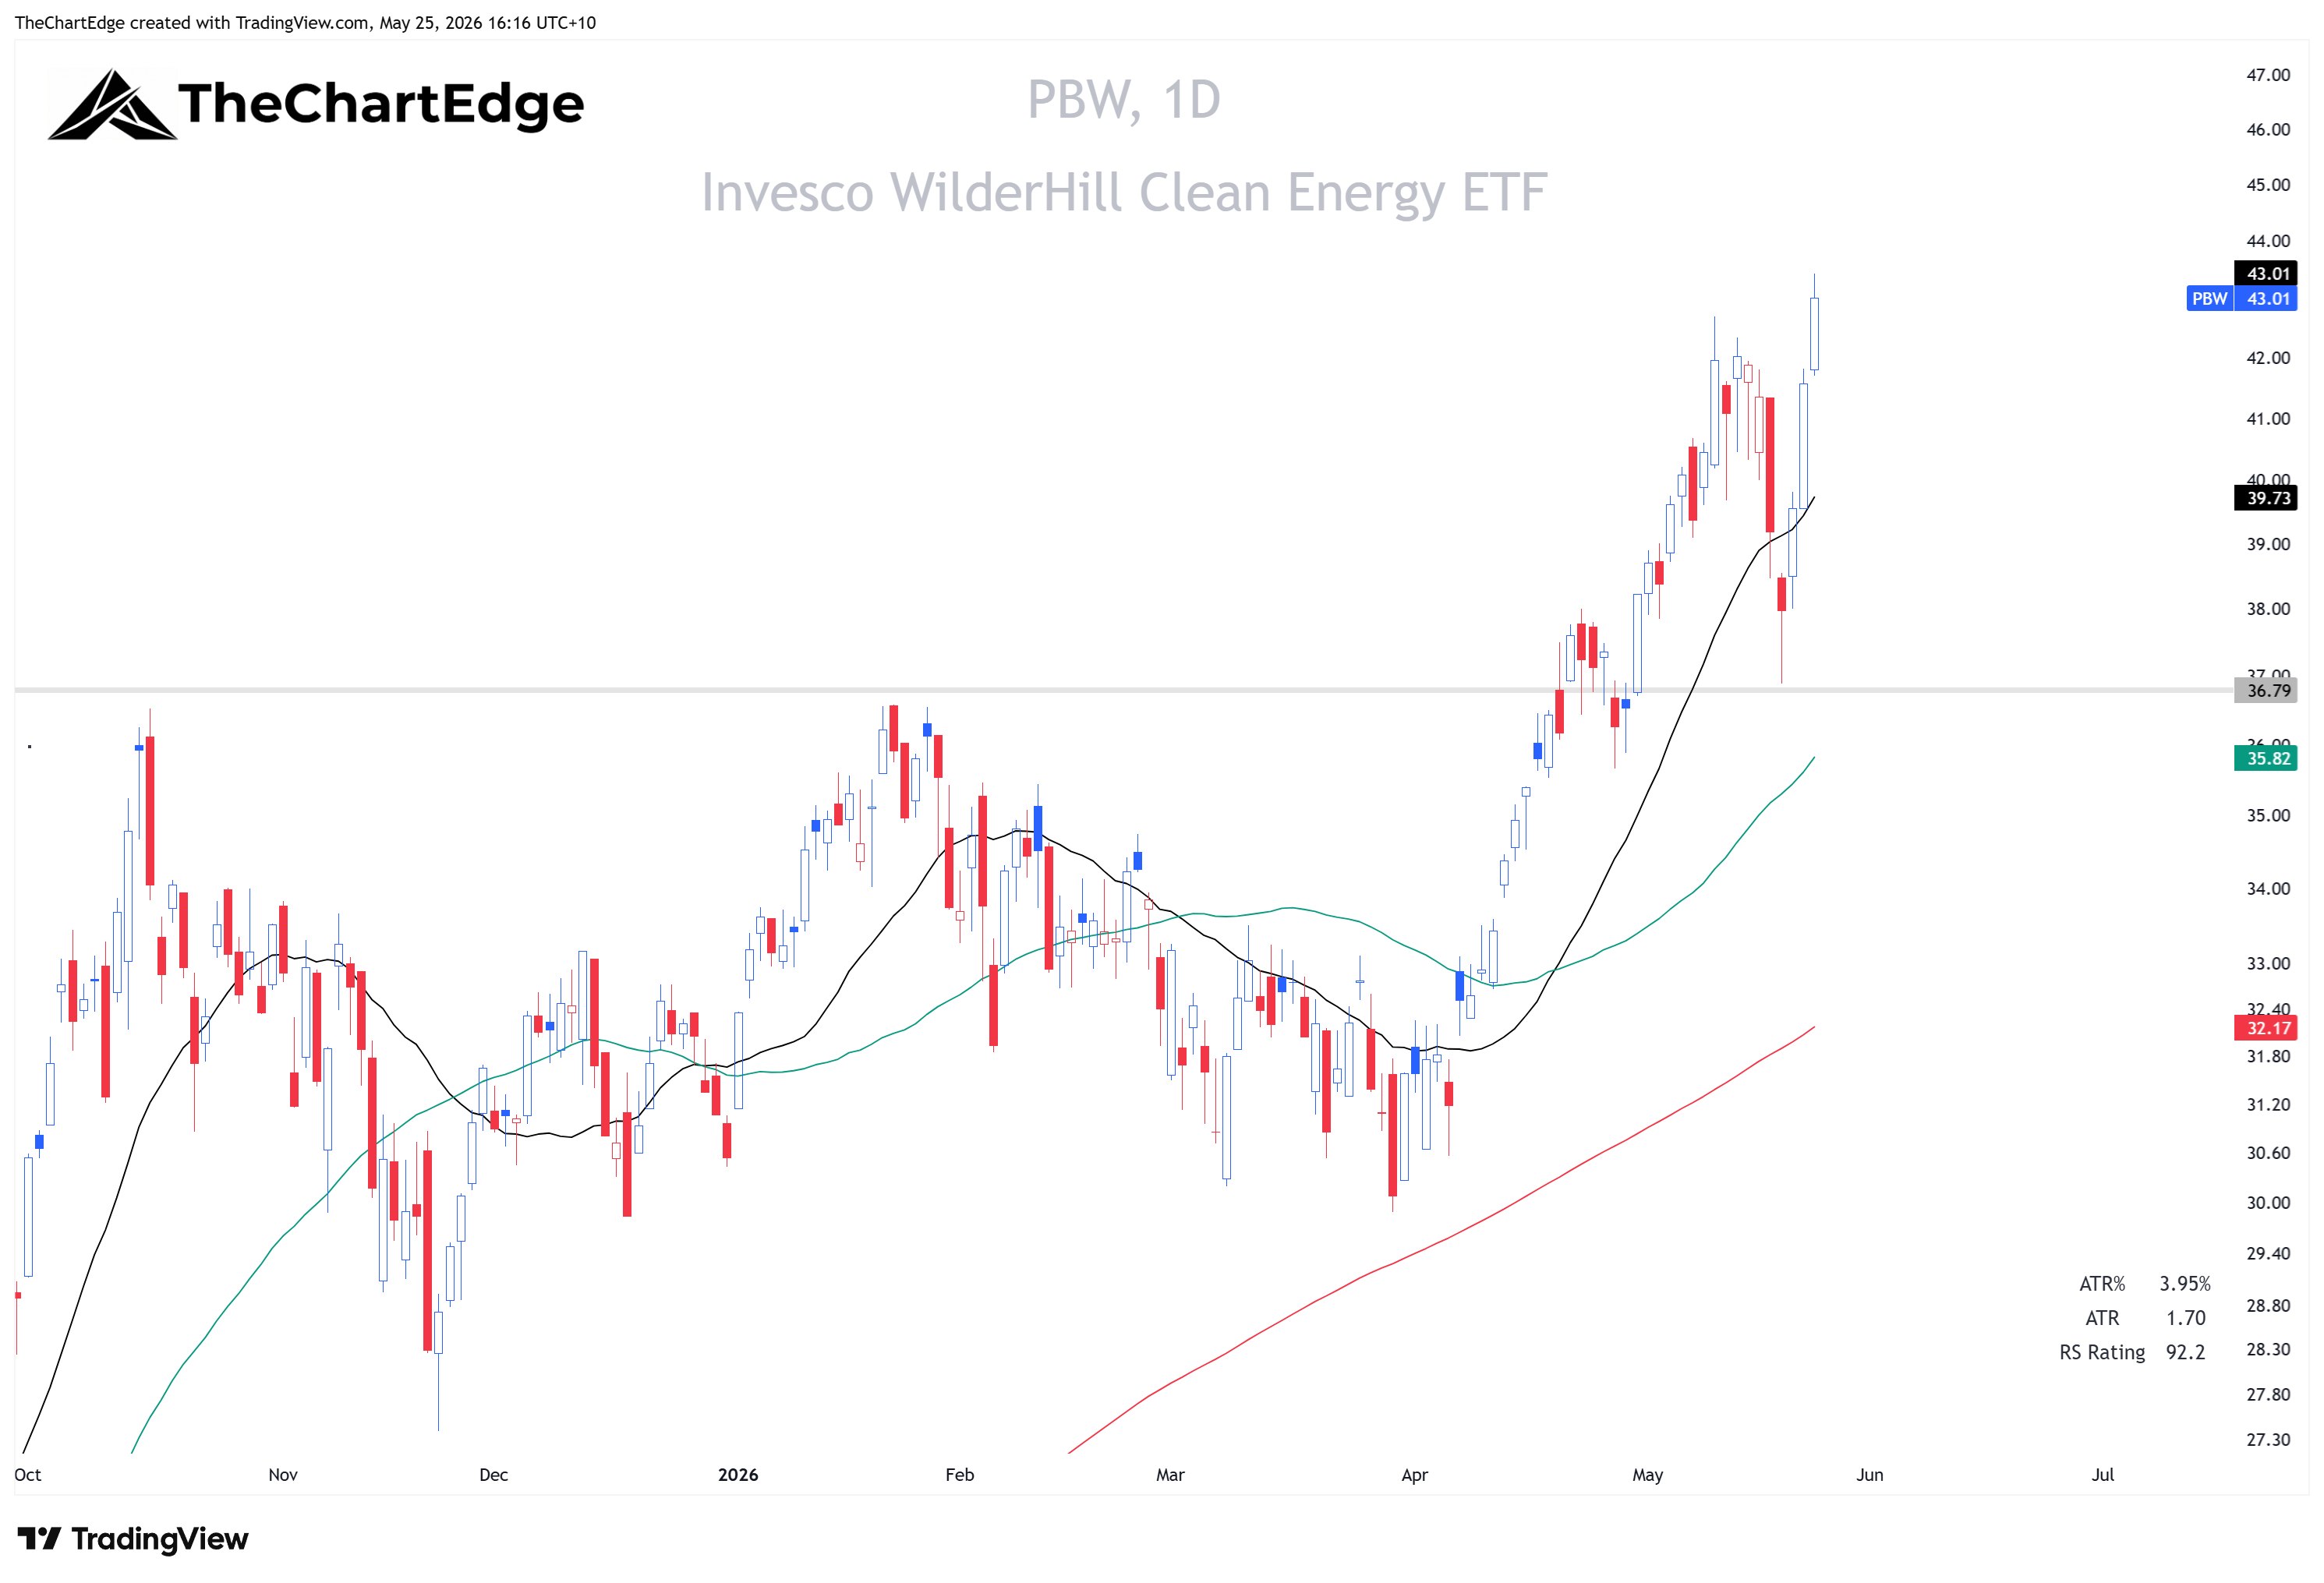
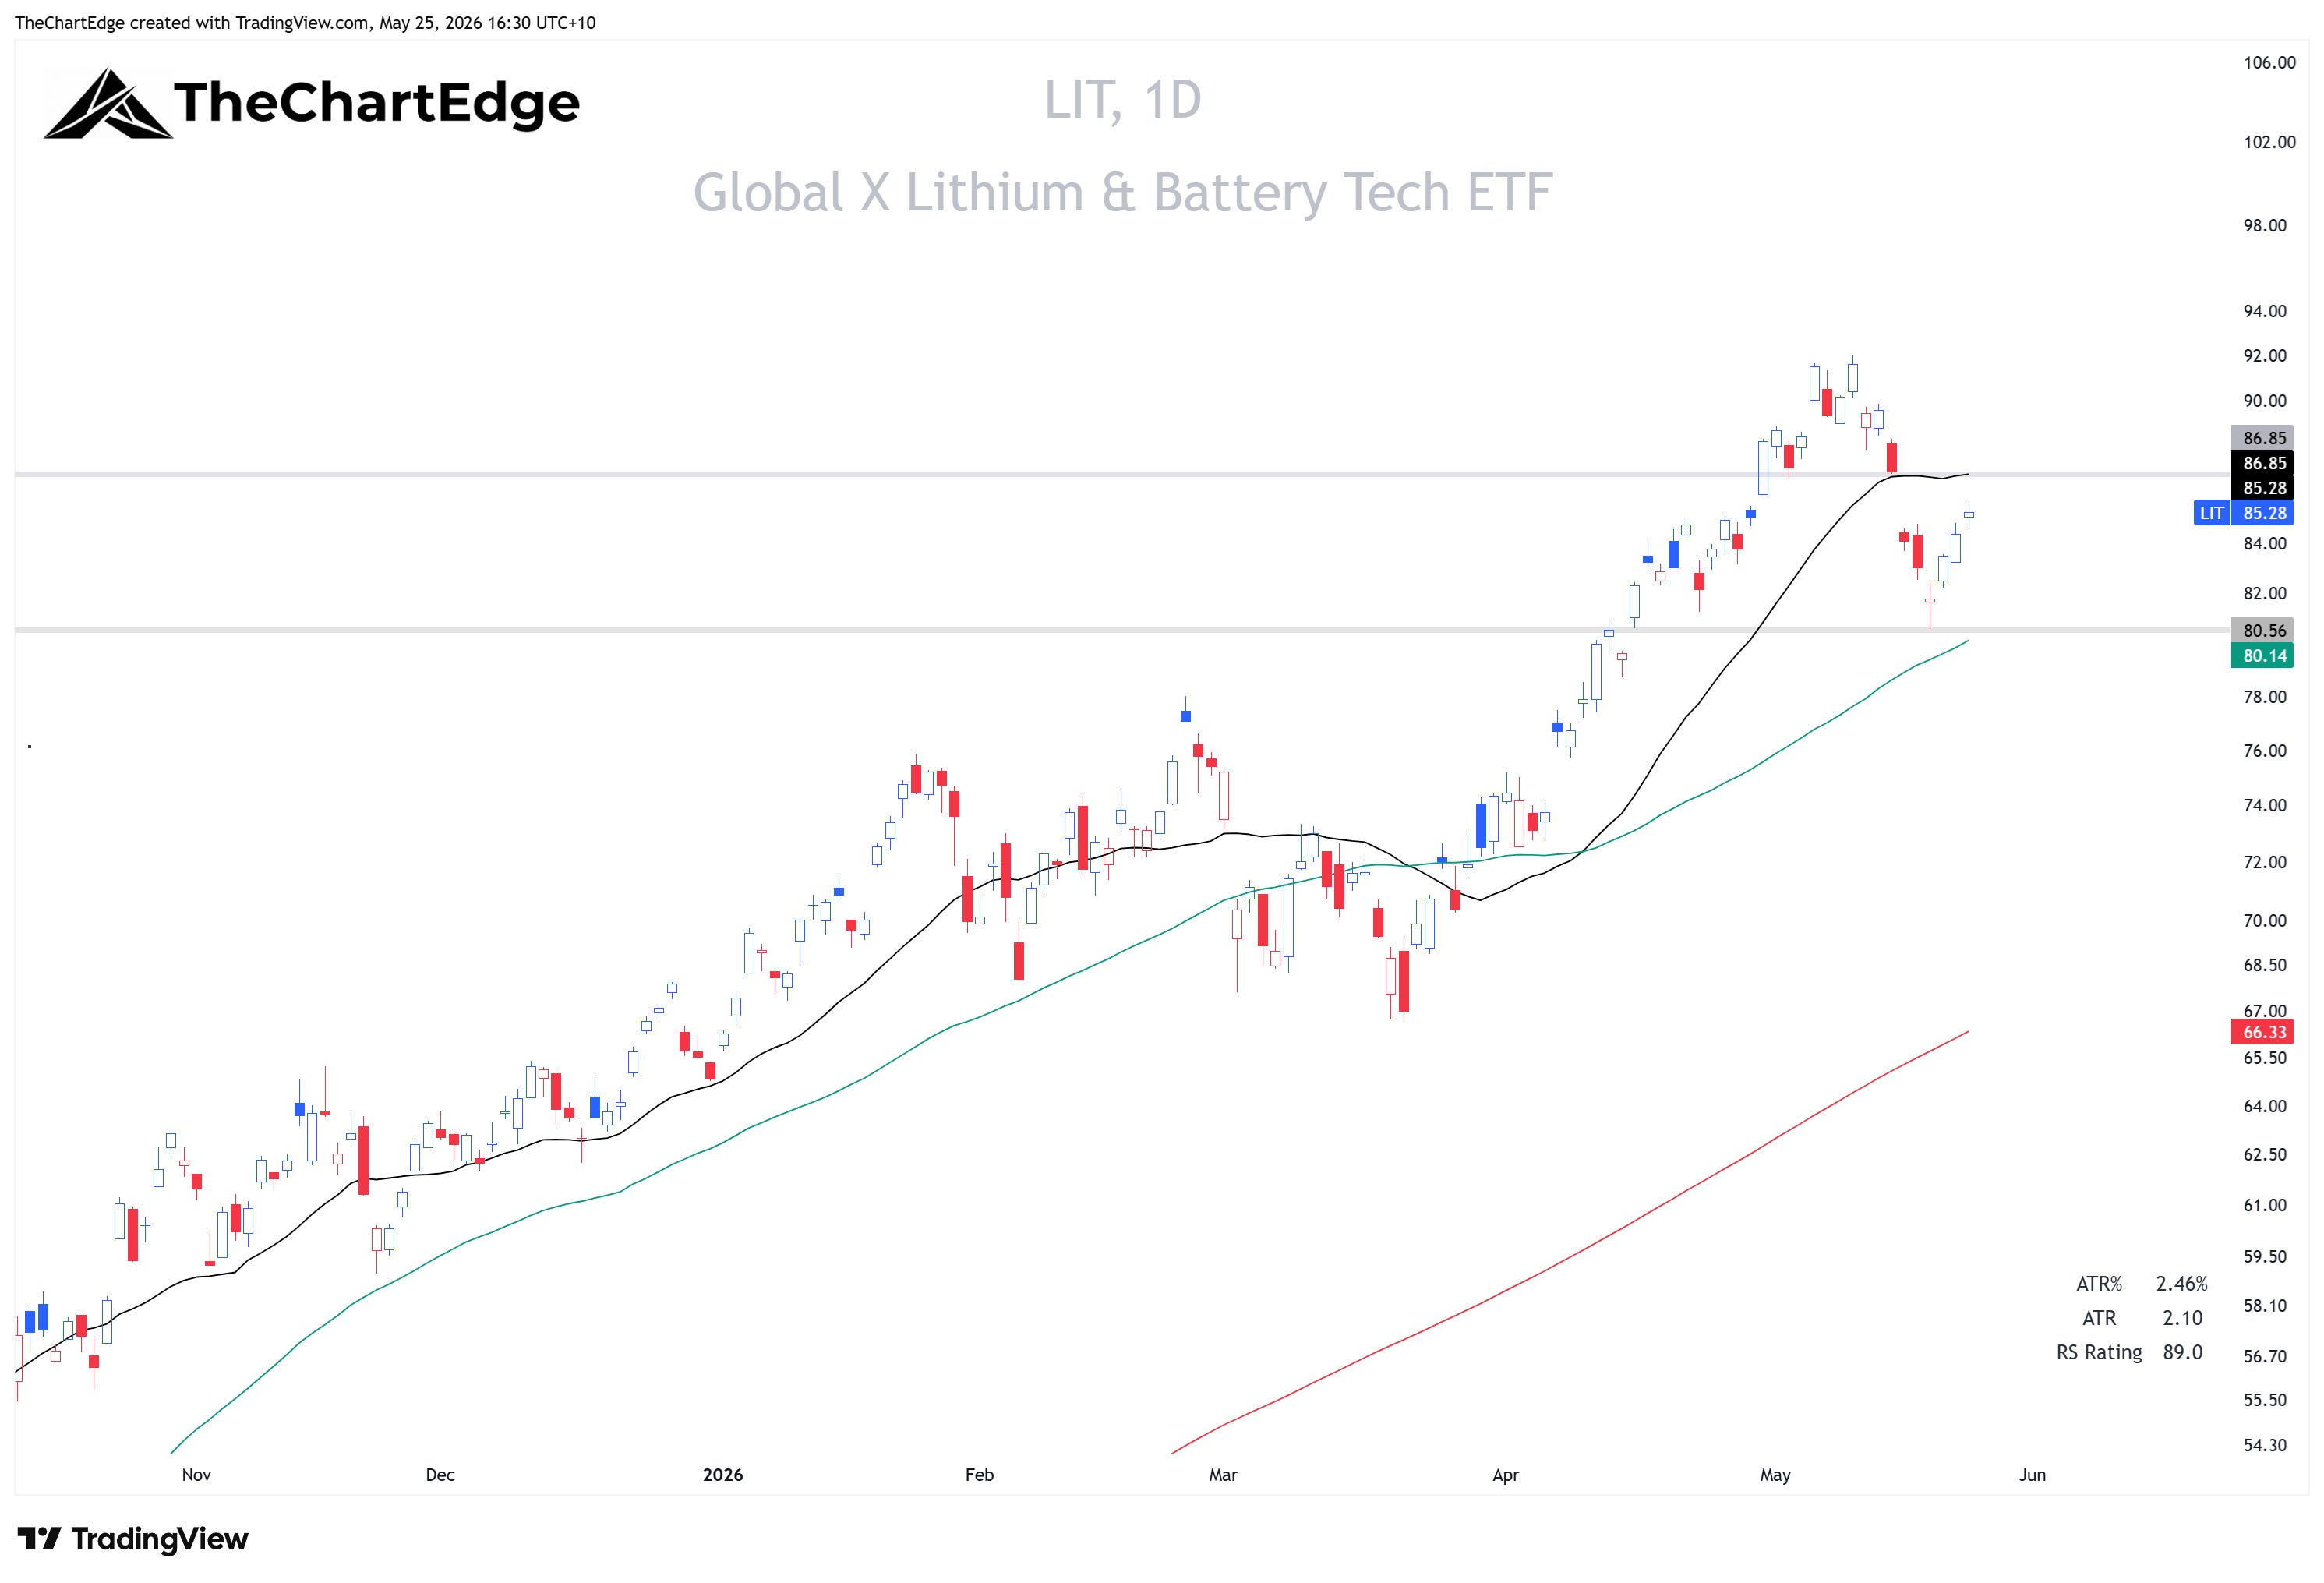
Clean energy is telling a different story. TAN (Solar) and PBW (Clean Energy) both remain in Leading, and LIT (Lithium & Battery) which has an RS-Trend of 117.72 despite Weakening momentum, is bouncing after a roughly 12% pullback between May 12-19.
Tan Chart
PBW Chart
LIT Chart
Thoughts for the upcoming week
Two weeks ago, six energy ETFs were surging into the Leading quadrant while everything else sold off - only 21 of 121 names were positive and breadth deteriorated sharply. Last week that picture reversed completely. The bounce wasn’t just tech snapping back - RSP, IWM, and MDY all outperformed SPY, breadth recovered, and 23 ETF names are at or very near all-time highs, across tech, value, and small caps. That’s a much healthier looking tape in the space of one week. If oil stabilizes around current levels or continues lower, TLT can hold last week’s low, or even better continue higher (rates lower), and the US dollar weakens or goes sideways, the conditions are there for a resumption of the rally off the March 30th low. Some of the fast movers are already up a lot since Tuesday’s (May 19) low, so I would avoid any new buys if too extended (I am looking for stocks and/or ETFs ideally within 2-3 x ATR% of May 19 low). I will be looking to add exposure this week, generally using the May 19 low as my stop loss.
Stay open-minded and manage risk carefully.
Cheers,
Marcus Grant, CFTe
Disclaimer: The content provided in this newsletter is for informational and educational purposes only and should not be considered as financial, investment, or legal advice. The information shared is based on our research and analysis, but we are not a licensed financial advisor, nor can we guarantee its accuracy, completeness, or timeliness. Market conditions and financial instruments can change rapidly, and any opinions expressed may not be suitable for all investors. Any opinions expressed and or securities mentioned do not constitute a recommendation to buy, sell, or hold that or any other security. You should conduct your own due diligence and consult with a licensed financial advisor or other professional before making any investment decisions. Past performance is not indicative of future results, and all investments carry the risk of loss. The authors and publishers of this newsletter are not responsible for any financial decisions made based on the content provided herein. By reading and or subscribing to this newsletter, you acknowledge and agree that you are using the information at your own risk.