

Traders: Less Is More, Investors: Zoom Out
Navigating Recent Volatility & Sideway Price Action

After a nice run up following the US Election, the SPY has been chopping around in a sideway range of about 5%, making it difficult for swing traders. Lots of gaps and higher volatility make it more treacherous for all but skillful day traders. In this type of environment I tend to dial back my stock trading, both in terms of frequency and position size. I also use wider initial stop losses, to give trades a little more room, trying to avoid getting shaken out of positions (although some would say using tighter stops is the way to go - each to their own, you need to do what works for you). I also tend to be quicker taking profits. Sometimes taking half off, then raising my stop loss to breakeven. Or just have smaller targets. When markets are trending you want to stay in a position for as long as you can when they are going in your favor. However in choppy sideways markets if I can make 2x my initial risk I tend to take it, especially if momentum is waning on smaller timeframes (30 minute chart).
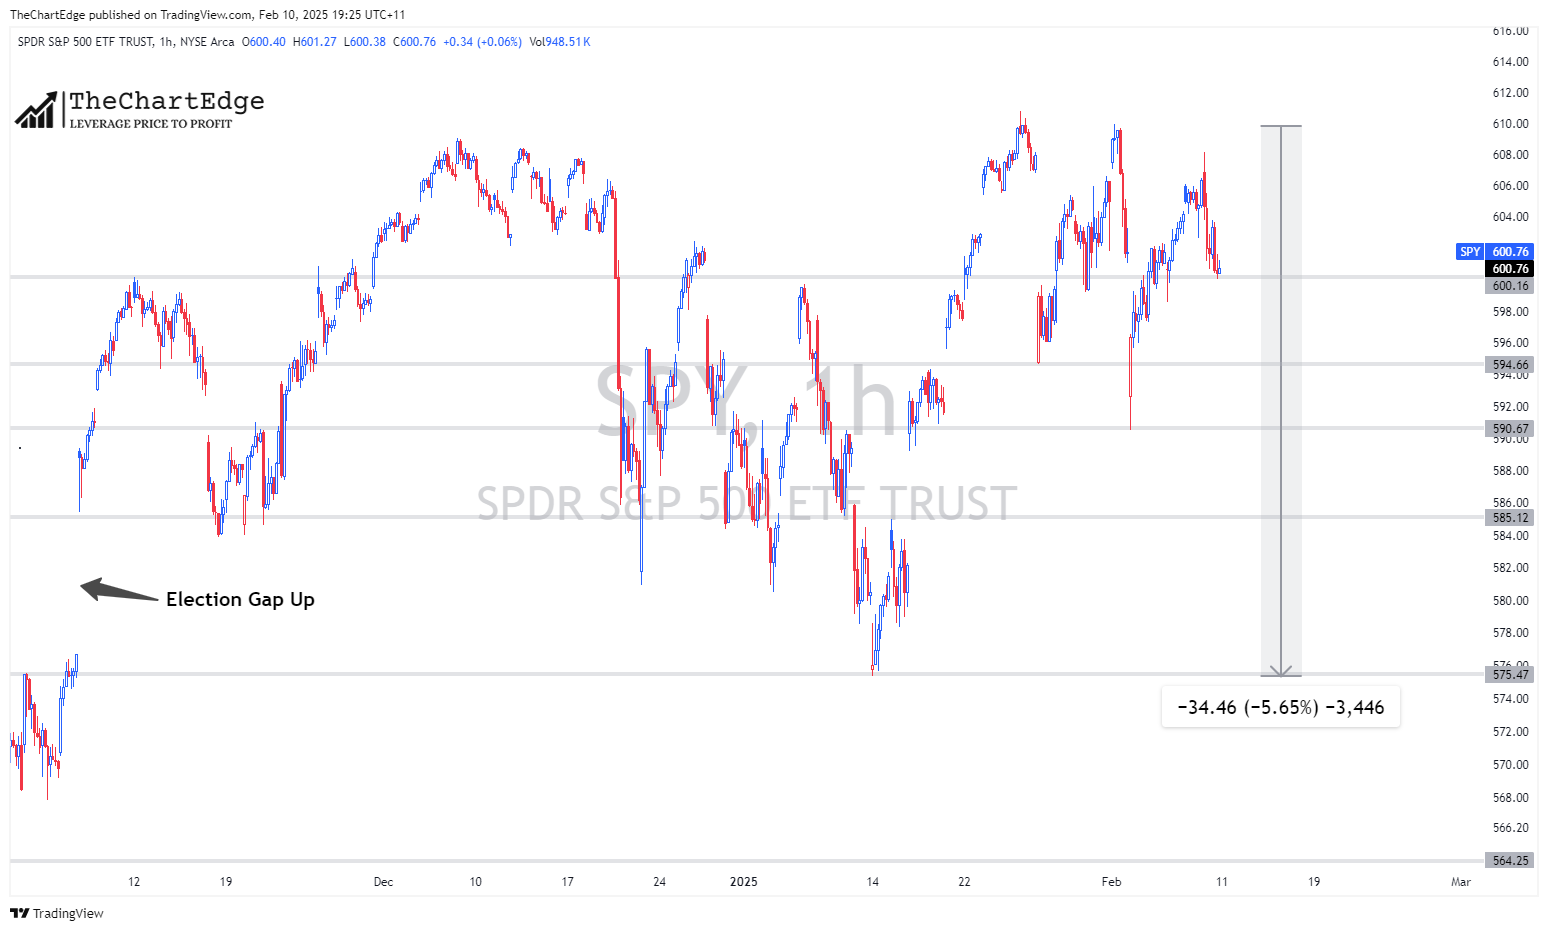
Looking at this 1 hour chart of the SPY you can clearly see the large sideways range it’s been trading in since the election gap up. If we can consolidate above 595 (or even better 600) this week, we could be setting up for a breakout to all time highs. However if we lose 595, a retest of 590 (Monday February 3rd’s gap down lows), and maybe even a setting a lower low towards 585 is possible. Beyond that a retest of the bottom of the range at 575 is not out of the question.
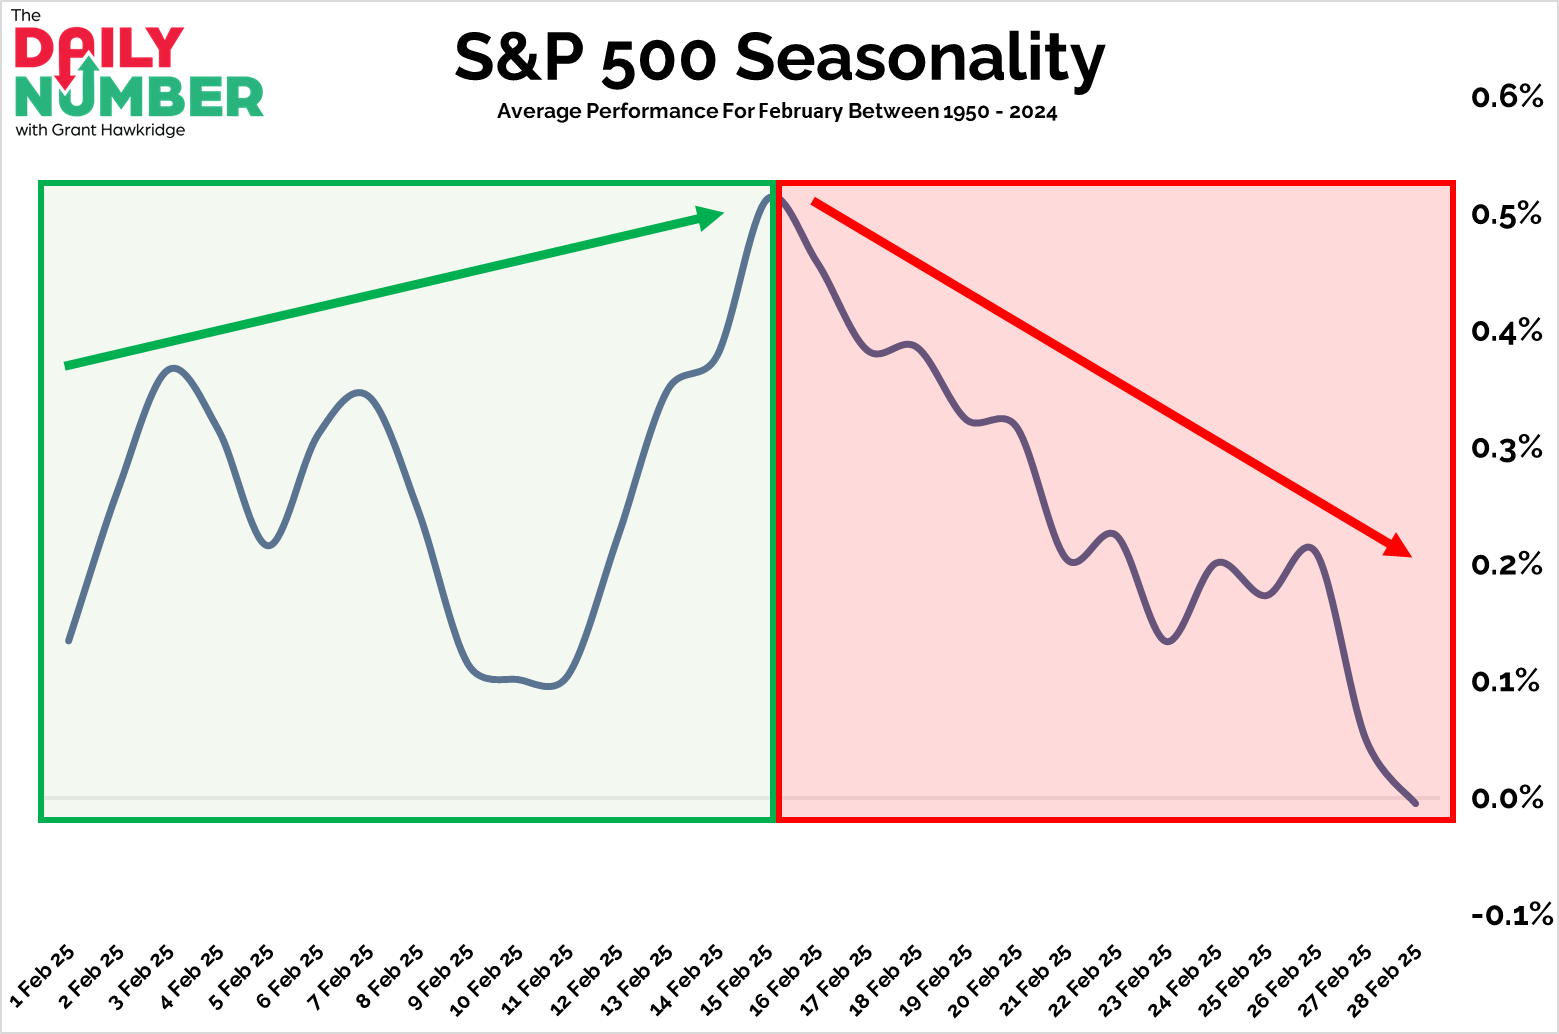
Seasonality suggests we could be in for some further choppy, downside action.
Source: Grant Hawkridge
Grant’s Takeaway: “February, on average, usually starts off positive, but the S&P 500 tends to decline shortly after Valentine's Day. On average, the month finishes relatively flat, with only 48% of days experiencing positive daily gains.
February is regarded as the second worst month of the year in terms of seasonality. Over the past decade, only 50% of February's have ended on a positive note. When we look at a longer time frame, the trend doesn't improve much; in the last two decades, just 60% of Februarys have finished with overall gains.”
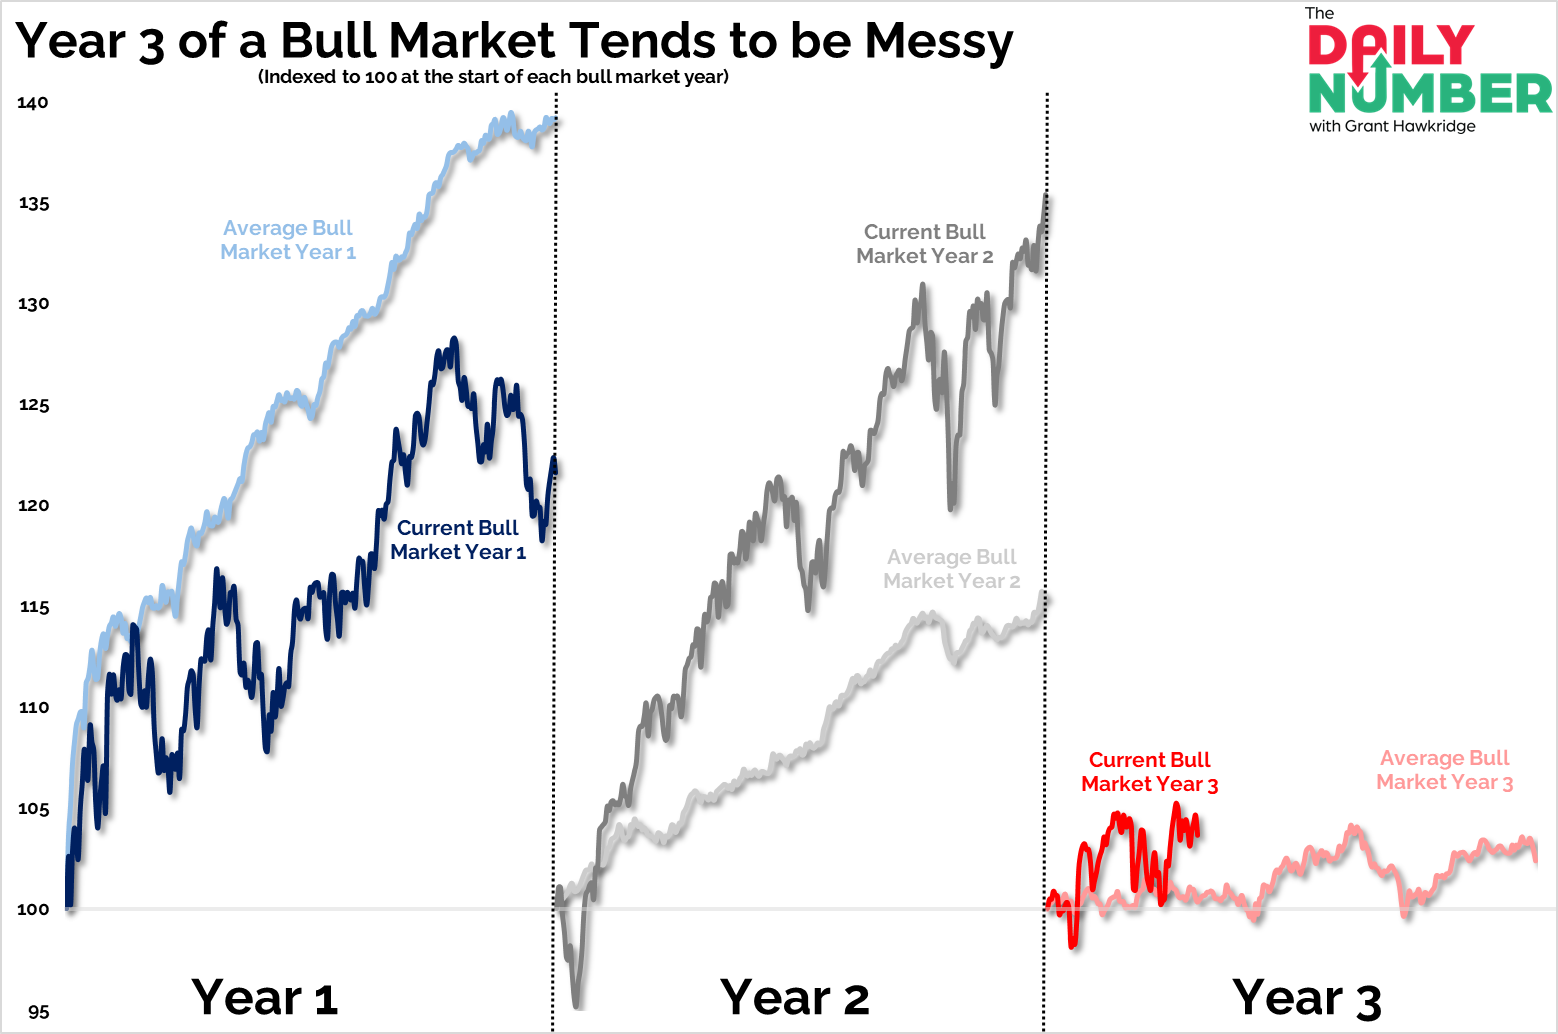
Another great chart here from Grant, shows the tendency of the 3rd year of a bull market to be messy and sideways .
Source: Grant Hawkridge
Grant’s Takeaway: “Let's start by clarifying how I define a bull market:
A bull market is a 20% or more rally preceded by a -20% or more drop.
The current bull market has been ongoing for 581 trading days, resulting in a 69% gain. However, historically, after two years of strong market gains, the third year tends to be flat.
We are currently 78 trading days into the third year of this bull market, and it appears to be following its historical trend of remaining relatively flat during this period, as it has only gained just over 3% in four months.”
However zooming out on the SPY chart shows we are still in a strong and steady uptrend.
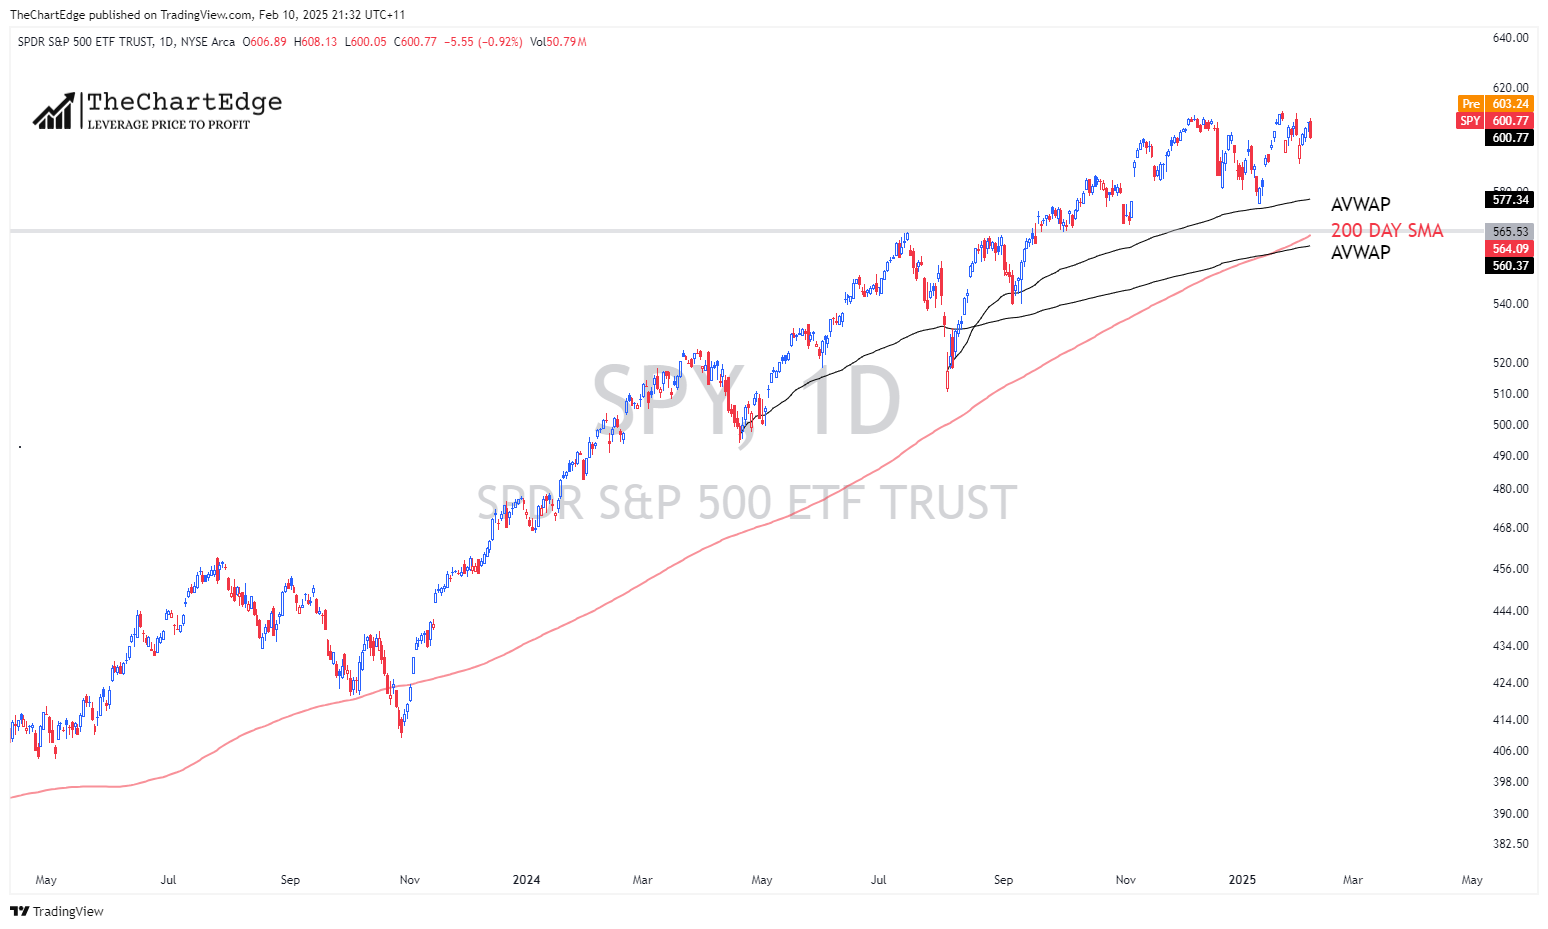
Even if we were to have a larger pullback to around 560-565 (a fall of around 7-8% from the all time highs) which would coincide with the 200 day simple moving average and the anchored VWAP from the April 2024 lows, the longer term uptrend would still be intact. If we were to have a larger correction and test this area, it would likely be an excellent buying opportunity for longer term holders/investors. Although if it did happen it would feel pretty scary at the time.
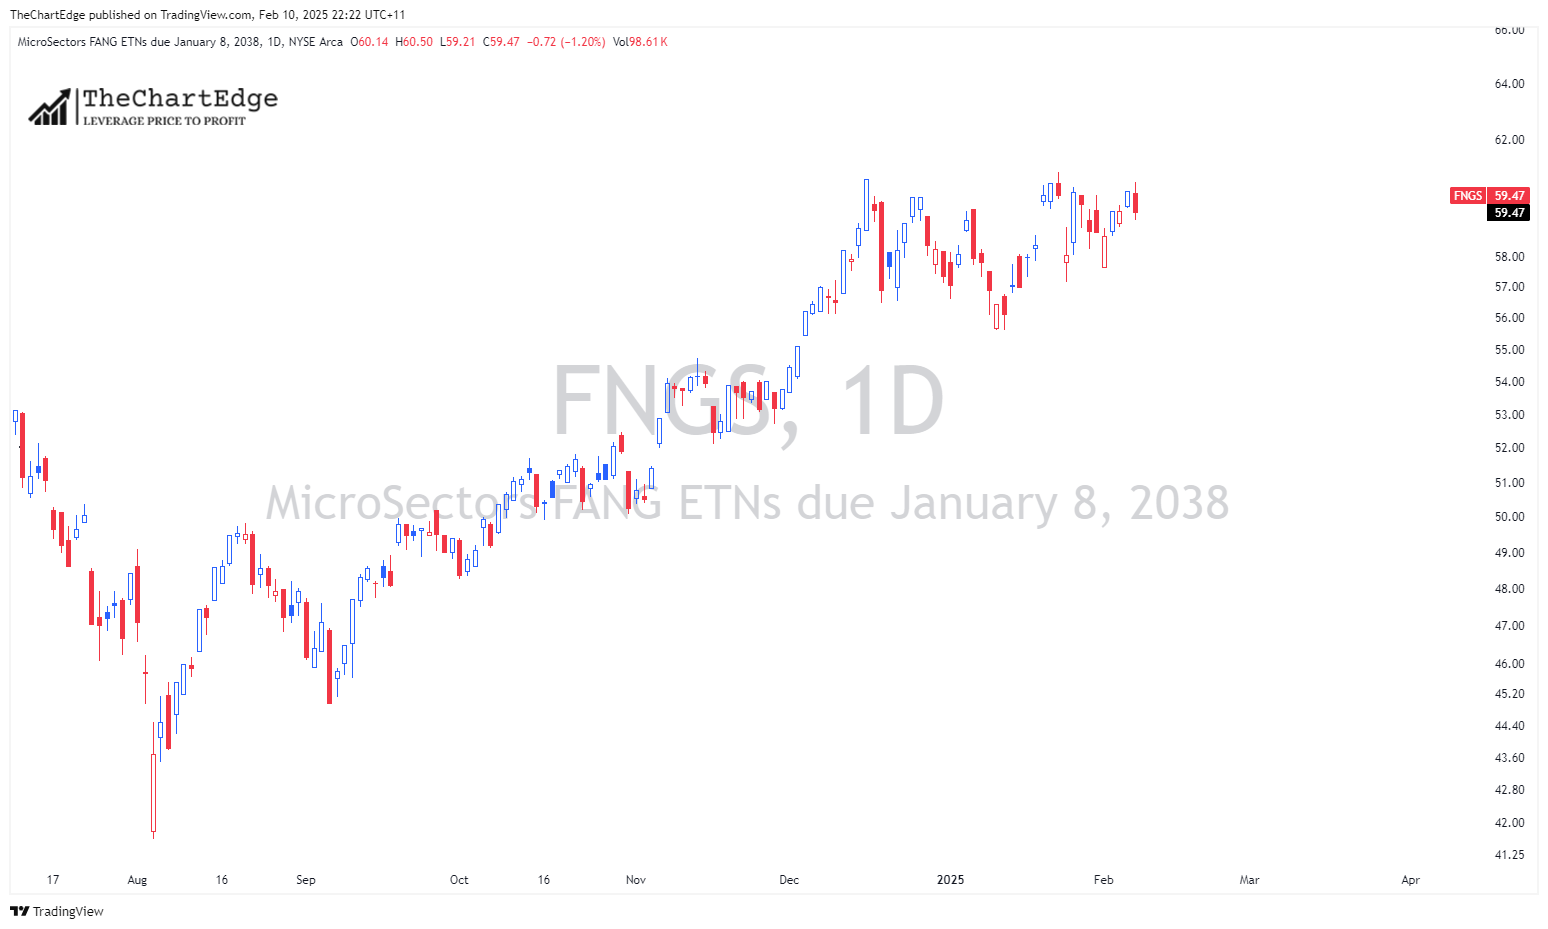
We should remember the SPY is only just over 1% from all time highs. There are also some good looking charts out there. The mega-caps are mixed on an individual basis, but the FNGS ETN, which tracks the NYSE® FANG+™ Index is pushing up again all time highs.
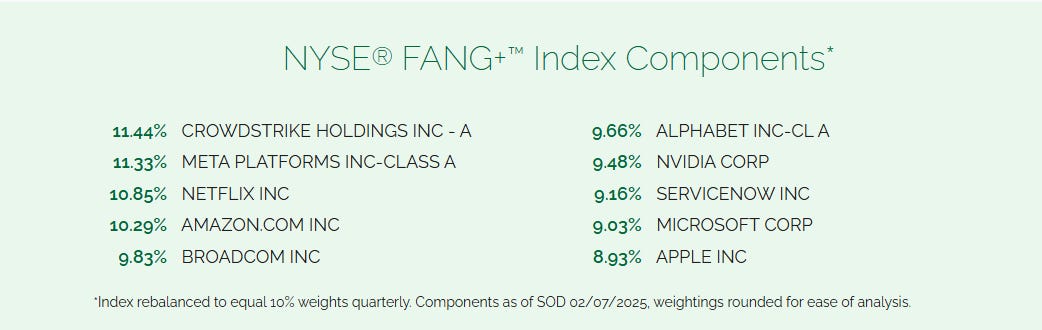
Here are the current components:
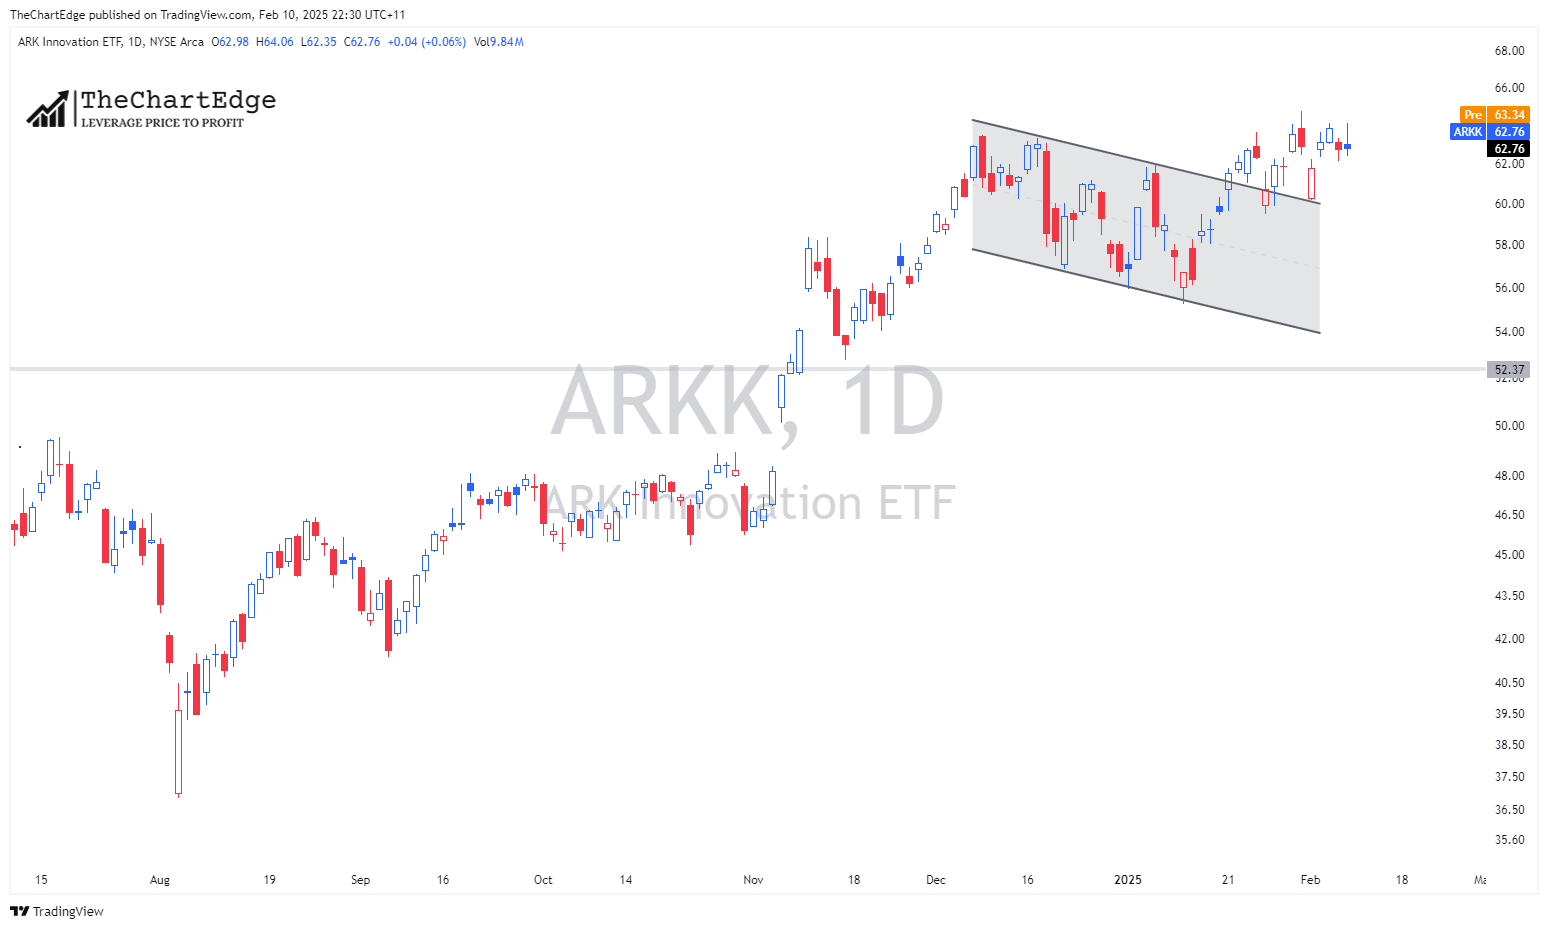
Speculative Tech/Growth also looks good. Below is the ARK Innovation ETF (ARKK), which is pushing up against 52 week highs.
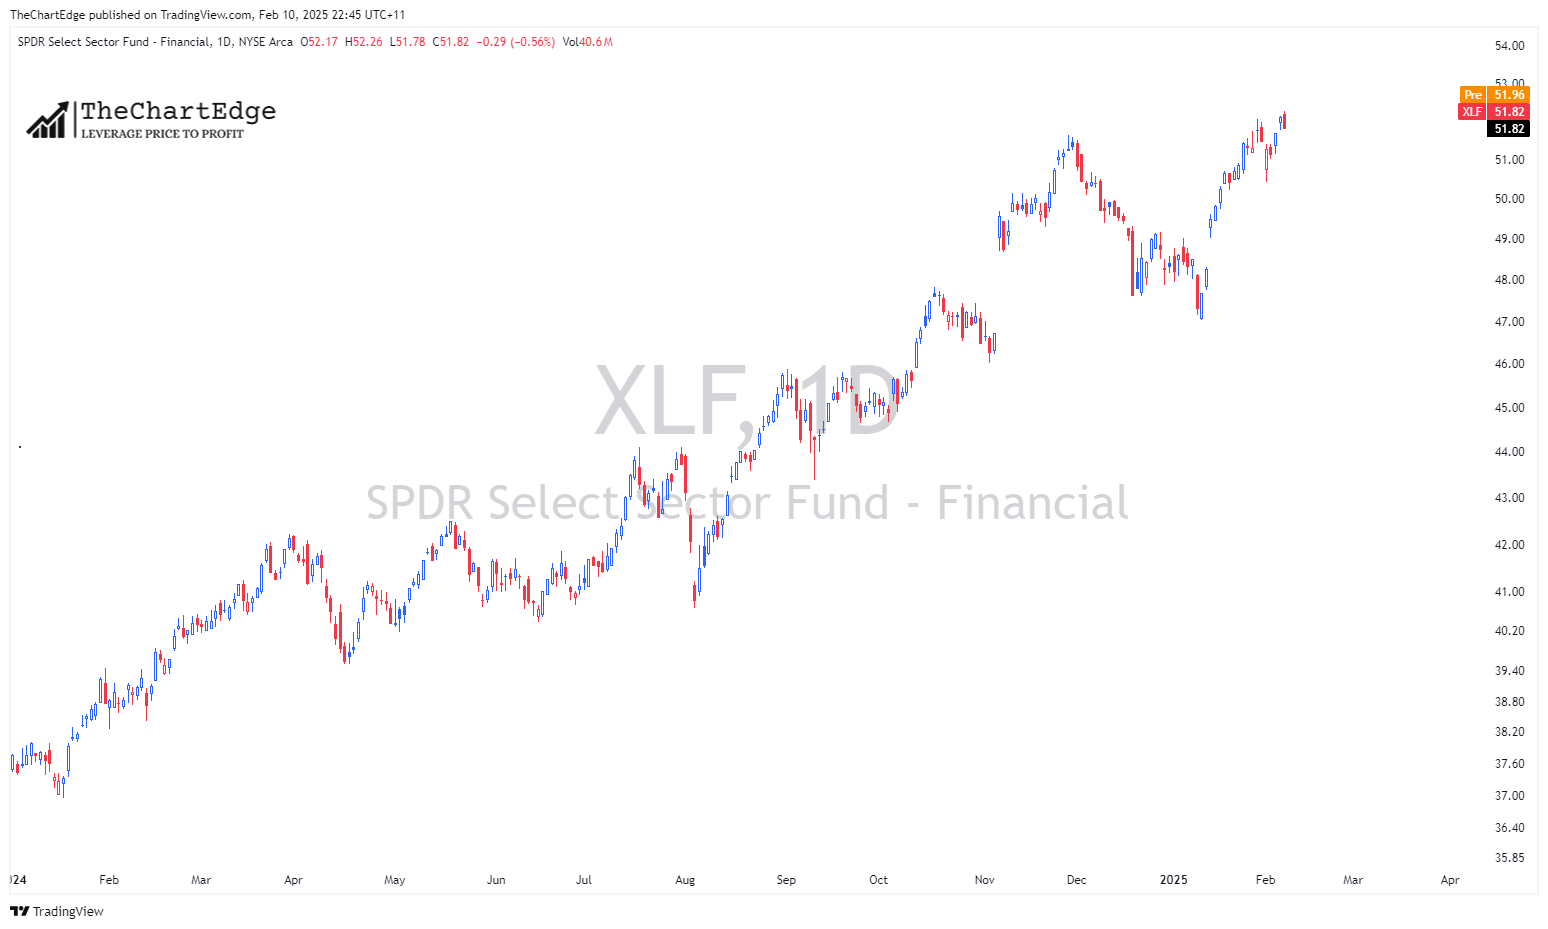
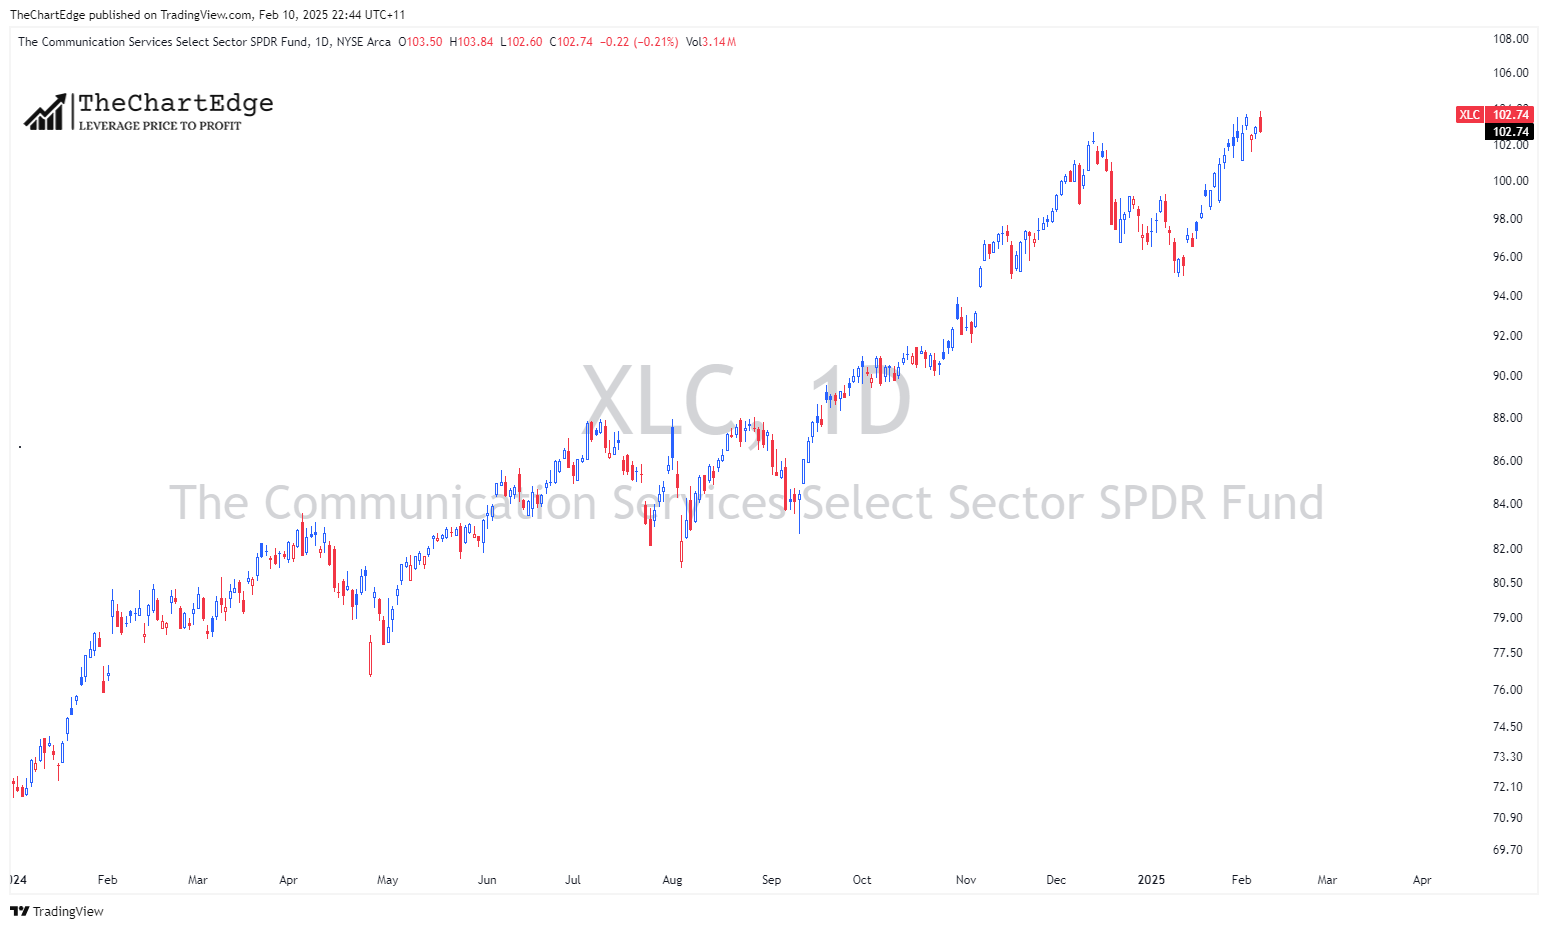
Financials XLF and Communications XLC are also knocking up against all time highs. Although both are looking a little overextended here. Friday’s price action gapped up and rejected higher prices, closing at or very close to the lows of the day, so it wouldn’t be surprising to see some consolidation or a pullback here.
In conclusion, it’s likely we will continue to see some choppy action and maybe even a pullback in the short term. From a swing trading standpoint, I will continue to trade less and in smaller size until it becomes clear the uptrend has resumed. However, in my longer term portfolio, if we do get a larger pullback or correction I will be looking to buy/add SPY and other strong stocks or sectors.
Hope everyone has a great week!
Cheers!
Marcus Grant, CFTe
TheChartEdge is free today. But if you enjoyed this post, you can tell TheChartEdge that their writing is valuable by pledging a future subscription. You won't be charged unless they enable payments.
Disclaimer: The content provided in this newsletter is for informational and educational purposes only and should not be considered as financial, investment, or legal advice. The information shared is based on our research and analysis, but we are not a licensed financial advisor, nor can we guarantee its accuracy, completeness, or timeliness. Market conditions and financial instruments can change rapidly, and any opinions expressed may not be suitable for all investors. Any opinions expressed and or securities mentioned do not constitute a recommendation to buy, sell, or hold that or any other security. You should conduct your own due diligence and consult with a licensed financial advisor or other professional before making any investment decisions. Past performance is not indicative of future results, and all investments carry the risk of loss. The authors and publishers of this newsletter are not responsible for any financial decisions made based on the content provided herein. By reading and or subscribing to this newsletter, you acknowledge and agree that you are using the information at your own risk.