

S&P 500 ONWARDS AND UPWARDS IN A RECORD BREAKING YEAR (SO FAR)
Will it continue?

Since my last post the S&P 500 has broken out above the resistance discussed around 562-565 on the SPY and consolidated nicely above it. The chart looks looks very constructive. As long as we hold above this level there is no reason to get worried.
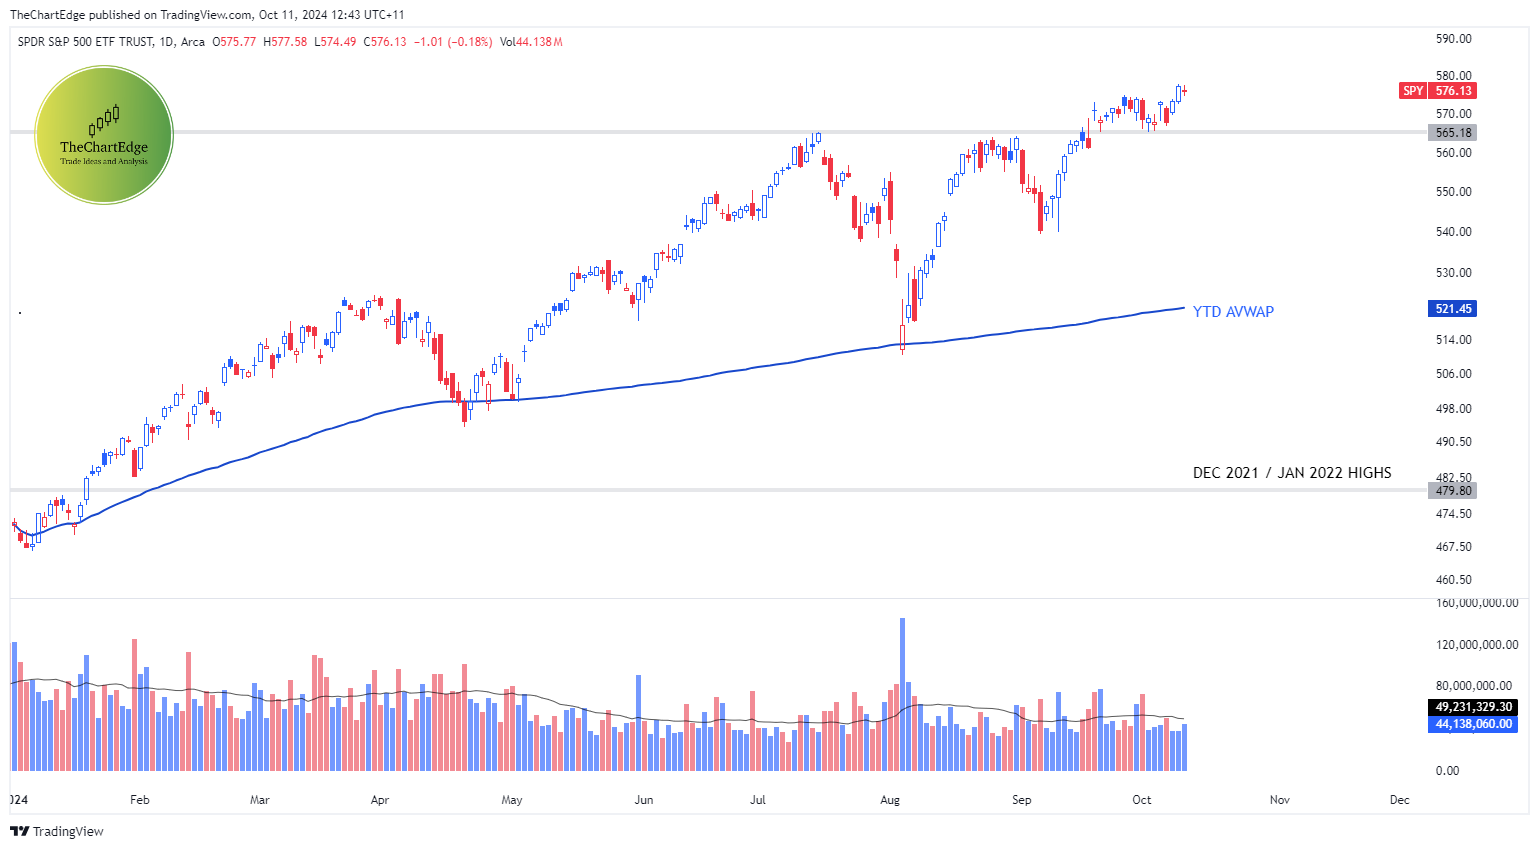
It’s interesting how well the S&P 500 has held up in the face of election year seasonal headwinds. This in fact points to how strong the market current is.
The chart below by Grant Hawkridge, shows that this year (red line) is the best performing election year (so far) going back to the 1950s.
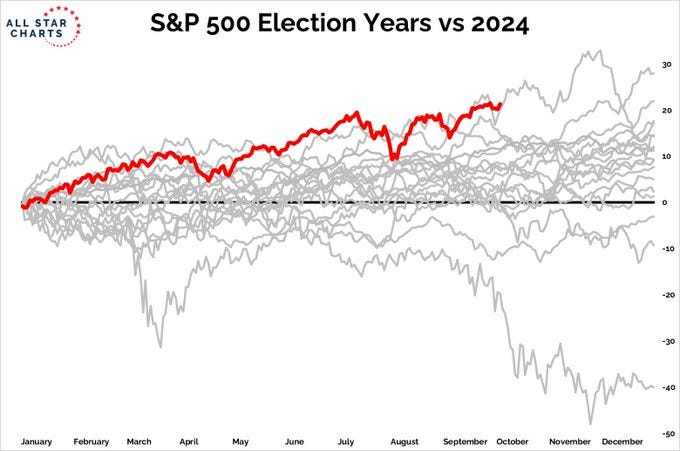
Source: Grant Hawkridge
And not only that, but it is the best year to date performance for any year going back to 2000. H/T The Daily Shot
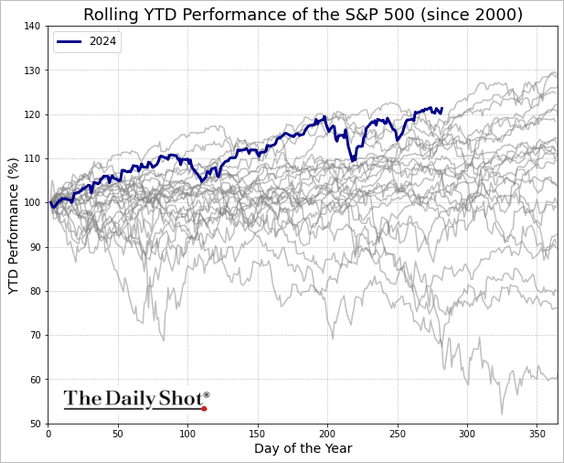
Source: The Daily Shot
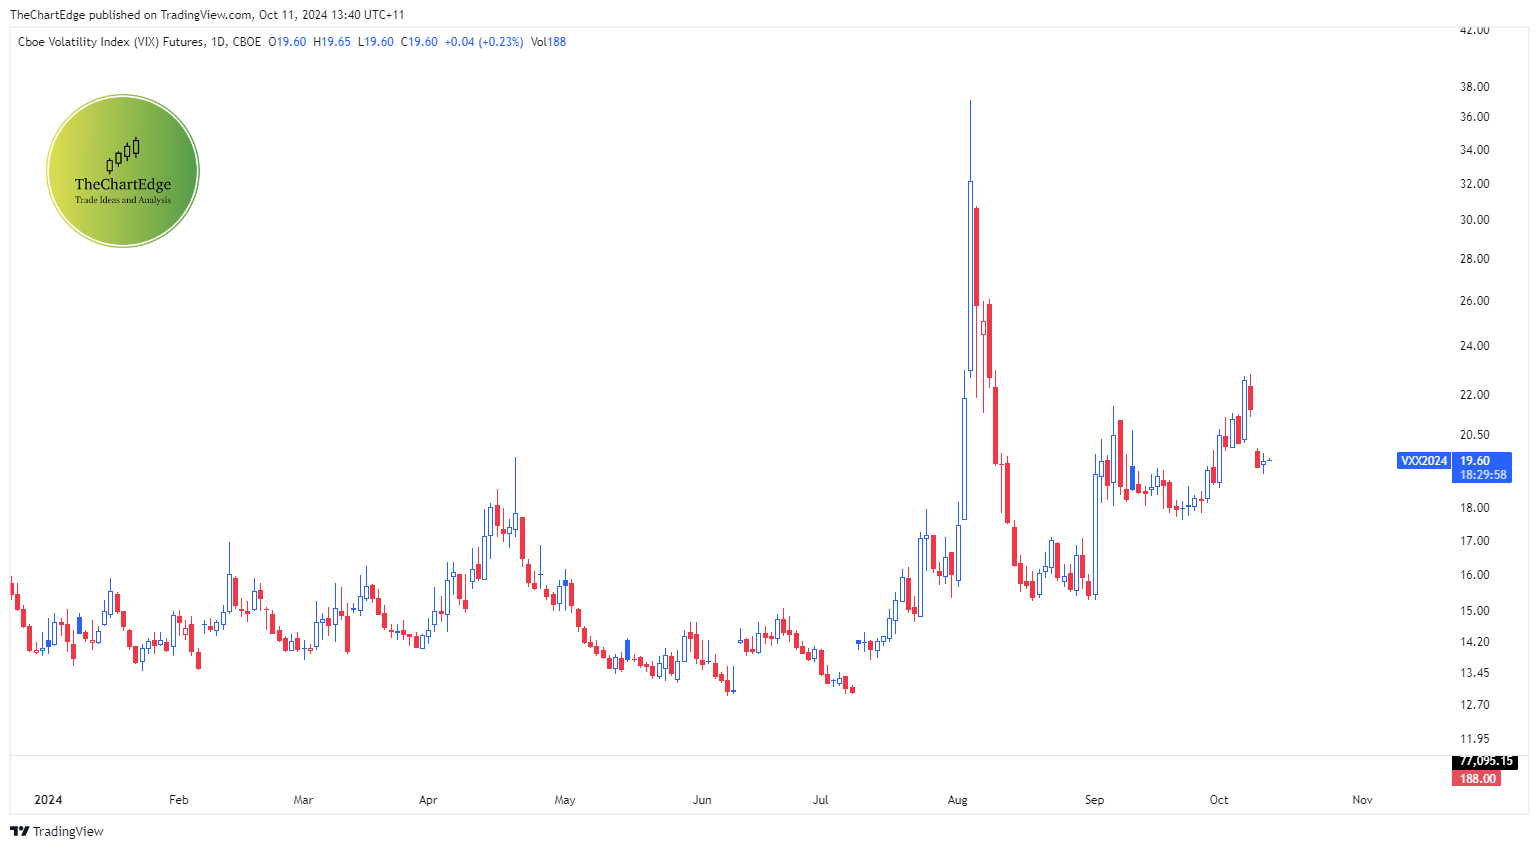
Interestingly, “fear” as measured by VIX futures, is quite elevated, at nearly some of the highest levels for the year (except for the Yen carry trade panic in early August when markets went a bit haywire).
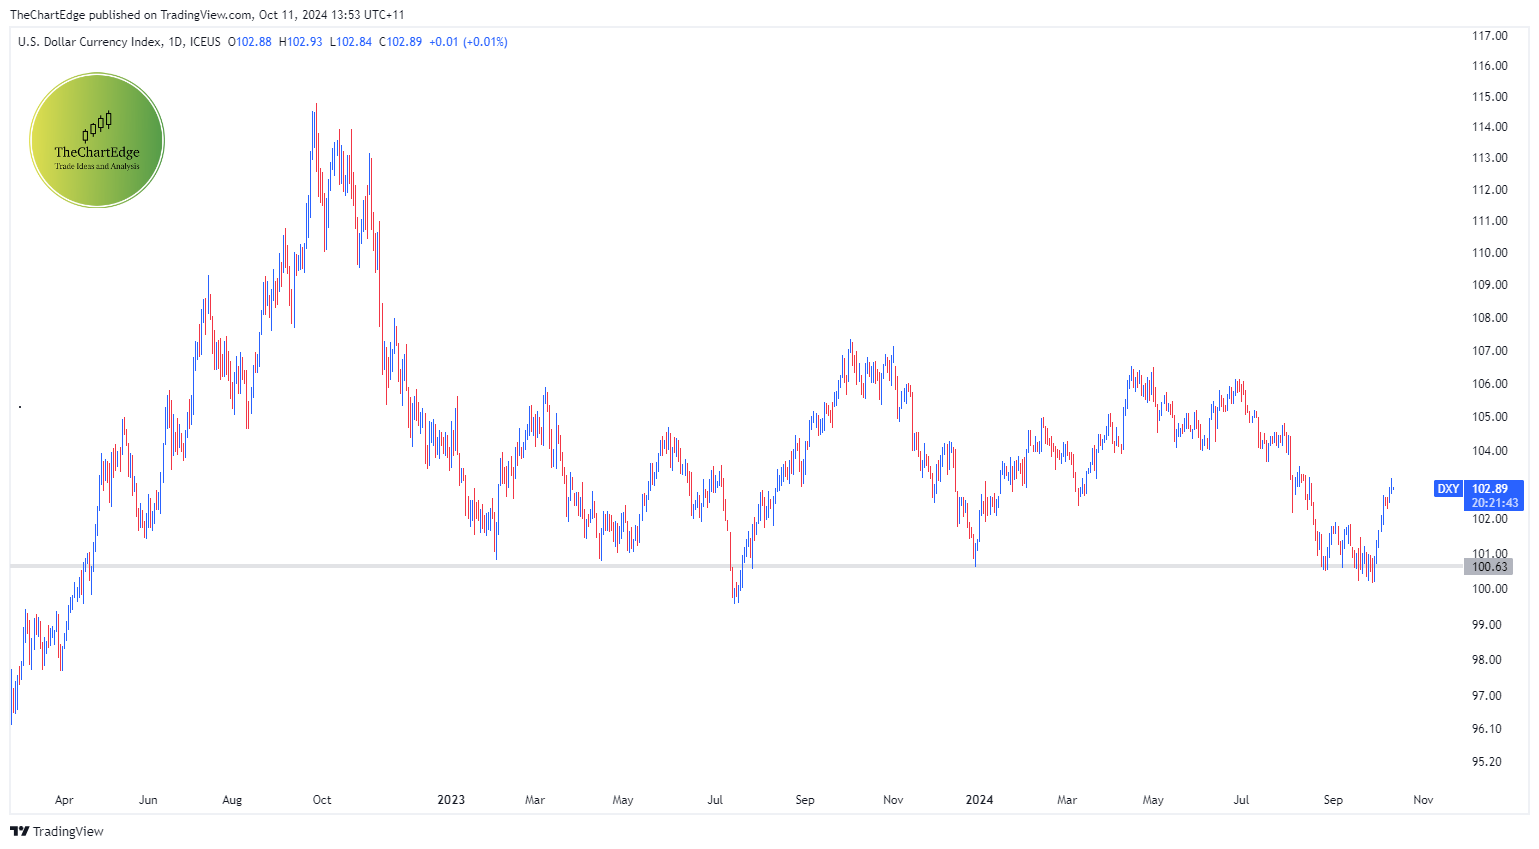
The US Dollar Index (DXY) has also made a fairly swift move higher since the start of October, after looking like it wanted to breakdown under 100. A higher USD is usually consistent with a risk off environment or trade.
Here’s another great chart from Grant Hawkridge showing other risk on - risk off measures that usually have a fairly high correlation with the S&P 500. All is in order, except for the US dollar.
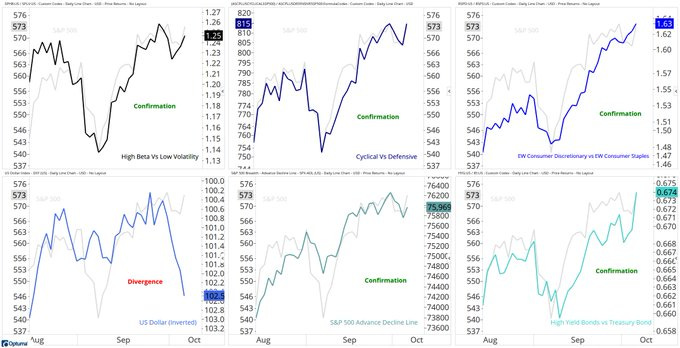
Source: Grant Hawkridge
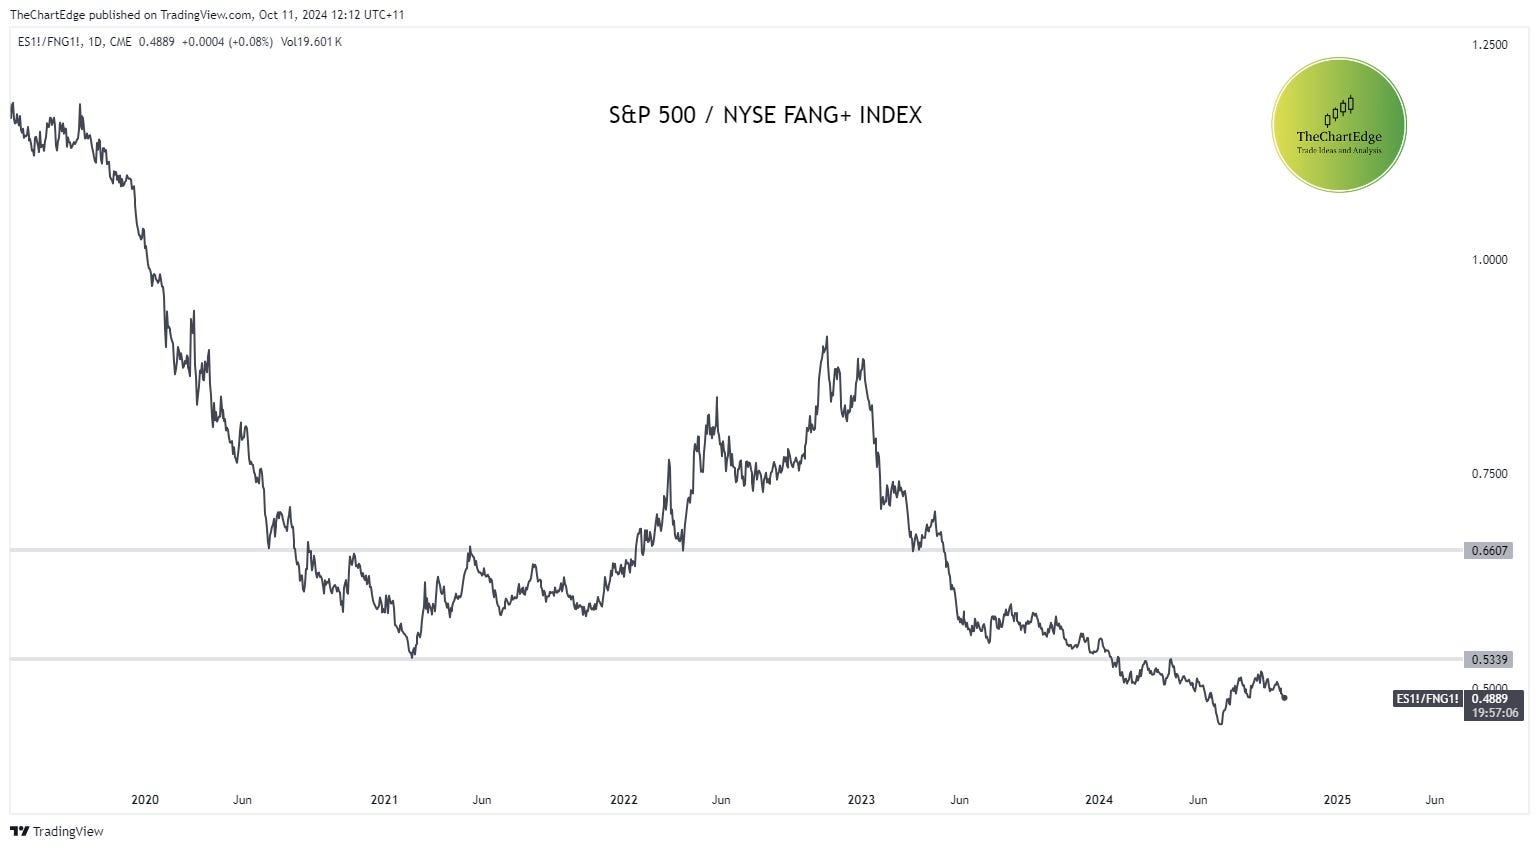
Updating some of the charts from my last post, you can see the FANG+ Index has slightly outperformed the S&P 500 in the last 3 weeks.
This ratio chart shows the S&P 500 relative to the FANG+ Index and the black line is turning down again, which means the FANG+ is outperforming.
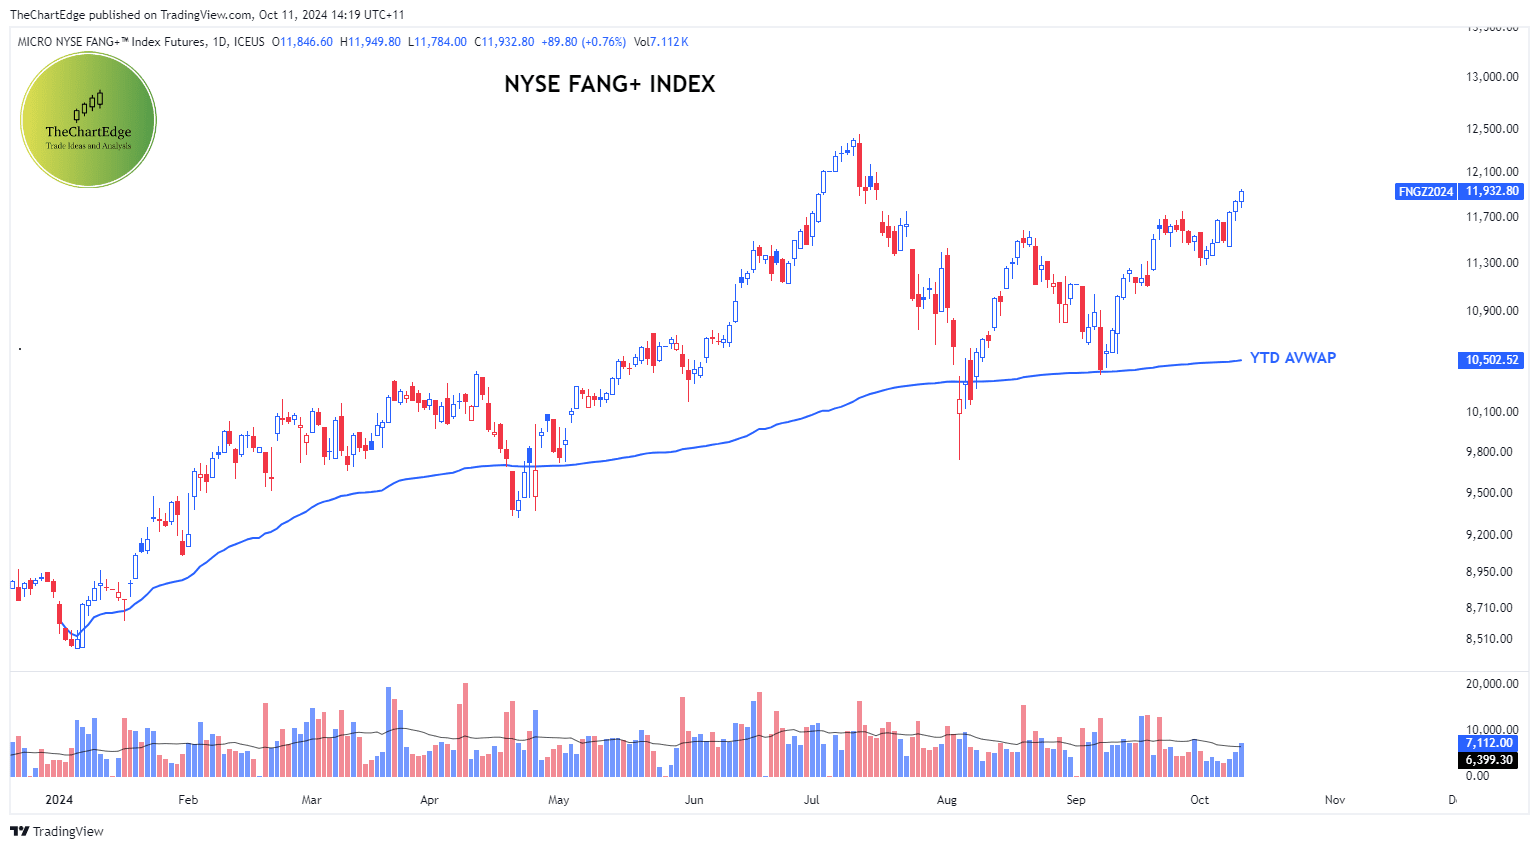
Here is the FANG+ index futures chart. It still hasn’t reached a new ATH. However it has started making higher highs and higher lows, and seems poised to make a run towards the July ATHs, currently being lead by Nvidia, Broadcom and Meta, which have performed well in recent weeks.
So, in conclusion, the S&P 500’s strength in the face of typical seasonal election year headwinds is very impressive. There is no reason to start worrying unless the SPY breaks back below 562-565. The VIX is elevated relative to where its been most of the year, however this is probably due to hedging (put buying) due to uncertainty regarding the upcoming election. However, I would say it’s a good thing that people are generally a bit “fearful” and not super bullish or optimistic currently, despite the S&P 500 being a hair away from new ATHs yet again. The US dollar strength is something to keep an eye on, but I think it has just been following the 10Y Treasury Bond yield higher since the start of October.
Thanks to those who read to the end! Let me know what you think, I’d love some feedback, or leave a comment, and please subscribe and or share the post with friends who may also enjoy it!
Cheers,
Marcus
Disclaimer: The content provided in this newsletter is for informational and educational purposes only and should not be considered as financial, investment, or legal advice. The information shared is based on my research and analysis, but I am not a licensed financial advisor, nor can I guarantee its accuracy, completeness, or timeliness. Market conditions and financial instruments can change rapidly, and any opinions expressed may not be suitable for all investors. Any opinions expressed and or securities mentioned do not constitute a recommendation to buy, sell, or hold that or any other security. You should conduct your own due diligence and consult with a licensed financial advisor or other professional before making any investment decisions. Past performance is not indicative of future results, and all investments carry the risk of loss. The authors and publishers of this newsletter are not responsible for any financial decisions made based on the content provided herein. By reading or subscribing to this newsletter, you acknowledge and agree that you are using the information at your own risk.