


Each week I review a few hundred charts across my coverage universe. These are 10 stocks I have on my focus list for potential new entries this week. These are swing trades - if they work, I’d expect to hold for a few weeks to a couple of months. If they don’t, I’ll be out in days. I generally start taking partial profit at 2-3R and trail the rest using moving averages.
Seven out of ten are semis or semi equipment. Due to the high correlation between these stocks, I will not be entering them all in full size positions - even if they all offered “perfect entries”. What I’ll do instead is reduce position size and use a scatter-gun approach (buy them all but in smaller size) if good entries are on offer early in the week. One benefit is that you’ll get stopped out of the positions that don’t work and can look to add to the ones that do - or if you’re lucky, they may all work. However, it’s possible they all fail, so I would not risk more than about 3 or 4% of my entire portfolio when entering this many new positions in a short period. For example, if taking 8 new positions I would risk 0.5% per trade. Another option is to enter two or three names and only add new positions if you get traction on the original ones. Both methods have their own pros and cons - and I do both at different times.
I am writing this at 7pm Melbourne time on Tuesday May 26 - depending on the price action during the week, I may and likely will change at least some of the entry prices and methods (pullback buy or breakout/strength), tighten stop losses, or outright cancel resting orders if the market starts acting badly. If they explode higher without me, I’ll let them go, I do not chase. Flexibility, adaptability and discipline are key to my trading style.
Semi Equipment
Applied Materials ($AMAT) - Semiconductor equipment. Up 3.6% last week. 3.8% above the 20-day SMA, 4.1% ATR, extension 0.9x ATR from 20-SMA. 3.6% from the all-time high. RSI 62.
AMAT Chart
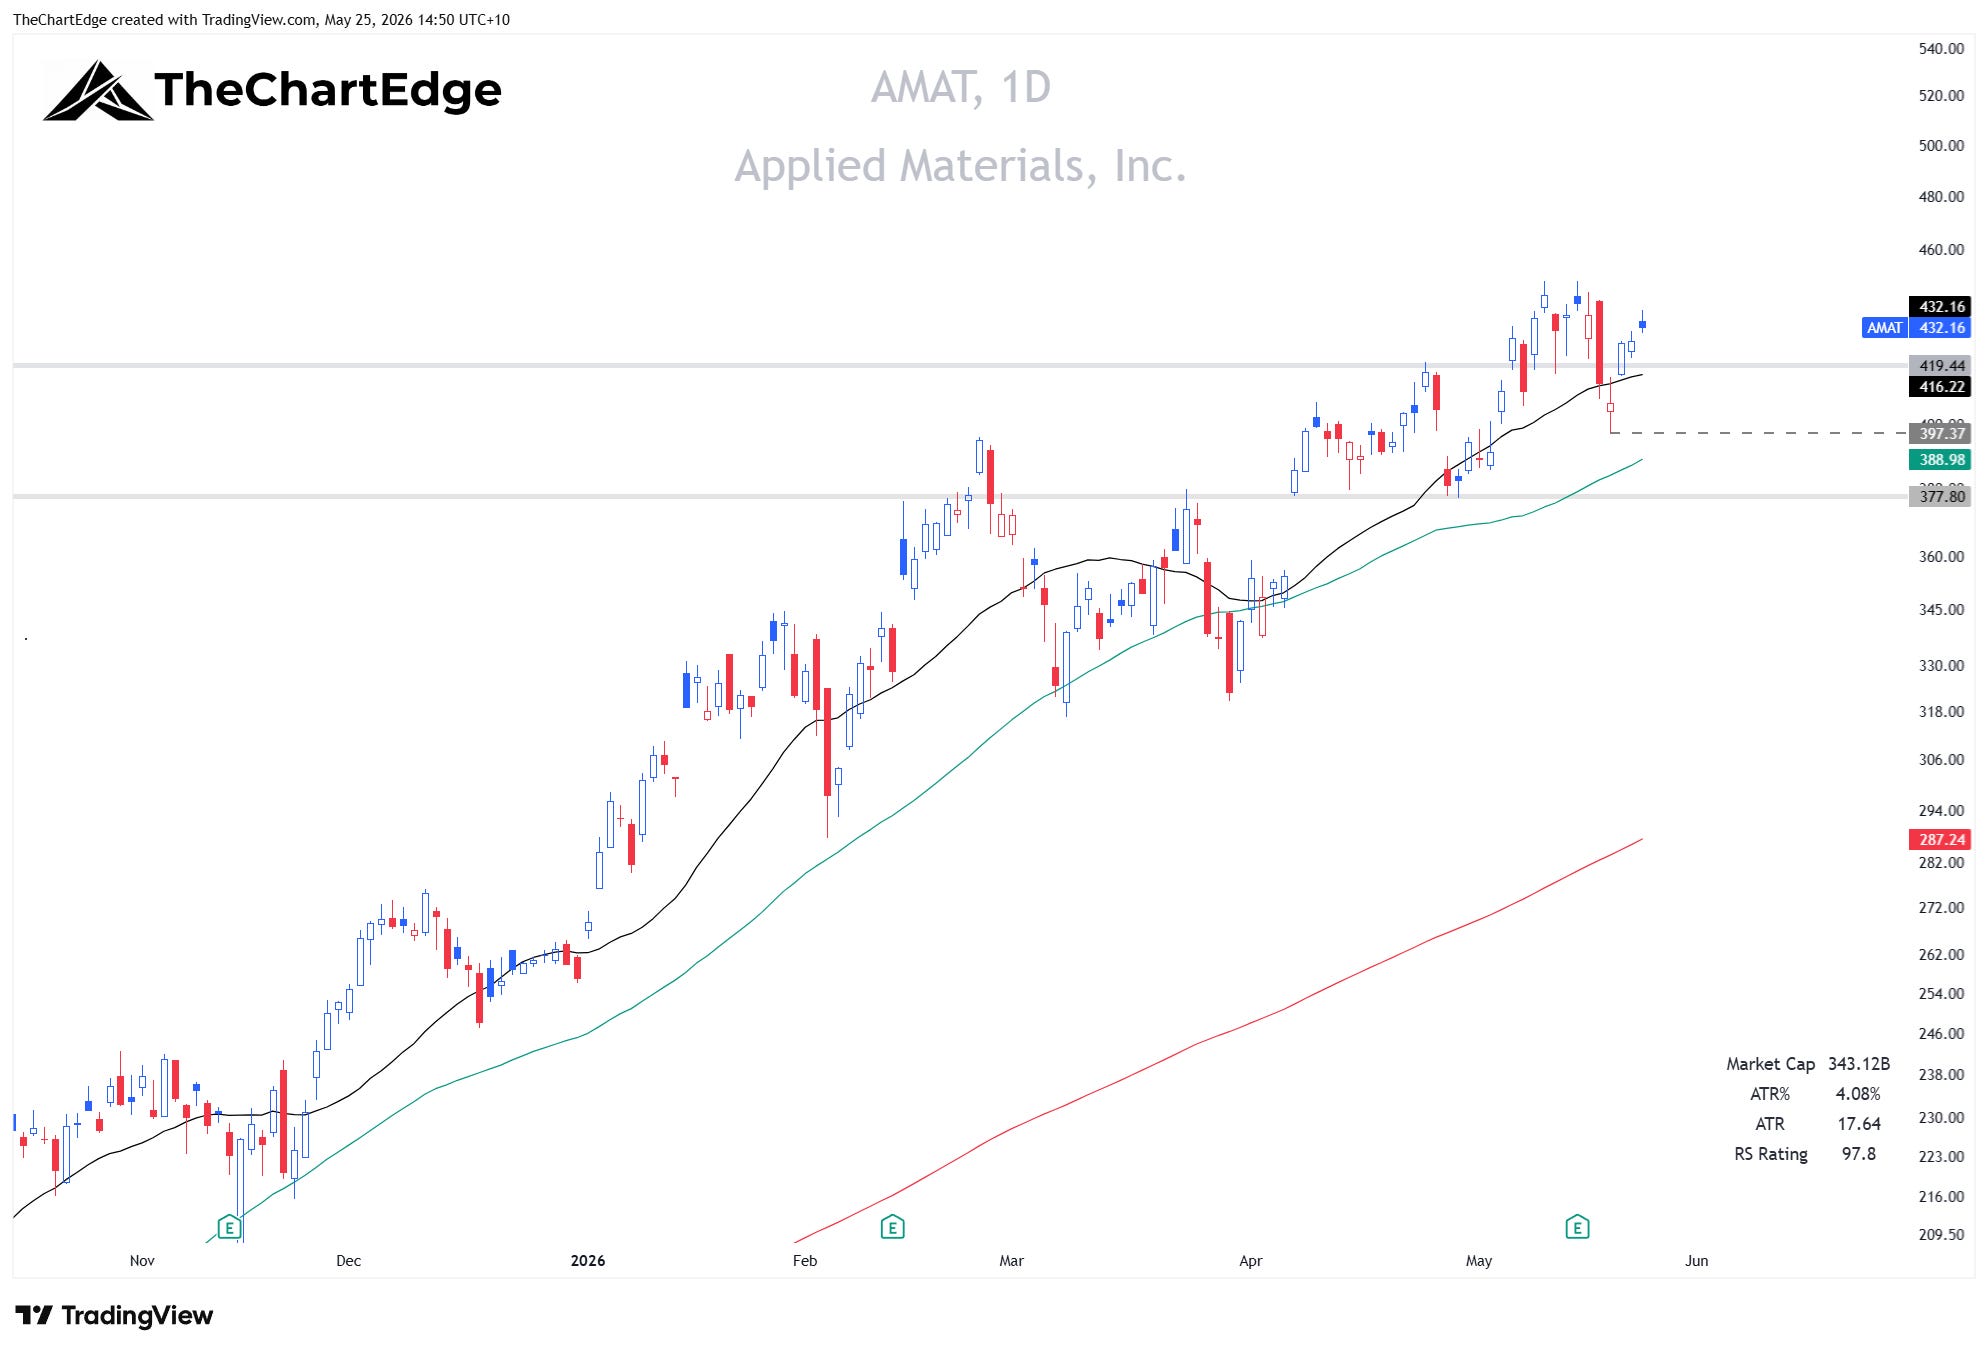
Note: All daily charts - the black line is the 20-day SMA, the green is the 50-day SMA, and the red is the 200-day SMA.
My strategy for AMAT is to leave a resting limit order at $418 with a stop loss at $392. Those of you in the US or at least in a similar time zone can be more tactical and work your entries better. As with most things in life there are positives and negatives. I usually can’t get the best, most precise entries. However, one benefit of being in the opposite time zone is you can’t panic out of your positions based on daily price action, which makes riding your winners easier.
KLA Corporation ($KLAC) - Semiconductor equipment. Up 4.7% last week. 4.5% above the 20-day SMA, 4.1% ATR, extension 1.1x ATR from 20-SMA. 2.6% from the all-time high. RSI 63.
KLAC Chart
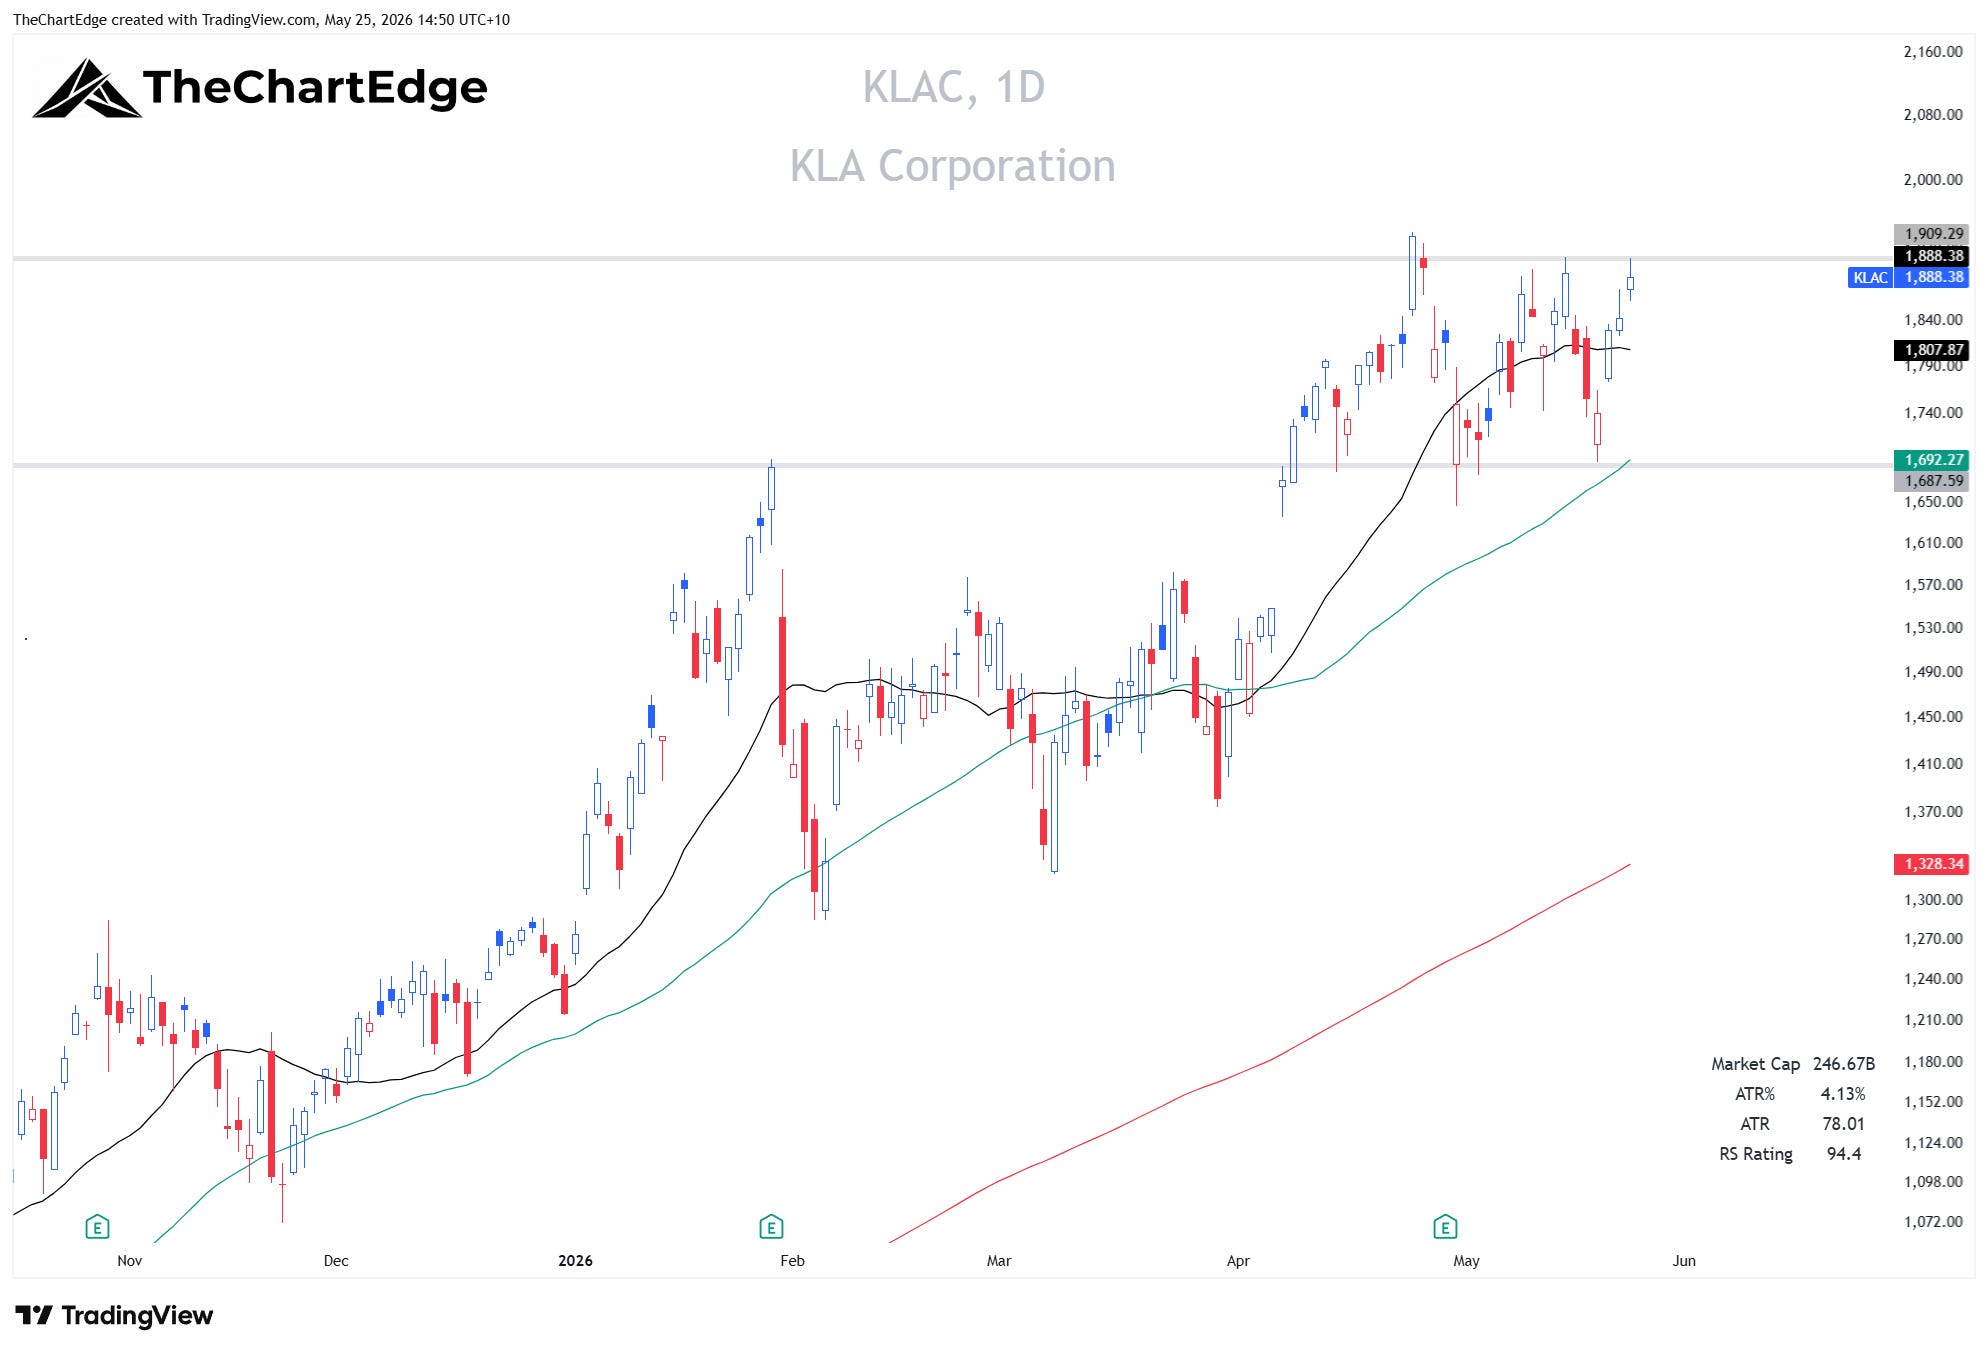
I will enter a buy stop order on KLAC, so I only enter on strength. This also helps reduce risk - if markets pull back and you only have limit orders, they would all trigger and get stopped out if prices continue lower.
I use pretty tight stops most of the time. I usually set a stop between 1-3 ATR for each stock trade - not randomly, but always using a price point on the chart that would invalidate my thesis. For KLAC I will enter a buy stop at $1960 and place my stop at $1780. Could use a tighter stop under Friday’s low around $1861 - because if it breaks out you want it to keep running. If it falls back below Friday’s low, that’s a logical spot to get out, but I’m going to give it a little more room.
One thing to be aware of with buy stop orders: if the market gaps up above your order price, you get filled at the market price on the open, which may be well above the level you set. To manage that risk, I check pre-market prices before going to bed and decide whether to leave the order active or cancel it.
Lam Research ($LRCX) - Semiconductor equipment. Up 4.9% last week. 9.0% above the 20-day SMA, 4.5% ATR, extension 2.0x ATR from 20-SMA. 1.5% from the all-time high. RSI 66.
LRCX Chart
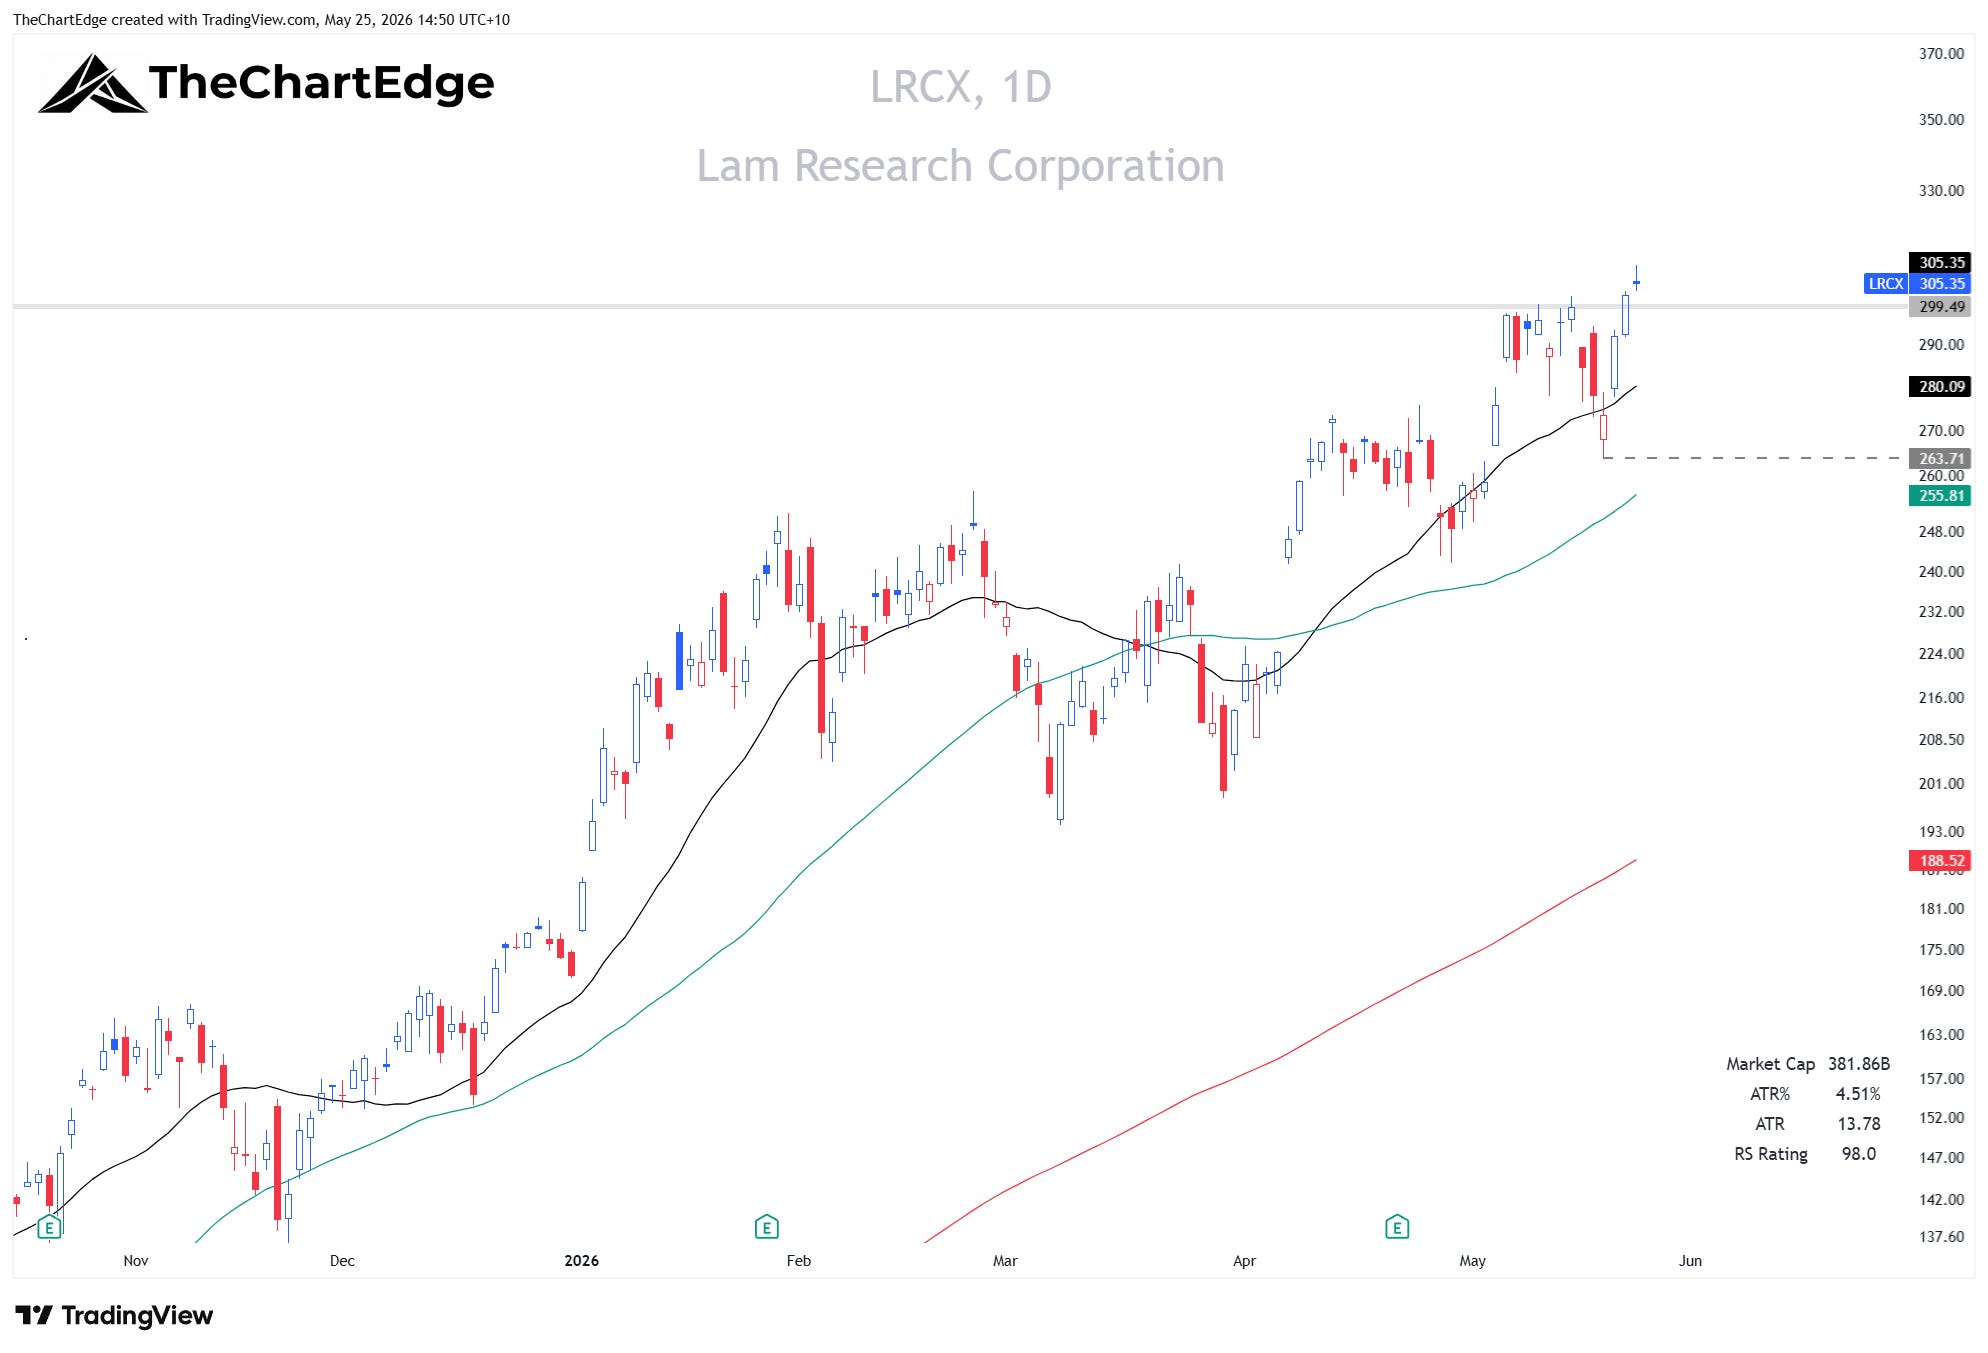
The pre-market is currently showing LRCX (and most of these stocks) will gap up on the open. So I don’t want to be entering too many positions using buy stop orders - if we gap and run that means I’ll miss out, but I’m cool with that. I can’t make tactical entries with tight low-of-day or AVWAP stops unless I stay up until midnight, so it’s a trade-off I need to accept.
Two options I’d consider: a limit order on a slight pullback to about $300, which was resistance during the recent short consolidation, or a lower limit order around $282 which lines up approximately with the 20-day SMA. The first feels a bit aggressive, so I’m going with $282. Stop loss goes under the May 19 low with a little extra breathing room at $252, which would also be under the 50-day SMA. In my opinion there’s no reason to hold a swing trade if the stock is breaking its 50-day SMA - I’m looking for the strongest stocks continuing their uptrend.
MKS Instruments ($MKSI) - Semiconductor equipment. Up 3.4% last week. 7.5% above the 20-day SMA, 4.7% ATR, extension 1.6x ATR from 20-SMA. 1.9% from the all-time high. RSI 66.
MKSI Chart
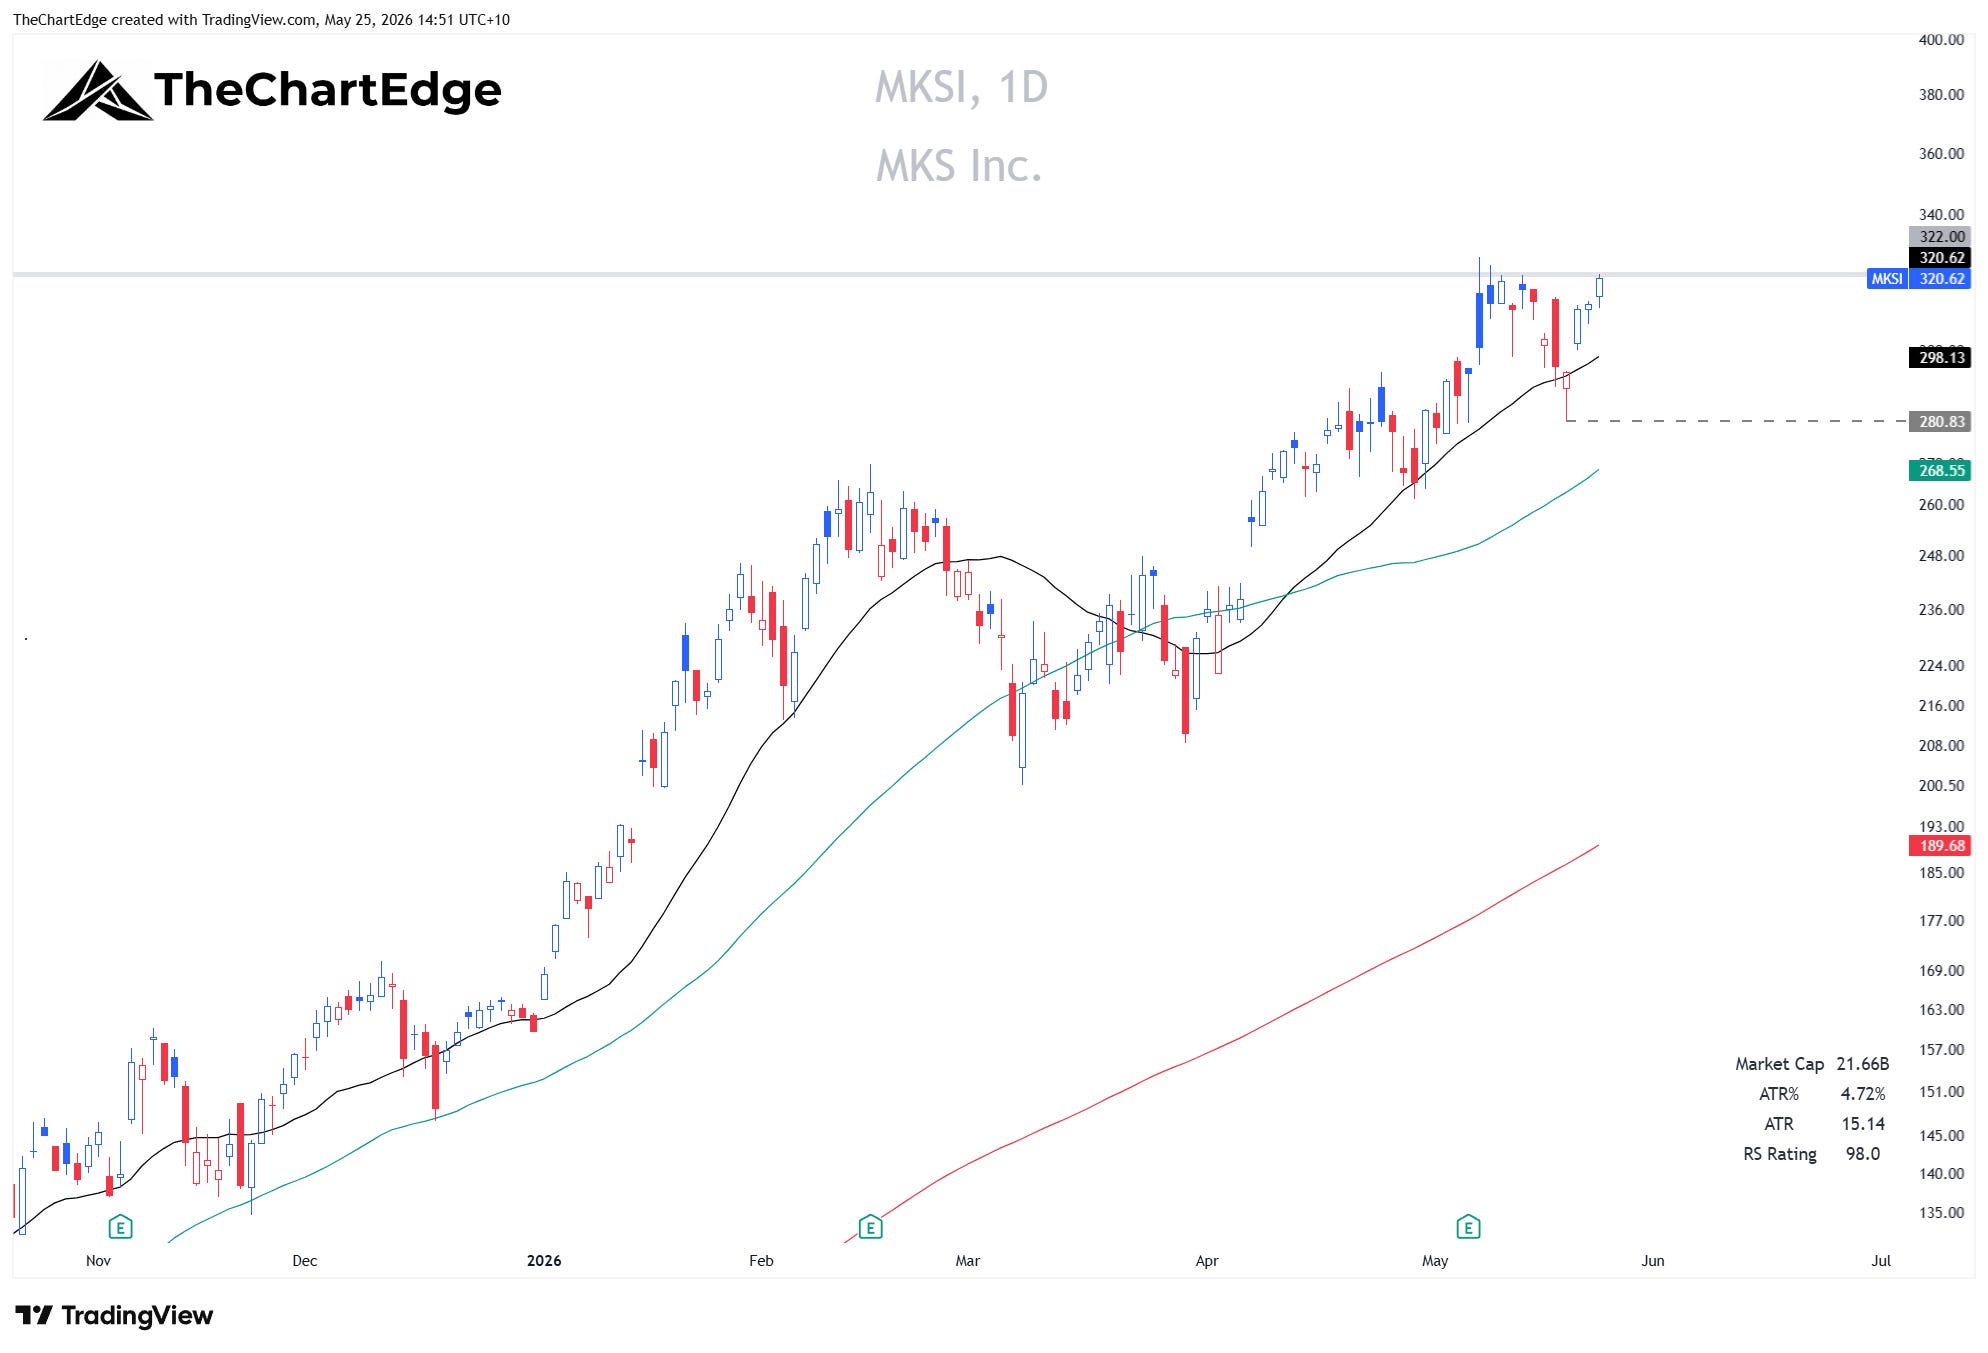
I’m looking at buying a breakout on MKSI - will place a buy stop order at $325. This has been a very strong stock, so if it goes it could go quickly. I would prefer if it just went sideways for a week or so between the 20-day SMA and the $320 level that’s been holding it back. But you don’t always get what you want. It is currently trading at $334 in the premarket.
The May 19 low is too far away for a stop loss on a breakout setup. An aggressive stop would be Friday’s lows around $311. I’m going to give it more room and put the stop under Wednesday’s (May 20) low, which also sits under the 20-day SMA. Stop loss at $289.
Semiconductors
Monolithic Power Systems ($MPWR) - Power management semiconductors. Up 2.6% last week. 0.8% above the 20-day SMA, 4.4% ATR, extension 0.2x ATR from 20-SMA. 5.1% from the all-time high. RSI 56.
MPWR Chart
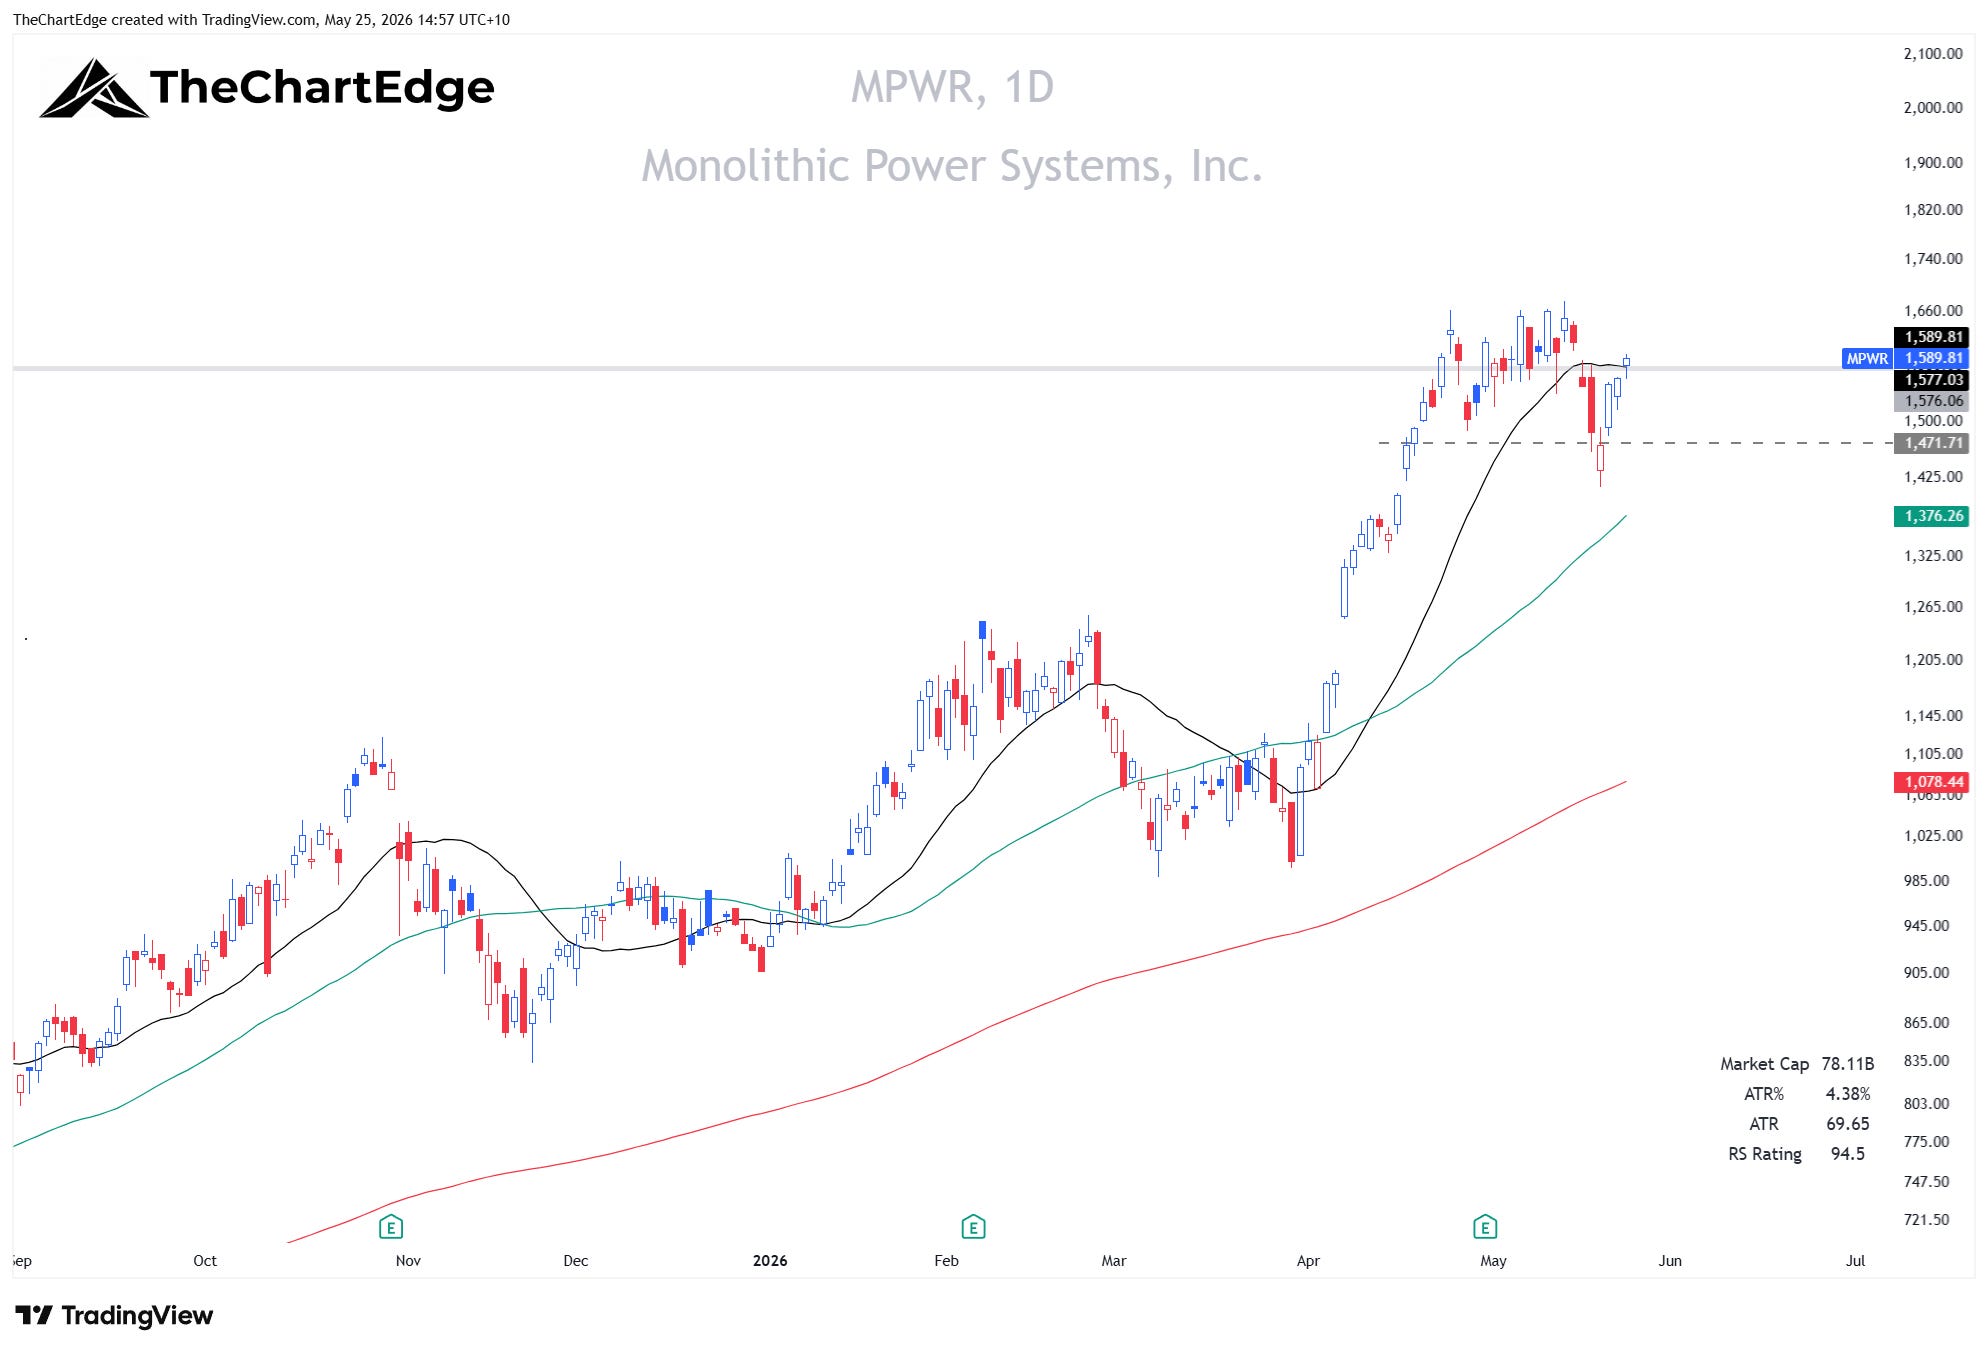
I’m just gonna watch this one for now. I may end up missing it - after the shakeout and strong recovery last week, it could get going again here. Pre-market it’s currently trading at $1,625. I considered placing a buy stop order for this as well, with a tight stop loss around $1,550. If I entered this, I’d want it to run quickly. I wouldn’t want to give it too much room as it’s not the cleanest, tight setup. It already pulled back to around $1400 and recovered last week - so if it breaks higher and fails, I wouldn’t want to hold it. Also, I don’t want to enter too many positions on a gap up today, in case they gap and reverse. I’ll just watch this for now and see how it develops during the week. However, if you can take a tactical entry during the live trading session, with a stop under the low of the day, I’d consider that if I was able to do so.
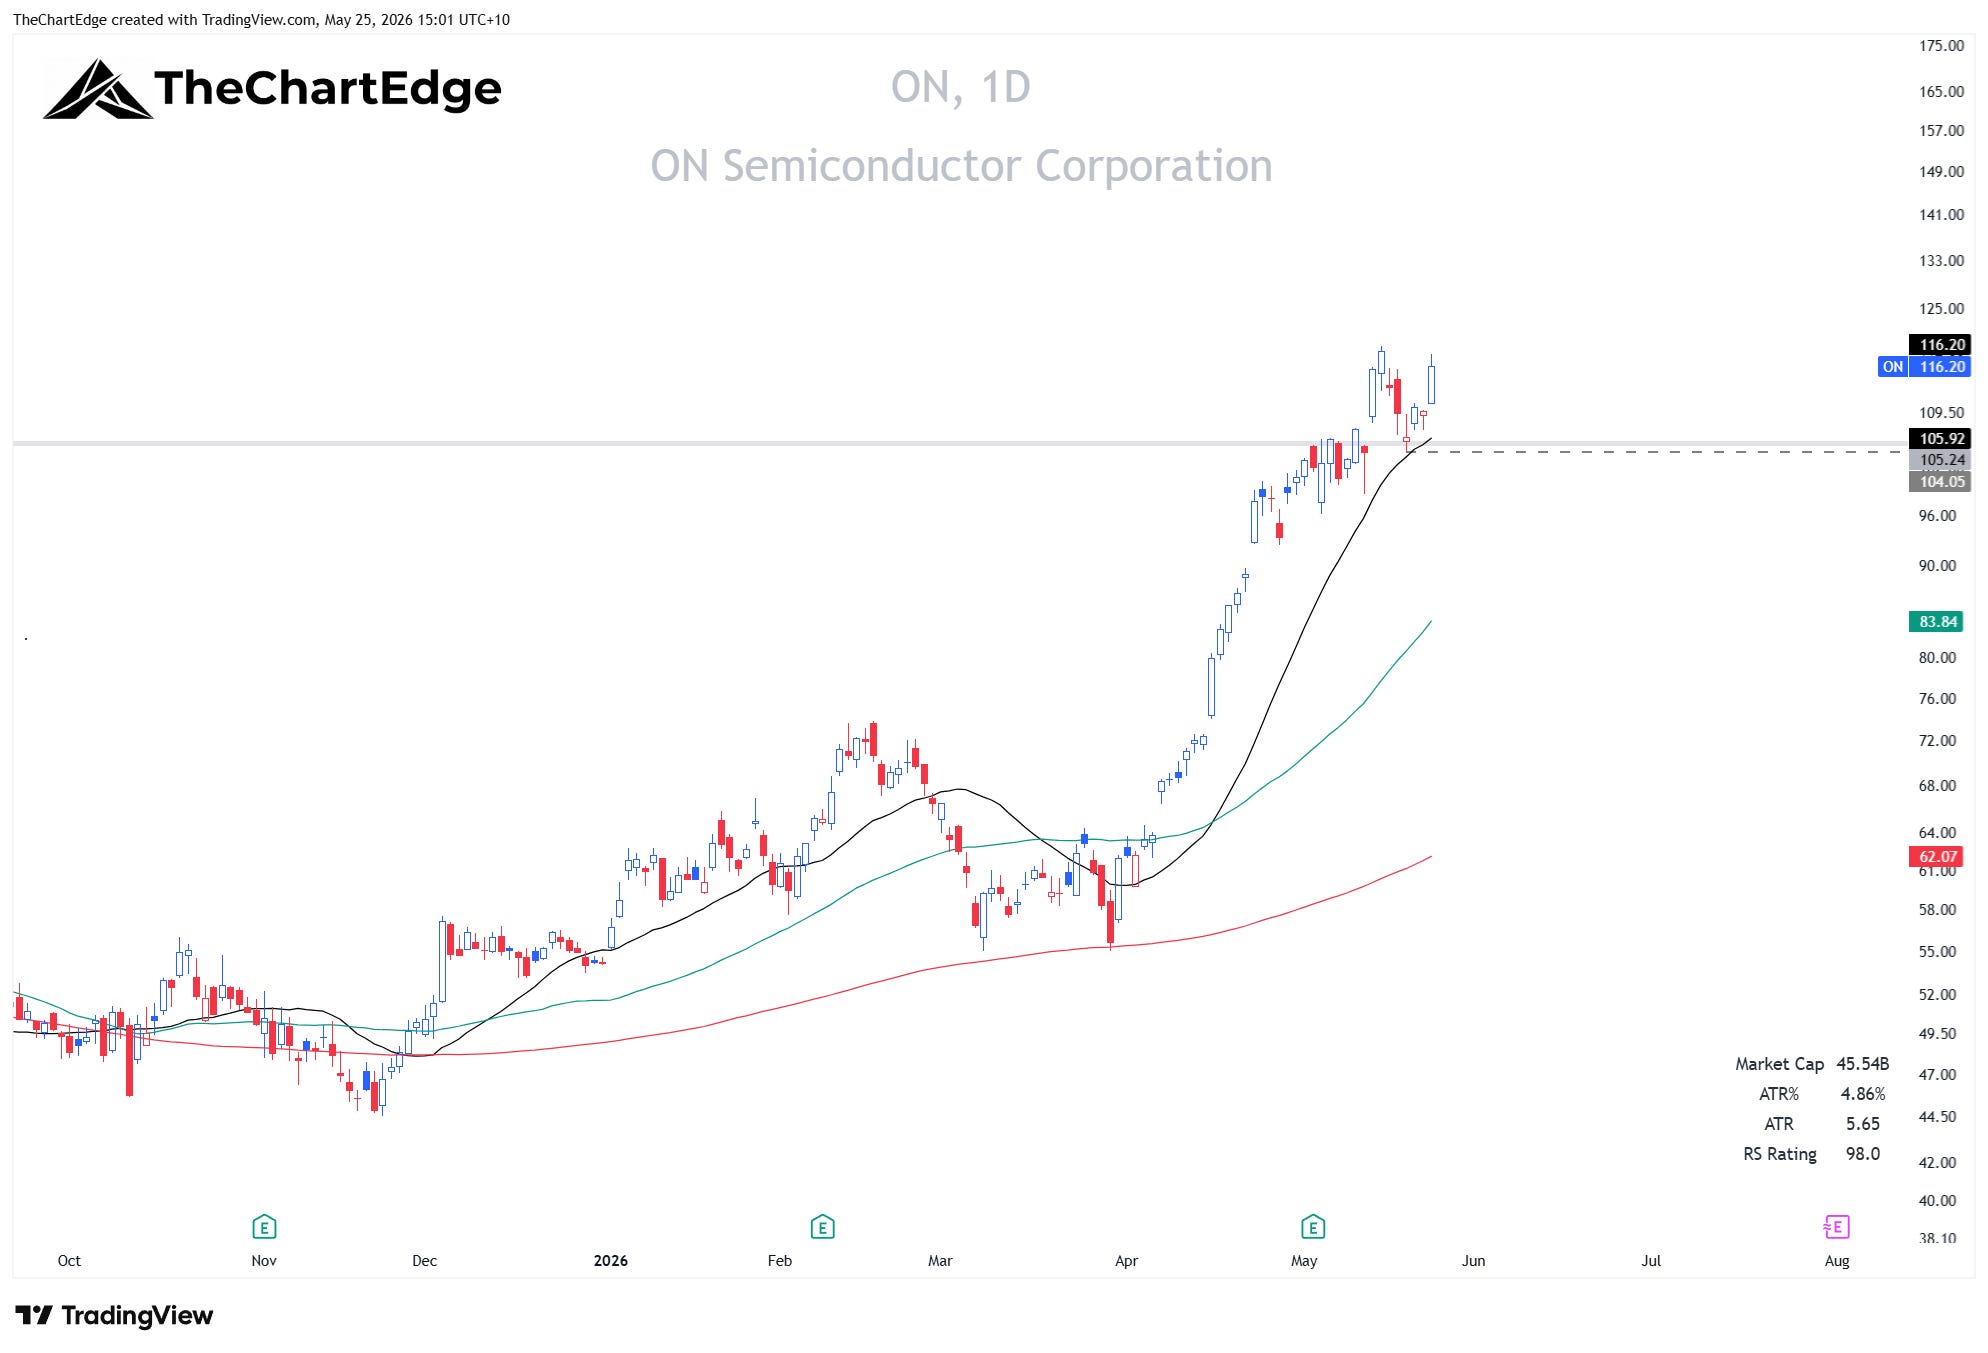
ON Semiconductor ($ON) - Power and sensing semis. Up 2.7% last week. 9.7% above the 20-day SMA, 4.9% ATR, extension 2.0x ATR from 20-SMA. 2.4% from the all-time high. RSI 67.
ON Chart (Daily)
ON Chart (Weekly)
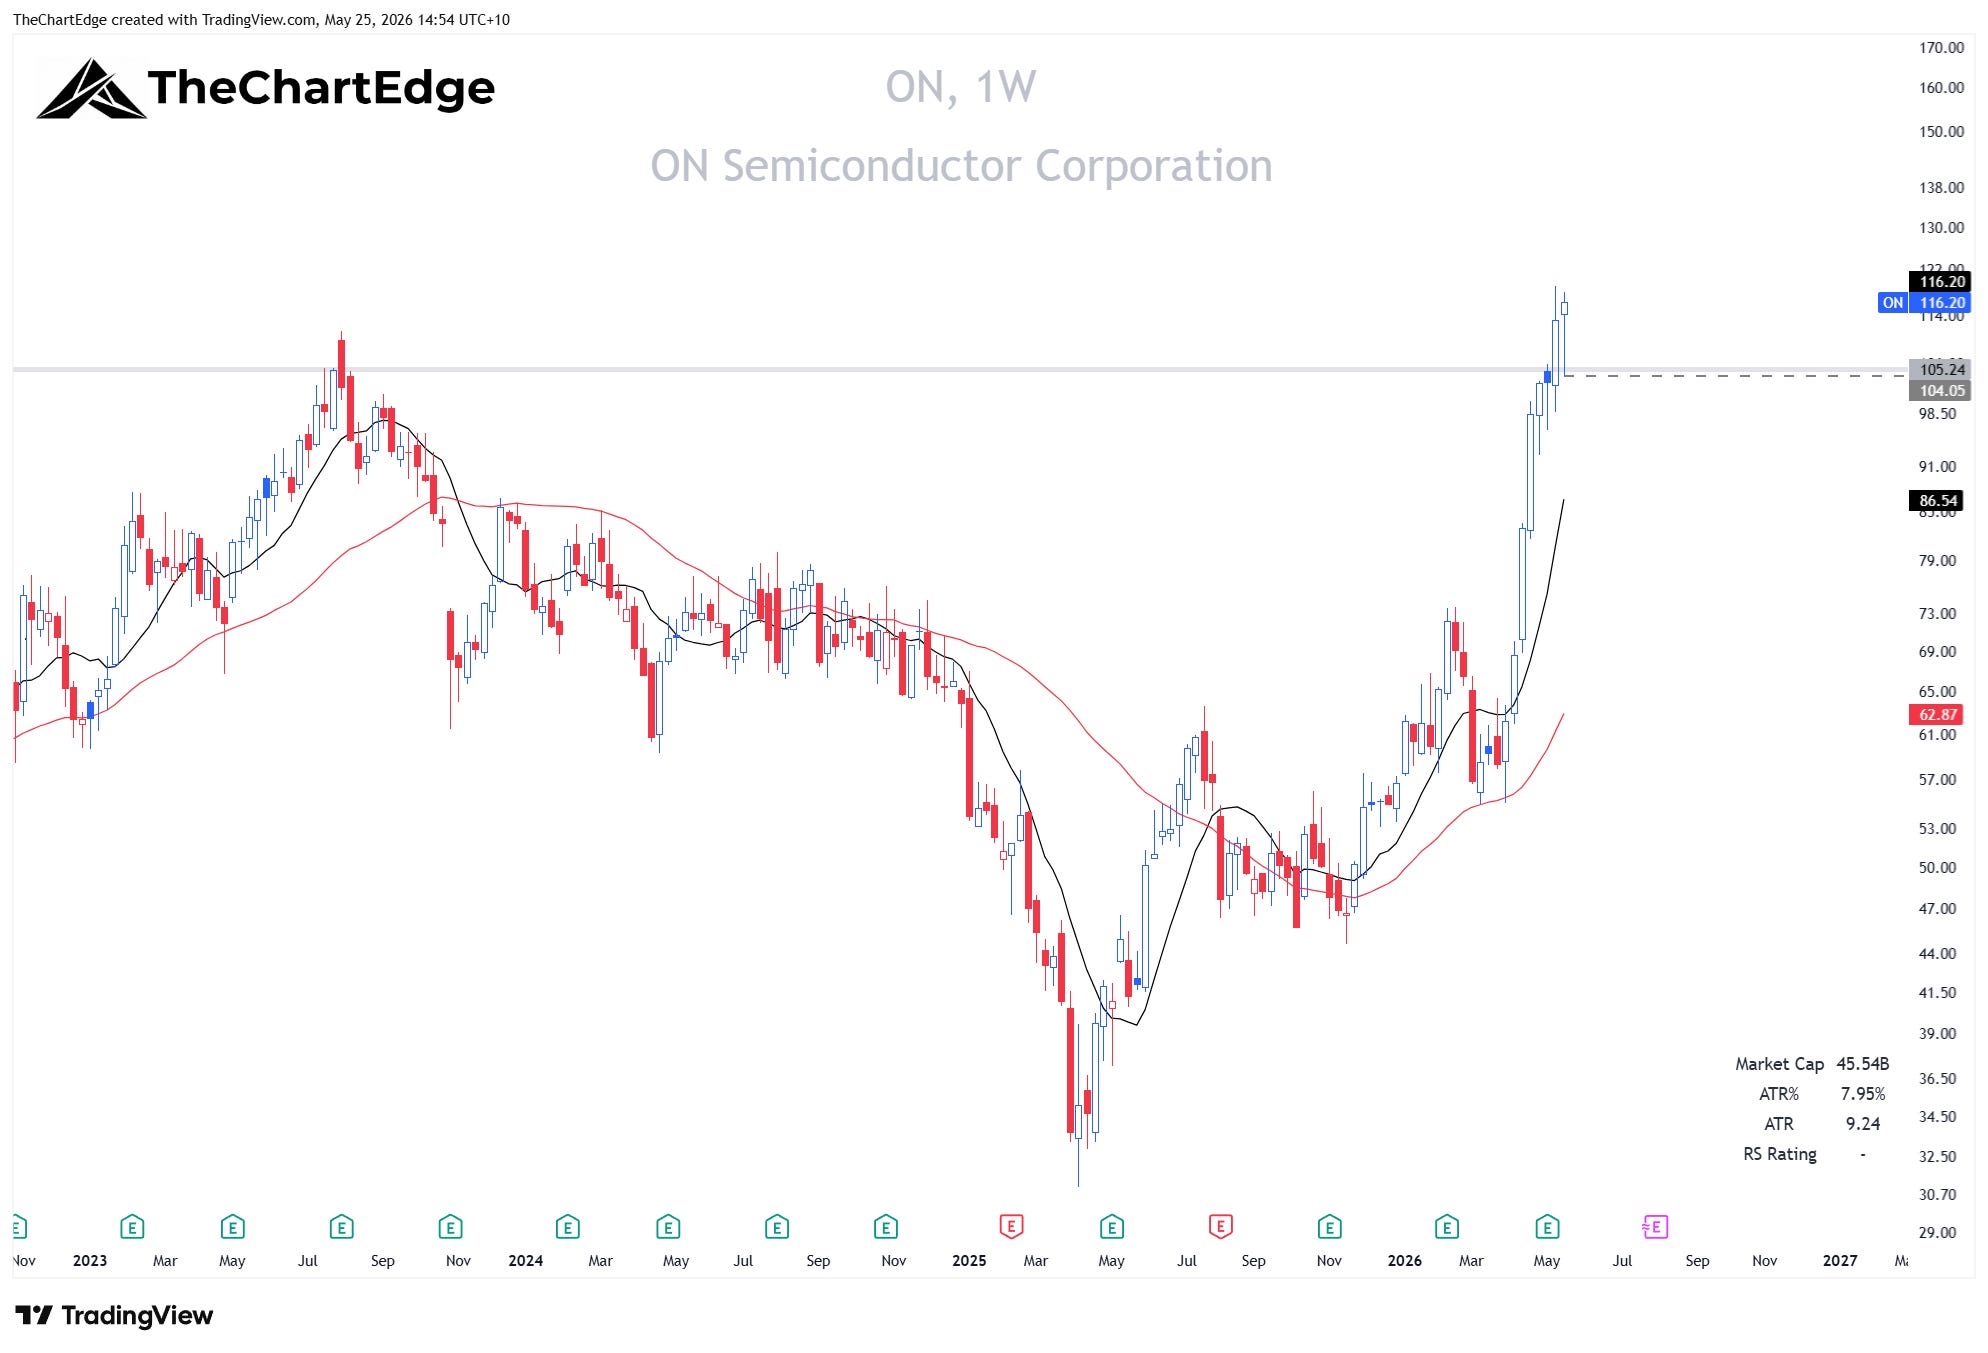
Above are both the daily and weekly charts for ON Semiconductor, so you can see the longer-term base breakout. It peaked in July 2023 on earnings, entered a massive decline of about 70% bottoming in April 2025, and has since staged an impressive recovery. These longer-term base breakouts can often be a little messy. Obviously not always - it might just rip from here. It already retested the breakout zone and bounced strongly last week. I might end up missing it, but that’s okay with me.
Buy limit order at $108.50 with a stop at $101.50.
Credo Technology ($CRDO) - High-speed connectivity for data centres. Up 26.9% last week. 17.9% above the 20-day SMA, 7.5% ATR, extension 2.4x ATR from 20-SMA. 0.2% from the all-time high. RSI 65. Beta of 3.8 - size accordingly.
CRDO Chart
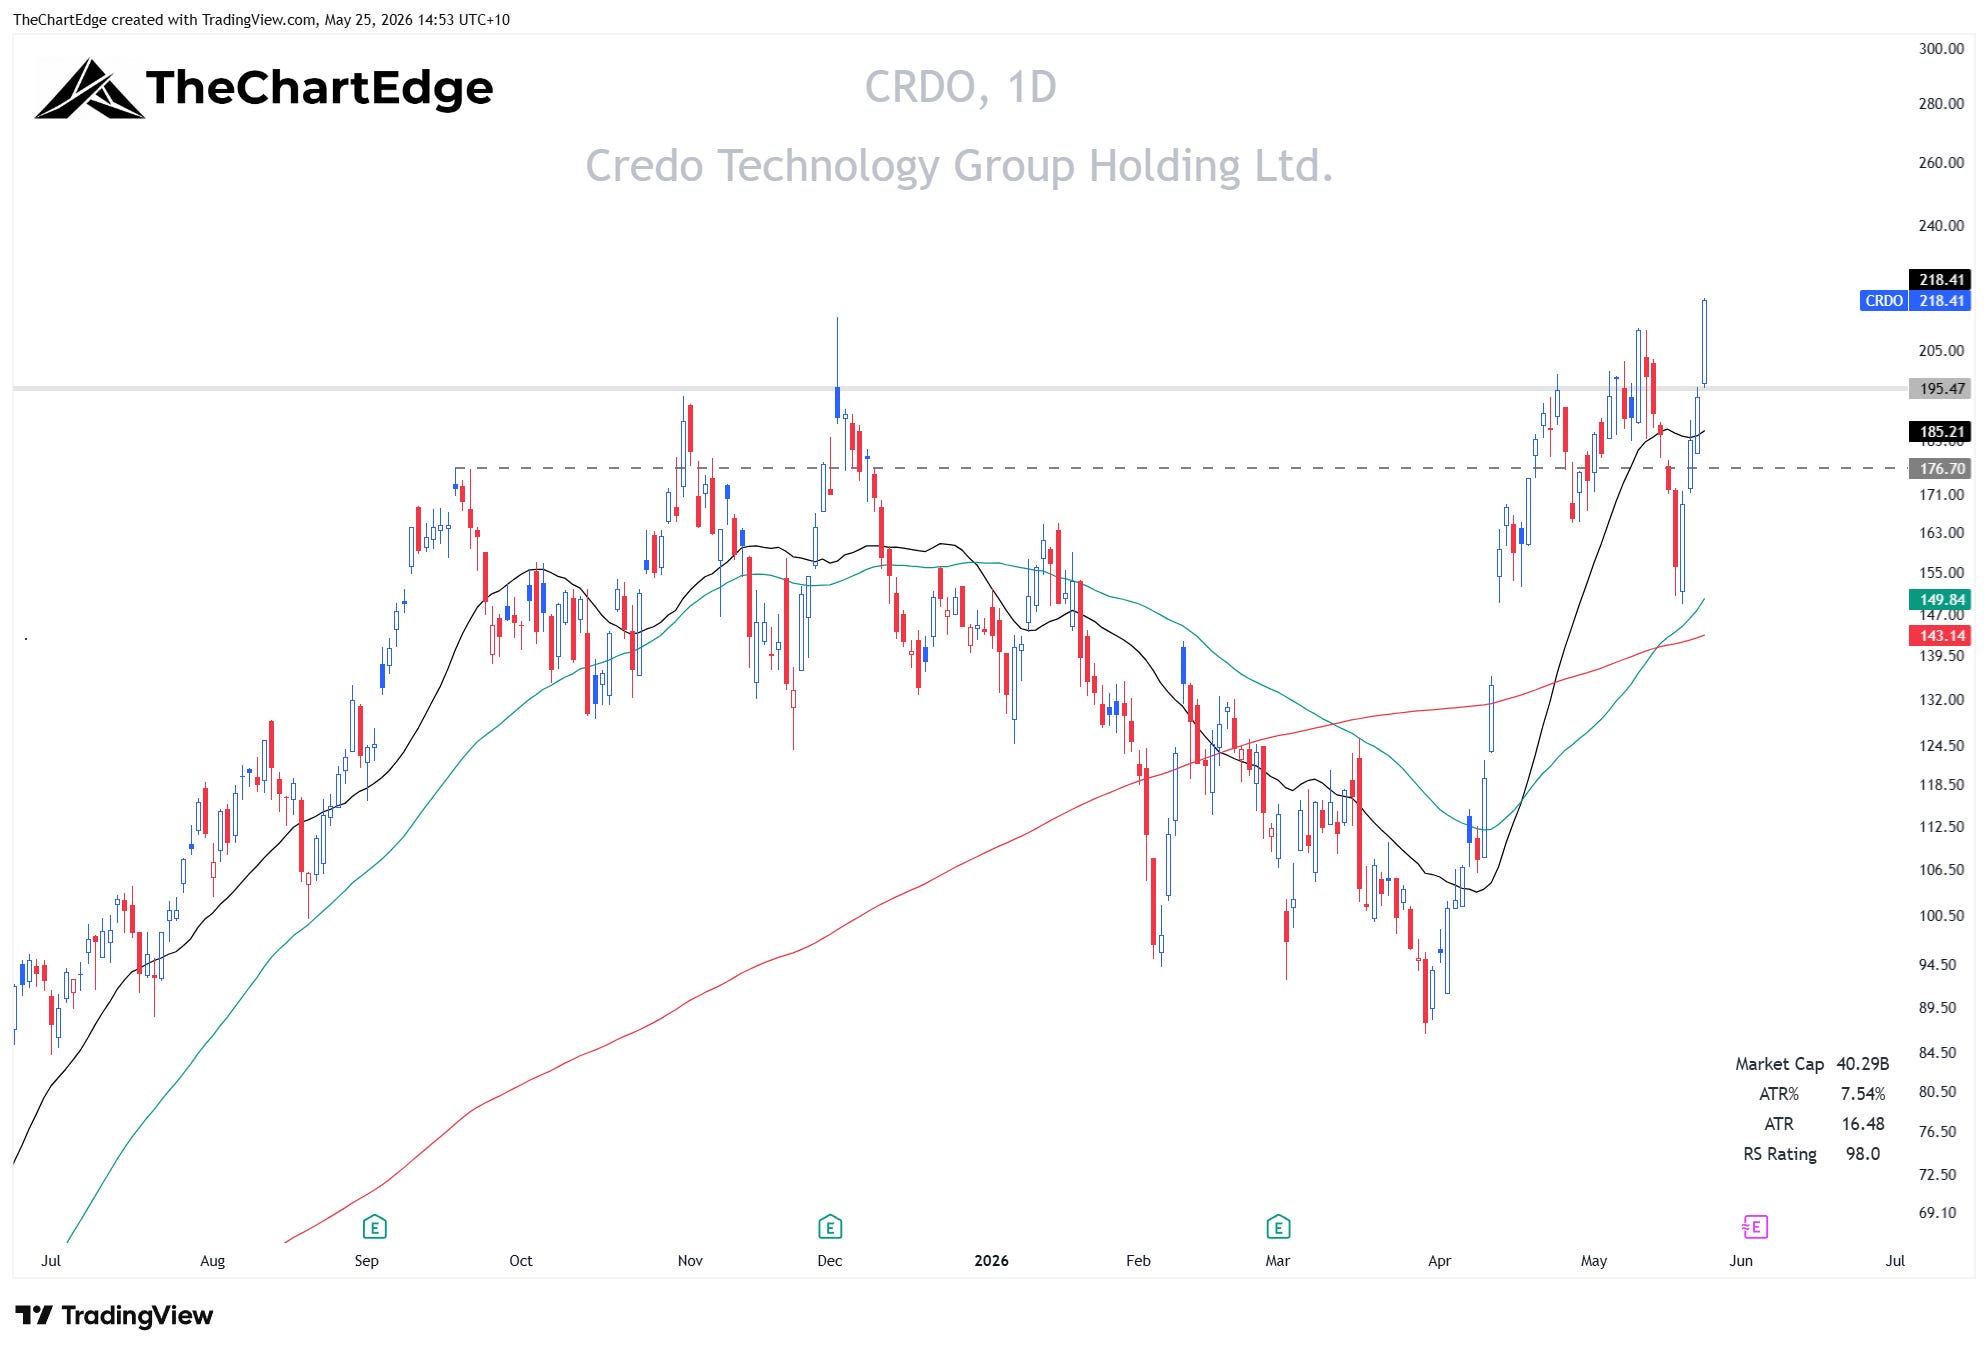
Credo is too wide and loose to enter here, but the strength is undeniable. It closed at all-time highs last Friday but needs to settle down and tighten up to offer a lower risk entry. Definitely on the watch list.
Networking & Infrastructure
Ciena Corporation ($CIEN) - Optical networking equipment. Up 5.3% last week. 6.7% above the 20-day SMA, 5.9% ATR, extension 1.1x ATR from 20-SMA. 2.6% from the 52-week high - but still 44.8% below its all-time high, which dates back to the dot-com era in 2000. RSI 61.
CIEN Chart
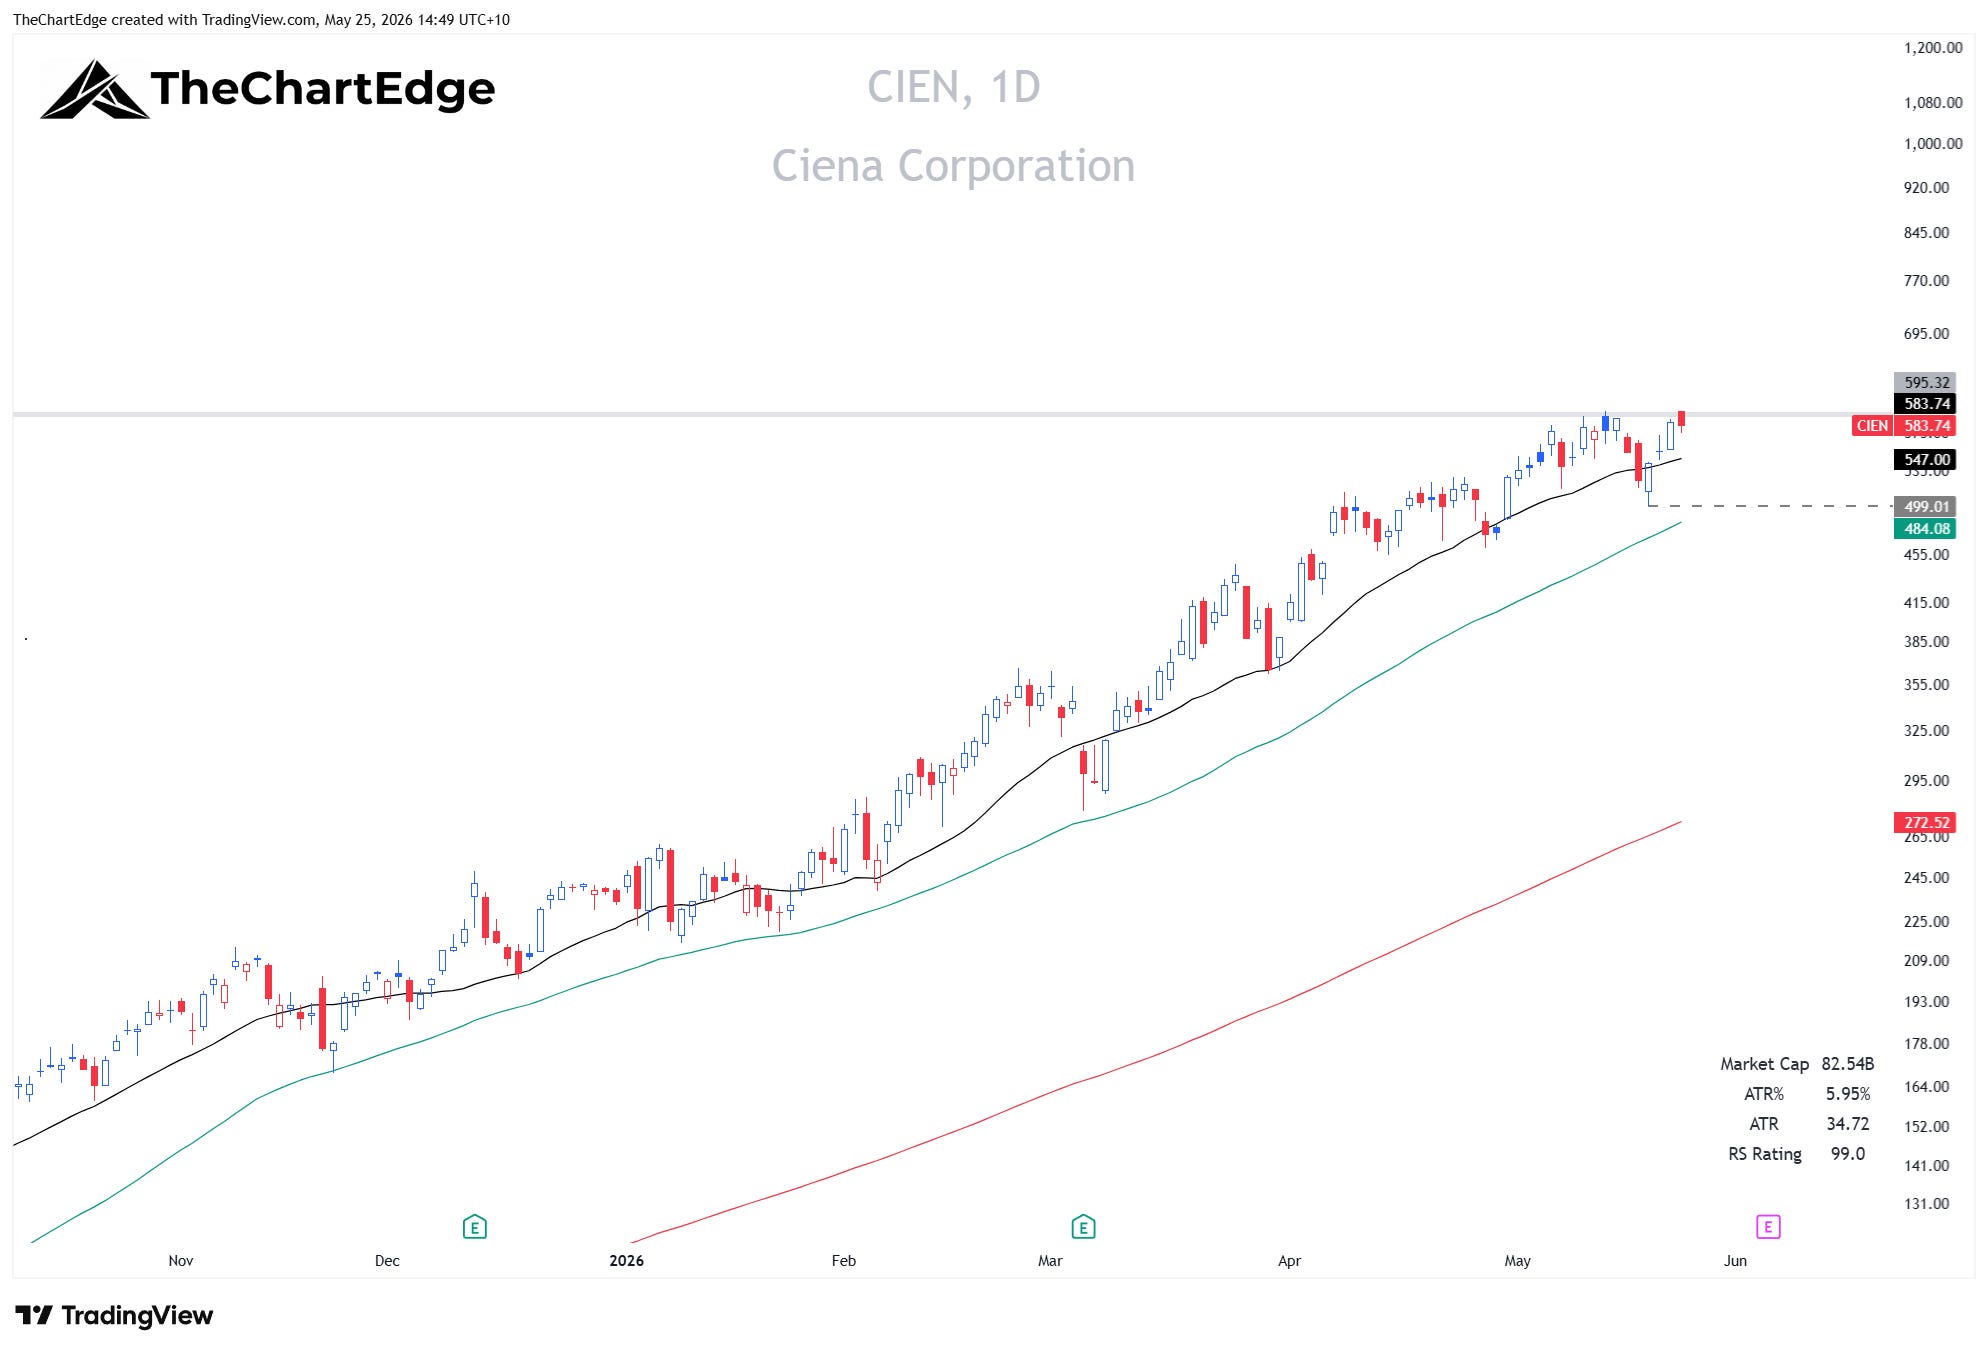
This is probably one of my favorite charts. The trend has been so clean, and it has respected the 50-day SMA on pullbacks going back around a year. I’m going to use a limit order here, looking for a bit of a pullback. Limit at $560, stop at $480 - which is below both the May 19 low and the 50-day moving average (currently at $484 but rising quickly). I will also risk 1% of my portfolio on this trade rather than the 0.5% on the others.
Applied Digital ($APLD) - AI/HPC data centre infrastructure. Up 7.8% last week. 14.5% above the 20-day SMA, 8.5% ATR, extension 1.7x ATR from 20-SMA. 5.6% from the 52-week high - but still 59.1% below its all-time high from 2003. RSI 61. Beta of 2.7 - so size accordingly.
APLD Chart
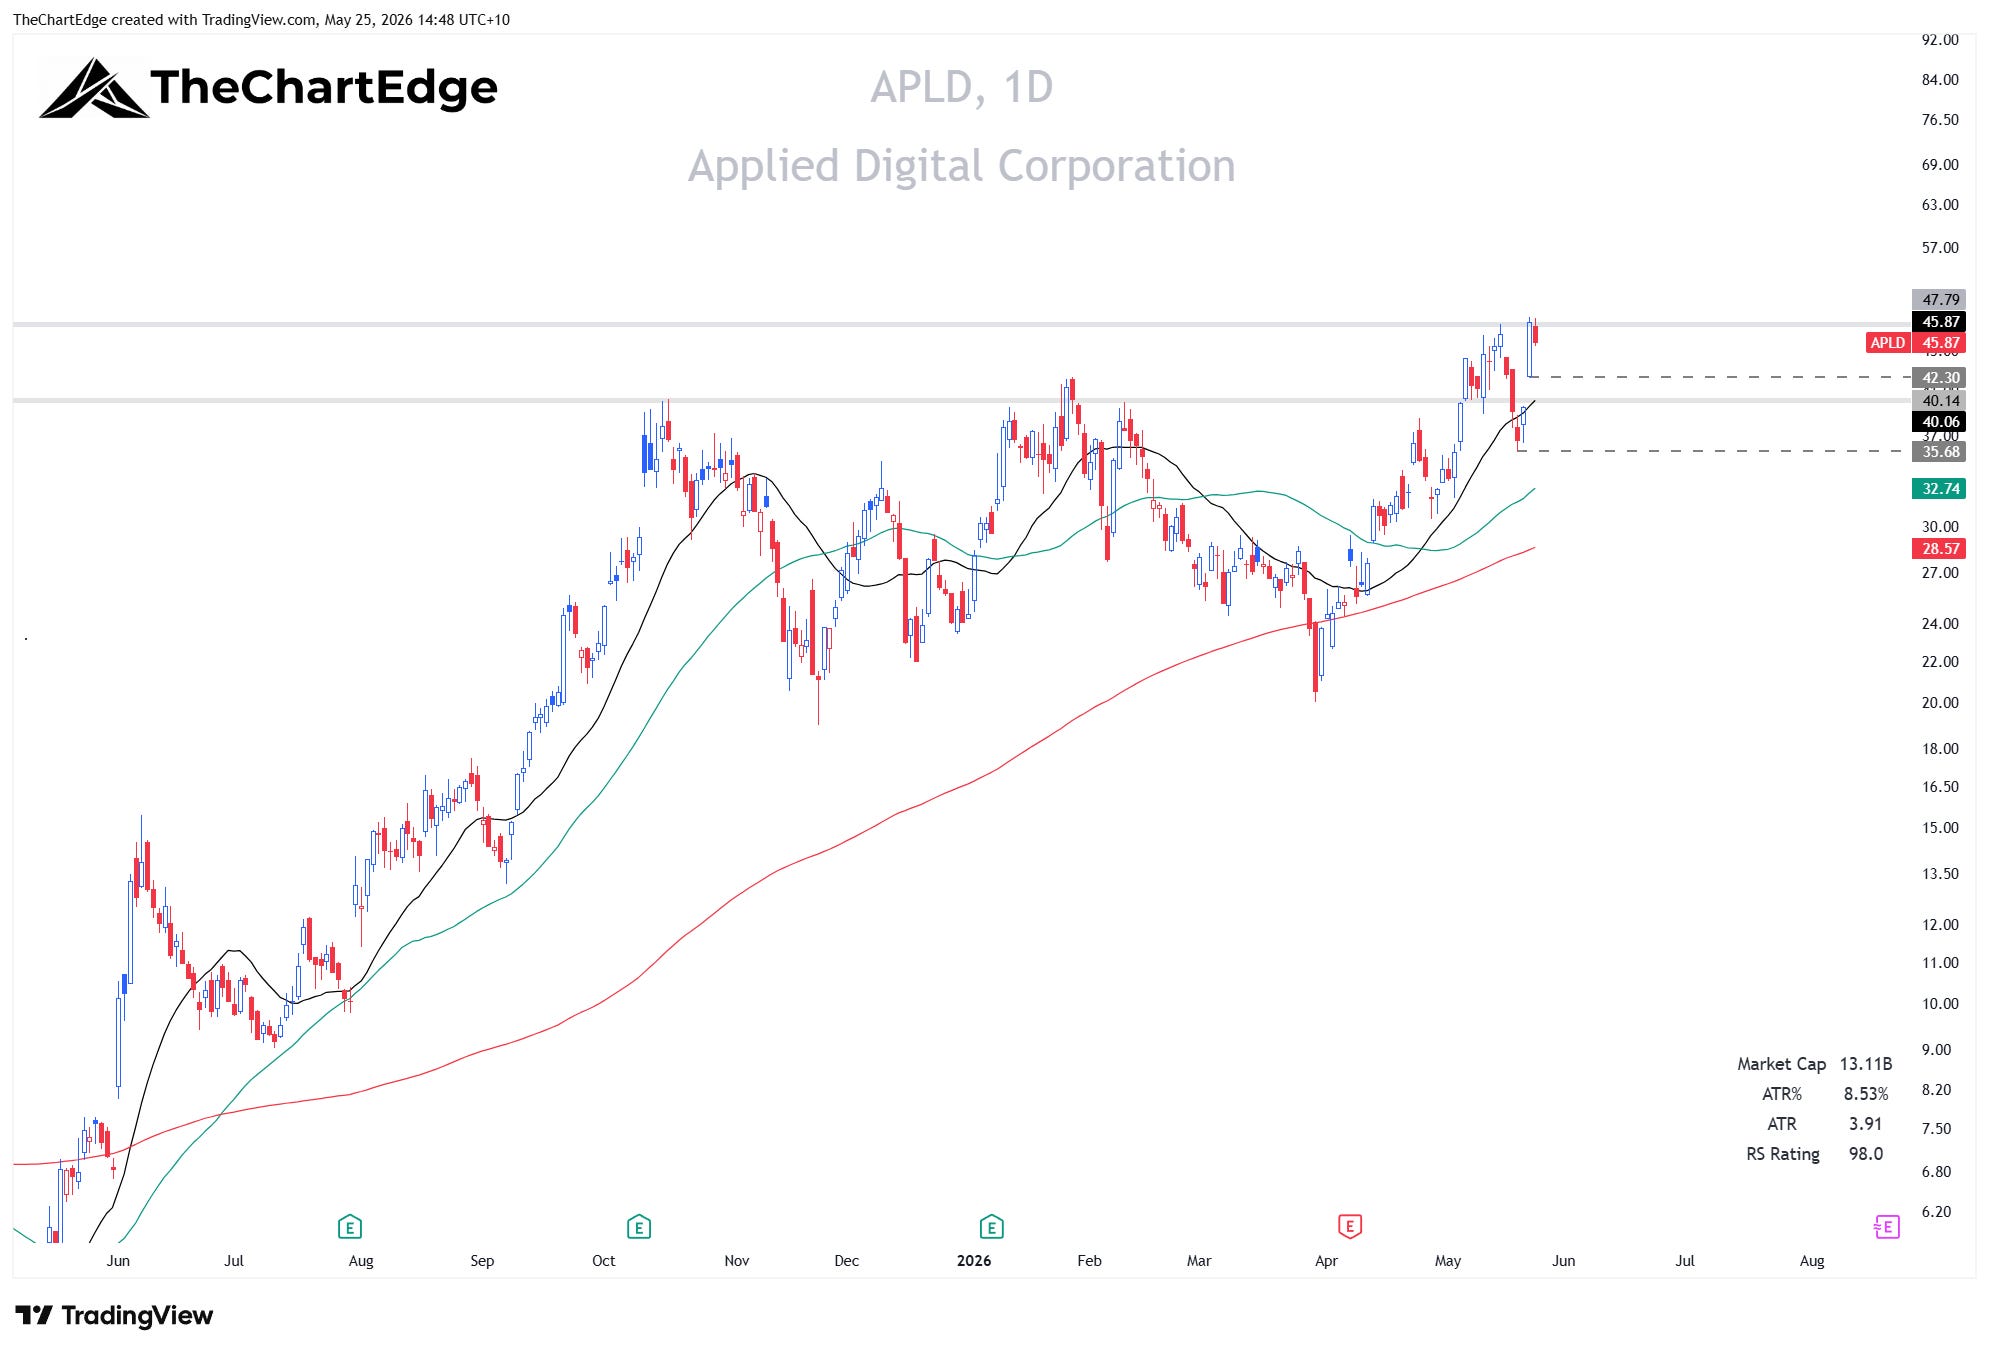
Applied Digital is pretty wild - 8.5% ATR. Limit order at $40.50, which is the convergence of the 20-day SMA and some previous resistance and support. Stop loss under the May 19 low at $34.50, just to give it a little breathing room.
Crypto / Digital Assets
Hut 8 Corp ($HUT) - Bitcoin mining and data centre operations. Up 3.4% last week. 13.5% above the 20-day SMA, 7.7% ATR, extension 1.8x ATR from 20-SMA. 5.7% from the all-time high. RSI 65. Beta of 3.8 - size accordingly.
HUT Chart
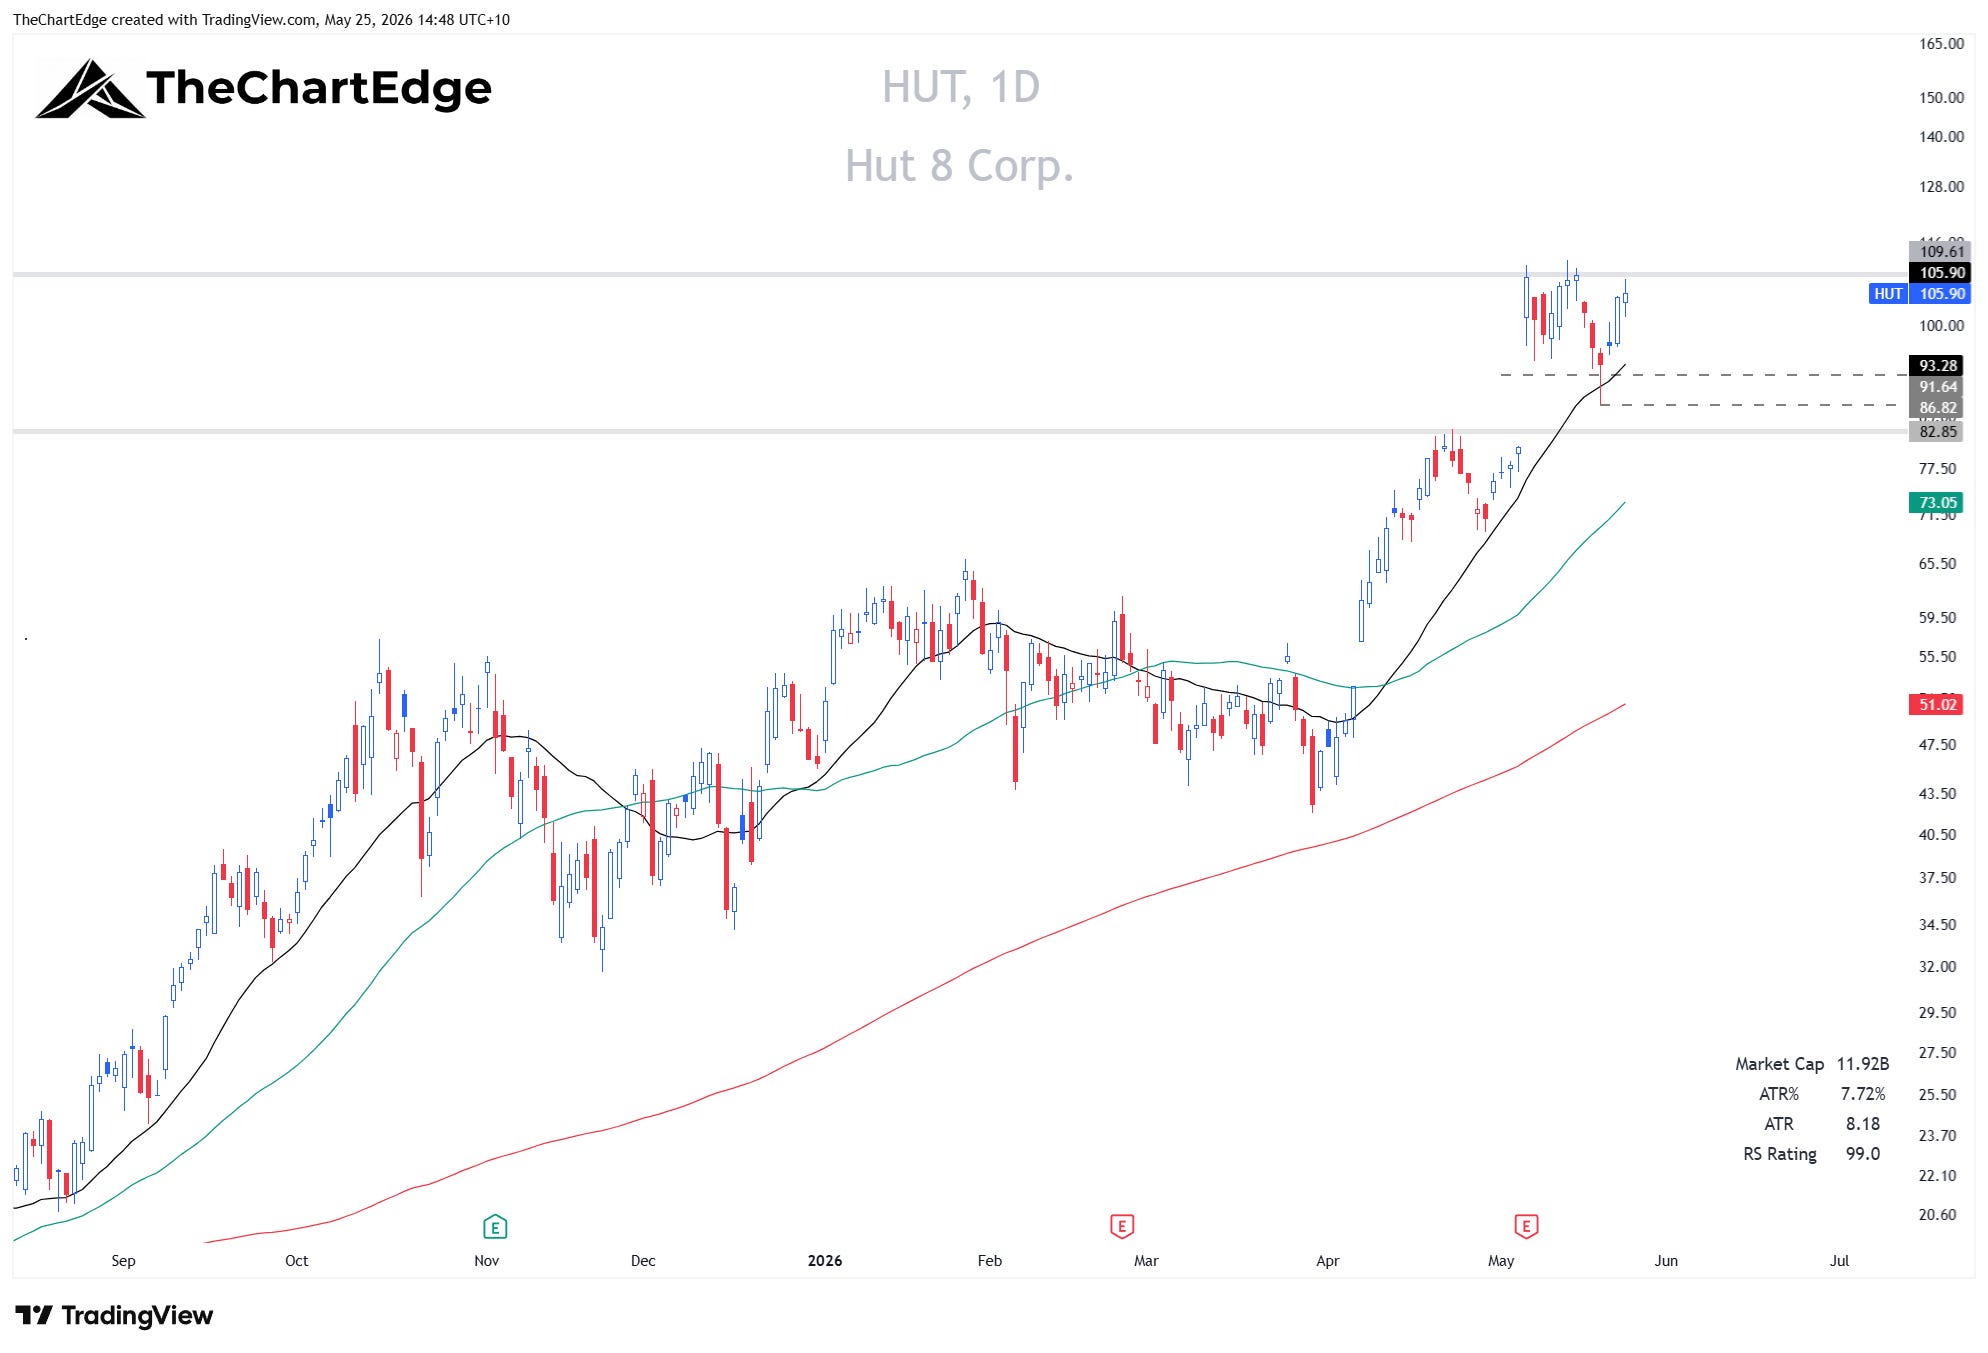
I’m taking the opposite strategy with HUT and buying strength. Buy stop order at $113.50 with a tight stop - it should either work or not, and quickly. Friday’s low was $101, so my stop goes at $98.50.
I find writing out a full public plan forces you to think very deeply about each trade - this is as much for me as it is for anyone reading. But I hope you gain some knowledge and insights along the way. I'll try to share updates and make this a regular Sunday night or Monday morning (US time) post.
Wishing everyone a great week ahead!
Cheers,
Marcus Grant, CFTe
Disclaimer: The content provided in this newsletter is for informational and educational purposes only and should not be considered as financial, investment, or legal advice. The information shared is based on our research and analysis, but we are not a licensed financial advisor, nor can we guarantee its accuracy, completeness, or timeliness. Market conditions and financial instruments can change rapidly, and any opinions expressed may not be suitable for all investors. Any opinions expressed and or securities mentioned do not constitute a recommendation to buy, sell, or hold that or any other security. You should conduct your own due diligence and consult with a licensed financial advisor or other professional before making any investment decisions. Past performance is not indicative of future results, and all investments carry the risk of loss. The authors and publishers of this newsletter are not responsible for any financial decisions made based on the content provided herein. By reading and or subscribing to this newsletter, you acknowledge and agree that you are using the information at your own risk.