

Introducing the ASX 300 Relative Strength Framework
Finding relative strength in a smaller, more concentrated market

I run a relative strength framework on US equities - 121 ETFs benchmarked against the S&P 500, drilling down into individual stocks by benchmarking them against their ETF. I then eyeball the charts for the best-looking setups. It works well because the US market has a deep ecosystem of sector and thematic ETFs to work with and thousands of liquid stocks. You can benchmark technology and all its sub-sectors against the broad market, then drill into semiconductors, then into individual chip names. Two layers, two benchmarks, each revealing something different.
Australia doesn’t have that luxury.
The ASX is a much smaller and concentrated market. Banks, resources, and a handful of healthcare and property names make up the bulk of the index. The thematic ETF ecosystem that makes the US framework possible simply doesn’t exist here. You can’t run a two-layer analysis when there’s no first layer to build on.
So, I had to think about it differently.
The ASX 300 Relative Strength Framework takes 301 stocks (VAS holds 304 stocks as at 31 March 2026, but three are suspended from trading) in the Vanguard Australian Shares ETF (VAS), which tracks the S&P/ASX 300 Index and benchmarks each one directly against VAS itself. Instead of ETF groups, I built 33 curated categories - Gold, Critical Minerals, Oil Gas & Coal, Banks, Software, and so on - that group the universe in a way that makes relative strength comparisons meaningful across the ASX 300. Each stock gets an RS-Trend score (how much is it outperforming or underperforming VAS over time?) and an RS-Momentum score (is that outperformance accelerating or decelerating?). Those two dimensions place every stock into one of four quadrants - Leading, Weakening, Lagging, or Improving - exactly like the US framework. Every stock also gets a Trend State rating depending on the current price relative to its Simple Moving Averages (SMAs).
The methodology underneath is the same. The structure around it is different because the market demanded it.
How weak is the Australian market right now?
Across all 301 stocks in VAS, less than half (48.5%) are above their 20-day moving average. Only a third (33.7%) are above their 200-day. Just 19.7% sit in the Leading quadrant.
At the category level, the leadership is narrow. Only seven of the 33 categories have more than 40% of their stocks in the Leading quadrant - and most of them are resource or energy related. Utilities & Energy Infrastructure leads at 80%, followed by Oil Gas & Coal (67%), Critical Minerals (50%), and Mining & Industrial Services (50%). On the other side, 10 categories have zero stocks in Leading, including Software, Discretionary Retail, Property, and Medtech. The strength in this market is concentrated and thematic.
The first scan
After applying the RS framework, I then run a bottom-up scan for the strongest names.
For the first live run (week ending May 1, 2026), I ran a scan across all 301 stocks looking for names in either the Strong Uptrend or Uptrend state, not overly extended, and trading near their 52-week highs. The parameters are the same ones I use for US stocks - trend states, extension from the 20-day SMA within about three days of normal price movement (measured in ATRs, so it adjusts for each stock’s volatility), and within 10% of the 52-week high.
29 stocks passed the initial scan and there were 10 near misses on the criteria. I then went through all the charts and picked the 15 names that I believe have the cleanest, strongest trends and have the potential to offer low-risk entries over the coming week(s).
Critical Minerals
The standout category. Four of the 15 names come from here, and the broader category has 50% of its stocks in the Leading quadrant.
PLS Chart
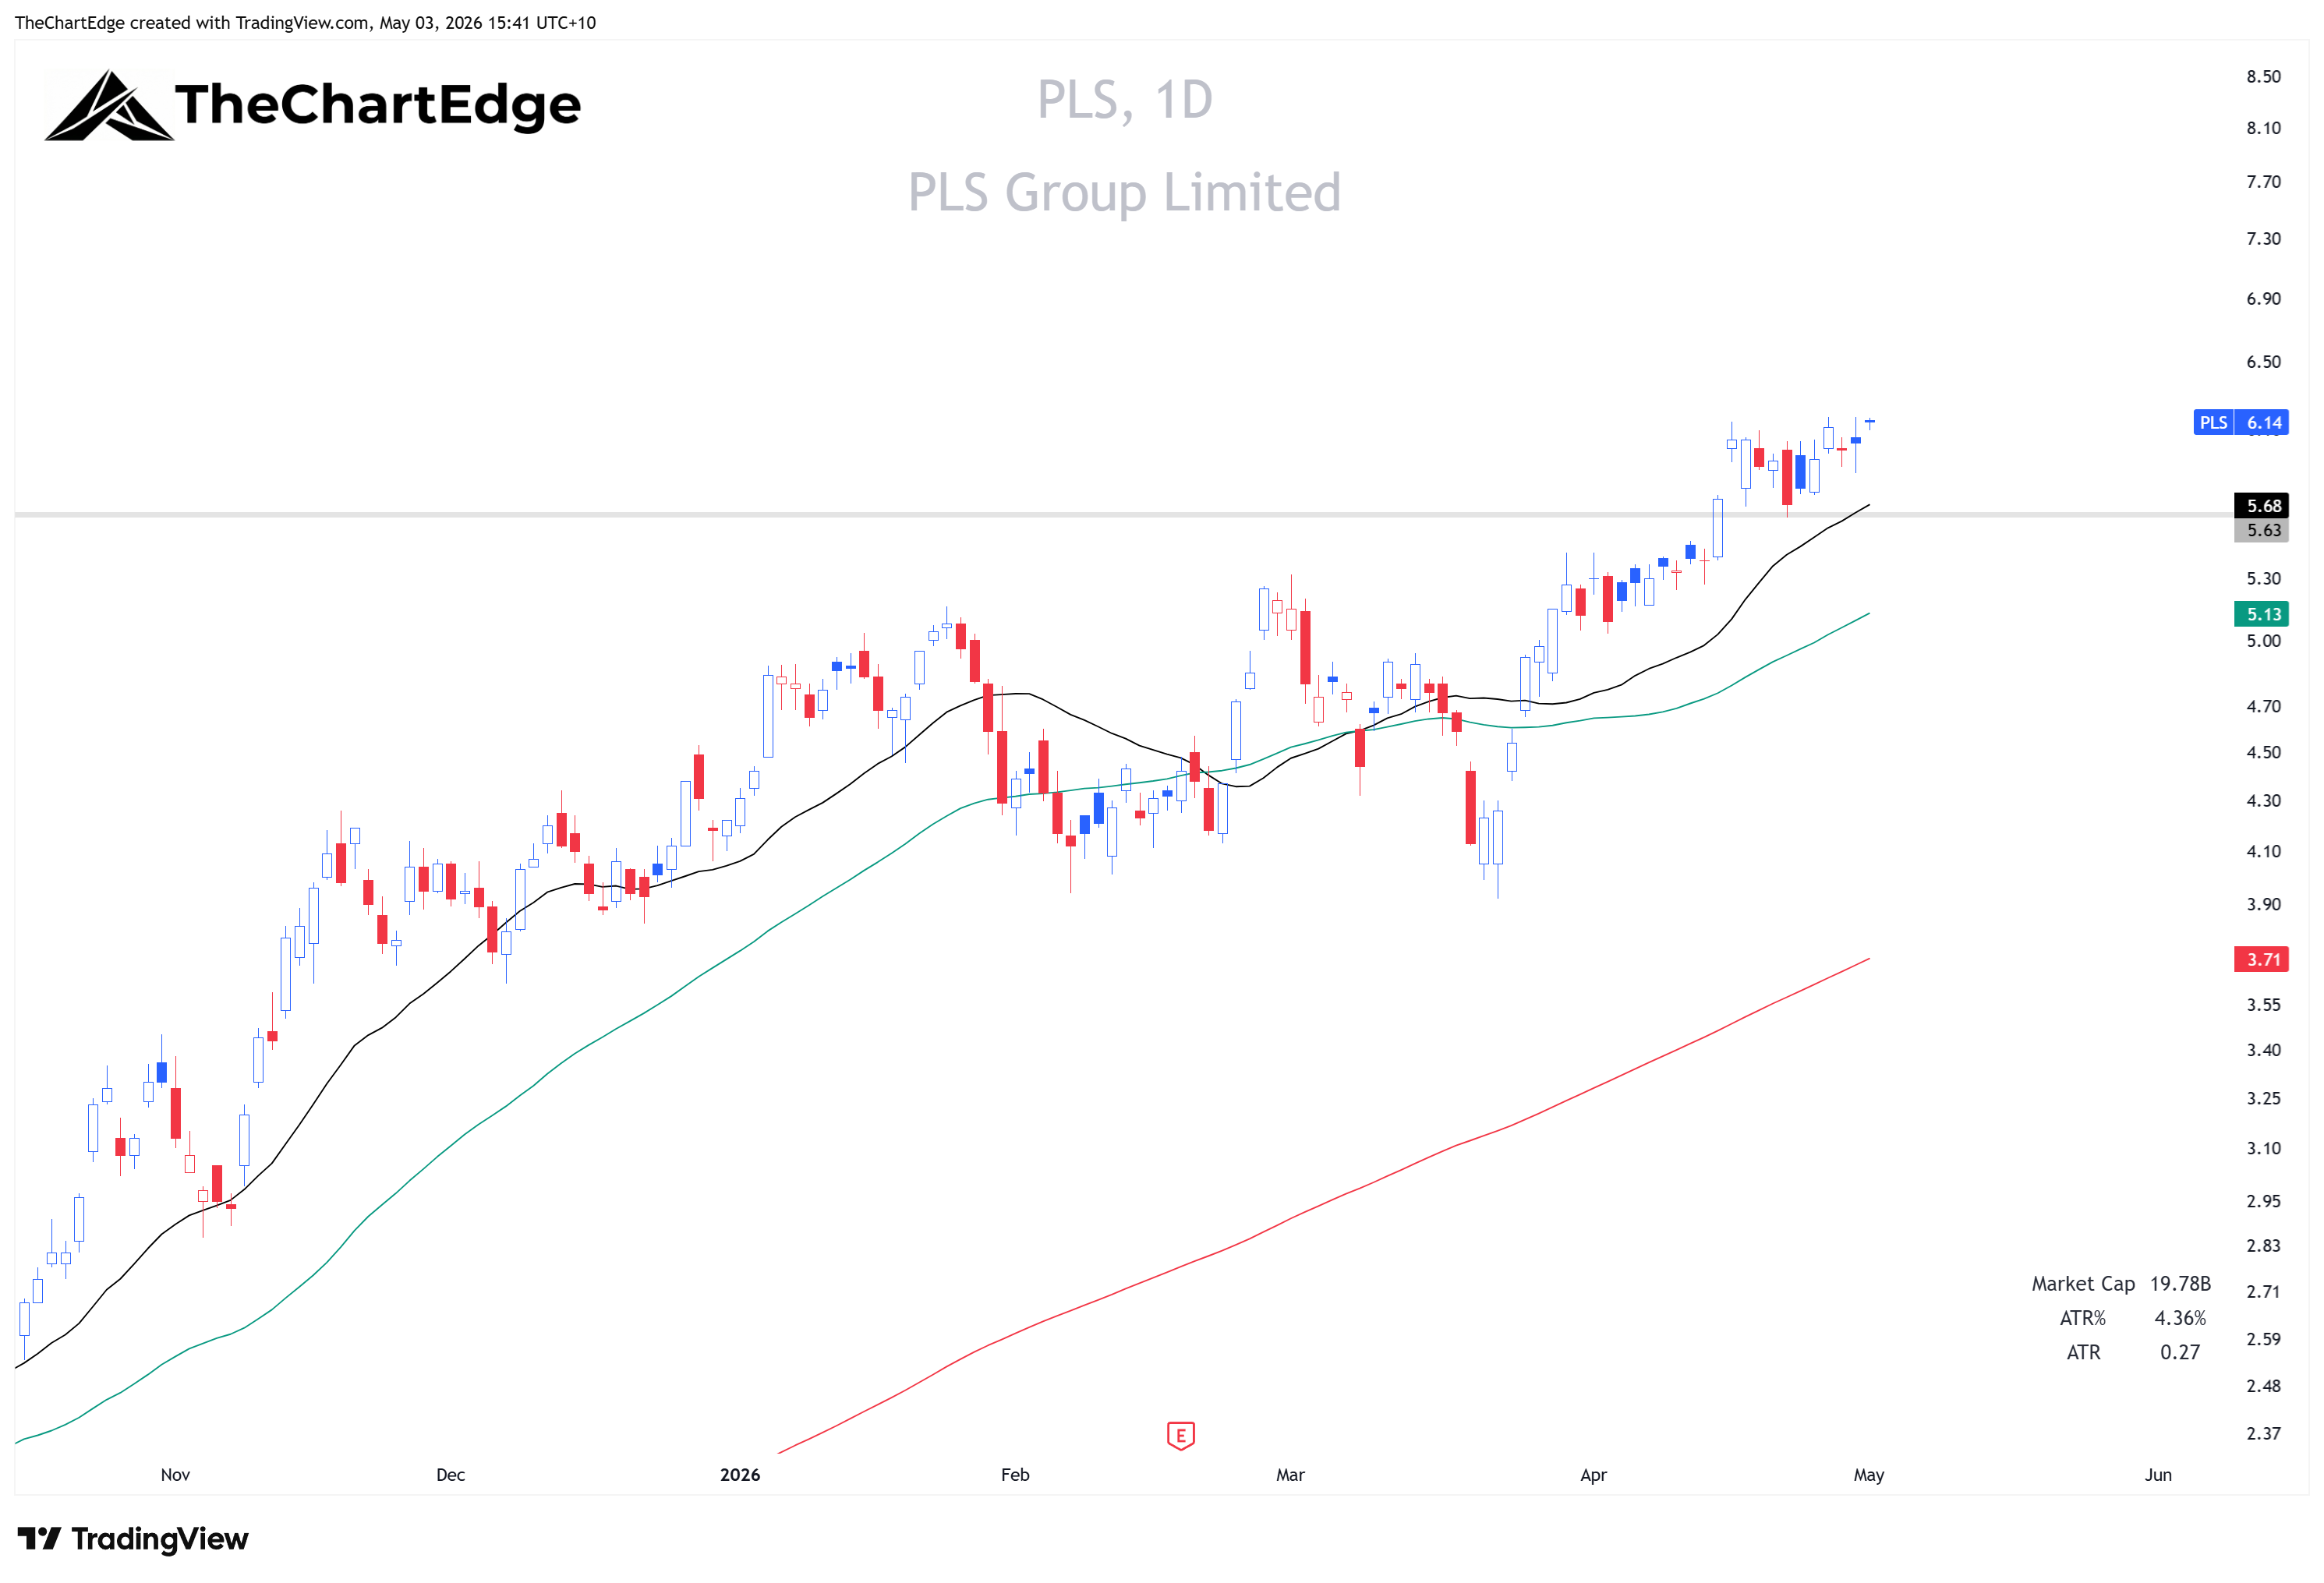
(Note: In all daily charts the black line is the 20-day SMA, the green is the 50-day SMA, and the red is the 200-day SMA.)
PLS Group Ltd (PLS) - Lithium producer (spodumene concentrate). Critical Minerals, Leading, Strong Uptrend. Up 6.4% last week (week ending May 1). Currently 8.1% above the 20-day SMA with a daily ATR of 4.4%, giving an extension of 1.8 days of normal range. 0.5% from the 52-week high (-0.5% ATH). RSI 67.
Consolidating at all-time highs, with blue skies above.
SRL Chart
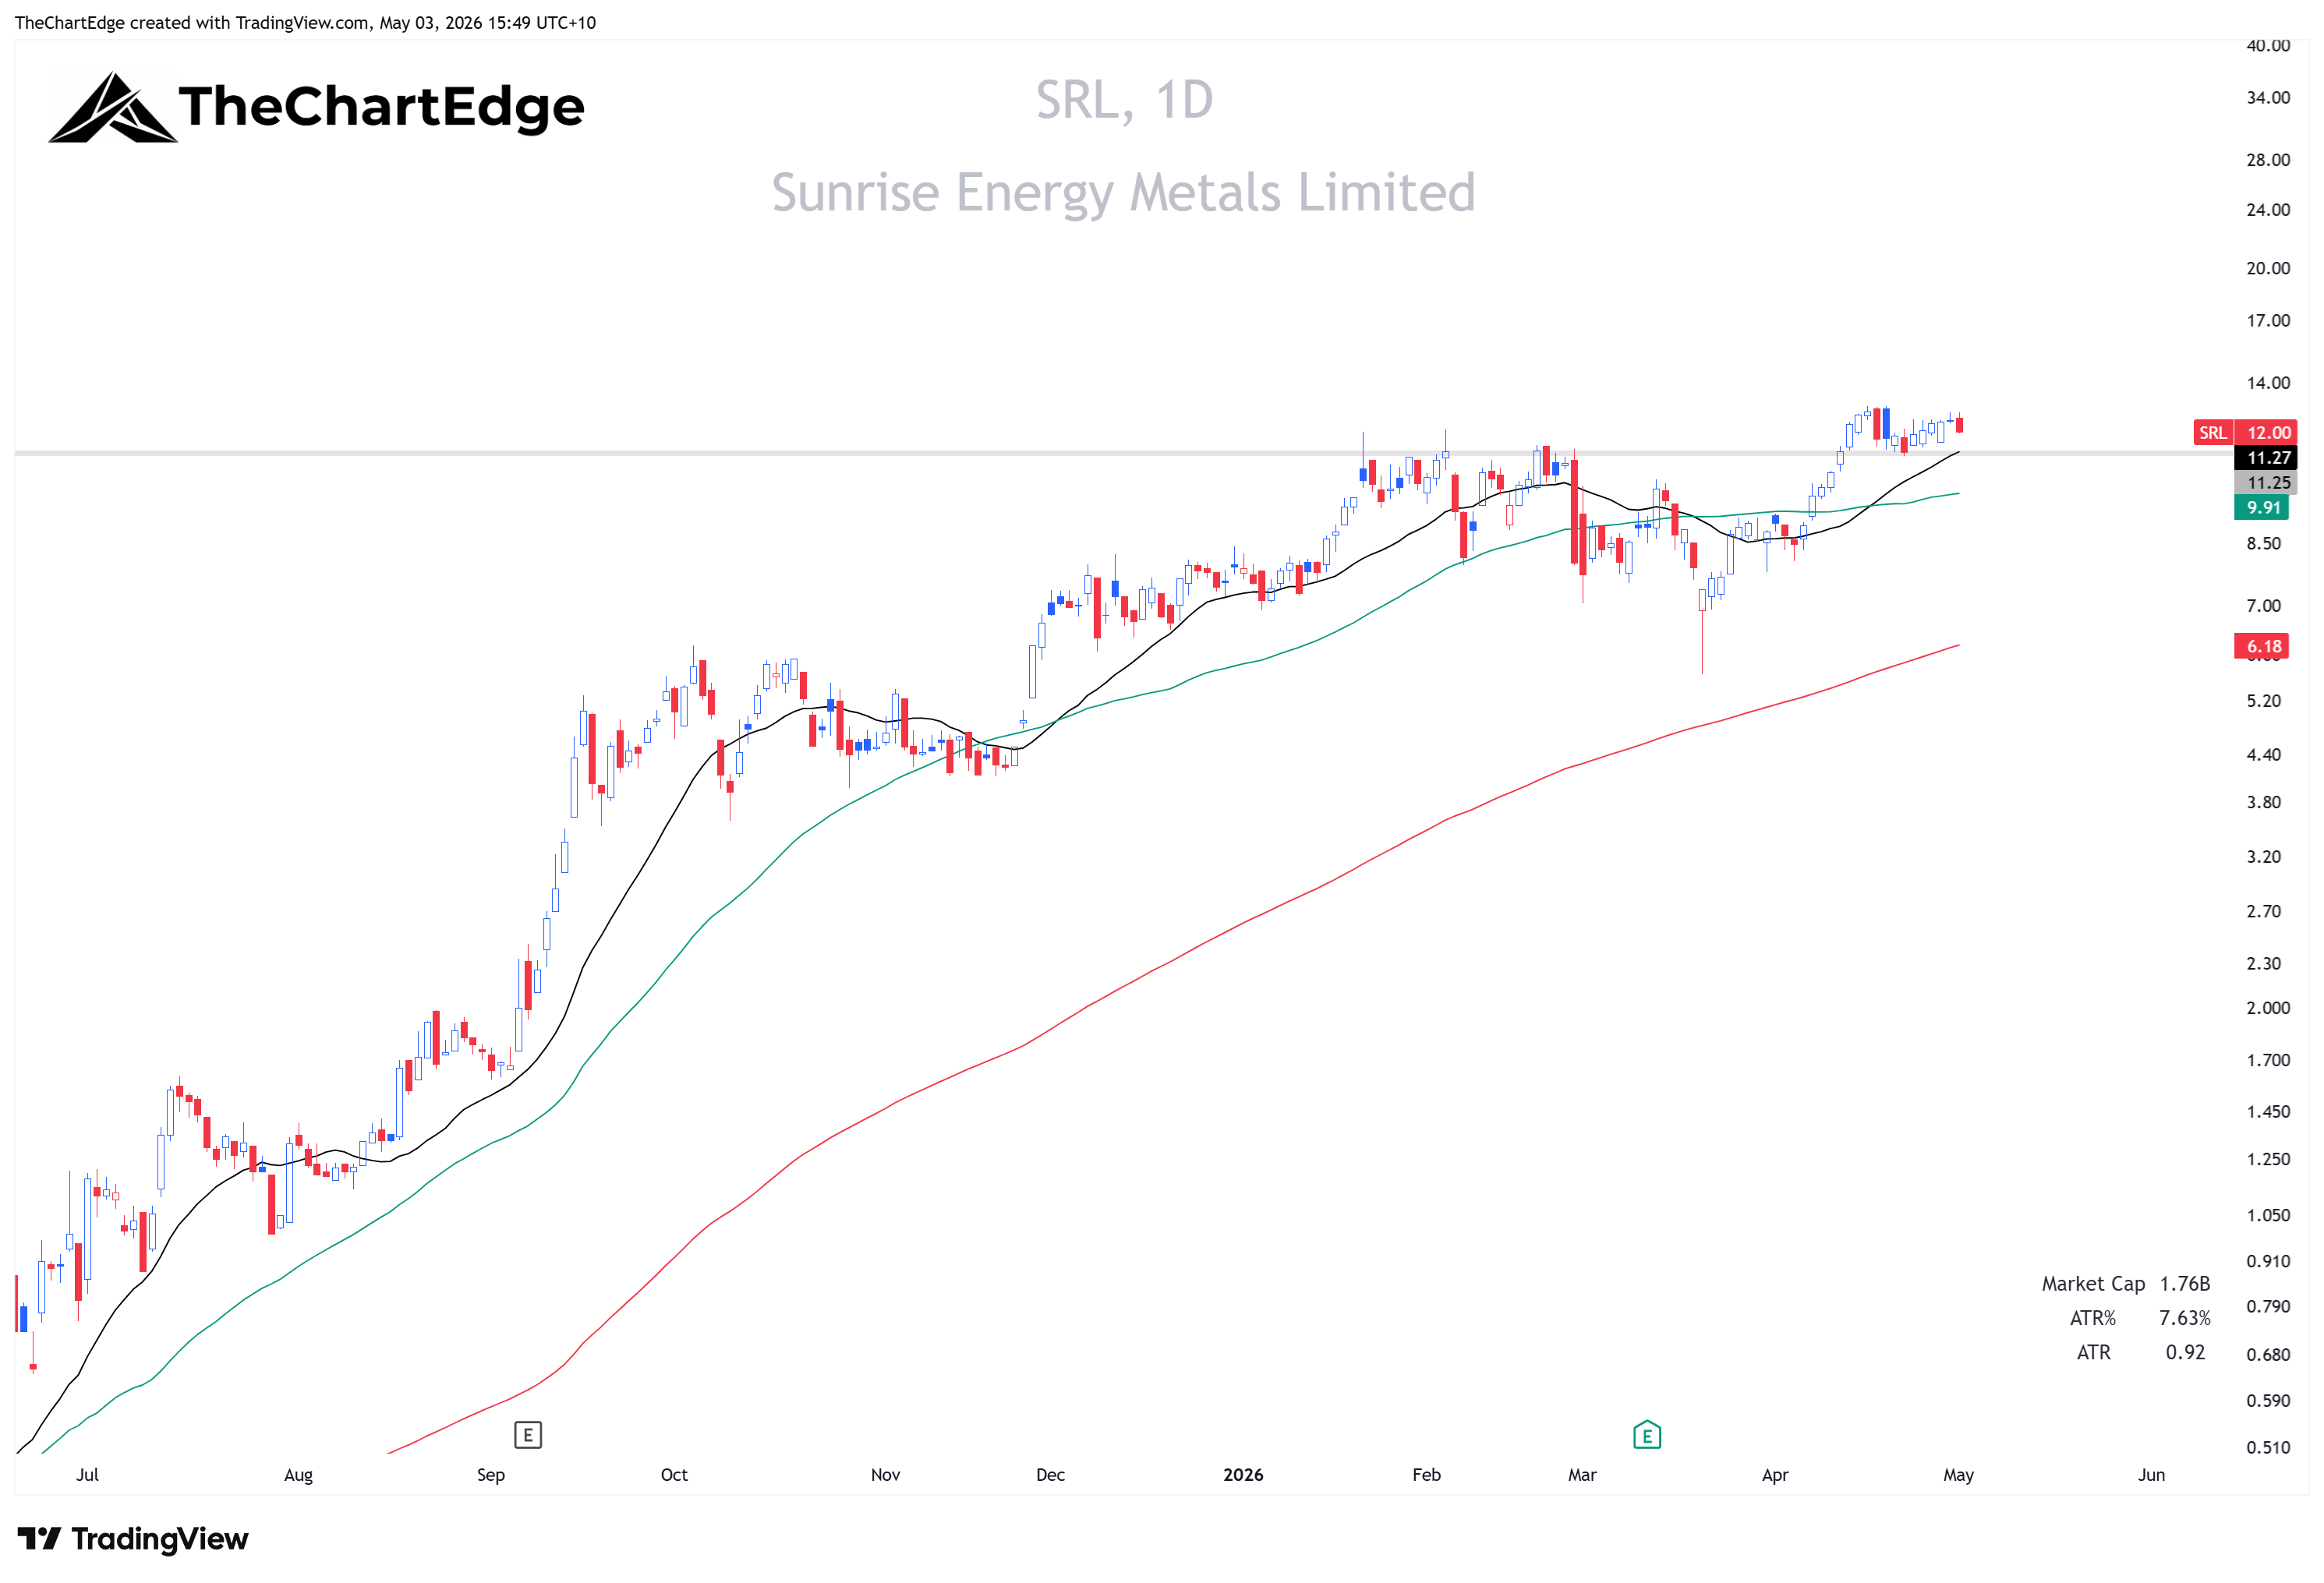
Sunrise Energy Metals Ltd (SRL) - Nickel, cobalt, scandium, and battery materials. Critical Minerals, Weakening, Strong Uptrend. Up 0.8% last week. 6.5% above the 20-day SMA, 7.6% ATR, extension 0.8x. 7.8% from the 52-week high (-32.6% ATH). RSI 60.
Consolidating nicely, first target could be around $16, just shy of the late 2017 all-time highs.
LTR Chart
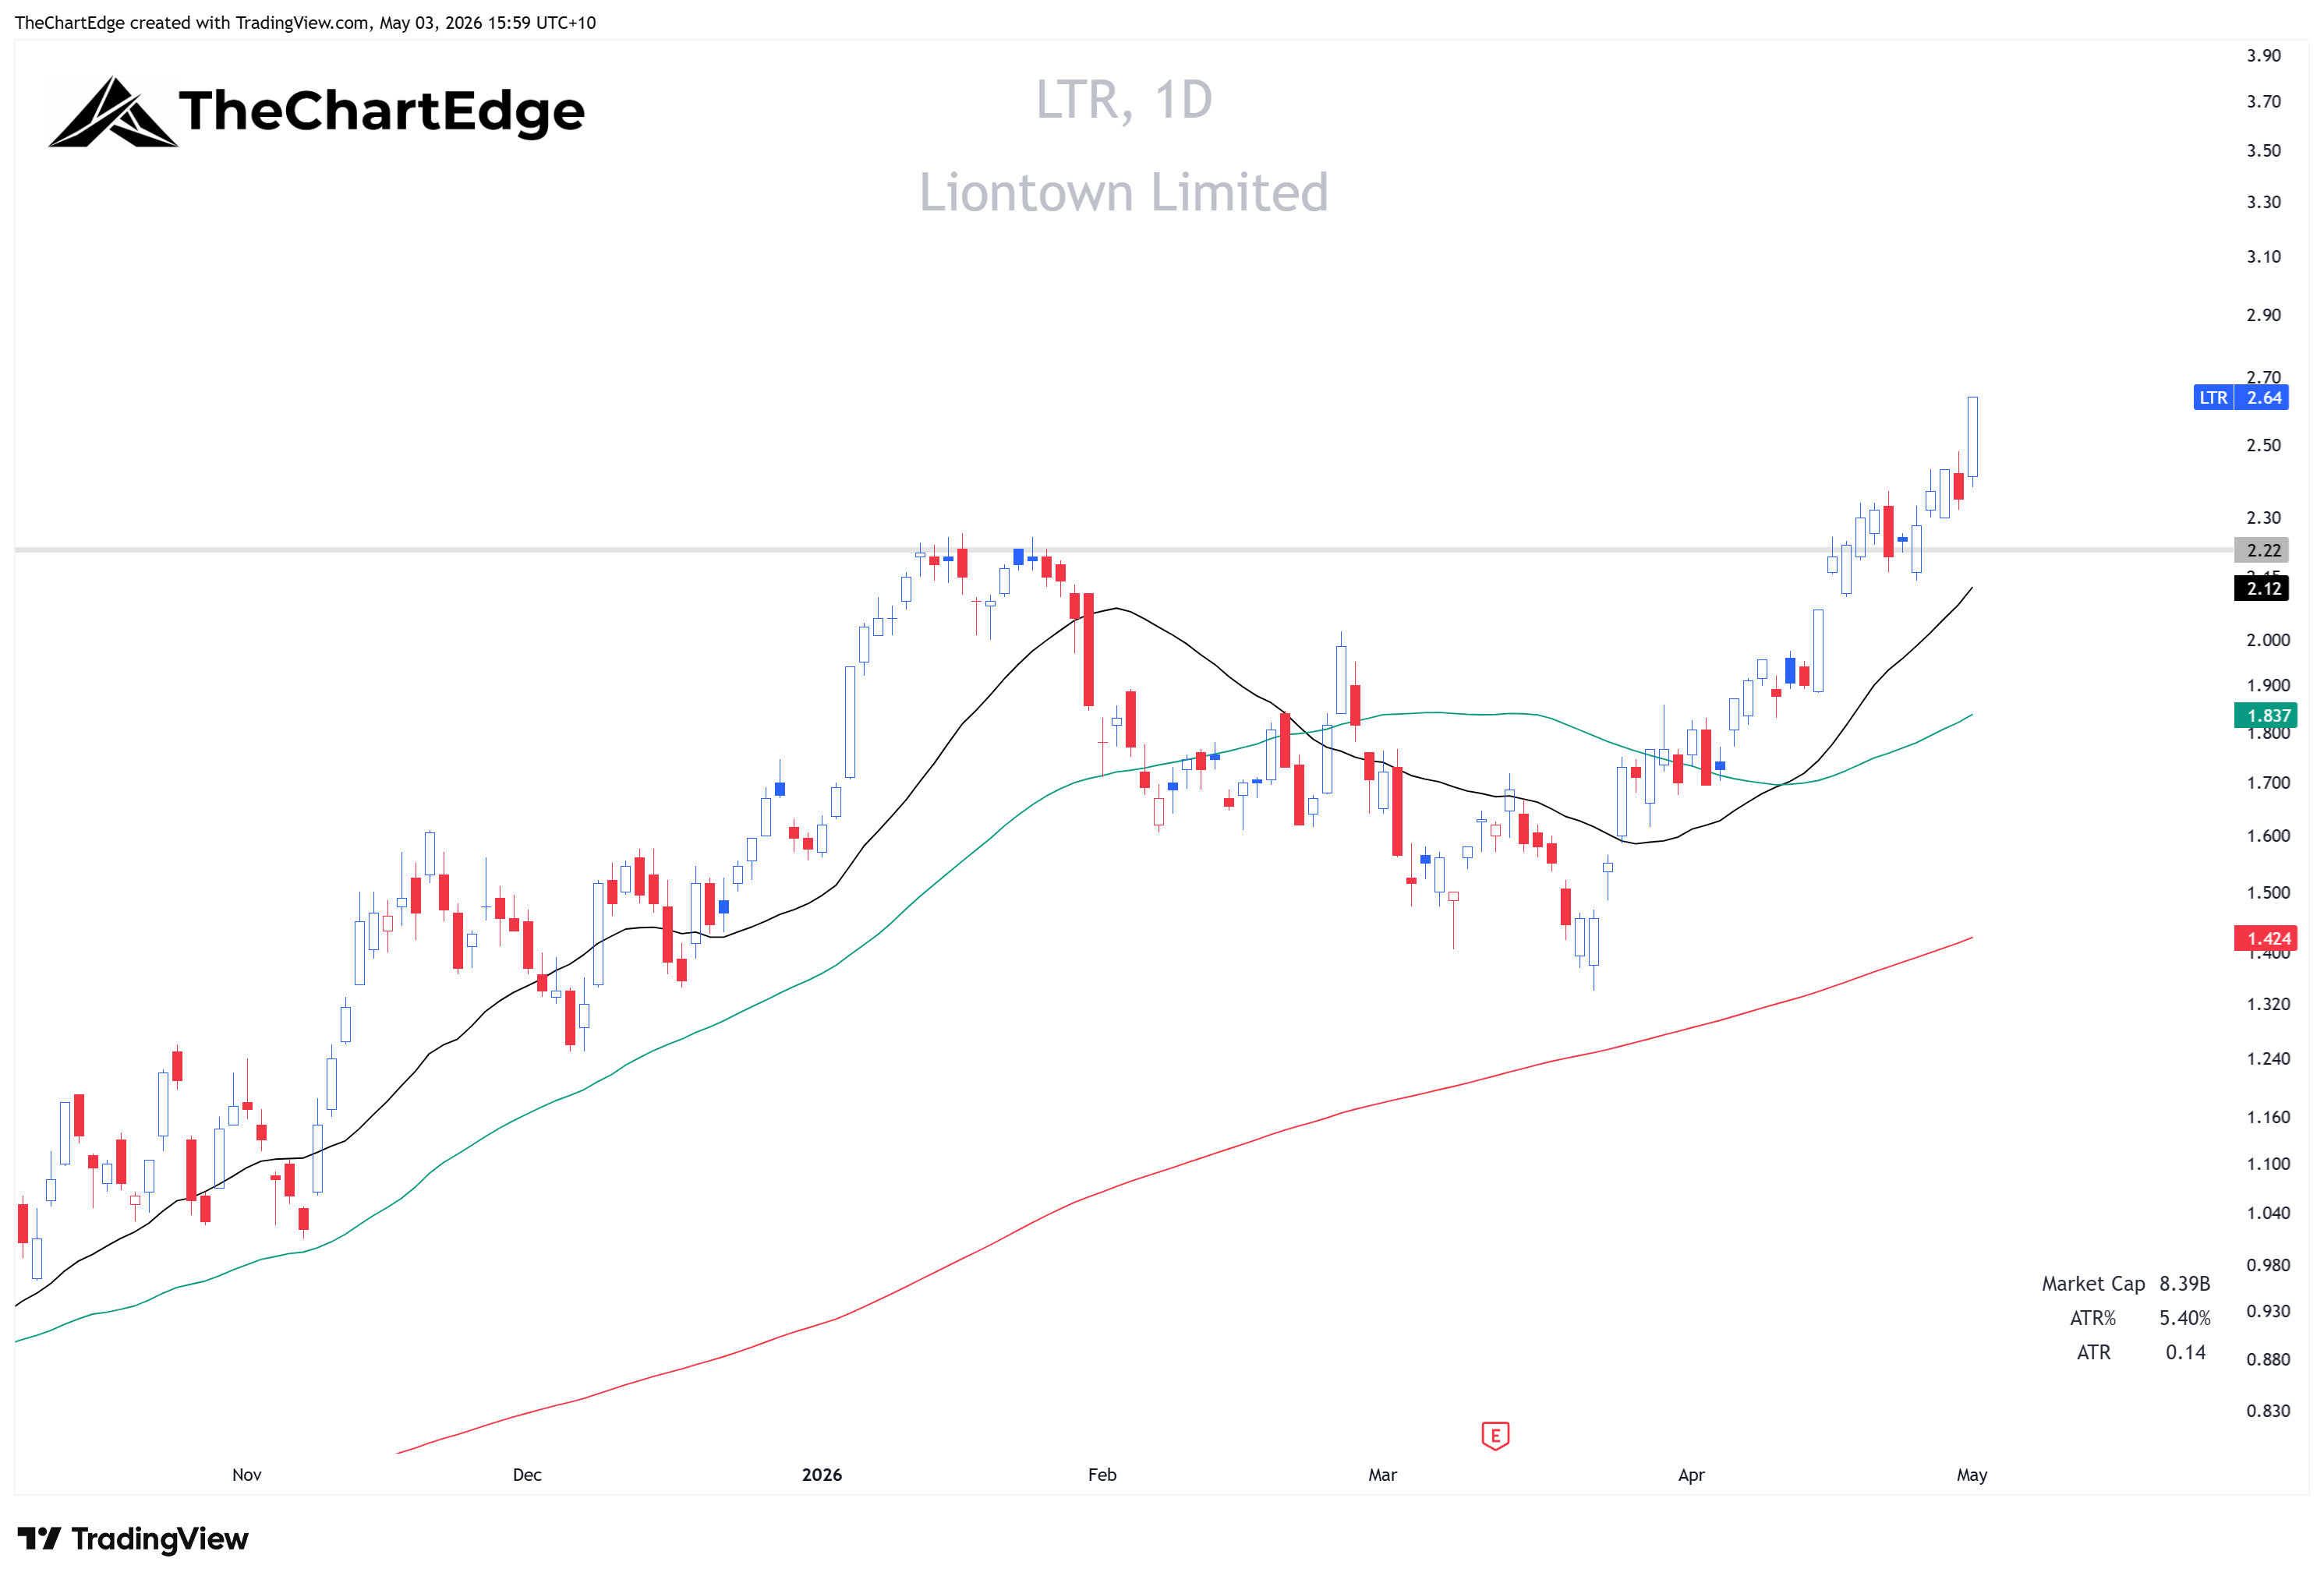
Liontown Ltd (LTR) - Lithium miner (battery materials). Critical Minerals, Leading, Strong Uptrend. Up 17.9% last week. 24.3% above the 20-day SMA, 5.4% ATR, extension 4.5x - well outside the scan threshold. Right at the 52-week high (-17.4% ATH). RSI 75.
I like the chart, but too extended to buy here for me. Add to pullback watchlist.
MI6 Chart

Minerals 260 Ltd (MI6) - Niobium exploration and critical minerals. Critical Minerals, Weakening, Uptrend. Down 3.4% last week. 3.9% below the 20-day SMA, 6.6% ATR, extension -0.6x. 13.2% from the 52-week high (-14.8% ATH). RSI 50. Near miss on 52-week high gate.
Could wait to see if it breaks out to all-time highs, or if you’re looking for an early entry, could buy strength on a clear reclaim of the 20 SMA.
Diversified Resources
RIO Chart
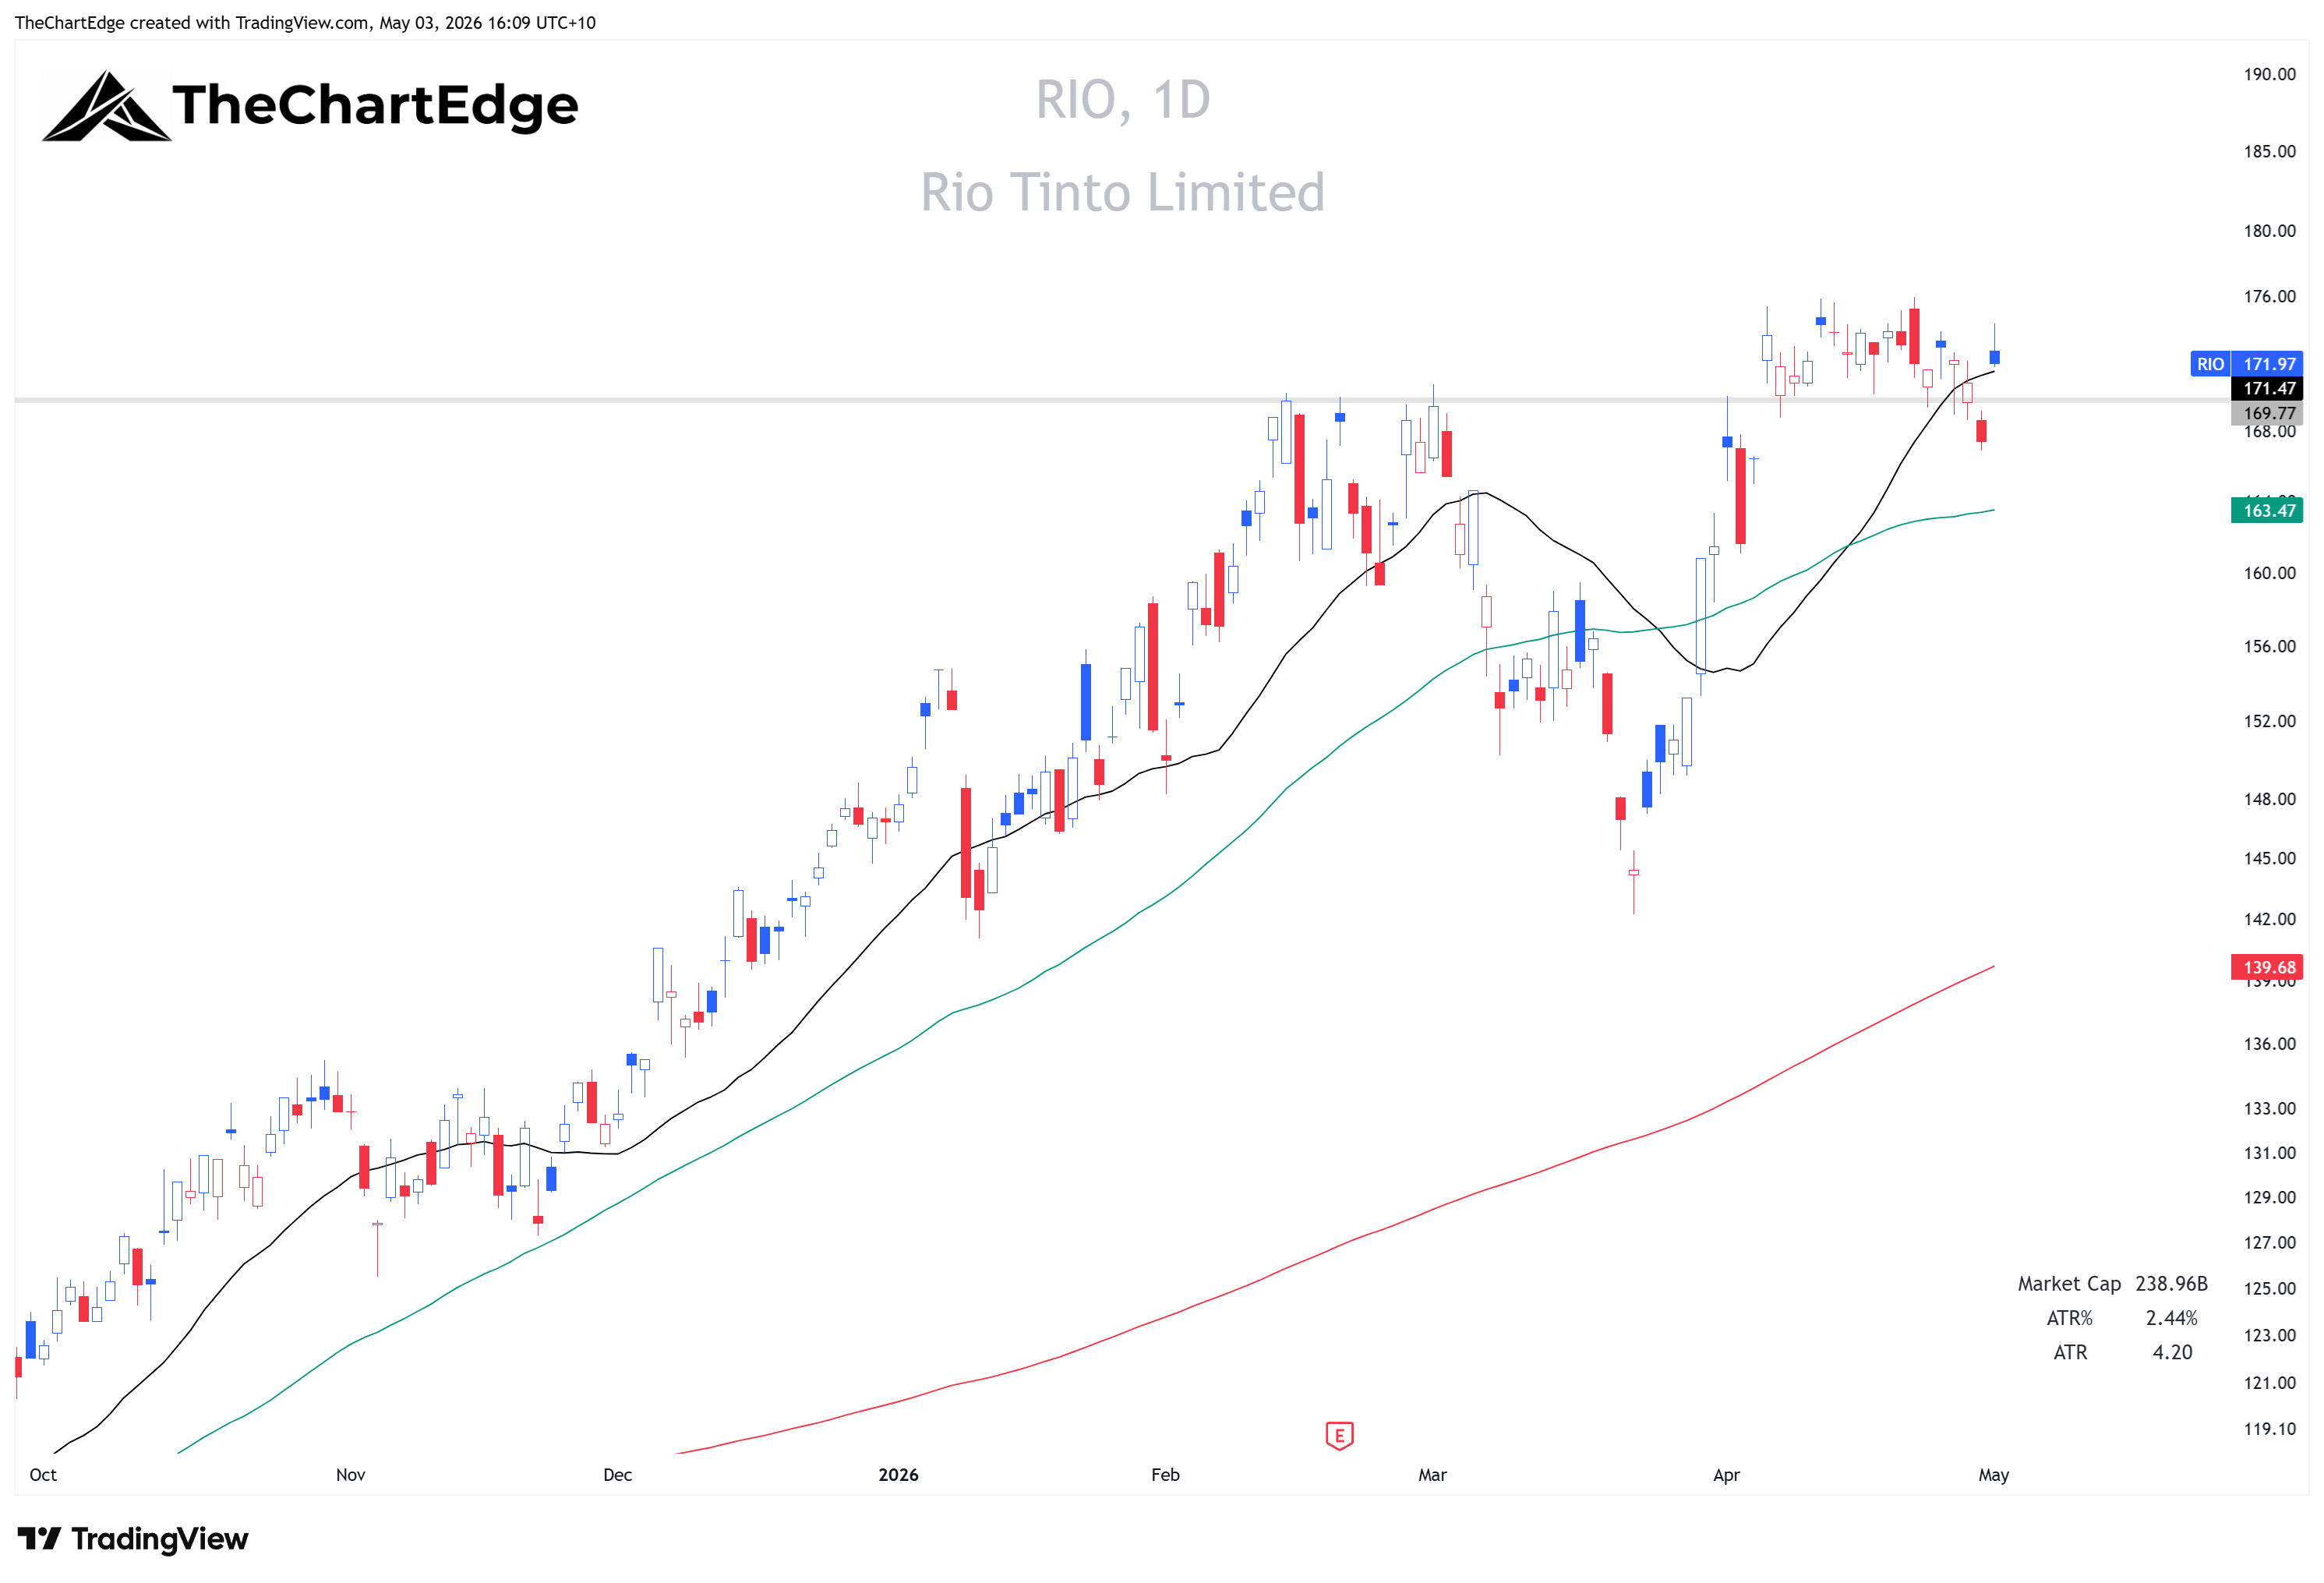
Rio Tinto Ltd (RIO) - Iron ore, aluminium, copper. Diversified Resources, Weakening, Strong Uptrend. Up 0.2% last week. 0.3% above the 20-day SMA, 2.4% ATR, extension 0.1x. 2.2% from the 52-week high (-2.2% ATH). RSI 57. The Weakening quadrant means momentum is fading relative to VAS, but the trend state is still Strong Uptrend.
Consolidating near all-time highs. Had a shakeout on Thursday, the 30th of April. I’d probably be looking to buy strength above $176. Blue skies above.
MIN Chart
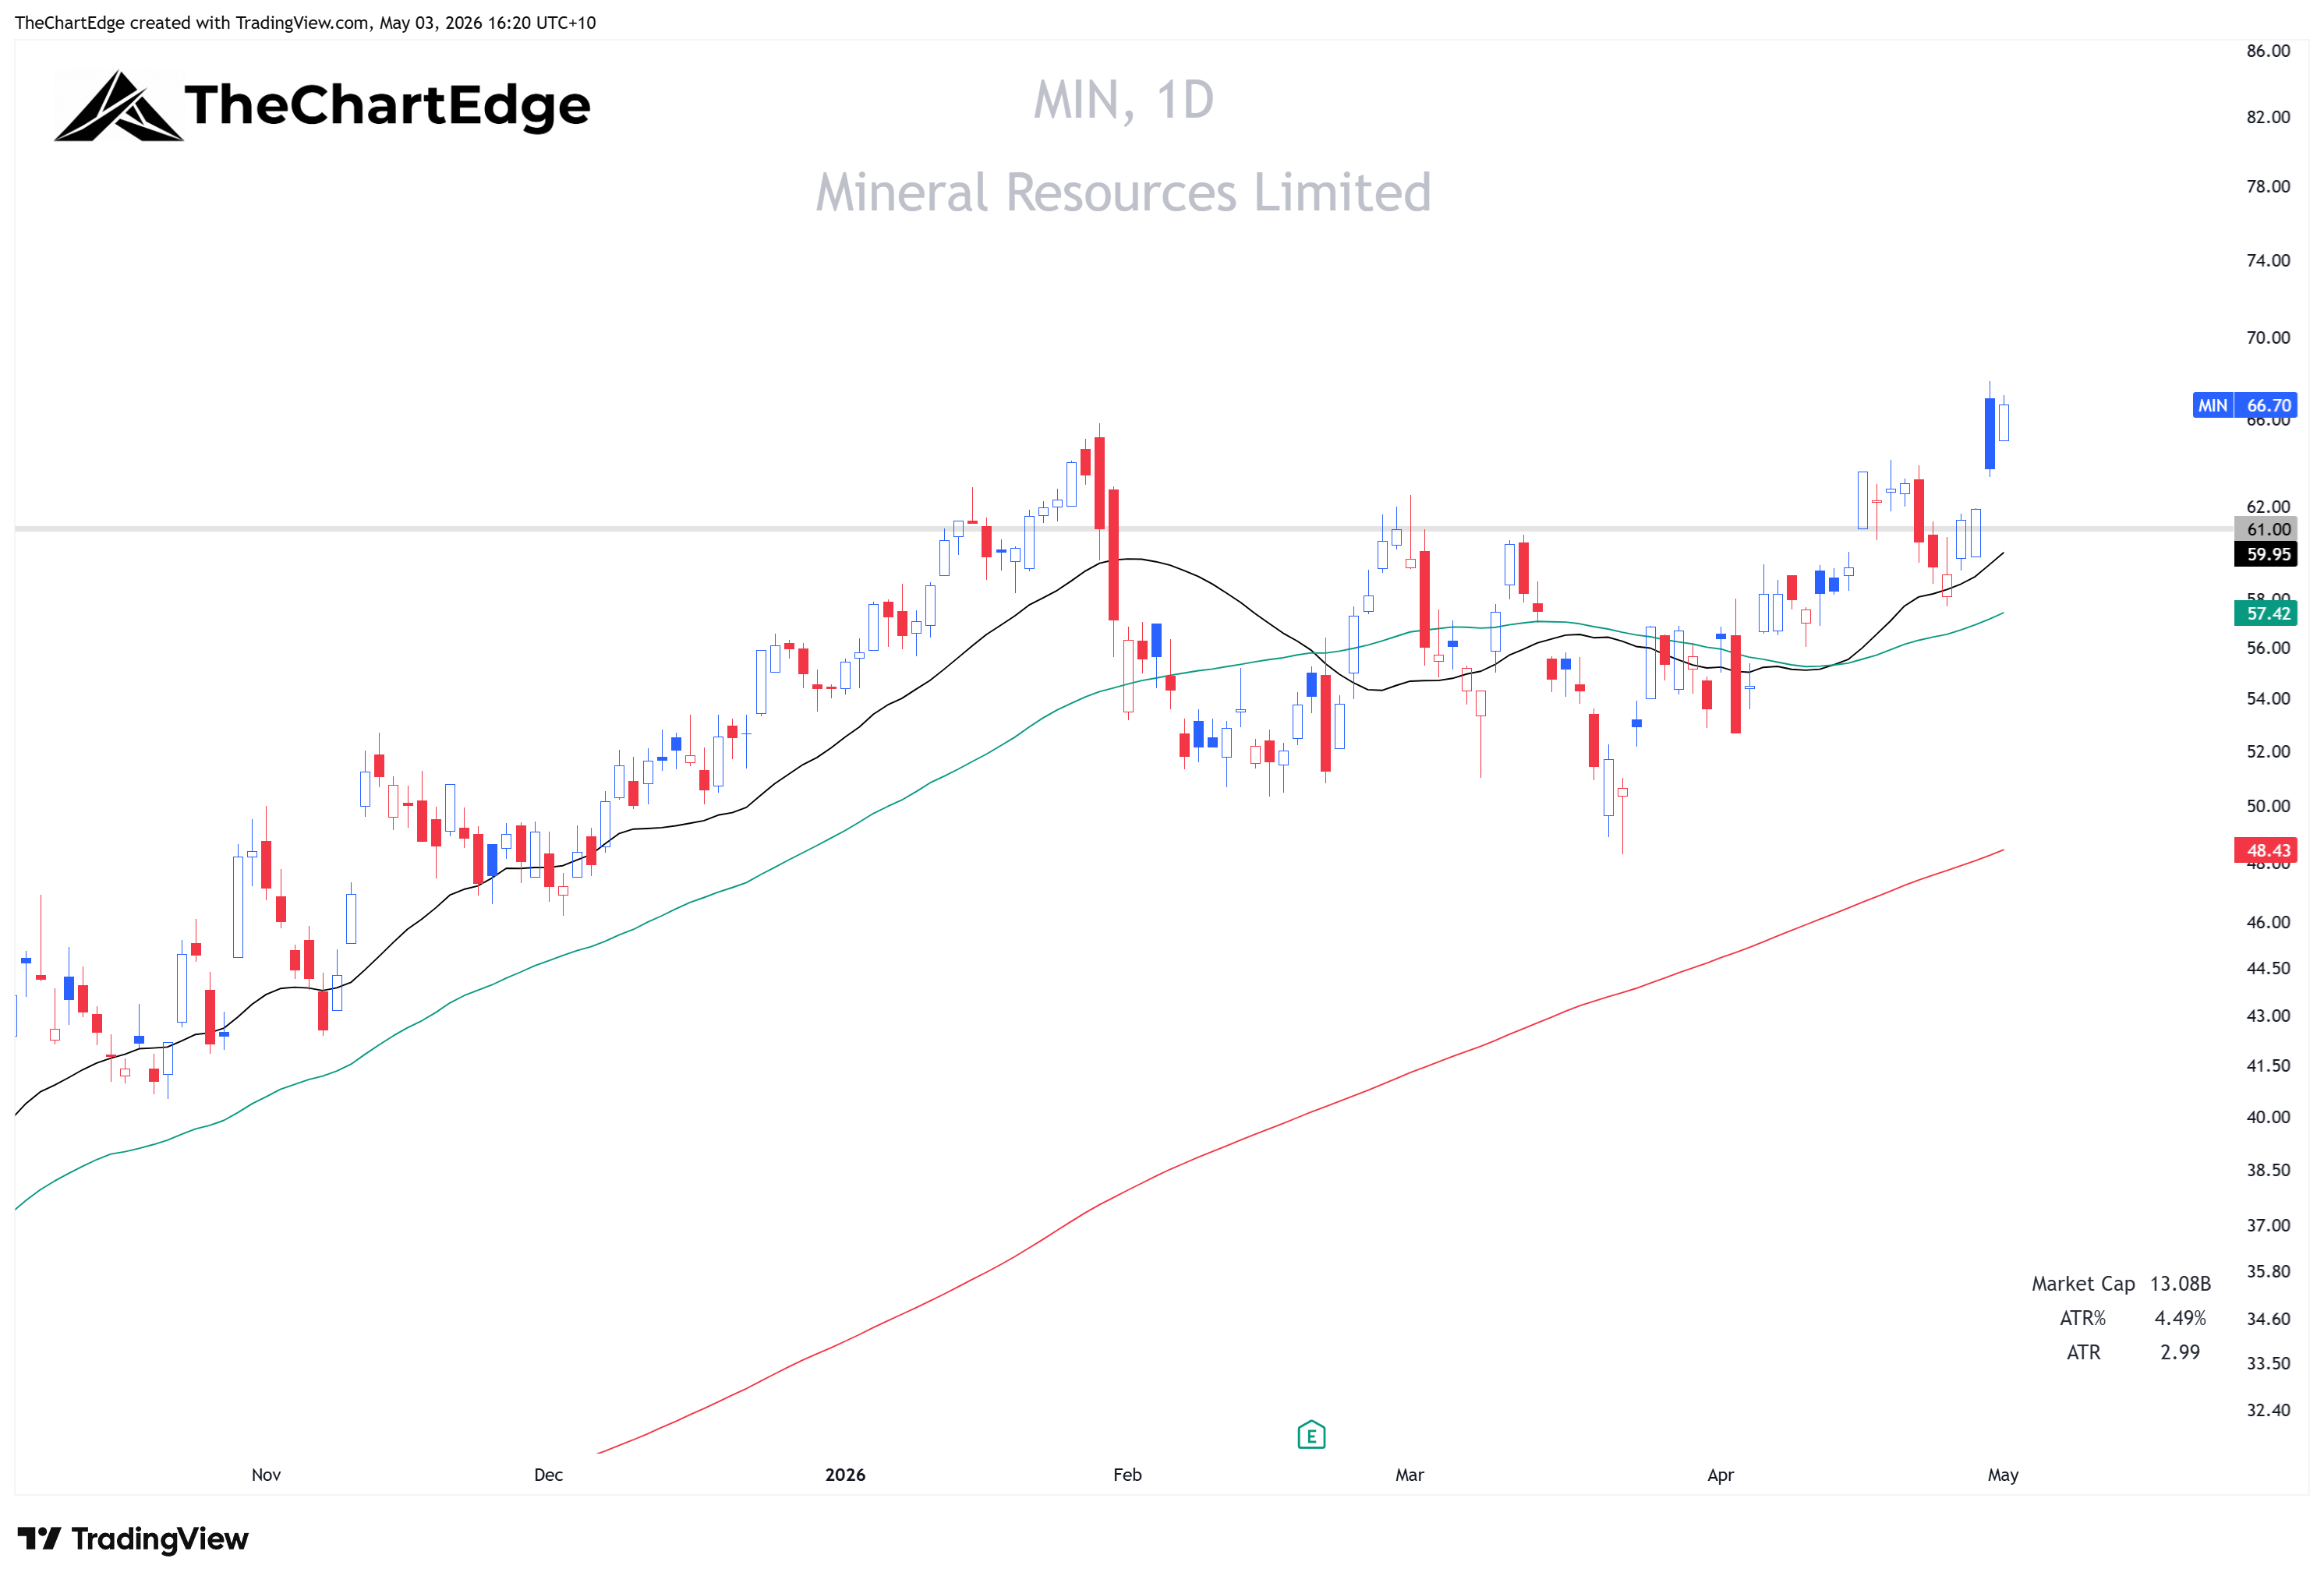
Mineral Resources Ltd (MIN) - Mining services, iron ore, lithium. Diversified Resources, Leading, Strong Uptrend. Up 12.4% last week. 11.2% above the 20-day SMA, 4.5% ATR, extension 2.5x. 1.6% from the 52-week high (-31.2% ATH). RSI 68.
Recent price action is a bit loose. Could wait for it to tighten up, or if you are more aggressive, buy strength above Thursday the 30th of April’s high of $67.80 - Potential targets $75 and $91.
Gold
Both of these names are in the Weakening quadrant with fading RS momentum, and both just miss the 52-week high threshold. However, I thought they were worth including given their outperformance relative to the broader gold category and the gold price.
GGP Chart
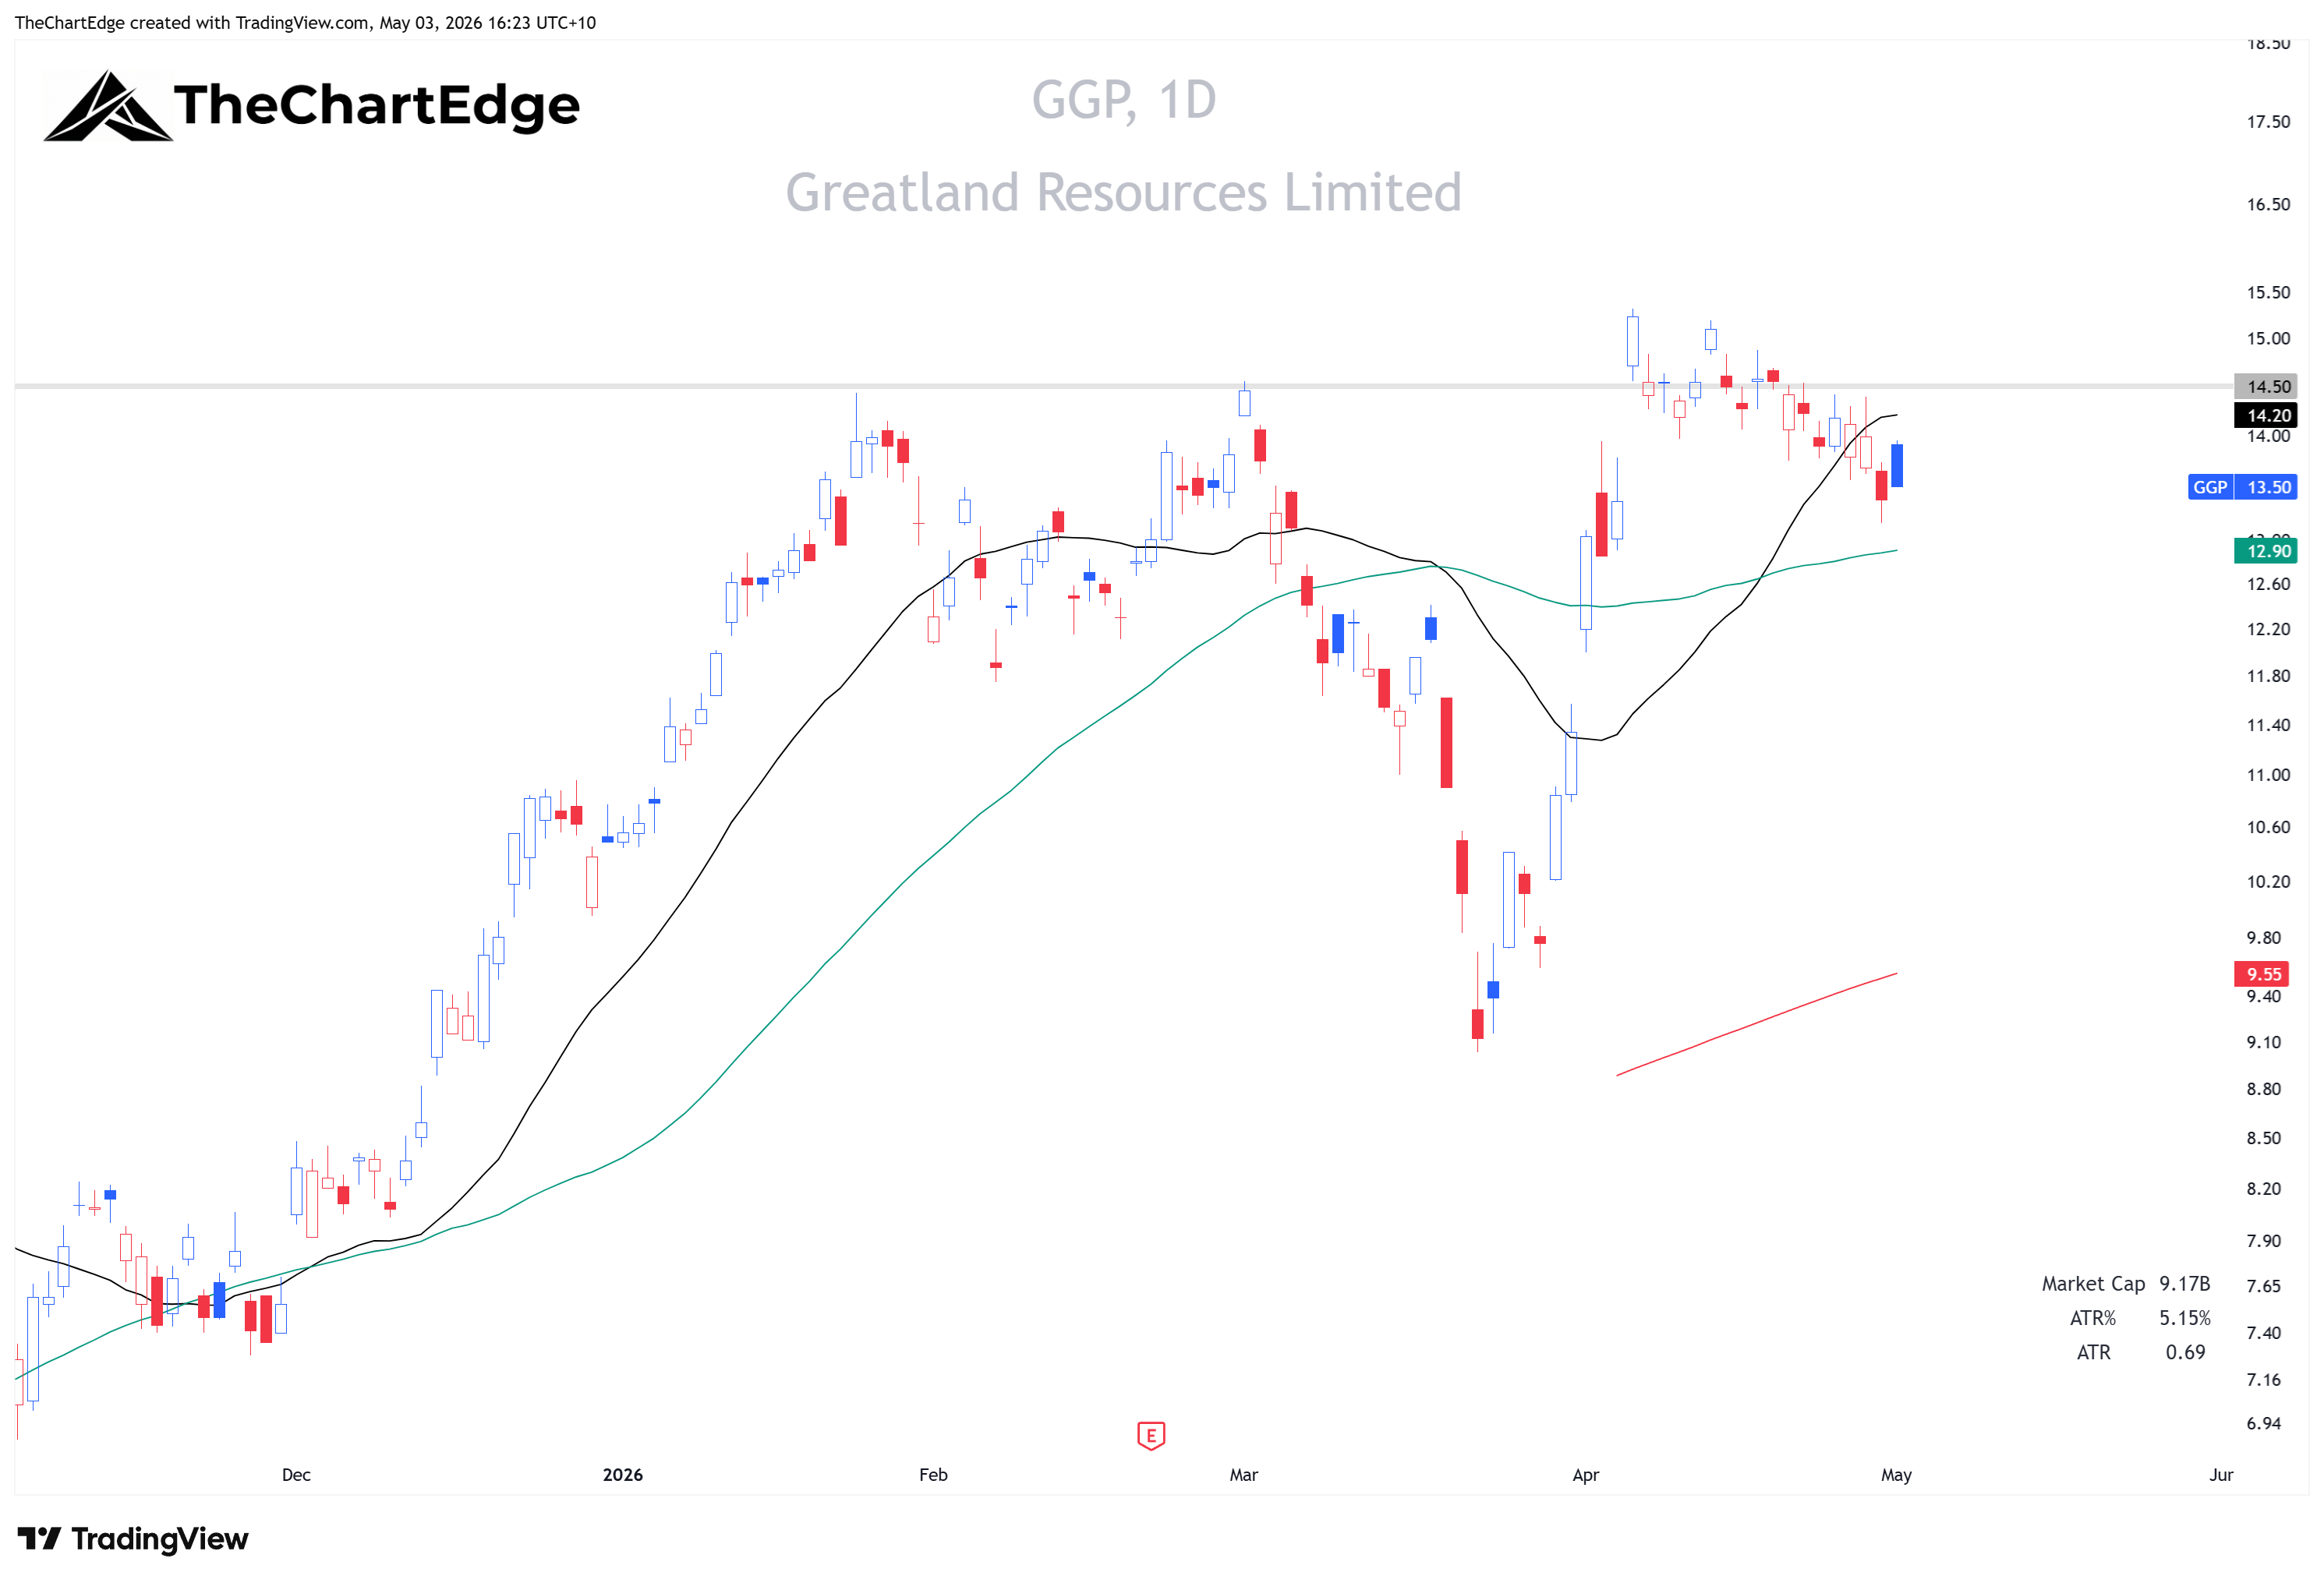
Greatland Resources Ltd (GGP) - Gold and copper. Gold, Weakening, Uptrend. Down 2.8% last week. 5.0% below the 20-day SMA, 5.1% ATR, extension -1.0x. 11.9% from the 52-week high (-11.9% ATH). RSI 50. Near miss on 52-week high gate.
I wouldn’t buy this one here, but possibly on strength if it can reclaim the 20-day SMA and prior resistance around $14.50 zone - but I’d be watching the gold price too. I would be hesitant to buy a breakout if the gold price isn’t improving.
PDI Chart
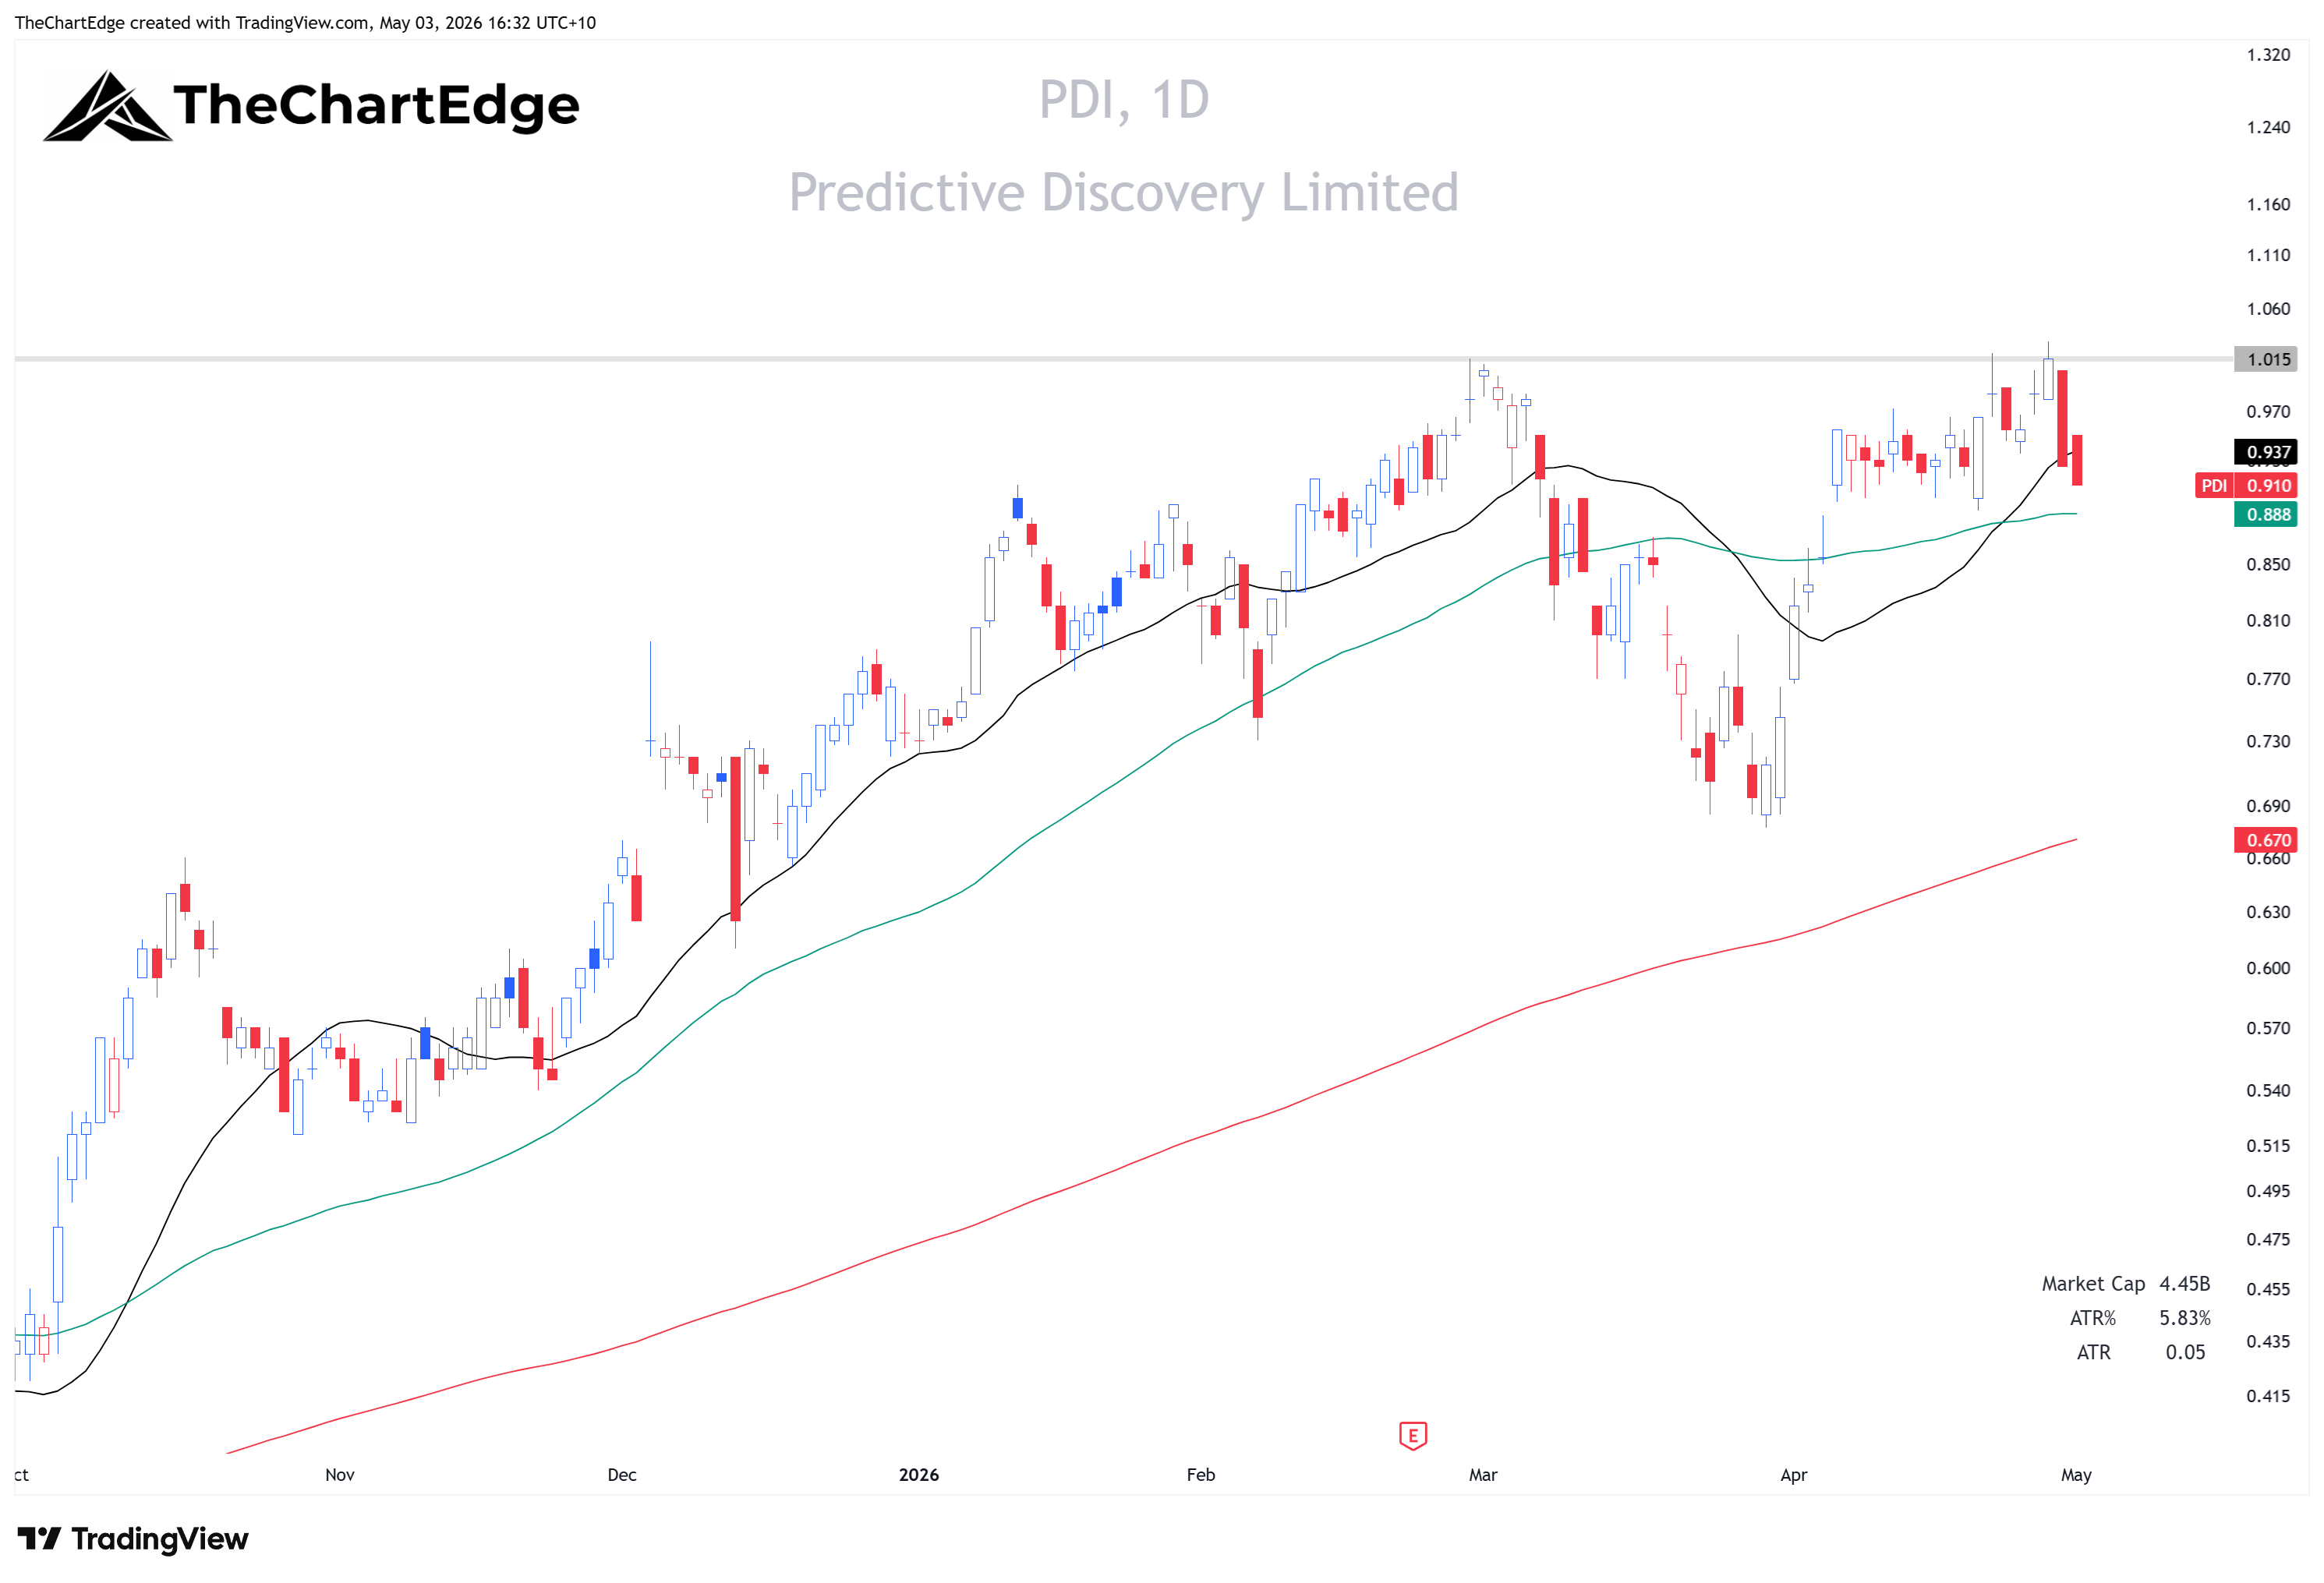
Predictive Discovery Ltd (PDI) - Gold explorer. Gold, Weakening, Uptrend. Down 4.7% last week. 2.9% below the 20-day SMA, 5.8% ATR, extension -0.5x. 11.7% from the 52-week high (-66.2% ATH). RSI 49. Near miss on 52-week high gate.
Another one for the watch list. A potential buy on strength over recent highs around $1.015 - Trading a bit loose at the moment though. Potential targets after a breakout would be $1.50 and $2.00.
Engineering & Contractors
Both of these are mining services plays.
SRG Chart
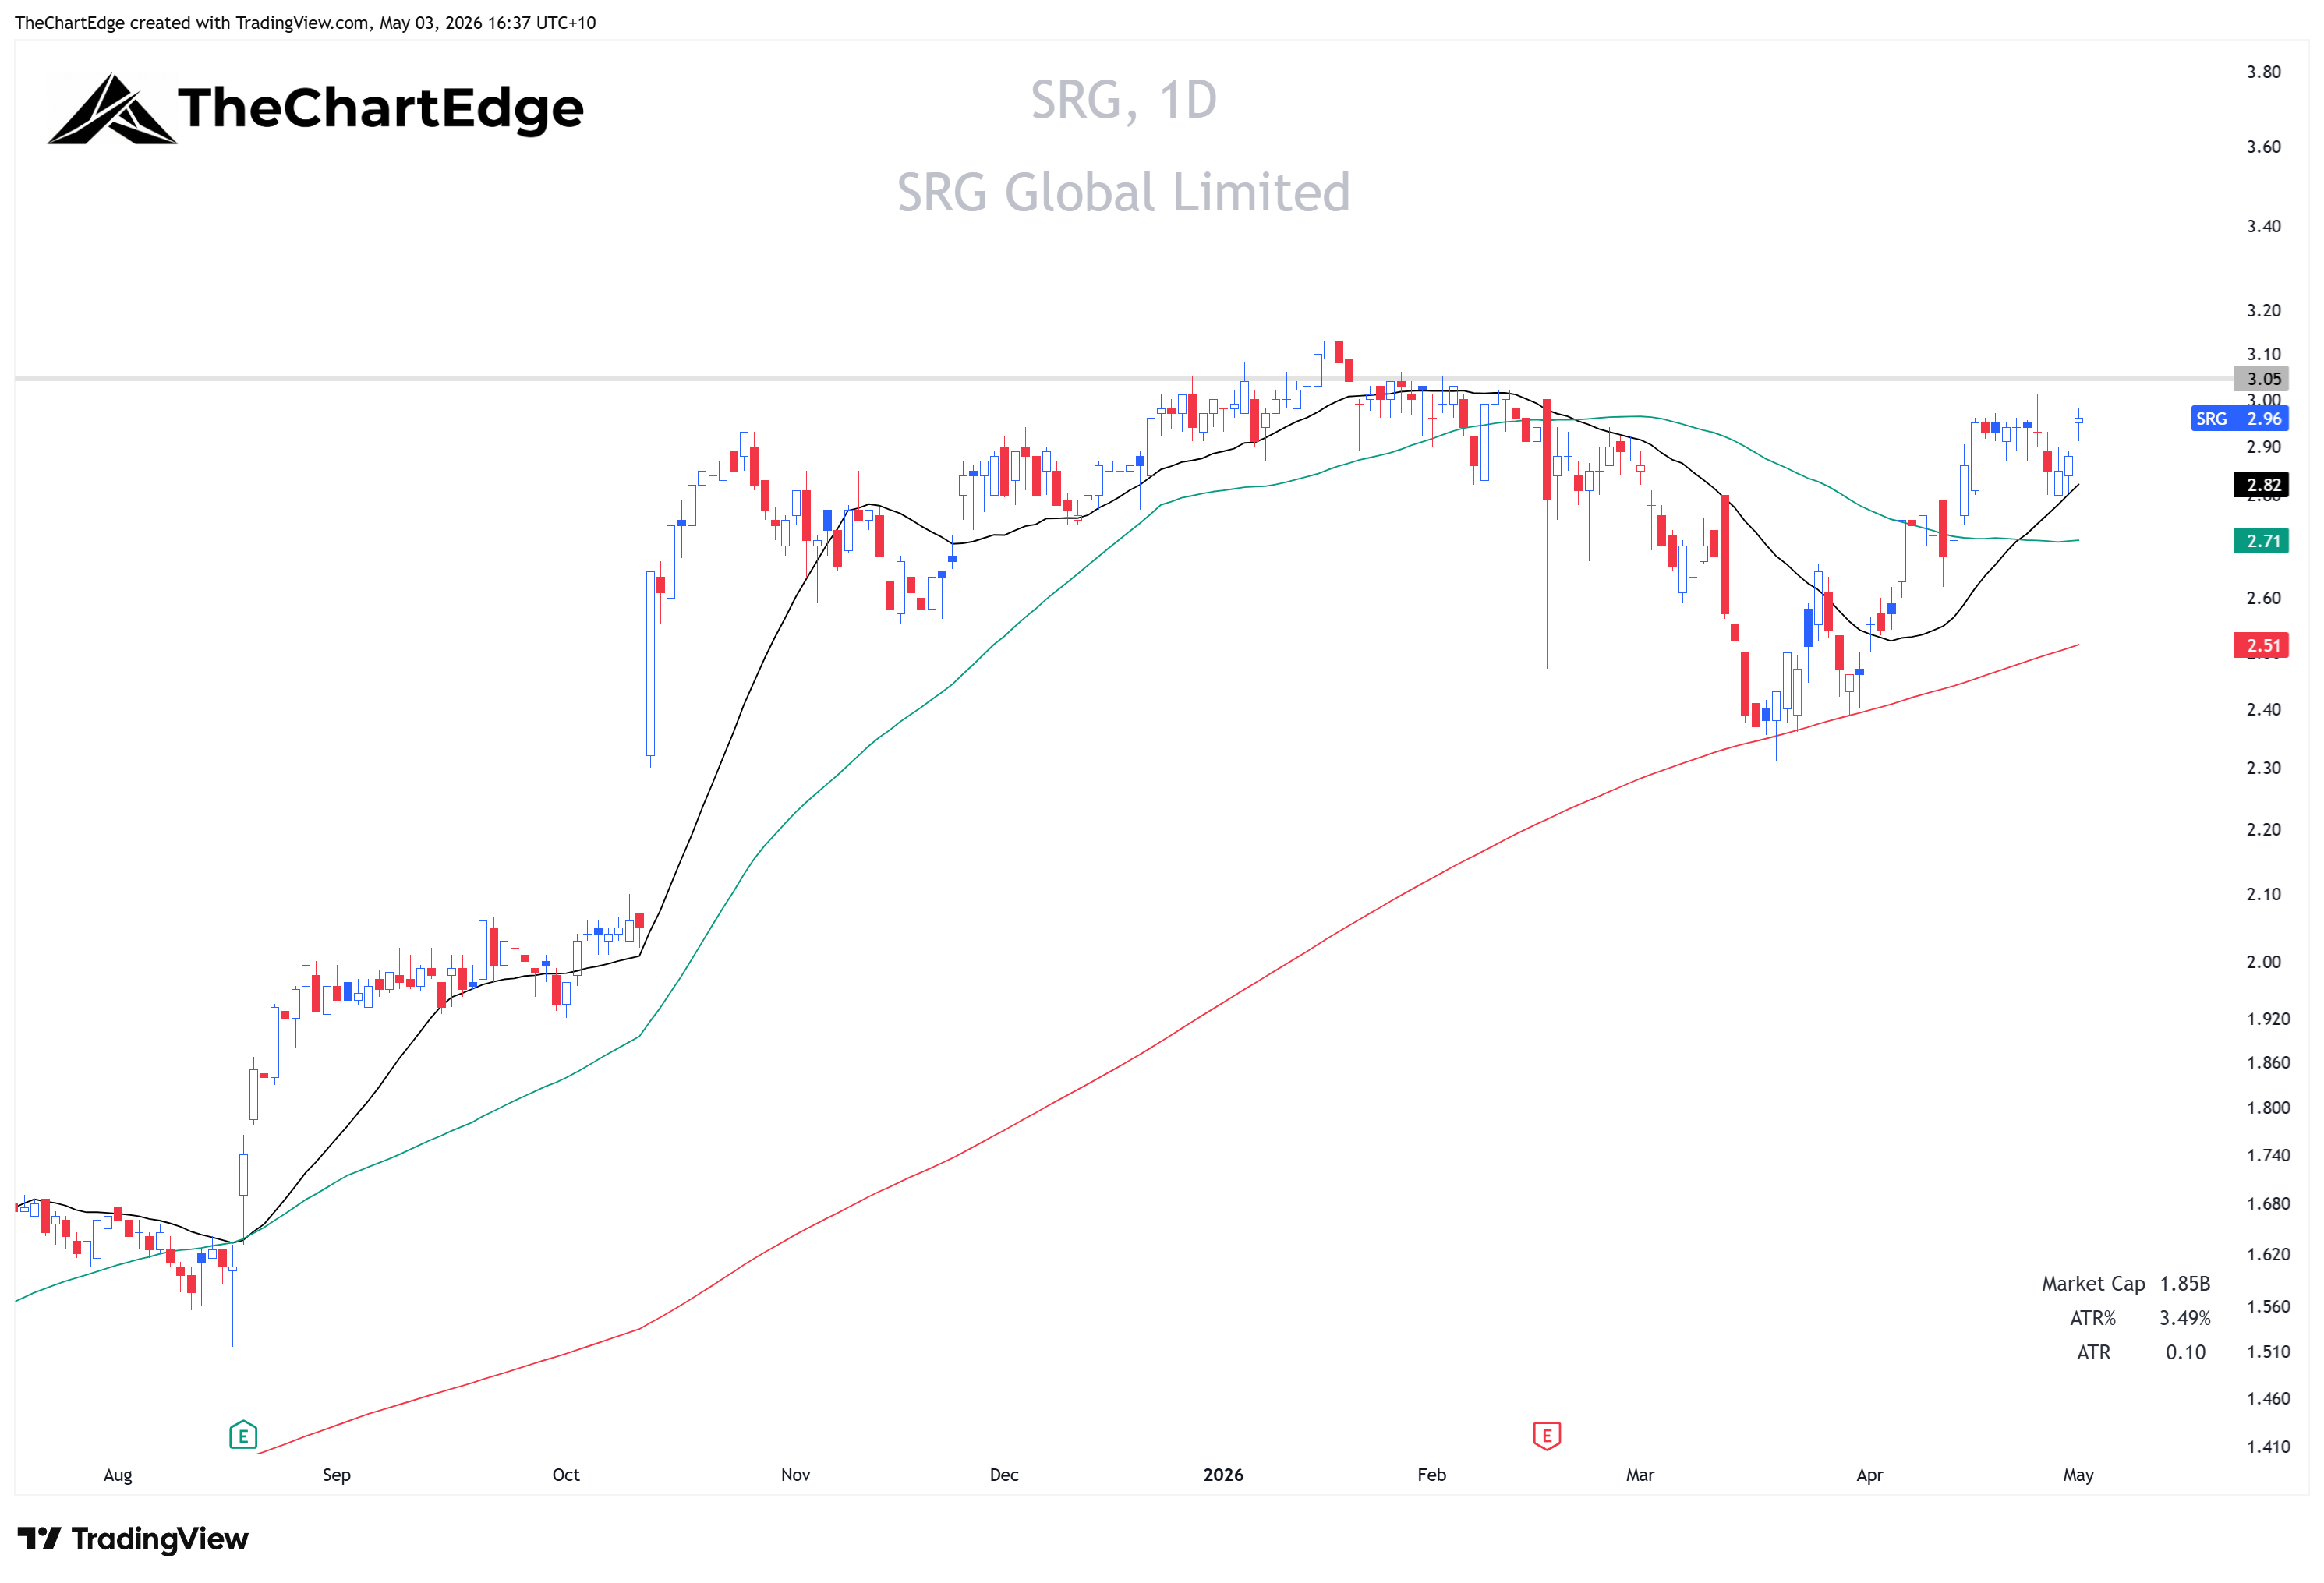
SRG Global Ltd (SRG) - Engineering, contracting, mining services. Engineering & Contractors, Leading, Strong Uptrend. Up 0.7% last week. 4.9% above the 20-day SMA, 3.5% ATR, extension 1.4x. 5.7% from the 52-week high (-5.7% ATH). RSI 64.
Not the cleanest base, but if it can tighten up a bit in its consolidation here and then break out to all-time highs, could provide a low-risk entry - Watchlist
NWH Chart
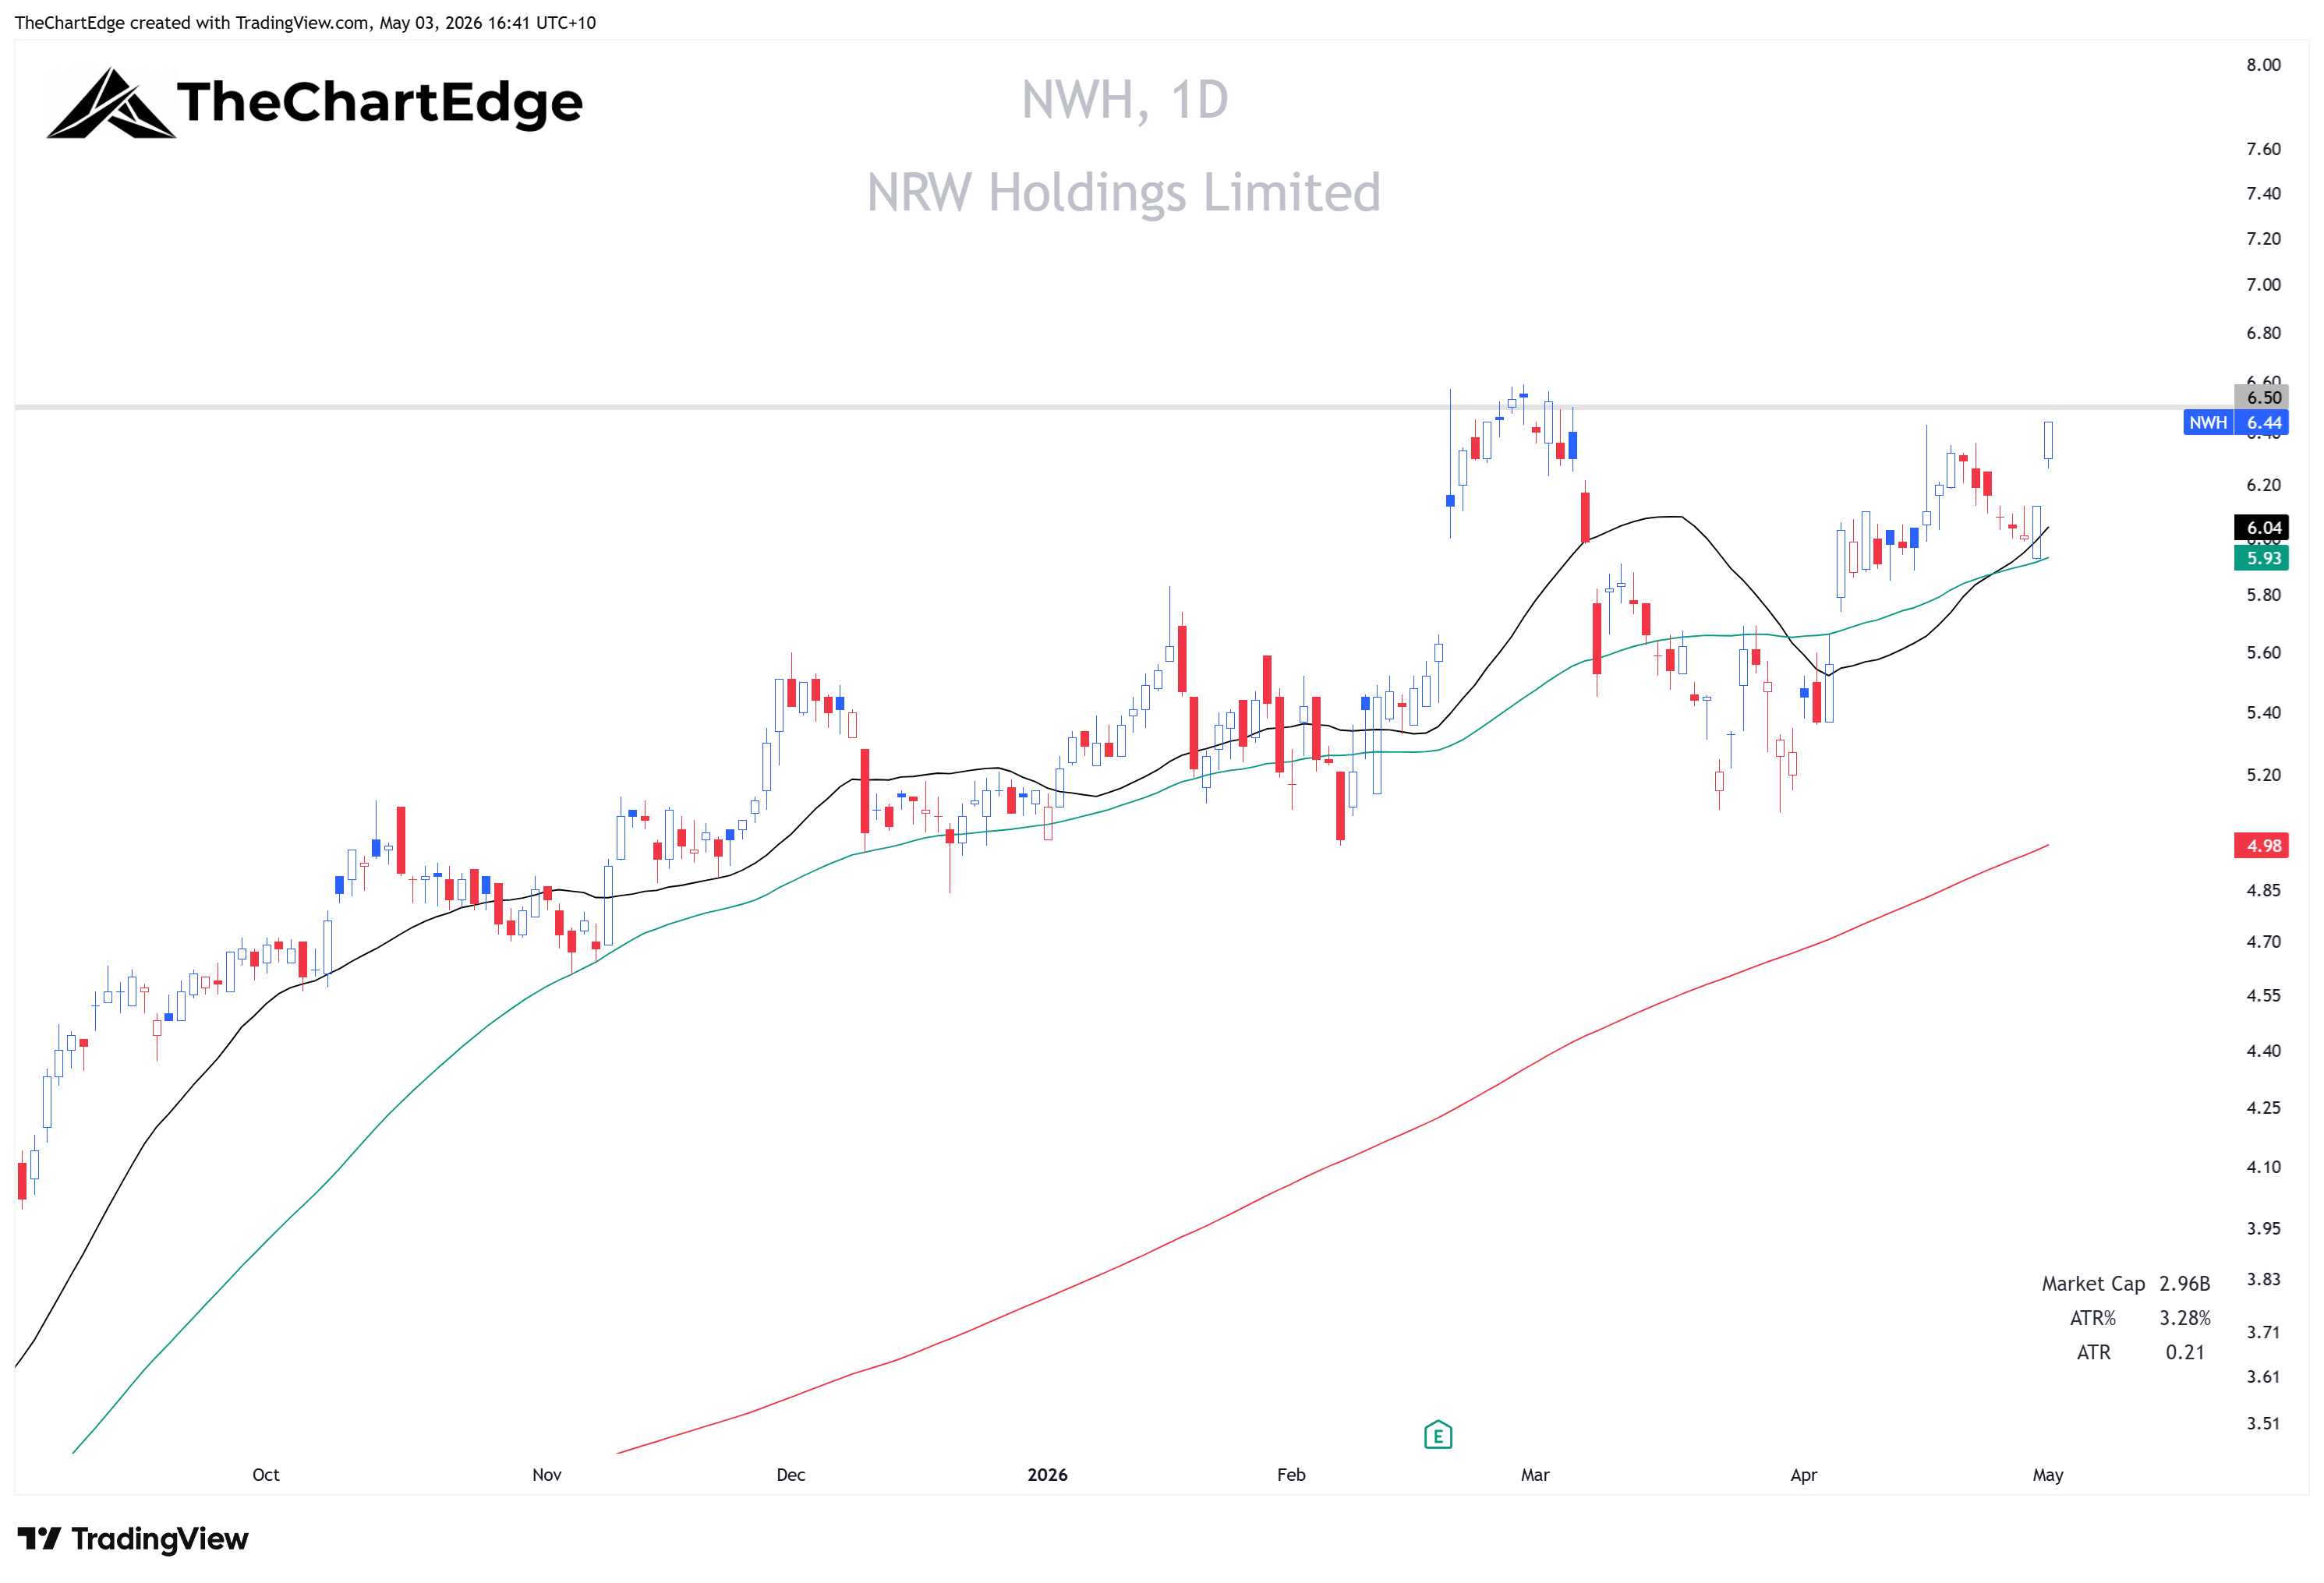
NRW Holdings Ltd (NWH) - Engineering, contracting, mining services. Engineering & Contractors, Leading, Strong Uptrend. Up 4.6% last week. 6.6% above the 20-day SMA, 3.3% ATR, extension 2.0x. 2.3% from the 52-week high (-2.3% ATH). RSI 65.
Also not a clean base. But if it tightens up a bit here and breaks out to all-time highs, could provide an entry - Watchlist
Transport & Infrastructure
DBI Chart
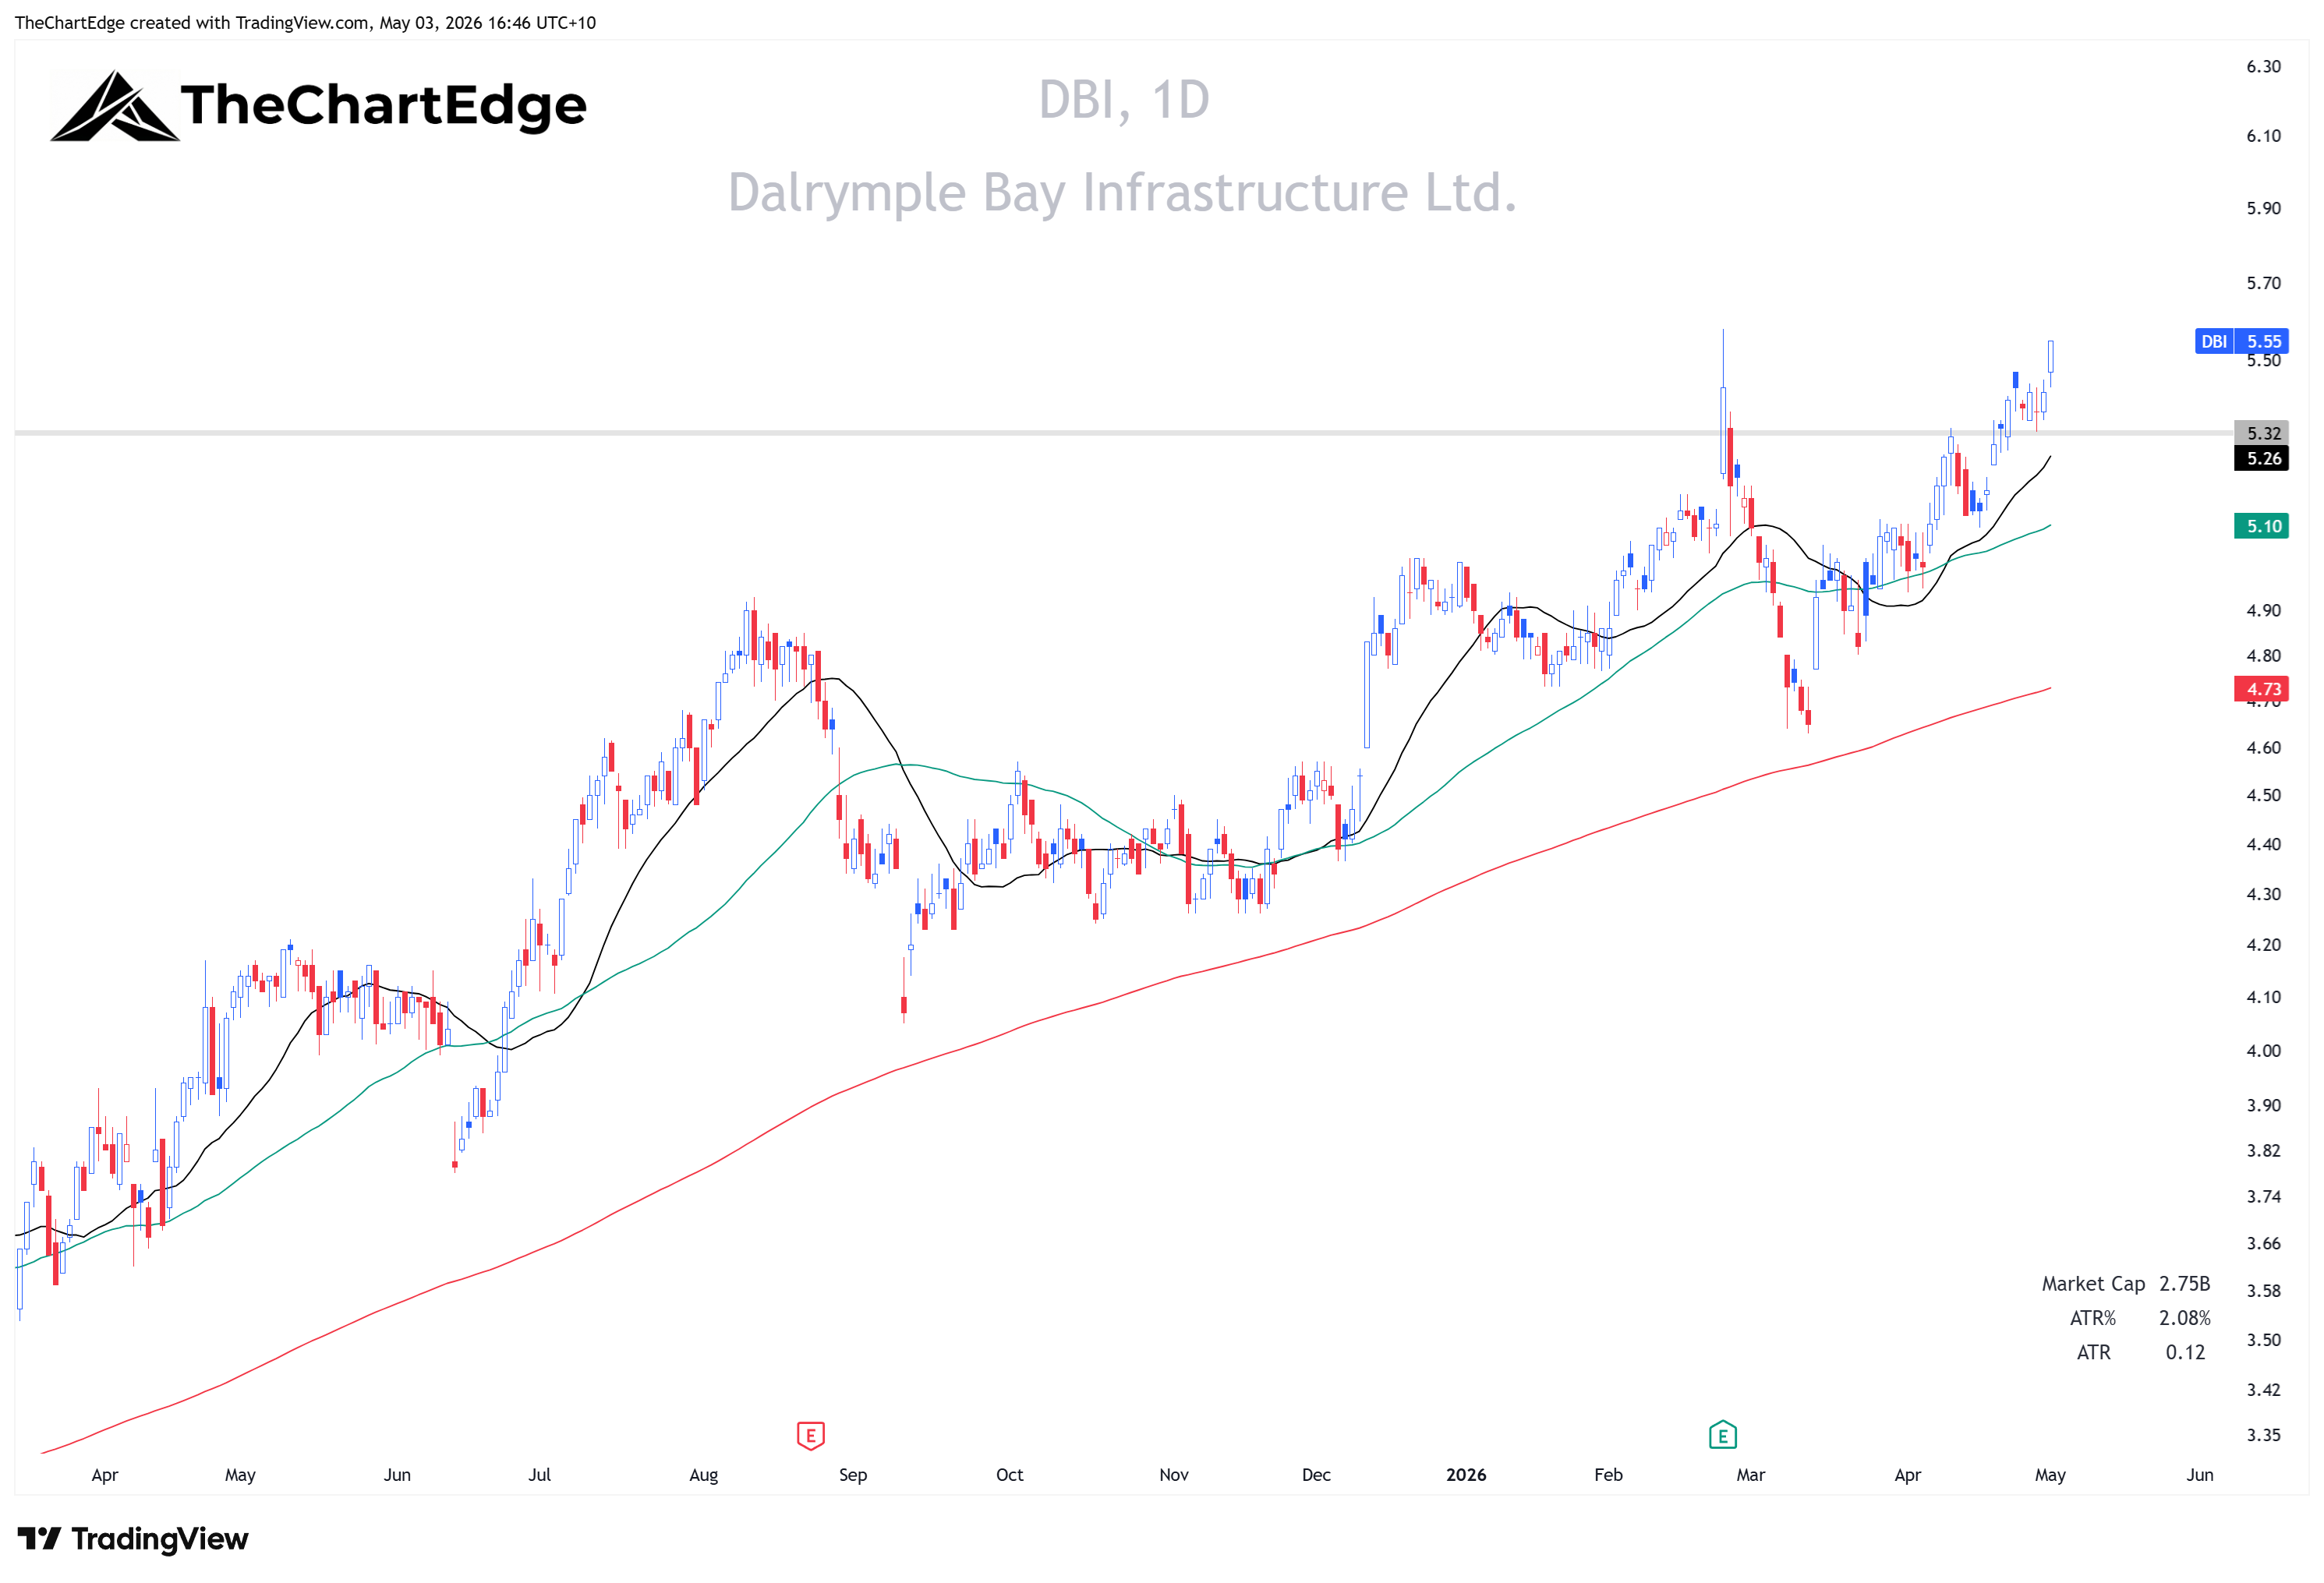
Dalrymple Bay Infrastructure Ltd (DBI) - Coal export port terminal. Transport & Infrastructure, Leading, Strong Uptrend. Up 2.2% last week. 5.5% above the 20-day SMA, 2.1% ATR, extension 2.6x. 0.5% from the 52-week high (-0.5% ATH). RSI 70.
I wouldn’t buy this here but on the watchlist for a lower risk entry.
Digital Infrastructure
CDA Chart
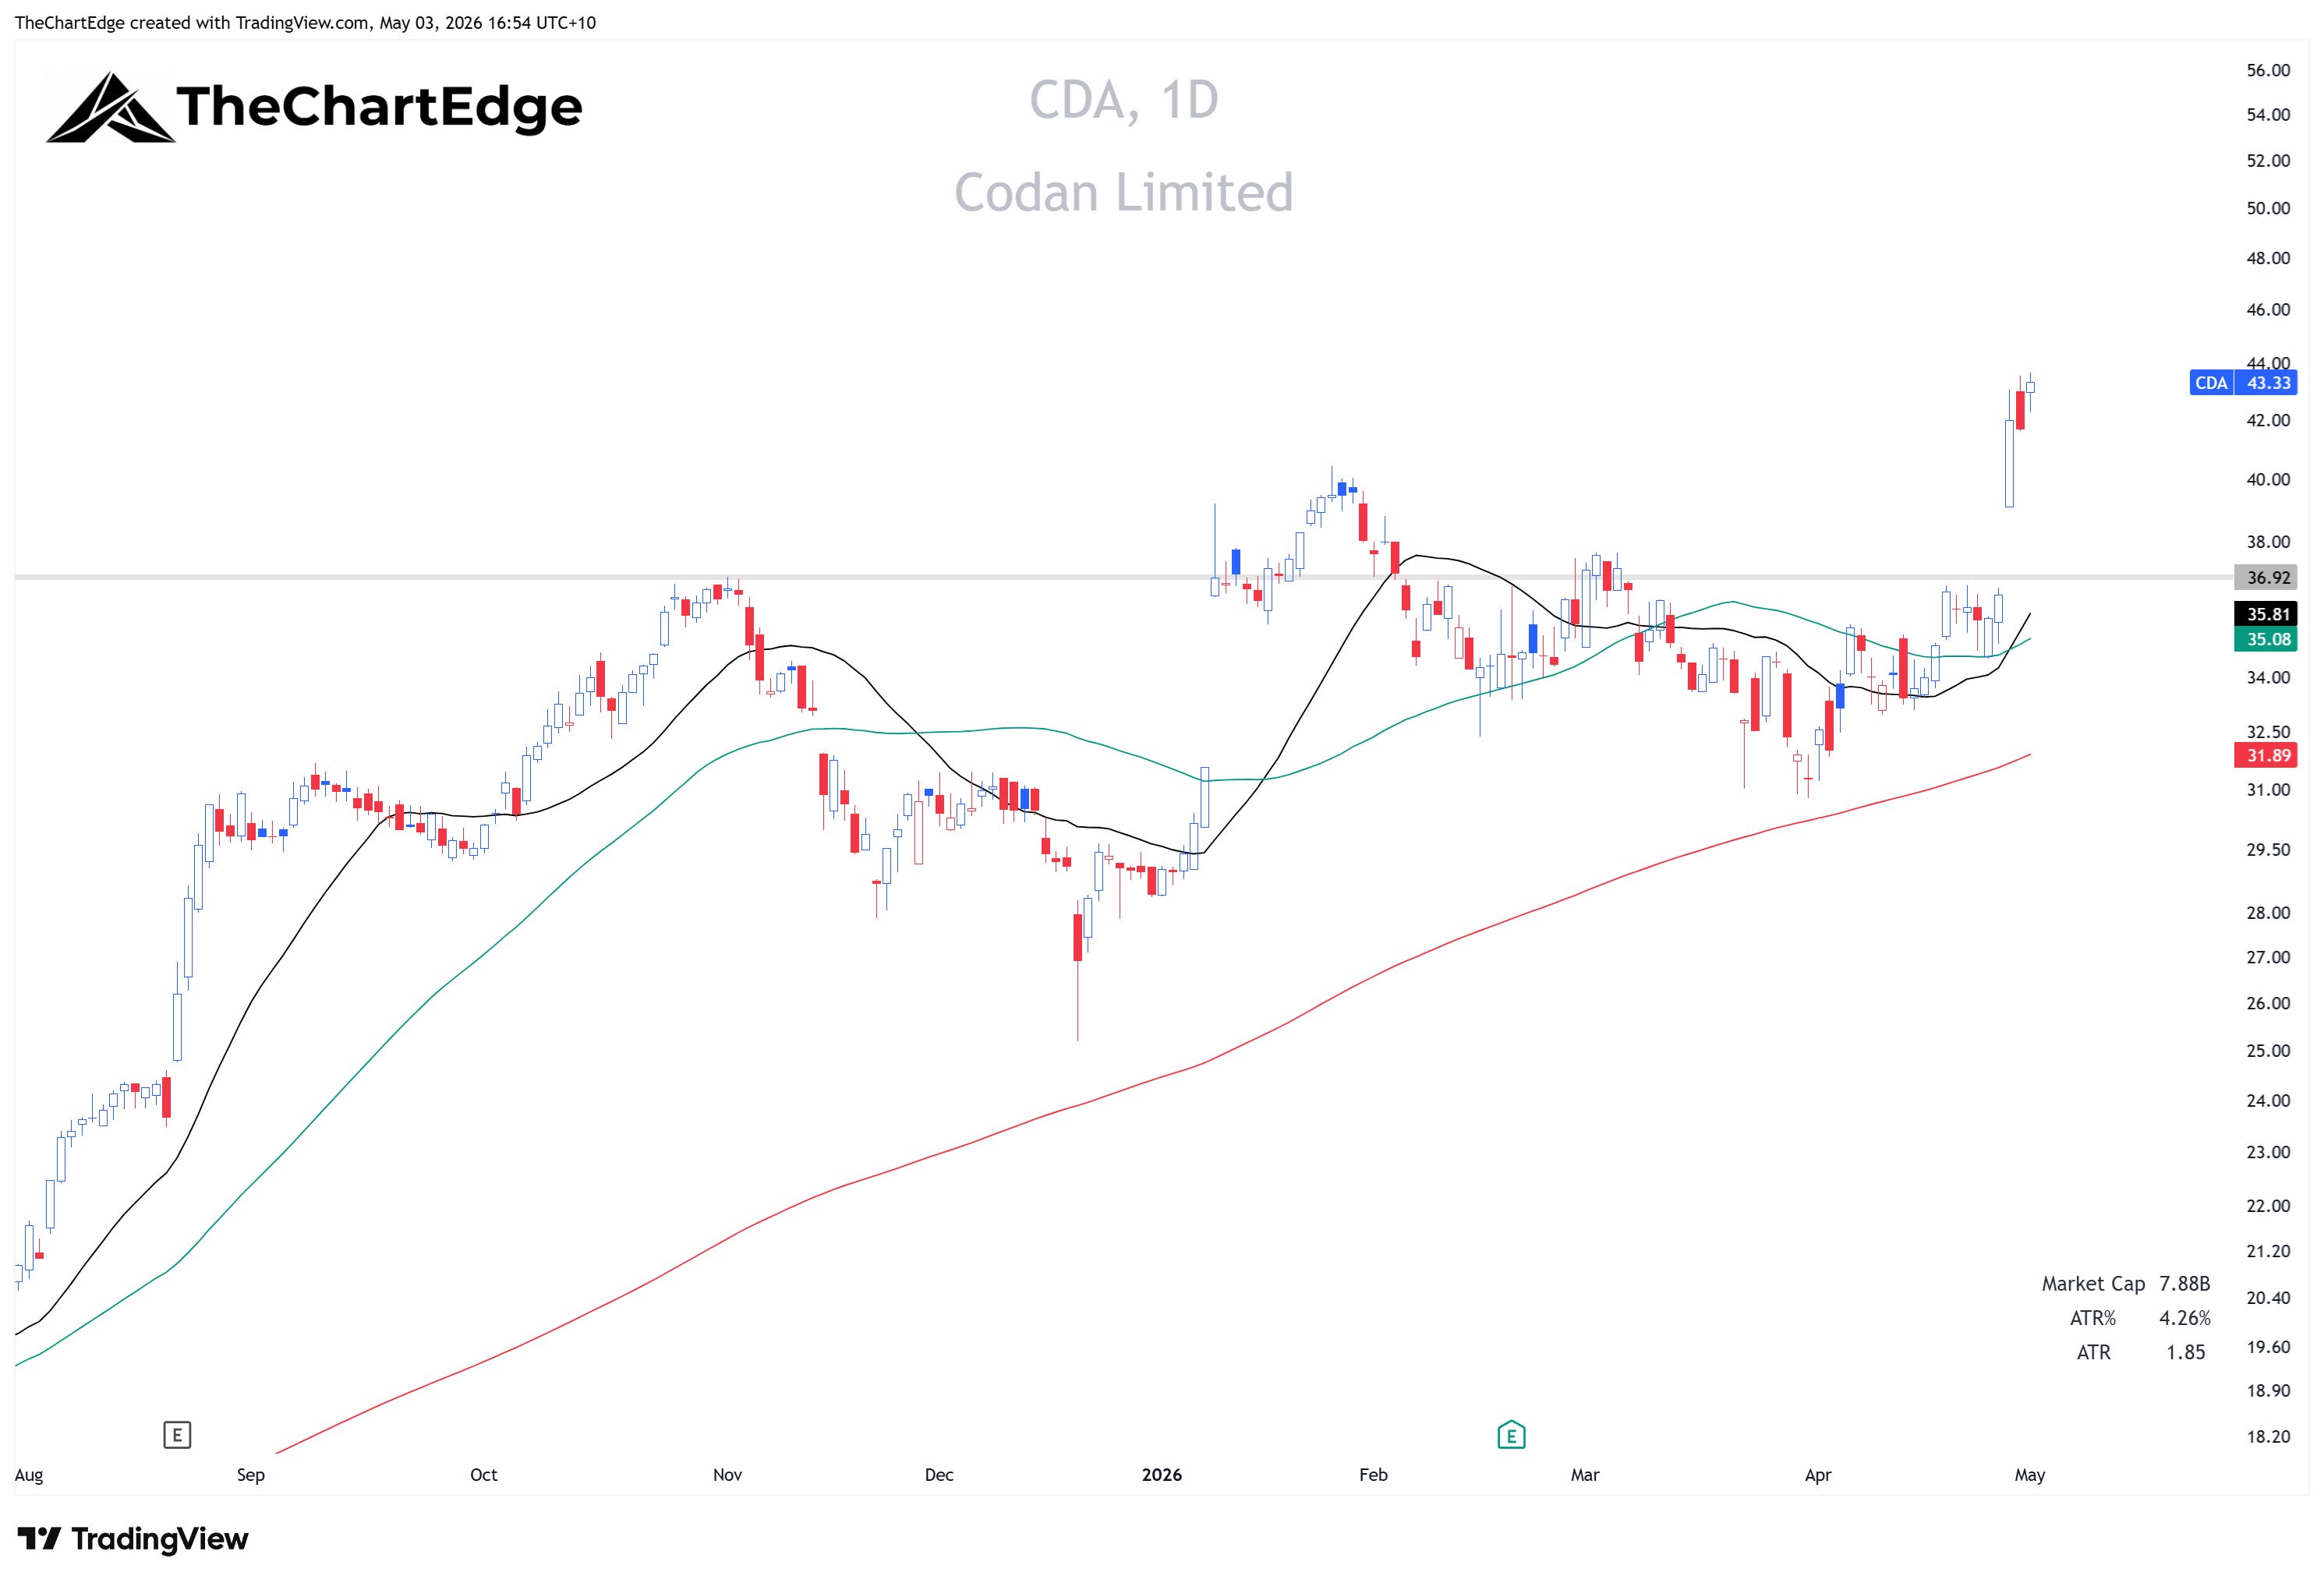
Codan Ltd (CDA) - Communications equipment and metal detection technology. Digital Infra & Hardware, Leading, Strong Uptrend. Up 21.6% last week. 21.0% above the 20-day SMA, 4.3% ATR, extension 4.9x. 0.7% from the 52-week high (-0.7% ATH). RSI 77. The RS acceleration is the strongest in the scan.
Extended - pullback watchlist.
ELS Chart
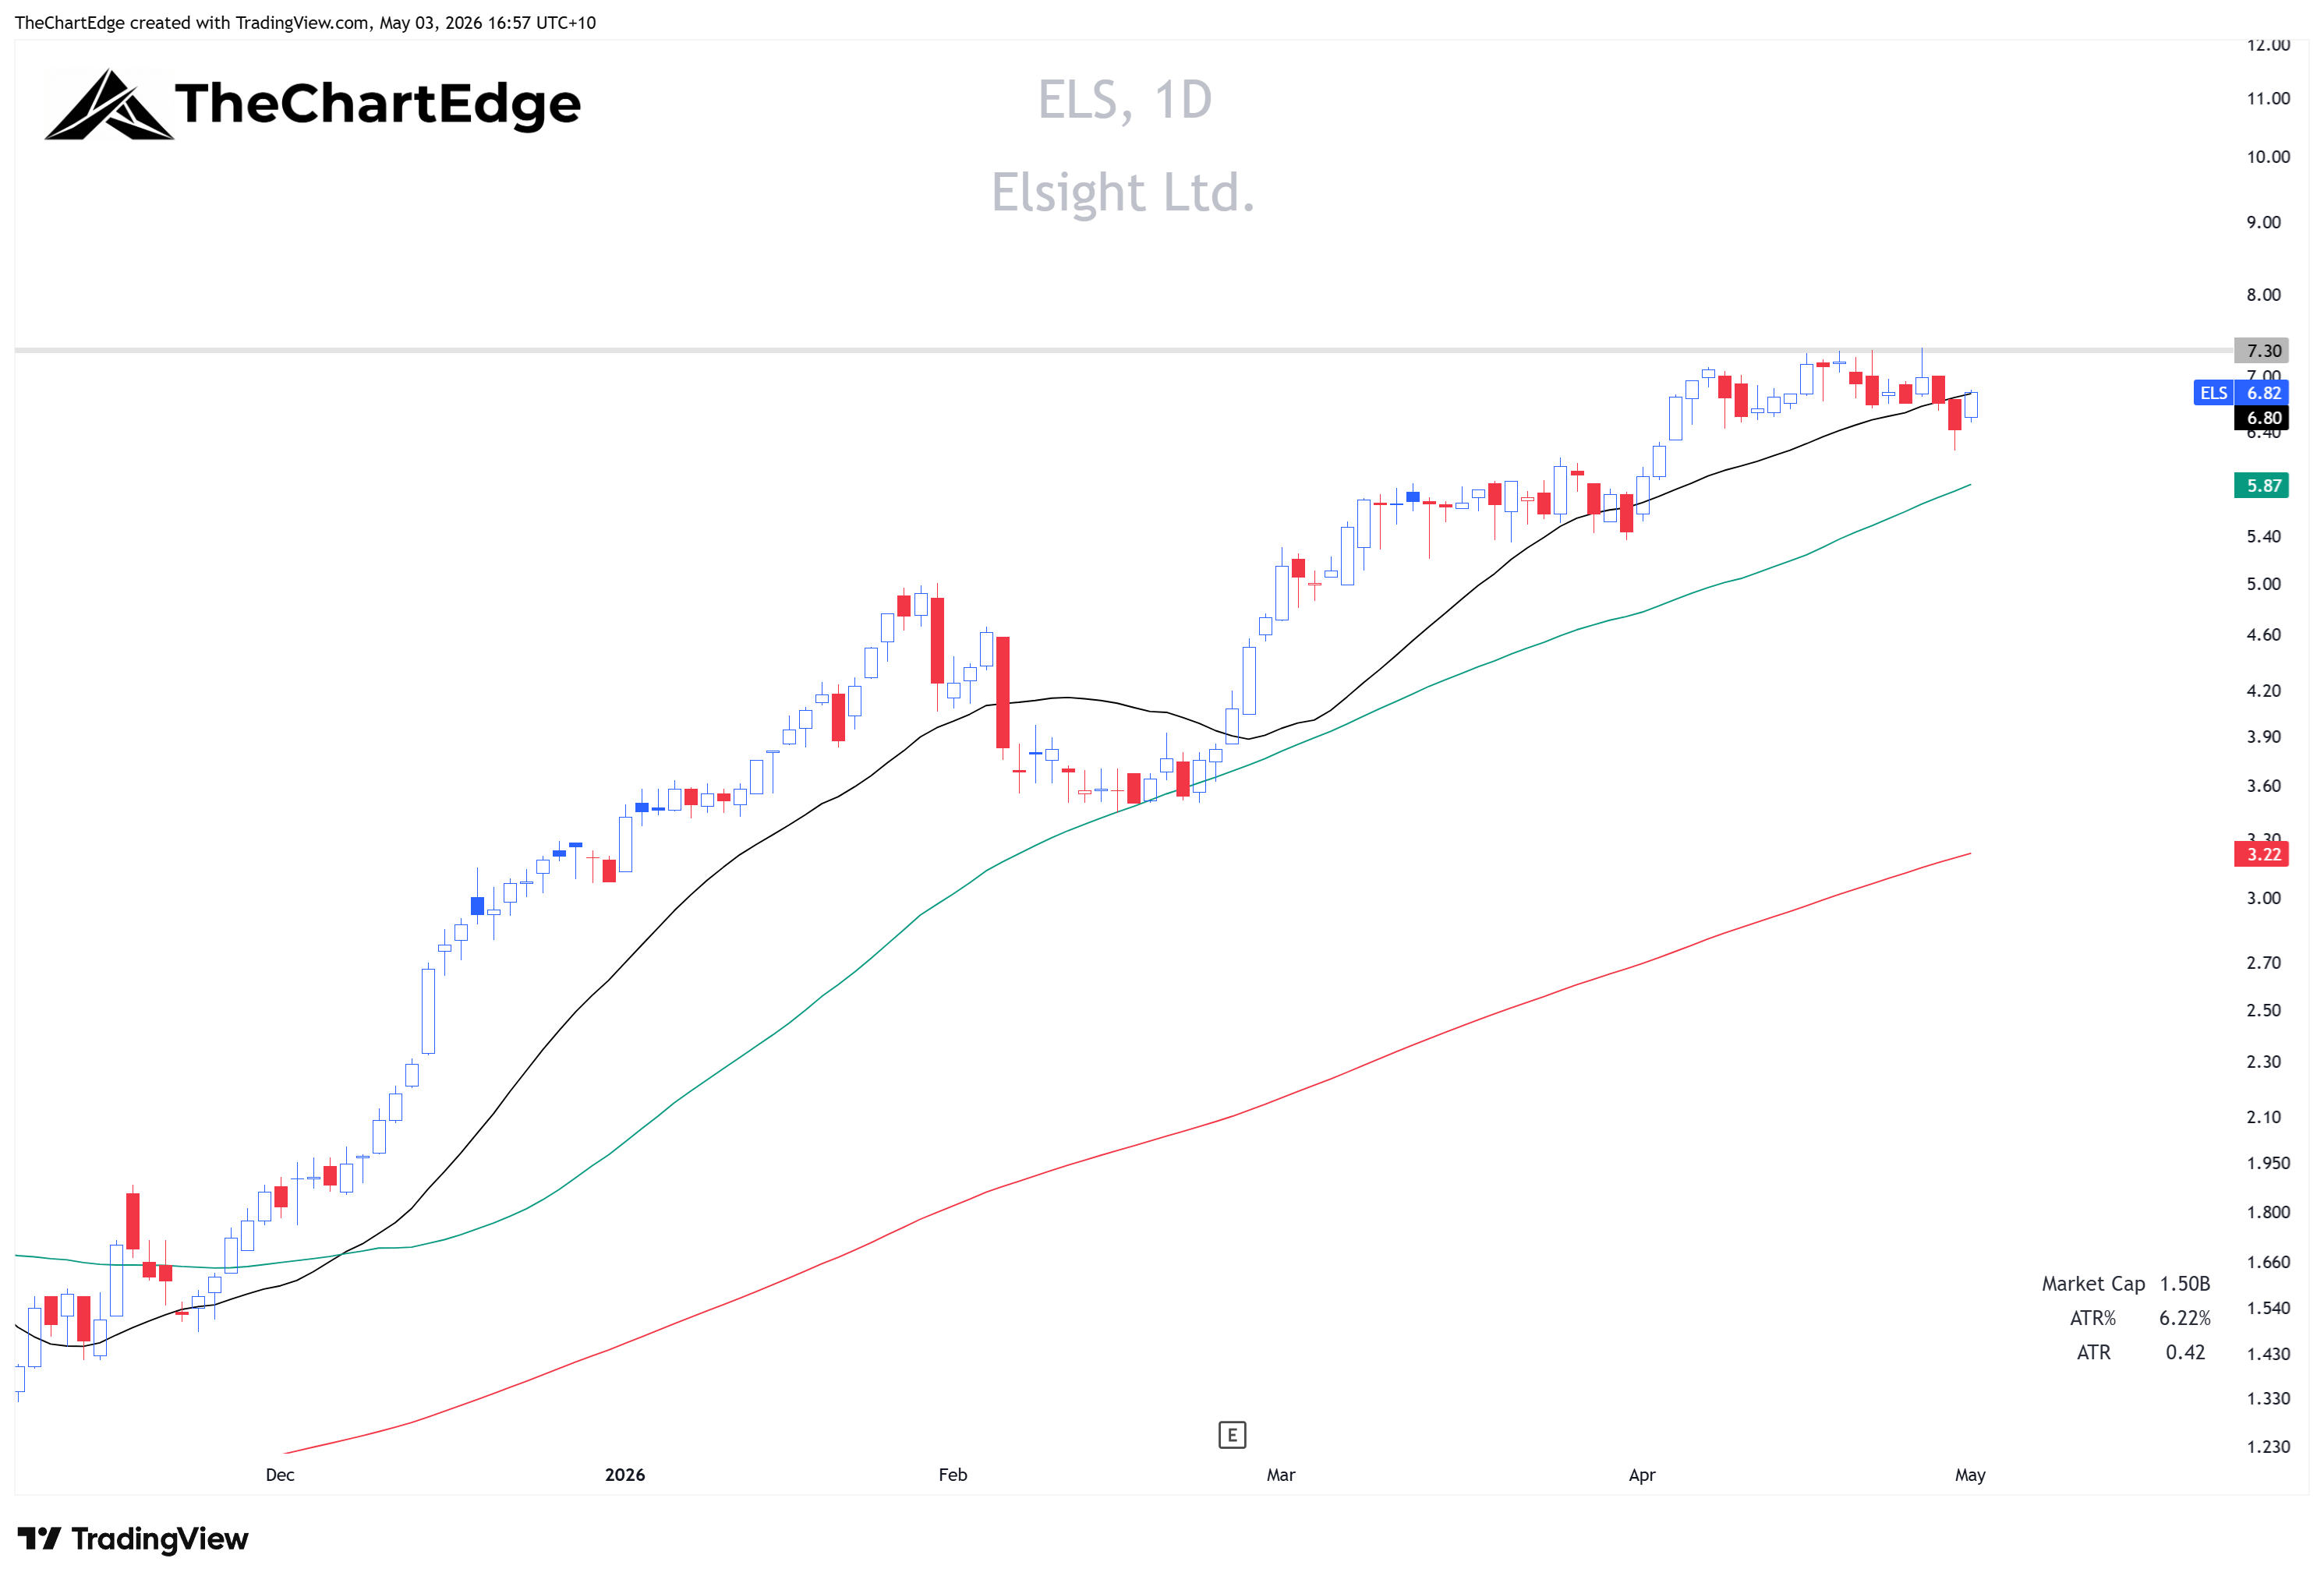
Elsight Ltd (ELS) - Connectivity solutions and drone communication technology. Digital Infra & Hardware, Weakening, Strong Uptrend. Flat last week. 0.3% above the 20-day SMA, 6.2% ATR, extension 0.0x. 7.0% from the 52-week high (-7.0% ATH). RSI 56.
Consolidating nicely - shakeout on Thursday the 30th of April. Could buy on strength on a clear 20-day SMA reclaim for the more aggressive or wait for all-time high breakout.
Food & Agriculture
CBO Chart
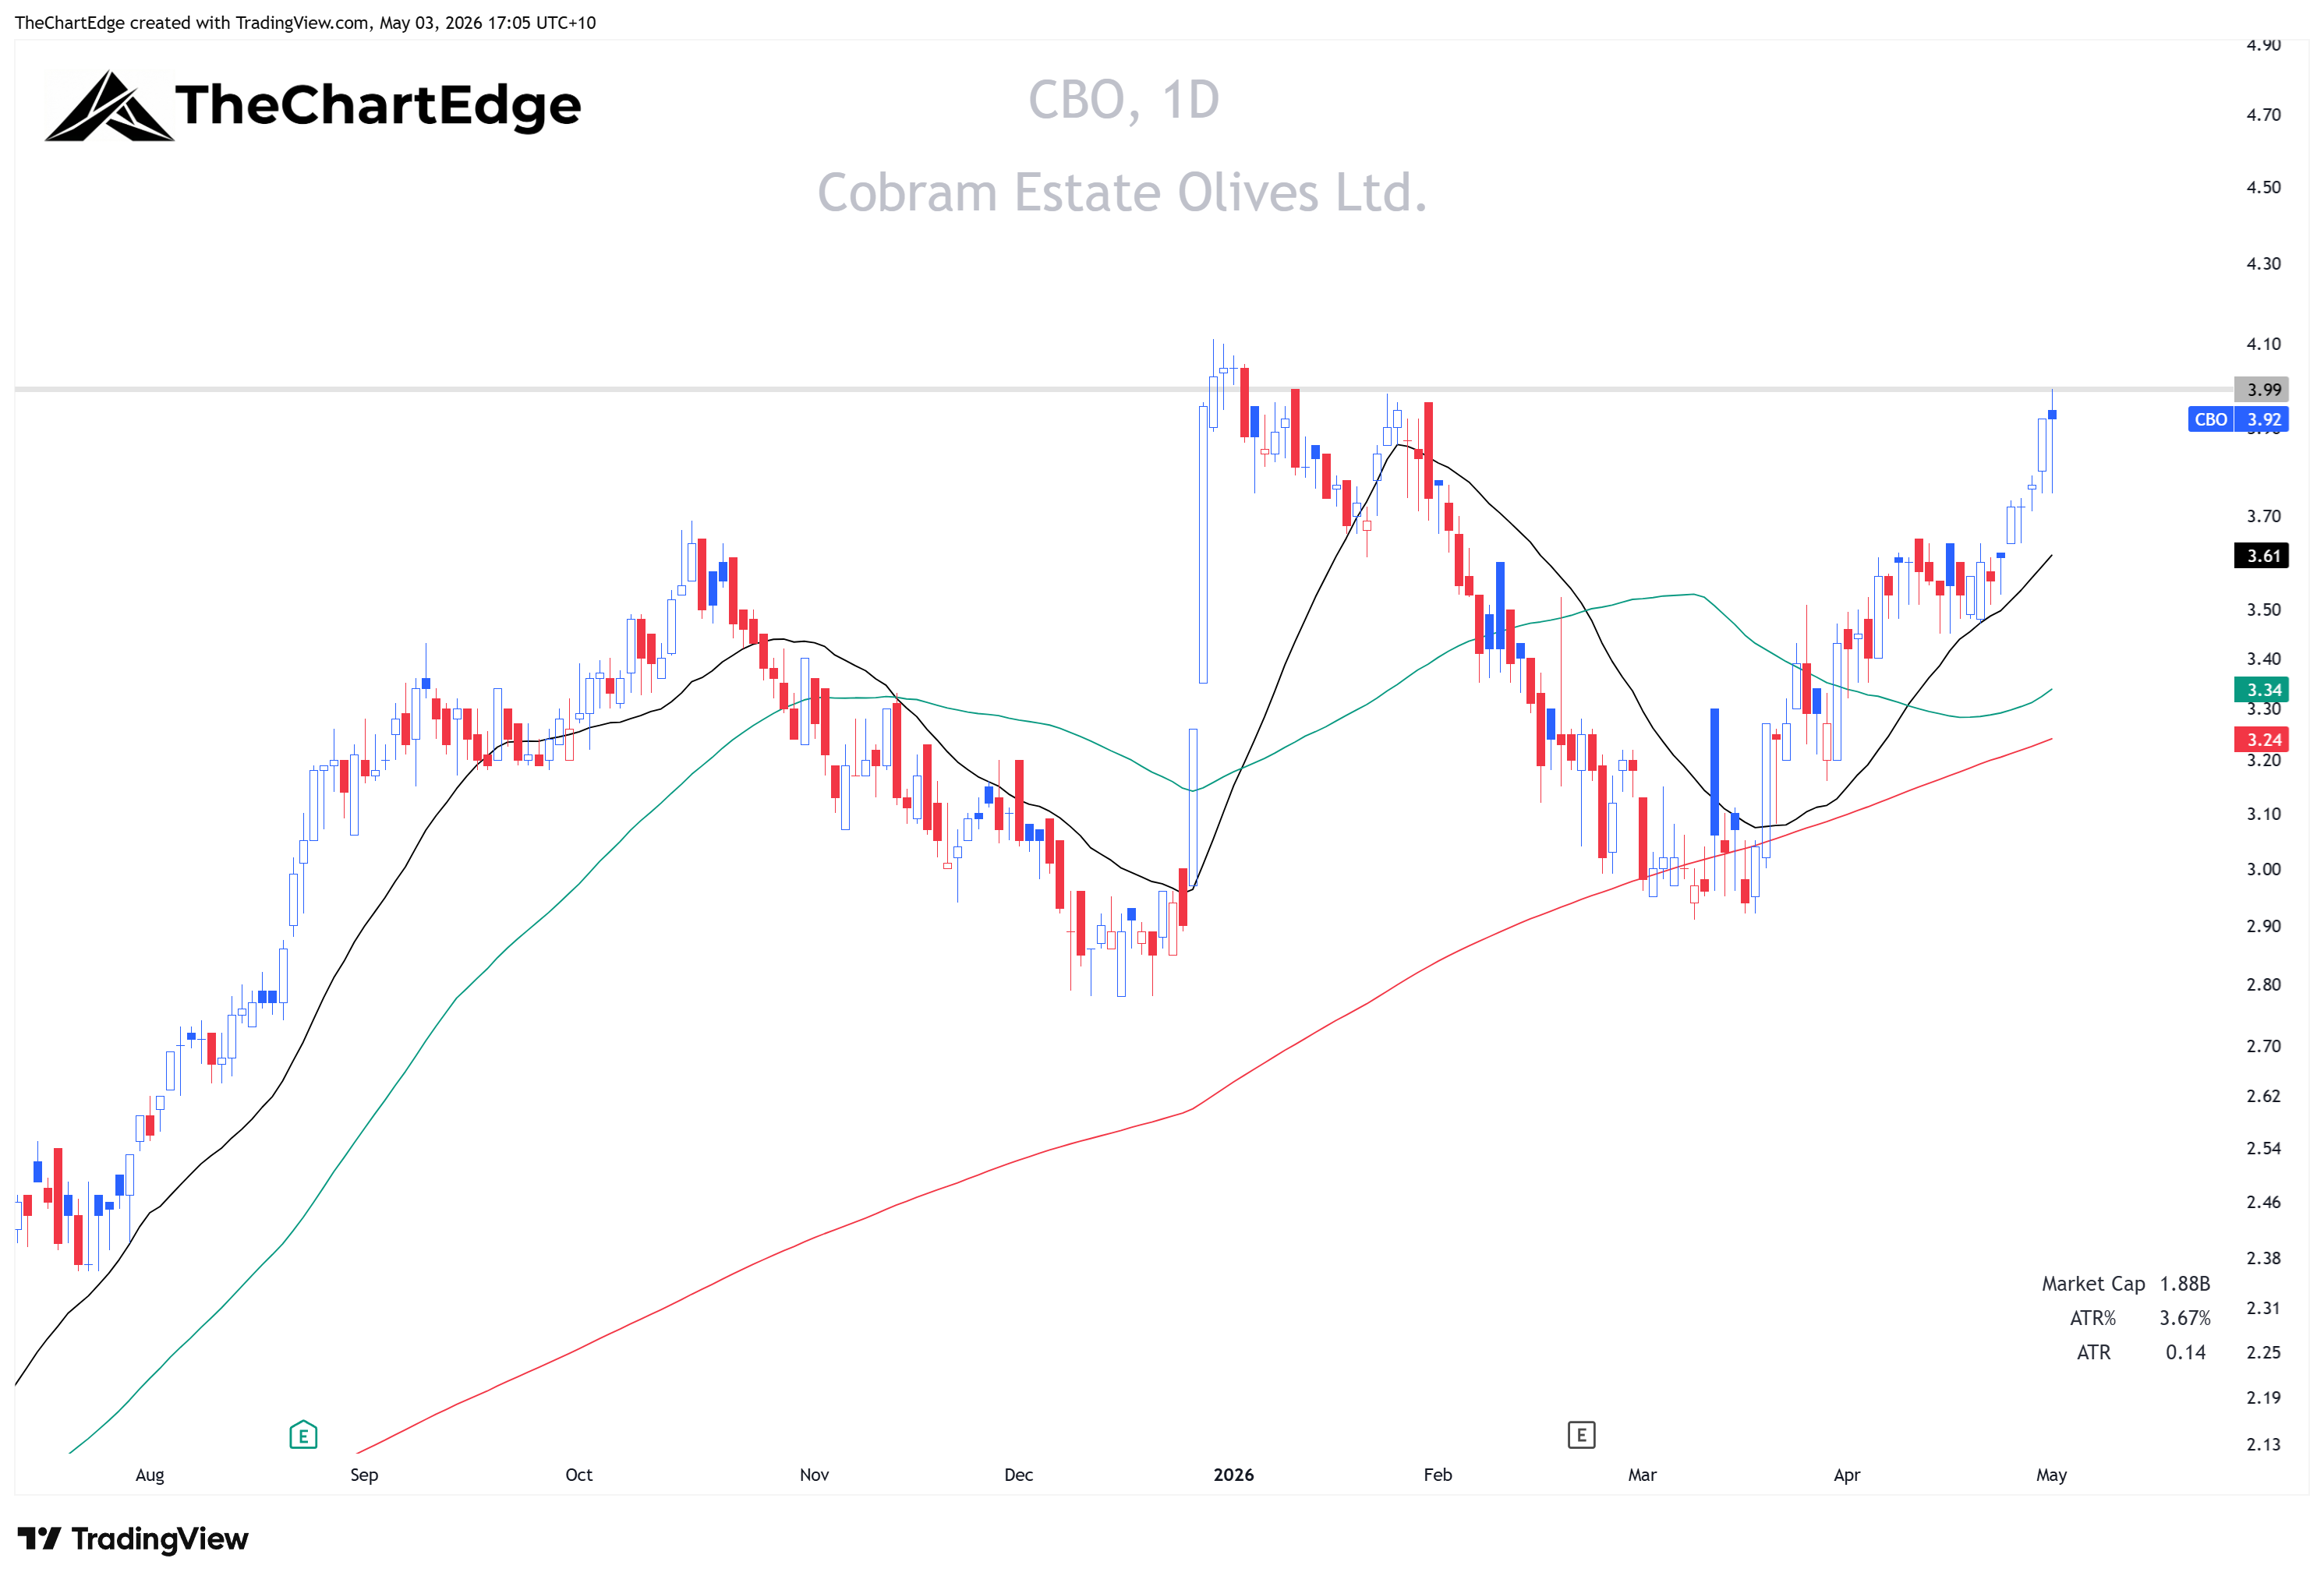
Cobram Estate Olives Ltd (CBO) - Olive oil producer. Food & Agriculture, Leading, Strong Uptrend. Up 8.6% last week. 8.5% above the 20-day SMA, 3.7% ATR, extension 2.3x. 4.6% from the 52-week high (-4.6% ATH). RSI 76.
If it forms a handle here under $4, could provide a low-risk entry.
Telco
SLC Chart
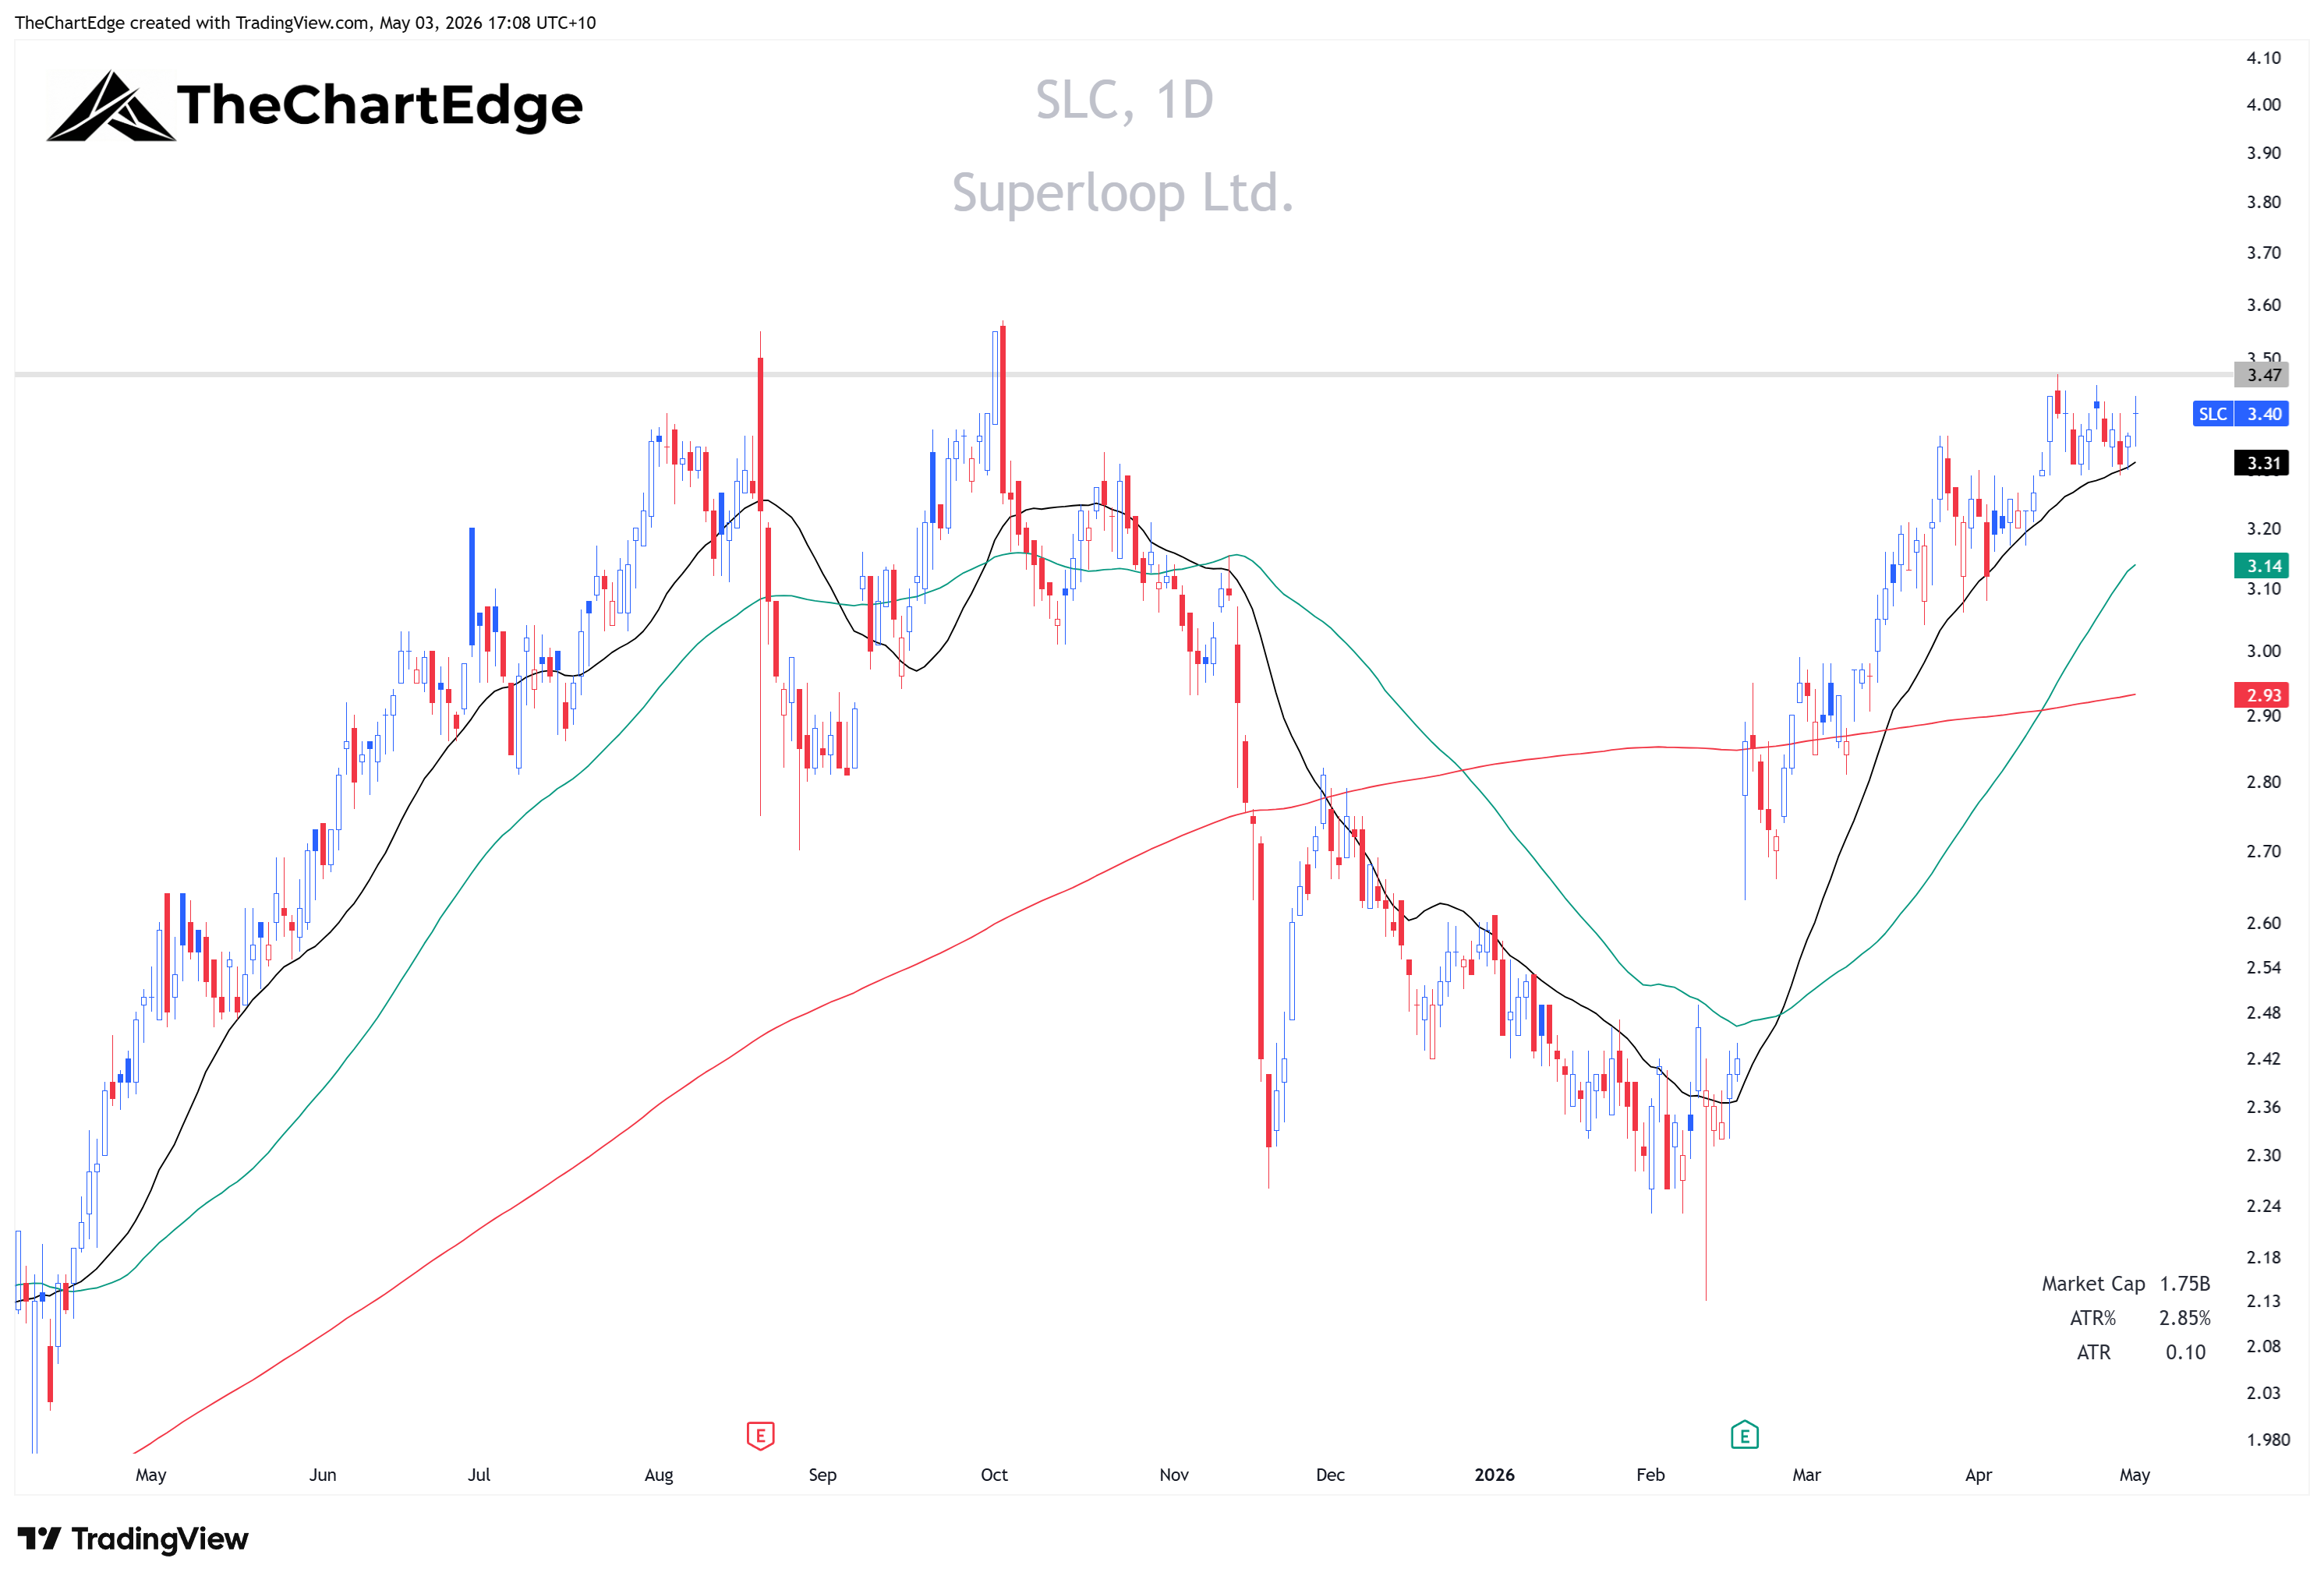
Superloop Ltd (SLC) - Fibre broadband and business connectivity. Telco, Leading, Strong Uptrend. Down 0.3% last week. 2.6% above the 20-day SMA, 2.9% ATR, extension 0.9x. 4.8% from the 52-week high (-4.8% ATH). RSI 61.
Consolidating nicely under all-time highs - on breakout watch.
What ties it together
Ten of the fifteen pass all scan criteria. Two (LTR and CDA) are extended after strong recent runs. Three (GGP, PDI, MI6) narrowly missed the proximity to 52-week highs threshold.
The resource and mining services theme dominates, which tells you something about where the ASX’s genuine relative strength lives right now. But the outliers - CBO, SLC, CDA, ELS - are arguably the more interesting stories precisely because their business models are independent of the commodity cycle that drives most of the other names on the list.
Stay open-minded and manage risk tightly.
Cheers,
Marcus Grant, CFTe
Disclaimer: The content provided in this newsletter is for informational and educational purposes only and should not be considered as financial, investment, or legal advice. The information shared is based on our research and analysis, but we are not a licensed financial advisor, nor can we guarantee its accuracy, completeness, or timeliness. Market conditions and financial instruments can change rapidly, and any opinions expressed may not be suitable for all investors. Any opinions expressed and or securities mentioned do not constitute a recommendation to buy, sell, or hold that or any other security. You should conduct your own due diligence and consult with a licensed financial advisor or other professional before making any investment decisions. Past performance is not indicative of future results, and all investments carry the risk of loss. The authors and publishers of this newsletter are not responsible for any financial decisions made based on the content provided herein. By reading and or subscribing to this newsletter, you acknowledge and agree that you are using the information at your own risk.